A Five Year Retrospective - U.S. Coast Guard
A Five Year Retrospective - U.S. Coast Guard
A Five Year Retrospective - U.S. Coast Guard

You also want an ePaper? Increase the reach of your titles
YUMPU automatically turns print PDFs into web optimized ePapers that Google loves.
TABLE OF CONTENTS<br />
Message from RADM Tedesco (CG -11)………………….. 1<br />
Aviation Safety (COMDT CG -1131)……………………… 2 – 4<br />
Shore & Sector Operational Safety (COMDT CG -1132)… 5 – 10<br />
Environmental Health (COMDT CG - 1133)…................... 11 – 14<br />
Afloat Safety (COMDT CG -1134)……………..………… 15 – 20<br />
USCG Safety Program Way Ahead………………………... 21 – 29<br />
Contact Information………………………………………... 30
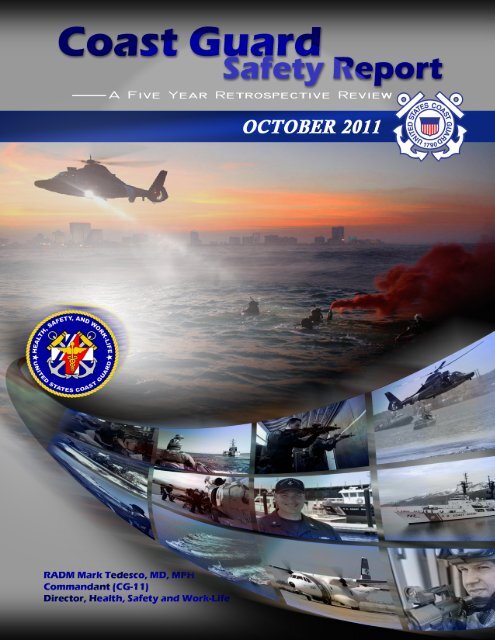
From the desk of the <strong>Coast</strong> <strong>Guard</strong> Safety Chief<br />
Fellow Shipmates –<br />
The <strong>Coast</strong> <strong>Guard</strong> is a dynamic and adaptive<br />
organization. After 9/11, our organization embarked<br />
on a significant course change that reinforced the<br />
national view that the <strong>Coast</strong> <strong>Guard</strong> is one of the most<br />
trusted agents in the fight against terrorism and as<br />
preeminent responders during times of need. With<br />
that change came a notable increase in both our on<br />
and off-duty mishaps, indicating that perhaps the<br />
changes were impacting our ability to detect hazards<br />
in our every day missions.<br />
Since I assumed the helm in 2007, we have worked<br />
tirelessly to reduce our mishap rates and I am pleased<br />
to report that we have made significant strides and<br />
that our mishap trends are headed in the right<br />
direction. Our greatest success story is in our off-duty<br />
mishap area, particularly motor vehicles and<br />
motorcycles. We have seen significant reductions in<br />
the cost of these mishaps to the organization, beyond<br />
the mishap rates, to include reduced hospital and lost<br />
duty time costs. Where we have seen upticks in our<br />
operational mishap rates, we have<br />
acted swiftly and purposefully – to great effect.<br />
In 2008, the <strong>Coast</strong> <strong>Guard</strong> began the journey to a greater culture of safety, whereby “safe” is<br />
simply how we do business. We are moving out on a number of fronts to a more proactive<br />
posture based on a close collaboration between our <strong>Coast</strong> <strong>Guard</strong> operators and the safety<br />
program. We are revamping our approach to operational risk management to meet the<br />
organizations diverse mission needs while developing tools, in close concert with the operators,<br />
to improve hazard identification ahead of and during mission execution.<br />
I look forward to ever-increasing engagement between all elements of the <strong>Coast</strong> <strong>Guard</strong> as we<br />
work more closely than ever to get out ahead of our mishaps by recognizing and reducing<br />
hazards. Semper Paratus.<br />
Mark J. Tedesco, MD, MPH<br />
Rear Admiral<br />
U.S. <strong>Coast</strong> <strong>Guard</strong><br />
1
AVIATION SAFETY<br />
2
120,000<br />
100,000<br />
80,000<br />
60,000<br />
40,000<br />
20,000<br />
0<br />
Aviation Mishap Rates FY01 – FY10<br />
2001 2002 2003 2004 2005 2006 2007 2008 2009 2010<br />
Figure 1 Mishap Rate Flight Hours<br />
Figure 1 compares the A,B,C,D flight mishap rate per 100,000 flight hours to annual flight hours.<br />
In the past several years flight hours per year have increased while the total number of mishaps<br />
has decreased leading to a steady mishap rate decrease. The 2003-2004 rate jump is attributed to<br />
increased reporting of Class “E” engine mishaps and MRM mishaps resulting from awareness<br />
campaigns. This graph projects an overall good picture for CG Aviation, but does not<br />
adequately depict current concerns with the Class “A” mishap rate (Figure 2).<br />
Figure 2<br />
Class A Aviation Mishaps FY56 – FY10<br />
3<br />
700<br />
600<br />
500<br />
400<br />
300<br />
200<br />
100<br />
0
Continued Class A Aviation Mishaps FY56 - FY10<br />
For the 27 years from FY-83 through FY-2009 <strong>Coast</strong> <strong>Guard</strong> Aviation averaged 1 Class A flight<br />
Mishap per fiscal year. The number of mishaps per year varied from zero to two. The mishaps<br />
were evenly distributed with nine years each of zero, one or two mishaps. This pattern ended in<br />
FY-10 when we experienced five Class “A” Flight Mishaps.<br />
The 6505 mishap in 2008 was the first fatal mishap since 1997; there were 6 non fatal Class A's<br />
during that time frame. 1982 was the last time there were more than 2 Class A mishaps in one<br />
year. Of the 32 Class A mishaps since then, 7 were fatal resulting in 34 deaths.<br />
Figure 3<br />
Flight Mishap Costs FY01 – FY10<br />
Figure 3 depicts the cost of the FY-10 Class A mishap spike. Over the last ten years the <strong>Coast</strong><br />
<strong>Guard</strong>’s flight mishap costs have been fairly stable with spikes created by Class A mishaps. The<br />
chart clearly shows how dramatically class A mishaps affect cost and the unprecedented cost of<br />
five class A flight mishaps in FY-10. In addition there were 3 Class B mishaps in FY-10; each<br />
of which had costs over one million dollars.<br />
4
SHORE AND SECTOR OPERATIONAL SAFETY DIVISION<br />
5
Summary of Sector and Shore Operations Mishaps (Including Sector sub-units)<br />
Fortunately, there were no shore-based operationally related (on-duty) deaths or permanent<br />
disability mishaps. However, there were numerous Class C’s and D’s. FY 2010 saw a slight<br />
decrease in total mishaps from FY 2009 including fewer Class C and Class D mishaps than had<br />
been experienced, on average, over the previous 5 years. Class C and D mishaps are generally<br />
thought to be leading indicators for more significant mishaps and should be examined to<br />
determine the root (underlying) causes so that they may be corrected.<br />
140<br />
120<br />
100<br />
80<br />
60<br />
40<br />
20<br />
0<br />
E1<br />
Figure 4<br />
E2<br />
E3<br />
E4<br />
E5<br />
Population data vs. Mishaps<br />
E6<br />
Population Data<br />
E7<br />
E8<br />
E9<br />
O1<br />
O2<br />
O3<br />
O4<br />
O5<br />
Ave Age Mishaps % of POP<br />
O6<br />
W2<br />
W3<br />
% Population<br />
W4<br />
1000<br />
100<br />
10<br />
1<br />
0.1<br />
0.01<br />
0.001<br />
Figure 4 displays population data (enlisted and officer personnel) compared to recorded mishaps.<br />
Age, rank and mishaps correlate; therefore a conclusion about our junior population and risk<br />
factors can be drawn. Commands should pay special attention to and stress the need for safety<br />
reinforcement within younger populations.<br />
6
Total Shore Mishaps and Lost Days vs. Off-duty Mishaps and Lost Days<br />
6000<br />
4000<br />
2000<br />
0<br />
Figure 5<br />
2003 2004 2005<br />
Lost<br />
Days<br />
2006 2007 2008 2009 2010<br />
All Shore Mishaps All Shore Lost Days<br />
Off Duty Mispaps Off Duty Lost Days<br />
Figure 5 notes the large percentage of Shore Lost Days that are attributable to off-duty mishaps.<br />
The <strong>Coast</strong> <strong>Guard</strong> as a whole has been experiencing more off-duty vice on-duty mishaps. In the<br />
future this can be an excellent opportunity to partner with MWR to evaluate and establish policy,<br />
procedures, and training and recreational safety awareness.<br />
1000<br />
900<br />
800<br />
700<br />
600<br />
500<br />
400<br />
300<br />
200<br />
100<br />
0<br />
Total vs. On/Off-Duty and PMV Mishaps<br />
Shore Mishap Summary<br />
2003 2004 2005 2006 2007 2008 2009 2010<br />
Total Shore Mishaps On Duty Off Duty<br />
MV On Duty MV Off Duty<br />
Figure 6<br />
Figure 6 summarizes Total Shore Mishaps versus On-duty/Off-duty and Private Motor Vehicle<br />
(PMV) statistics from 2003-2010. Off-duty Mishaps account for more than any other category<br />
and are just about double that of On-duty Mishaps.<br />
7
1200<br />
1000<br />
800<br />
600<br />
400<br />
200<br />
0<br />
Figure 7<br />
Total Shore Mishaps On-Duty vs. Off-Duty<br />
Shore Total Mishaps On vs. Off‐Duty<br />
2003 2004 2005<br />
2006 2007 2008 2009 2010<br />
All Shore Mishaps Off Duty Mispaps On Duty Mishaps<br />
Figure 7 shows that the majority of all Shore Mishaps occur Off-Duty versus On-Duty<br />
indicating, once again, that more emphasis needs to be placed on the <strong>Coast</strong> <strong>Guard</strong>’s Off-<br />
Duty/Recreational Safety Program.<br />
Likewise, this data indicates that the off-duty/recreational mishaps are not only more probable<br />
than the operational mishaps but that personnel may be taking more risks on their off-duty time<br />
than they would take while on-duty.<br />
Motor Vehicle Class A Mishaps Rates FY05 – FY11<br />
Rate of Mishaps per 100K<br />
employees<br />
100<br />
90<br />
80<br />
70<br />
60<br />
50<br />
40<br />
30<br />
20<br />
10<br />
0<br />
FY05 FY06 FY07 FY08 FY09 FY10 FY11<br />
Motorcycle (Weighted<br />
presuming 10% ride)<br />
Motorcycle (Unweighted)<br />
Private Motor Vehicle<br />
Figure 8<br />
Figure 8 shows in 2007, under the direction of RADM Tedesco (CG-11), the Office of Safety<br />
and Environmental Health began conducting in-depth mishap investigations on all off-duty Class<br />
A and B motor vehicle and motorcycle mishaps in addition to the on-duty mishaps to determine<br />
what the underlining causal factors were for the sudden spike in fatal mishaps. The motorcycle<br />
mishap investigations and analyses pointed to the primary causal factors of rate of speed and<br />
losing control, especially during turns.<br />
8
2500<br />
2000<br />
1500<br />
1000<br />
500<br />
0<br />
1385<br />
1242<br />
97<br />
Motorcycle Mishap Data FY 2005 – FY 2010<br />
1604<br />
1022<br />
2085<br />
1121<br />
1921<br />
1249<br />
199 159 172<br />
1344<br />
632<br />
1711<br />
650<br />
97 101<br />
2005 2006 2007 2008* 2009 2010<br />
*Note: July 2008 Motorcycle Training Funded<br />
Motor Cycle<br />
(MC) Fatalities<br />
Total MC<br />
Mishaps<br />
Personal Motor<br />
Vehicle (PMV)<br />
Fatalities<br />
Total PMV<br />
Mishaps<br />
Days Hospitalized<br />
Lost Work Days<br />
Days Restricted<br />
2005 2006 2007 2008 2009 2010 2011<br />
2 3 4 4 3 3 2<br />
95 104 101 129 118 93 89<br />
2<br />
5<br />
4<br />
6<br />
0<br />
4<br />
Figure 9<br />
202 263 255 248 288 267 213<br />
CG-11 looks at lost workdays due to motorcycle mishaps, hospitalizations, restricted duty days<br />
and the overall number of mishaps from any class that had been reported in addition to the<br />
number of Class A mishaps. The purpose is to get a clearer idea of how we are doing overall in<br />
motorcycle safety. As the chart shows, the <strong>Coast</strong> <strong>Guard</strong> has three or four motorcycle fatalities a<br />
year – the number of fatalities is small. The chart helps us understand trends based on other<br />
indicators besides just fatalities. At the time of publication, the <strong>Coast</strong> <strong>Guard</strong> experienced only 2<br />
Motorcycle fatalities in 2011.<br />
9<br />
2
30,000,000<br />
25,000,000<br />
20,000,000<br />
15,000,000<br />
10,000,000<br />
5,000,000<br />
Figure 10<br />
0<br />
Direct Cost to CG from Motor Cycle Mishaps FY05 – FY10<br />
Up 17% Up 18%<br />
Up 9% *<br />
Down 39%<br />
Up 20%<br />
FY‐05 FY‐06 FY‐07 FY‐08 FY‐09 FY‐10 Total<br />
Overall, the <strong>Coast</strong> <strong>Guard</strong> is seeing positive trends. CG-1132 uses DoD cost figures to calculate<br />
costs of fatalities, permanent disability, etc. Compared to two years ago, the total costs due to<br />
motorcycle mishaps are down.<br />
Traffic Safety FY2010<br />
The <strong>Coast</strong> <strong>Guard</strong> has implemented a number of initiatives.<br />
1. The “Don’t Let Your GUARD Down” is nationwide safety campaign that originated in<br />
the Atlantic Area a few years ago. The campaign’s name is a play on words and is meant<br />
to work as a personal reminder as well as an altruistic one. This campaign has developed<br />
targeted programs for all personnel, so that leadership and junior personnel alike can<br />
ensure safety becomes an ingrained part of their life, on and off work, twenty-four/seven.<br />
2. Motorcycle Safety Training reimbursement program for basic and advanced rider<br />
courses.<br />
3. Motorcycle training at <strong>Coast</strong> <strong>Guard</strong> installations. There are now eight motorcycle<br />
training sites. The training sites are open to DoD personnel just as DoD sites are open to<br />
train <strong>Coast</strong> <strong>Guard</strong> personnel.<br />
4. Texting While Driving General Order that created new policy for personnel who operate<br />
government vehicles and/or use government issued devices (e.g., phones and personal<br />
digital assistants).<br />
5. Personal Protective Equipment General Order. In early 2007, when RADM Tedesco<br />
came on board, the <strong>Coast</strong> <strong>Guard</strong> had three fatalities in a row that were avoidable if the<br />
individual had used his/her motorcycle helmet or seat belt. Admiral Allen, the <strong>Coast</strong><br />
<strong>Guard</strong> Commandant at the time, issued a General Order requiring members to wear a<br />
seatbelt and a motorcycle helmet at all times regardless of lesser civilian restrictions. The<br />
General Order provided leadership with a tool for enforcing <strong>Coast</strong> <strong>Guard</strong> policy. On<br />
August 10, 2011, this General Order was reissued by Admiral Papp. Since the General<br />
Order was first published and emphasized, the CG has experienced only 1 fatality due to<br />
failure to wear PPE.<br />
10
ENVIRONMENTAL HEALTH<br />
11
Occupational Medicine Program<br />
OMSEP Evaluation/ EHR Implementation<br />
CG-1133 has spearheaded a rework of the Occupational Medical Surveillance Evaluation<br />
Program (OMSEP) into an improved and more informative tool for medical personnel as well as<br />
operators to evaluate the readiness of our workforce. The new version of OMSEP will include<br />
better reporting configuration as well as an alignment with the roll out of the new electronic<br />
health record or EHR. This will assist CG-1133 in our pursuit of quantitative results that will<br />
drive our programs based on where our greatest risks lie.<br />
Environmental Health & Sanitation Program<br />
Centers for Disease Control / <strong>Coast</strong> <strong>Guard</strong><br />
CG-1133 transitioned the <strong>Coast</strong> <strong>Guard</strong> to adhere to the new International Health Regulations<br />
involving required inspections of our <strong>Coast</strong> <strong>Guard</strong> cutters prior to embarkation to overseas ports.<br />
CG-1133 obtained <strong>Coast</strong> <strong>Guard</strong> compliance with these international regulations from the CDC<br />
and is promulgating them throughout the cutter force. This has resulted in better <strong>Coast</strong> <strong>Guard</strong><br />
preparedness and compliance with the latest international standards. A new <strong>Coast</strong> <strong>Guard</strong><br />
Instruction addressing compliance with this Memorandum of Agreement (MOA) is under draft<br />
review.<br />
Industrial Hygiene<br />
Ionizing Radiation<br />
In FY 2010, the Department of Homeland Security’s Management Directorate, under the<br />
Occupational Safety and Health Manager, established a Departmental Radiation Safety Office.<br />
One of the continued directives issued to the components is a comprehensive inventory of any<br />
radiation sources that require an NRC-license. Even though all of the radiation sources managed<br />
by the <strong>Coast</strong> <strong>Guard</strong> are operated under the manufacturer’s license of particular equipment,<br />
inclusion into the DHS radiation source inventory is still mandated.<br />
Non-Ionizing Radiation<br />
In coordination with CG-1131, a CG Laser System Safety Instruction was developed. With the<br />
advent of laser range finders on-board vessel and aviation assets, the need to credential these<br />
systems prior to use is extremely important.<br />
Pandemic Influenza Preparedness – Personal Protective Equipment (PPE)<br />
CG-1133, provided oversight in the purchase, storage, assembly and distribution of 2078<br />
Personal Protective Equipment (PPE) Push Packs to 791 units. PPE includes facemasks,<br />
respirators, gloves, goggles, garments and hand gel. A Push Pack is a box or container that holds<br />
PPE for 5 personnel to use for 30 days. 27 Push Packs were also forward deployed for use<br />
during Haiti operations.<br />
To create efficiencies in the logistics management process for the 2009/2010 H1N1 pandemic flu<br />
as well as other communicable disease threats/outbreaks and realizing that PPE acquisition and<br />
distribution was more appropriately handled outside of CG-1133, a PPE product line is being<br />
12
created. Working with CG 4-Asset Project Office in Baltimore, under direction of Commandant<br />
(CG-113) memo 6260 of September 1, 2009, a PPE product line was established. Subsequently,<br />
the contract with TSSI for storage, build, and distribution of PPE push packs was terminated and<br />
all PPE materials including assembled push packs were moved to the ALC warehouse.<br />
Lead<br />
Lead-based paint was used in pre-1978 buildings and several of these buildings are occupied by<br />
<strong>Coast</strong> <strong>Guard</strong> personnel and their family members. Traditionally, management of lead hazards in<br />
these buildings has included inspection, risk assessment and abatement of the hazards. Per<br />
USEPA and HUD regulations and as part of the management of lead hazard in <strong>Coast</strong> <strong>Guard</strong><br />
controlled housing, occupants of the housing units are provided informational pamphlets on<br />
management of lead hazards. Additionally, lead inspectors and risk assessors are individually<br />
certified in order to perform their duties. While firms that conduct lead abatement were required<br />
to be certified, certification of federal agencies were not required. In April 2008, USEPA<br />
published a new regulation which impacts the management of lead-based paints in <strong>Coast</strong> <strong>Guard</strong><br />
controlled housing. Specifically, the regulation requires federal agencies whose personnel<br />
conduct lead renovation to be: (a) certified and (b) use certified lead renovators. CG-1133<br />
released an ALCOAST to disseminate the information to various CG operations on the new<br />
requirements. Although a majority of lead abatement and renovation work is contracted out,<br />
some renovations are conducted by CG personnel, necessitating the need to have certified<br />
renovators. To accomplish this, CG-1133 worked with CG-1223 (Housing) to provide training<br />
funds for certification of CG personnel.<br />
Respiratory Protection – Awareness Training<br />
Part of the respiratory protection program under COMDTINST M6260.2D and OSHA under 29<br />
CFR1934 is training of all personnel required to wear respiratory protection while performing<br />
their duties. The training is conducted in two parts with the first part providing general<br />
information and second part to include selection and fit testing of chosen respirator. The training<br />
is required annually or anytime there is a change in facial structure of personnel wearing the<br />
respirator. In order to accomplish the 1 st part of the training, FC-51 working with CG-1133<br />
developed an online respiratory protection course which was placed on the CG learning portal.<br />
The second part of the training, which is a “hands-on” approach, is provided at the Unit Safety<br />
training classes and at respective units.<br />
Industrial Hygiene (IH) Database<br />
In order to increase efficiency in tracking exposures to hazards from CG operations, it is<br />
necessary to document the exposure’s controls are in place. Documentation of exposures allows<br />
us to prescribe the right controls. In the past, there has been no central repository; exposure<br />
records have been documented and maintained by individual units in no formal structure. In an<br />
effort to standardize collection and documentation of exposure data, CG-1133 worked with OSC<br />
to source a Commercial Off the Shelf (COTS) data system that can be used for management of<br />
Industrial Hygiene data. CG-1133 is working with CG-112 to determine if other databases such<br />
as “ImageNow”, which CG already has a license for, can be configured to capture IH data.<br />
13
<strong>Coast</strong> <strong>Guard</strong> DSF Stem to Stern Review<br />
The <strong>Coast</strong> <strong>Guard</strong>, by direction of the Commandant, has embarked upon a stem to stern review of<br />
all Deployable Special Forces (DSF). CG-1133 and CG-112 have participated in weekly<br />
meetings and updates that will ultimately provide a road map for the way ahead for DSF. This<br />
evaluation is a major evolution for the <strong>Coast</strong> <strong>Guard</strong> and safety is playing in integral role and will<br />
have input threaded through the entire cycle of this review.<br />
14
AFLOAT SAFETY<br />
15
Total Small Boat Op Hours<br />
540000<br />
520000<br />
500000<br />
480000<br />
460000<br />
440000<br />
420000<br />
Figure 11<br />
Small Boat Mishap Rate FY01 – FY10<br />
2001 2002 2003 2004 2005 2006 2007 2008 2009 2010<br />
Total Small Boat OpHours: Total Mishap Rate<br />
Boat related mishap rates fell in FY10 (See Figure 11) and have steadily declined since 2007.<br />
Collisions and groundings mishap rates have declined, although statistically low per the number<br />
of total annual boat hours, remain the highest reported boat mishaps. Post 9/11, mishap rates<br />
increased due to Ports, Waterways, and <strong>Coast</strong>al Security mission demand, new boat types, and<br />
associated training. The reporting of operational mishaps is the best means of sharing lessons<br />
learned to prevent future mishaps as well as identifying any engineering deficiencies.<br />
Figure 12<br />
Small Boat Ejection Rate FY06 – FY10<br />
14<br />
12<br />
10<br />
8<br />
6<br />
4<br />
2<br />
0<br />
2006 2007 2008 2009 2010<br />
Small Boat Ejection Totals 13 11 8 11 4<br />
Small Boat Ejection Rates 2.57 2.26 1.54 2.08 0.76<br />
16<br />
140<br />
120<br />
100<br />
80<br />
60<br />
40<br />
20<br />
0<br />
3.00<br />
2.50<br />
2.00<br />
1.50<br />
1.00<br />
0.50<br />
0.00<br />
Mishap Rate per 100,000 Op Hours
Continued Small Boat Ejection Rate FY06 - FY10<br />
Boat ejection mishap rates (See Figure 12) decreased 33% from 2009 to 2010. The 2010<br />
ejections involved 02 Cutter Boat Medium (CBM), 01 Defender Class (RBS), and 01 TPSB).<br />
The Chief, Office of Boat Forces, CG-731, sent an article titled “Coxswains: Cause for Action!”<br />
in June of 09, to the Master Chief and Gold Badges of the <strong>Coast</strong> <strong>Guard</strong> and identified human<br />
error as the major cause of ejections. It called for units to tighten up the qualifications for<br />
coxswains and hold them responsible for their actions. Reported ejections are discussed at our<br />
weekly Boat Forces Tri-Partite meetings.<br />
Figure 13<br />
480000<br />
460000<br />
440000<br />
420000<br />
400000<br />
380000<br />
360000<br />
340000<br />
Cutter Mishap Rate FY01 – FY10<br />
2001 2002 2003 2004 2005 2006 2007 2008 2009 2010<br />
Total Cutter Ophours Total Mishap Rate<br />
Cutter mishap rates have declined in FY10 (See Figure 13). Operational hours for cutters<br />
increased slightly in 2010 and the Total Mishap Rate decreased. This decrease is the result of<br />
fewer injuries resulting from slip, trip and falls during Maintenance and Repair periods. This is<br />
the result of a greater awareness to the hazards associated with maintenance periods. To bring<br />
our threshold limits for reporting mishaps more in-line with DOD, we issued ALCOAST 590/10.<br />
It revised cost threshold limit values for all classes of mishaps and, requires that all fires be<br />
reported via preliminary message within 12 hours with no minimum property value and all<br />
operational Class C, D, and E mishaps be reported within 5 days to the appropriate CG-113<br />
division. These new threshold limits should be reflected in unit pre-mishap plan.<br />
17<br />
90<br />
80<br />
70<br />
60<br />
50<br />
40<br />
30<br />
20<br />
10<br />
0
50<br />
45<br />
40<br />
35<br />
30<br />
25<br />
20<br />
15<br />
10<br />
5<br />
0<br />
Figure 14<br />
Cutter Mishap Rate FY06 – FY10<br />
Shipboard Fire Rate<br />
2001 2002 2003 2004 2005 2006 2007 2008 2009 2010<br />
Fiscal <strong>Year</strong><br />
Number of Fires Mishap rate<br />
The CGC GALLATIN Class “C” HIPO Final Summary Message (R 291917Z NOV 10), alerted<br />
the fleet of the fire hazards associated with shipyard availability and recommended actions to<br />
mitigate those fire hazards and improve the fire program. ALCOAST 590/10 requires that all<br />
fires onboard cutters be reported via preliminary message to the fleet within 12 hours regardless<br />
of cost. This new reporting requirement has increased the awareness of fires that are occurring<br />
onboard our cutters and the corrective action being taken to prevent them from reoccurring. Unit<br />
input is important as we are using the fire data in FY10 to document the frequency of fires<br />
onboard our aging fleet. These reported fires are discussed at our weekly Cutter Forces<br />
Tripartite meetings.<br />
18<br />
12.00<br />
10.00<br />
8.00<br />
6.00<br />
4.00<br />
2.00<br />
0.00
BACKGROUND:<br />
TEAM COORDINATION TRAINING (TCT)<br />
The TCT training program increases team effectiveness and minimize human error in<br />
cutter, boat and command / control operations and activities. It serves the Active Duty, Reserve<br />
and Auxiliary community in accordance with COMDTINST 1541.1. TCT training is a biennial<br />
requirement (two years). If more than 24 months have elapsed since the last TCT initial or<br />
refresher course, then initial training must be repeated.<br />
Initial training (16 hours) can be satisfied with the successful completion of: POPS Afloat<br />
School, OIC/PXO School, Coxswain C-School, Heavy Weather Coxswain School, MLB<br />
Coxswain School, and BM-A School, TCT Bridge Resource Management Course, or the TCT<br />
Correspondence course.<br />
The TCT program is composed of TCT Facilitators, TCT District Administrators and the<br />
Training Quota Management Center (TQC). Operational units request TCT Unit Level training<br />
through their respective District Administrator who will then assign a facilitator and forwards the<br />
facilitators name to TQC for orders. Personnel interested in facilitating TCT training should<br />
contact their respective District Administrator (see below). Active Duty, Reservists, Auxiliarists,<br />
and Civilians are all eligible to train as TCT Facilitators but priority will be given to personnel<br />
with an operational background. In order to become a TCT Facilitator, members must have<br />
attended a TCT course or completed the TCT Correspondence course (G0648). They then must<br />
complete the TCT Facilitator course (#500688) and be evaluated instructing at least two TCT<br />
Unit Level classes to become a certified facilitator.<br />
UPDATE:<br />
The TCT Cutter OPS course (500686) has recently been renamed the TCT/Bridge<br />
Resource Management Course and quotas are now managed by CG-751. This training is<br />
recommended for all Cutter Operations Officers and Operations Petty Officers of cutters 65 ft in<br />
length or greater. Students should be slated for the operations position, but it is not required.<br />
The number of Active Duty, Reserve, and Auxiliarists receiving exportable, TCT Unit-<br />
Level Training was approximately 10,607 for FY10.<br />
19
Current District TCT Administrators and AREA Training Teams<br />
(including work phone numbers) are listed below for reference:<br />
District Administrator Email Work Phone Fax<br />
D1 DPA CWO Manny Zambrana Emmanual.Zambrana@uscg.mil (212) 668-7992 (212) 668-7975<br />
D5 DPA-SR CWO Tim Luton Timothy.M.Luton@uscg.mil (757) 398-6509 (757) 398-6203<br />
D5 DPA-NR CWO Sean McGarigal Sean.McGarigal@uscg.mil (215) 271-4934 (215) 271-4968<br />
D7 DPA CWO Ursula Walther Ursula.W.Walther@uscg.mil (305) 415-7053 (305) 415-7059<br />
D8 DPA CWO Jim Todd James.A.Todd@uscg.mil (504) 671-2142 (504) 671-2146<br />
D9 DRMC LCDR Dave Uhl David.J.Uhl@uscg.mil (216) 902-6385 (216) 902-6044<br />
D11 DRM BMCS Stephen Barr Stephen.L.Barr@uscg.mil (510) 437-5323 (510) 437-3223<br />
D13 DR Jeanette Wells tesseract1@juno.com (253) 891-0620 (253) 891-0620<br />
D14 DPA CWO Ryan O’Meara Ryan.W.Omeara@uscg.mil (808) 535-3432 (808) 535-3439<br />
D17 DPI Mr. Mike Folkerts Michael.R.Folkerts@uscg.mil (907) 463-2297 (907) 463-2273<br />
LANT TRATEAM DCC Josh Zirbes Josh.J.Zirbes@uscg.mil (757) 641-1232 (757) 391-8100<br />
PAC TRATEAM LT Jorge Valente Jorge.L.Valente@uscg.mil (510) 437-3294<br />
Current as of 20 September 2011<br />
20
USCG Safety Program Way Ahead<br />
Risk Reduction Program (RRP)<br />
The <strong>Coast</strong> <strong>Guard</strong> is ever adapting to political, resource, and mission challenges that expose<br />
members to unknown safety challenges. Adaptive risk management systems capable of<br />
identifying and mitigating emerging hazards can reduce risk and prevent mishaps in dynamic<br />
operational environments. In 2009, CG-113 stood-up a Risk Reduction Program (RRP) to<br />
anticipate and mitigate hazards currently impacting our members in the operational environment.<br />
The RRP is changing the current “Reactive” CG safety program to a “Proactive” program. The<br />
RRP’s innovative methods, processes, and technologies provide effective and adaptive means to<br />
capture operational systemic deficiencies before mishaps occur, thus facilitating the development<br />
of strong safety cultures in all CG work environments.<br />
In his February 2011 State of the CG Address, Admiral Papp cited the current trend in mishaps<br />
as “unacceptable” and stated that “we’ve got to do something about it.” The Risk Reduction<br />
Program focuses on leading indicators of operational systems that can predict mishaps, and<br />
provides a significant contribution to mishap prevention and risk reduction. The RRP includes<br />
innovative analysis methods, processes, and technologies to identify and correct critical capacity<br />
deficits in operational systems.<br />
Figure 15 illustrates one initiative under the RRP to transform the current Operational Risk<br />
Management (ORM) program into a proactive and dynamic integrated hazard mitigation system.<br />
This system leverages existing hazard assessment programs (e.g., Crew Endurance Management<br />
(CEM)), Human Factors Analysis and Classification System (HFACS), Operational Hazards<br />
Analysis (OHA) and Safety Climate Assessments (column one of the figure) to identify deficient<br />
states in operational systems that are hazards to safety, readiness, and mission execution. These<br />
hazards are compiled into inventories; in the future every CG mission, evolution, and/or task<br />
would have hazard inventory that represents the inherent risk associated with the conduct of the<br />
mission, evolution, or task (column two of the figure). During mission planning,<br />
operators/planners use the inventories to identify all relevant mission hazards and consider<br />
potential mitigation strategies. For all hazards associated with a mission, evolution, and task, the<br />
inventories also include the corresponding SPE (severity/probability/exposure) score. Hazards<br />
that remain uncontrolled constitute the residual risk. The residual risk score, calculated by<br />
subtracting the mitigation SPE from the initial hazard SPE score, reveals risk exposure<br />
associated with the mission, evolution, or task. The inventories are reviewed and updated<br />
regularly to align with operational realities.<br />
During mission, evolution, or task planning the appropriate inventory is selected for use during<br />
the hazard mitigation phase. During hazard mitigation, contextual information regarding the<br />
mission, evolution, or task (e.g., weather, time-of-day, crew proficiency, fatigue,<br />
platform/equipment status, etc.) is entered into the risk assessment tool (General Assessment of<br />
Risk or GAR) along with the residual risk score calculated from the hazard inventory (column<br />
three of the figure). The inherent risk associated with the mission, evolution, or task as captured<br />
in the hazard inventory residual risk score plus the contextual risk associated with the<br />
21
environment, crew state, and platform status will equal overall risk for the mission, evolution, or<br />
task.<br />
The final, and critical, phase of the Integrated Hazards Mitigation System is dynamic assessment<br />
of contextual risk during mission execution. This phase involves not only the responding asset<br />
but also command and control support from the unit and/or Sector. The future GAR tool will<br />
provide real-time risk exposure assessment capabilities. As the response asset communicates<br />
environmental and platform status information, command and control enters the information into<br />
GAR and the risk score is updated. Crew fatigue is automatically monitored by the GAR tool<br />
and integrated into the risk score. Command and control can alert the response asset when GAR<br />
scores near established risk thresholds that require specific actions (e.g., notification of<br />
CO/OINC/Sector for authorization to proceed). The monitoring phase requires the consistent<br />
and dynamic exchange of information between the response asset and command and control.<br />
This interaction will enhance situational awareness and improve decision making by having<br />
access to accurate and timely information.<br />
22
23<br />
Operational<br />
Goal<br />
Hazard Identification Hazard Inventory Hazard Mitigation Integrated Hazard<br />
and Assesment Monitoring<br />
40% 26%<br />
4% 30%<br />
7<br />
6.5<br />
6<br />
5.5<br />
5<br />
4.5<br />
4<br />
3.5<br />
3<br />
Alpha Score<br />
Hours<br />
Towing 1 - Long Sleep Period<br />
7/5 (#6), 6/6 (#2), 6/6 (#3)<br />
27-Mar-00<br />
28-Mar-00<br />
29-Mar-00<br />
30-Mar-00<br />
31-Mar-00<br />
1-Apr-00<br />
2-Apr-00<br />
3-Apr-00<br />
4-Apr-00<br />
5-Apr-00<br />
6-Apr-00<br />
7-Apr-00<br />
8-Apr-00<br />
9-Apr-00<br />
10-Apr-00<br />
11-Apr-00<br />
12-Apr-00<br />
13-Apr-00<br />
14-Apr-00<br />
15-Apr-00<br />
16-Apr-00<br />
17-Apr-00<br />
18-Apr-00<br />
19-Apr-00<br />
20-Apr-00<br />
21-Apr-00<br />
22-Apr-00<br />
23-Apr-00<br />
24-Apr-00<br />
25-Apr-00<br />
26-Apr-00<br />
Alertness Test Results<br />
ID 13<br />
10.00<br />
8.00<br />
1.40<br />
6.00<br />
1.20<br />
4.00<br />
1.00<br />
2.00<br />
0.80<br />
0.00<br />
0.60<br />
-2.00<br />
0.40<br />
0.20<br />
Participant 45<br />
0.00<br />
0 1 2 3 4 5 6 7<br />
CDI<br />
SLI<br />
Melatonin (pg/ml)<br />
40<br />
35<br />
30<br />
25<br />
20<br />
15<br />
10<br />
5<br />
0<br />
Deep Draft Chart A<br />
Voyage Melatonin Profile<br />
120999-0400<br />
120999-0600<br />
120999-0800<br />
140999-0500<br />
140999-0700<br />
160999-0400<br />
160900-0600<br />
160999-0800<br />
200999-0500<br />
200999-0700<br />
220999-0400<br />
220999-0600<br />
Date a nd Time<br />
220999-0800<br />
240999-0500<br />
240999-0700<br />
260999-0400<br />
260999-0600<br />
260999-0800<br />
280999-0500<br />
280999-0700<br />
Endurance State<br />
Crew/ Team<br />
leadership<br />
Communicating<br />
Critical<br />
information<br />
Assertiveness<br />
Cross<br />
Monitoring<br />
Performance<br />
Necessary<br />
Action Delayed<br />
Delayed<br />
Checklist<br />
Cognitive<br />
Task<br />
Oversaturation<br />
Procedural<br />
Errors<br />
Destabilized<br />
Approach<br />
Procedural<br />
Guidance/<br />
Publications<br />
Mishap Data<br />
Operational<br />
Task a<br />
Operational<br />
Task b<br />
Operational<br />
Task c<br />
Operational<br />
Task d<br />
Operational<br />
Task e<br />
Misperception of OPNAL<br />
conditions<br />
CRASH<br />
Decision making<br />
During OPNS<br />
Go-Around<br />
Mission Capability /<br />
Capacity Gap Analyses<br />
Dates<br />
#6<br />
#2<br />
6 Hours<br />
#3<br />
Operation: Vertical Insertion<br />
Hazard Assessment Worksheet<br />
Hazard Severity Score Probability Score Exposure Score Total<br />
Score<br />
Insufficient cargo<br />
capacity<br />
Inadequate tactical<br />
extraction equipment<br />
Insufficient Sleep<br />
Severe Weather<br />
Hazards – Bases Risk Assessments<br />
Figure 15<br />
Capability<br />
A<br />
Capability<br />
B<br />
Capability<br />
C<br />
Capability<br />
D<br />
Capability<br />
E<br />
Overconfidence<br />
Risk<br />
Assessment<br />
during OPNS<br />
Inattention<br />
Mission Planning<br />
No Plan for ILS<br />
Over Control/<br />
Under Control<br />
Improper Pitch<br />
and Elevator<br />
Inputs<br />
Personnel<br />
Capacity<br />
Infrastructure /<br />
Technology<br />
Capacity<br />
Doctrine<br />
Capacity<br />
Personnel<br />
Capacity<br />
Infrastructure /<br />
Technology<br />
Capacity<br />
Doctrine<br />
Capacity<br />
Personnel<br />
Capacity<br />
Infrastructure /<br />
Technology<br />
Capacity<br />
Doctrine<br />
Capacity<br />
Procedural Guidance/<br />
Publications<br />
Equipment<br />
Personnel<br />
Capacity<br />
Infrastructure /<br />
Technology<br />
Capacity<br />
Doctrine<br />
Capacity<br />
Personnel<br />
Capacity<br />
Infrastructure /<br />
Technology<br />
Capacity<br />
Doctrine<br />
Capacity<br />
Injury or<br />
death<br />
Injury or<br />
death<br />
Injuries-<br />
damage<br />
Injury or<br />
death<br />
100<br />
100<br />
25<br />
100<br />
50% chance to<br />
occur<br />
Unusual<br />
sequence<br />
50 % chance<br />
to occur<br />
Unusual<br />
Sequence<br />
6<br />
3<br />
6<br />
3<br />
Once per<br />
month<br />
Very rare<br />
Rare<br />
Rare<br />
2<br />
.5<br />
1<br />
1<br />
1200<br />
150<br />
150<br />
300<br />
Illustration of an RRP initiative to transform the current Operational Risk Management (ORM) program into a proactive and dynamic<br />
integrated hazard mitigation system.<br />
23
Operational Hazard Analysis (OHA)<br />
We have recently begun to utilize OHA as a framework to better understand our operational risk<br />
threats. OHA is a structured analytical environment and framework that facilitates analysis of<br />
operations and proactive identification of active and latent hazards in the operational<br />
environment. The process involves the identification of mission capabilities necessary to achieve<br />
<strong>Coast</strong> <strong>Guard</strong> mission objectives, assessment of gaps between <strong>Coast</strong> <strong>Guard</strong> capability<br />
requirements and existing technology/infrastructure, personnel proficiency, and doctrine<br />
capacities. In the context of the OHA framework, capabilities and capacities are defined as:<br />
Capability - refers to the ability of personnel to conduct specific activities (e.g., descend onto a<br />
target from a helicopter) during a mission leveraging available written guidance (e.g., TTPs),<br />
personnel attributes (e.g., proficiency), and available technology/infrastructure (e.g., helicopter).<br />
Capacity - is the measured degree of congruence between operational requirements and written<br />
guidance availability and quality (completeness, accuracy and mission relevance); personnel<br />
attributes (experience, training, knowledge, skills, abilities, physical and cognitive traits, and<br />
psychological states); and technology/infrastructure characteristics and technical specifications.<br />
When combined, capacities form an interactive system resulting in the emergence of operational<br />
capabilities.<br />
The OHA is an analytical process that requires quantitative data on the current state of capacities<br />
necessary to achieve capabilities to execute a task. These data are captured using subject matter<br />
experts (SME) who rate, using standardize scoring procedures, the current developmental state of<br />
elements that when aggregated allow capabilities to be realized. For example platform (e.g. H-<br />
60) cargo and range represent capacities that when aggregated define the limits of the ‘transport’<br />
capability. Figure 15 depicts a typical OHA framework that is used to represent the system<br />
being analyzed.<br />
Two recent analyses using the OHA process exemplify the potential for this safety analysis<br />
methodology and capability to anticipate mishaps. The first analysis was requested by the <strong>Coast</strong><br />
<strong>Guard</strong> Safety and Occupational Health Council (SOHC), a council composed of flag officers<br />
from CG-1, CG-11, CG-4, CG-5, CG-6, CG-7, and CG-9, to evaluate two operational evolutions<br />
(Vertical Insertion (VI) and Hook and Climb (H&C)) currently being conducted by Deployed<br />
Special Forces (DSF) units. The second analysis was requested by the Aviation Safety<br />
Assessment Action Plan (ASAAP) that was convened to review aviation operations following<br />
the rash of mishaps in FY09-10. Each analysis is discussed in detail below.<br />
24
25<br />
OHA system analysis framework<br />
O perational<br />
G oal<br />
Figure 16<br />
O perational<br />
Task a<br />
O perational<br />
Task b<br />
O perational<br />
Task c<br />
O perational<br />
Task d<br />
O perational<br />
Task e<br />
25<br />
A<br />
B<br />
C<br />
D<br />
E<br />
Capability<br />
Capability<br />
Capability<br />
Capability<br />
Capability<br />
Personnel<br />
Capacity<br />
In fra s tru c tu re /<br />
Technology<br />
Capacity<br />
Doctrine<br />
Capacity<br />
Personnel<br />
Capacity<br />
In fra s tru c tu re /<br />
Technology<br />
Capacity<br />
Doctrine<br />
Capacity<br />
Personnel<br />
Capacity<br />
In fra s tru c tu re /<br />
Technology<br />
Capacity<br />
Doctrine<br />
Capacity<br />
Personnel<br />
Capacity<br />
In fra s tru c tu re /<br />
Technology<br />
Capacity<br />
Doctrine<br />
Capacity<br />
Personnel<br />
Capacity<br />
In fra s tru c tu re /<br />
Technology<br />
Capacity<br />
Doctrine<br />
Capacity
OHA for VI and H&C<br />
Boarding ships is a common and essential mission objective for <strong>Coast</strong> <strong>Guard</strong> Maritime<br />
Operations. However, conducting covert boarding’s requires very specific capabilities currently<br />
under development in <strong>Coast</strong> <strong>Guard</strong> operations. There are two evolutions supporting the <strong>Coast</strong><br />
<strong>Guard</strong> security mission, namely vertical insertion (VI) and hook and climb (H&C) that were<br />
targeted for review. In VI, boarding team members slide down a rope from a helicopter onto the<br />
deck of the target of interest (TOI). In H&C, boarding team members deploy a hook from a<br />
small boat platform onto a railing or other suitable point and use a caving ladder to climb onto a<br />
TOI. These evolutions represent new chapters in <strong>Coast</strong> <strong>Guard</strong> operations. To address safety and<br />
performance concerns, a Tactical and Special Missions Safety Working Group (TSMS-WG),<br />
under the auspices of the <strong>Coast</strong> <strong>Guard</strong> Safety and Occupational Health Council (CG-SOHC), was<br />
established to conduct Operational Hazard Analyses (OHA). The objective of this effort was to<br />
identify and assess the current developmental state of capacities and capabilities necessary to<br />
safely execute these evolutions.<br />
The OHA process uses a quantitative framework, described earlier, to measure the gap between<br />
<strong>Coast</strong> <strong>Guard</strong> operational requirements and the current state of capacity development. The larger<br />
the capacity gap, the more difficulty personnel will experience executing mission tasks. SME<br />
from the Deployed Special Forces (DSF) communities responsible for doctrine, training, and<br />
mission execution conducted analyses using standardized procedures and scorecards designed to<br />
measure the gaps between operational requirements and current levels of capacity development.<br />
The results of the OHA in 2010 revealed numerous deficiencies in written guidance, personnel,<br />
and technology/infrastructure capacity elements that compromise the ability to conduct VI and<br />
H&C evolutions in a safe and effective manner. The deficit capacity elements include:<br />
• Platform cargo and egress,<br />
• Training infrastructure, access to both real world environments and static<br />
facilities,<br />
• Operational requirements doctrine and TTP specificity,<br />
• Personnel proficiency,<br />
• Physical fitness,<br />
• Medical, physical, and psychological screening,<br />
• Personal protective equipment (PPE), and<br />
• Risk tolerant culture.<br />
The OHA results were briefed to the SOHC who recommended a brief to the Deputy<br />
Commandant for Mission Support (DCMS) and Deputy Commandant for Operations (DCO).<br />
The DCMS and DCO were briefed on the OHA results and recommended a brief to the<br />
Commandant. On 13 October 2009, as the brief to the Commandant was being planned, the<br />
Deployable Operations Group (DOG) was conducting H&C training onto the CGC FRANK<br />
DREW when an assault team member fell off the caving ladder and drowned. The mishap<br />
analysis board (MAB) revealed many of the deficits that were documented in the OHA. The<br />
OHA brief did eventually reach the Commandant who ordered a stem-to-stern review of the<br />
entire DSF program. The OHA results are being used by the DOG and the stem-to-stern review<br />
teams to make changes.<br />
26
OHA for ASAAP<br />
A rise in CG aviation mishaps, five serious mishaps in six months, raised safety concerns with<br />
the CG aviation program. These incidents occurred in routine challenges such as hovering and<br />
pattern work, as opposed to more demanding evolutions as might be expected in either night<br />
operations or in extreme weather conditions. The increase in mishaps demanded the CG gain a<br />
better understanding of the inherent causes to prevent further incidents. An OHA was requested<br />
to identify capacity and capability deficits that degrade mission execution. This objective<br />
required a comprehensive review of aviation operations.<br />
In an attempt to focus the OHA, the CG-113 analysis team conducted a review of recent aviation<br />
mishaps to detect common elements or recurring themes. While no common causal or<br />
contributory threads were revealed, aviation risk assessment (RA) activities came into question<br />
in a number of the mishaps. Given the critical nature of RA for the safe execution of any<br />
mission, the OHA was focused on the aviation RA program.<br />
The RA-OHA revealed that CG aviation uses an on-the-job-training (OJT)-centric system to<br />
develop RA proficiency. The historically low mishap rates justified this approach. Traditional<br />
CG aviation missions of LE and SAR present a limited set of evolutions that are well within the<br />
RA development tolerance thresholds of an OJT-centric system. Prior to the expansion of the<br />
aviation mission scope, operational scenarios were limited to the variations included in SAR and<br />
LE missions. Exposure to real-world operations was frequent, increasing the likelihood that<br />
inexperienced pilots would be paired in the cockpit with very proficient aviators. However,<br />
recent expansion of aviation missions (e.g. AUF, RWAI, etc.) has increased RA proficiency<br />
requirements and reduced the likelihood of being paired with very proficient aviators since they<br />
are being distributed to new missions. In addition, the introduction of new platforms and flight<br />
management systems increase the demand for training/operational flight hours, and reduce<br />
exposure to experienced aviators. These additional demands on an OJT-centric RA proficiency<br />
system, developed to manage and sustain a stable two mission portfolio, is creating mounting<br />
uncertainty on the development of RA proficiency.<br />
To sustain the multi-mission demands on the current system, as well as technology/infrastructure<br />
upgrades, CG aviation must adopt a more formal RA proficiency development system. This<br />
formal system will reduce the sole reliance on flight hours and mentoring from very experienced<br />
aviators to grow RA proficiency. The formal RA system will rely on growing proficiency in the<br />
capabilities to identify, assess, mitigate and monitor hazards. Proficiency in these skills will be<br />
developed early in the aviator’s career and honed with exposure to operational scenarios.<br />
Additionally, awareness of the system elements and their interaction (e.g., flight hours and<br />
platform maintenance) that contribute to RA development are essential to manage RA<br />
proficiencies. RA system analysis tools, already in development, will assist units in managing<br />
the influence and interaction of the various elements that constitute operational complexity for<br />
each individual mission. These tools will leverage system analysis methodologies and provide<br />
users with a dynamic dashboard output on the status of operational elements, hazards, and<br />
associated consequences.<br />
An additional benefit of a formal RA development is the standardization of a RA process that is<br />
common across the entire aviation community. Currently, there is no standard process for RA so<br />
27
Proficiency Ratings<br />
1.2<br />
1<br />
0.8<br />
0.6<br />
0.4<br />
0.2<br />
0<br />
each unit may conduct RA differently using different analysis outputs to make risk versus gain<br />
decisions. These differences are particularly salient during joint operations when individual unit<br />
RA results do not agree.<br />
Formal RA Tool – Redesign General Assessment of Risk (GAR) Tool<br />
The most common tool used by the CG to assess risk is the General Assessment of Risk (GAR),<br />
or otherwise known as Green, Amber, Red. This tool requires the user to rate various elements<br />
(e.g., crew selection, crew fitness, planning/communications, supervision, environment, and<br />
mission complexity) associated with a mission or evolution on a scale of 0 to 10, where 0<br />
denotes ‘no risk’ and 10 signifies ‘maximum risk’. The aggregate score for the six elements<br />
denotes the risk associated with the mission. Scores between 0 and 23 are considered low risk<br />
and coded as ‘Green’. Scores between 24 and 44 denote moderate risk and coded as ‘Amber’.<br />
Scores between 45 and 60 are considered high risk and coded as ‘Red’. There are three primary<br />
deficiencies with the GAR tool. The first deficiency is that the composite score can misrepresent<br />
the true exposure to risk and lead the user into a false sense of security. For example, a crew that<br />
Aviator Proficiency as a Function of OPNL Experience<br />
SAR Complex<br />
Figure 17 Aviator operational experience over time<br />
<strong>Year</strong>s<br />
OPNS<br />
OPS-STAFF-<br />
OPS<br />
OPS-IP-OPS<br />
OPS-Staff<br />
has not slept in 24 hours would rate ‘crew fitness’ as 10 but if the remaining 5 elements on the<br />
GAR were ideal and scored a 1, the composite score would be 15 and the mission would be<br />
classified as ‘Green’. However, a mission where the crew has not slept in 24 hours should be<br />
classified as ‘Red,’ not ‘Green’. The GAR assessment underestimates the risk associate with this<br />
example mission scenario. The second deficiency with GAR is the subjective nature of the<br />
28
scores for the elements. Quite often these estimates are shots in the dark due to lack of<br />
awareness, or in the worst case,<br />
deliberate manipulation of scores to<br />
influence the ‘go/no go’ decision for<br />
the mission/evolution. The third<br />
deficiency is the currency of the<br />
GAR assessment as the mission<br />
progresses. As per the ORM<br />
COMDTINST, the GAR assessment<br />
must be updated if mission<br />
characteristics change that could<br />
impact risk exposure.<br />
Unfortunately, GAR assessments<br />
are rarely updated after the mission<br />
progresses and this exposes<br />
operational assets to unknown or<br />
unrecognized hazards.<br />
To address these deficiencies, a<br />
modified GAR tool is under<br />
development that replaces the<br />
composite score with a framework Figure 18 Monitor mission screen of the Aviation GAR tool.<br />
that evaluates each of the GAR<br />
elements within a systems analysis complex. To reduce the subjectivity of GAR scores,<br />
proficiency or development trend lines are being developed with SMEs for those GAR elements<br />
that can be quantified. For example, currently when assessing the element ‘crew selection’ the<br />
member must juggle cognitively the proficiency and development of the crew and then assign a<br />
score of 0 to 10 to represent the risk. A more accurate approach is to develop operational<br />
proficiency trend lines for each crew member. The figure above (Figure 17) illustrates a typical<br />
proficiency trend. Preliminary efforts to develop trend lines reveal that most individuals develop<br />
at similar rates. Using the example above, if one knows the number of years that individual has<br />
in the CG or their particular rate, one can estimate their level of operational proficiency and enter<br />
that rate into the calculation for the crew selection score. The final benefit to this tool is that<br />
since it runs on a software engine there are numerous functions that update dynamically as the<br />
mission progresses. For example, crew fatigue is monitored dynamically as the mission<br />
progresses. The tool considers sleep length, time-of-day, and length of the mission to estimate<br />
the psychophysical state of the crew. Since the software runs on the standard workstation, the<br />
GAR analysis can be updated as the mission progresses by shore based communication<br />
personnel and results relayed to the responding asset.<br />
Figure 18 above shows a screenshot of the GAR tool being developed. Currently there are beta<br />
versions for small boat and aviation operations. Field testing is underway to exercise the tool<br />
and refine as necessary.<br />
29
CONTACT INFO<br />
Your comments on this report including recommended content, as well as any suggestions<br />
concerning the safety of maritime operations will always be greatly appreciated. Please feel free<br />
to call, fax, or e-mail us with any comments, questions or concerns.<br />
SAFETY POINTS OF CONTACTS:<br />
Office of Safety and Environmental Health (COMDT CG – 113)<br />
Chief, CDR Joel Rebholz (202) 475-5200 (Acting)<br />
http://www.uscg.mil/hq/cg1/cg113/<br />
Aviation Safety Division (COMDT CG – 1131)<br />
Division Chief, CDR Joel Rebholz (202) 475-5200<br />
http://www.uscg.mil/hq/cg1/cg113/cg1131/<br />
Shore & Sector Operational Safety Division (COMDT CG – 1132)<br />
Division Chief, CDR Laura Weems (202) 475-5216<br />
http://www.uscg.mil/hq/cg1/cg113/cg1132/<br />
Environmental Health and Industrial Hygiene Division (COMDT CG – 1133)<br />
Division Chief, CDR Melburn Dayton (202) 475-5210<br />
http://www.uscg.mil/hq/cg1/cg113/cg1133/<br />
Afloat Safety Division (COMDT CG – 1134)<br />
Division Chief, CDR Richard Hartley (202) 475-5215<br />
http://www.uscg.mil/hq/cg1/cg113/cg1134/<br />
30