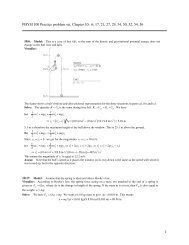
Isothermal process on p-V, T-V, and p-T diagrams
Isothermal process on p-V, T-V, and p-T diagrams
Isothermal process on p-V, T-V, and p-T diagrams

Create successful ePaper yourself
Turn your PDF publications into a flip-book with our unique Google optimized e-Paper software.
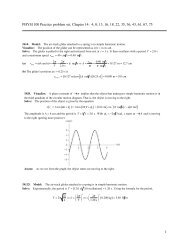
Clicker questi<strong>on</strong> 12<br />
The evoluti<strong>on</strong> of a system from state a to state b is shown <strong>on</strong> both the p-V<br />
<strong>and</strong> T-S <strong>diagrams</strong> below. About how many moles of gas are in the<br />
system? (Take R = 8.)<br />
p (Nm –2 )<br />
2,000<br />
b<br />
a<br />
1 V (m3 2 )<br />
T (K)<br />
500<br />
250<br />
a) 0.5 b) 1 c) 1.5<br />
d) 2 e) not enough informati<strong>on</strong> to tell<br />
b<br />
10 S (JK –1 30 )<br />
PHYS 1101, Winter 2009, Prof. Clarke 32<br />
a<br />
pV = nRT<br />
at state b:<br />
pV = 2000<br />
RT ~ 2000<br />
⇒ n ~ 1