The mid seventeenth century collapse of Iroquoian Ontario:
The mid seventeenth century collapse of Iroquoian Ontario:
The mid seventeenth century collapse of Iroquoian Ontario:

Create successful ePaper yourself
Turn your PDF publications into a flip-book with our unique Google optimized e-Paper software.
M. JackeS<br />
358<br />
0.7<br />
0.6<br />
0.5<br />
0.4<br />
0.3<br />
0.2<br />
0.1<br />
0<br />
J:A<br />
Grimsby<br />
Grimsby II<br />
Grimsby IIIb<br />
Kleinburg<br />
Uxbridge<br />
Ossosane L<br />
Maurice Ossosane JM<br />
Grimsby IIIa<br />
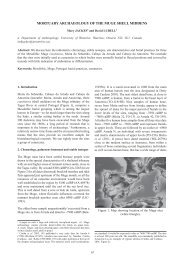
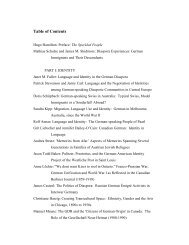
cates a TFR ~4.5-6.5; a second (Larocque, 1991) with a MNI <strong>of</strong> 447 provides a very tight TFR<br />
estimate <strong>of</strong> 4.4-4.7. It is clear that, in fact, the Ossossané estimate should be in the range <strong>of</strong> 4<br />
to 5. Uxbridge is extremely well studied (Pfeiffer, 1983; 1984; 1986), and should be regarded<br />
as providing a reliable estimate <strong>of</strong> pre-contact fertility at 4.8-5.2 (though tuberculosis may<br />
have reduced fertility slightly). Kleinburg again suggests that Huron fertility just before 1600<br />
was probably not very high: analyses by Pfeiffer (1974) and Larocque (1991) both provide<br />
TFR estimates <strong>of</strong> 5-6.<br />
<strong>The</strong> value <strong>of</strong> 11 to 12 for the total Grimsby cemetery is close to the maximum recorded<br />
TFR and cannot be correct because there is osteological and ethnohistorical evidence that the<br />
fertility <strong>of</strong> <strong>Ontario</strong> <strong>Iroquoian</strong>s was half that (Jackes, 1994). Partitioning the total number <strong>of</strong><br />
individuals excavated will give a better understanding <strong>of</strong> the reasons for the high fertility<br />
estimate.<br />
<strong>The</strong> bead phase II sample is inadequate. Archaeological data based on sample sizes <strong>of</strong> less<br />
than ~100 cannot be relied upon (Jackes, Meiklejohn, 2004; 2008). A broad estimate range can<br />
be expected from a small sample and this is true <strong>of</strong> phase II (fig. 5).<br />
Under-representation <strong>of</strong> adults is most marked in the features associated with trade beads<br />
<strong>of</strong> phase IIIa. <strong>The</strong> estimated total fertility rate for IIIa bead features is far beyond any biologically<br />
possible range (TFR <strong>of</strong> 25 to 26). Features with IIIb beads show a more “normal” distribution<br />
and fertility estimates are biologically possible. However, at 7.5-9 children, the IIIb<br />
fertility estimate is both wide and high. <strong>The</strong> adult sex ratio in IIIa features is .8 males/<br />
females, but in IIIb it is 1.4. <strong>The</strong>re are thus very large numbers <strong>of</strong> women and children in the<br />
bead phase IIIa burial features, suggesting that we must question whether there are reasons<br />
for the abnormal demographic pr<strong>of</strong>ile.<br />
TFR<br />
4 6 8 10 12 14 16 18 20 22 24 26<br />
Fig. 4. Fertility estimates for <strong>Ontario</strong> osteological samples: Maurice, Ossossané as analyzed by Jimenez and<br />
Melbye and by Larocque, Uxbridge, Kleinburg and Grimsby. <strong>The</strong> total fertility rate (TFR) is predicted by<br />
quadratic regression from the ratio <strong>of</strong> juveniles to adults (J:A.). Grimsby is represented by the total sample<br />
and by each <strong>of</strong> the three trade bead phases (II, IIIa and IIIb).