MCDOT Countywide Bus Rapid Transit Study - Maryland ...
MCDOT Countywide Bus Rapid Transit Study - Maryland ...
MCDOT Countywide Bus Rapid Transit Study - Maryland ...

You also want an ePaper? Increase the reach of your titles
YUMPU automatically turns print PDFs into web optimized ePapers that Google loves.
<strong>MCDOT</strong> <strong>Countywide</strong><br />
<strong>Bus</strong> <strong>Rapid</strong> <strong>Transit</strong> <strong>Study</strong><br />
Consultant’s Report<br />
Executive Summary (Draft)<br />
April 26, 2011<br />
DEPARTMENT OF TRANSPORTATION<br />
Barrier system (from TOA)
<strong>Countywide</strong> <strong>Bus</strong> <strong>Rapid</strong> <strong>Transit</strong> (BRT) <strong>Study</strong><br />
Consultant’s Report<br />
Executive Summary (Draft)<br />
Prepared for:<br />
Montgomery County Department of Transportation (<strong>MCDOT</strong>)<br />
Prepared by:<br />
Parsons Brinckerhoff<br />
April 26, 2011
Table of Contents<br />
<strong>MCDOT</strong> <strong>Countywide</strong> <strong>Bus</strong> <strong>Rapid</strong> <strong>Transit</strong> <strong>Study</strong><br />
Executive Summary (Draft)<br />
1. CONTEXT FOR THE STUDY.............................................................................................................................. 1<br />
2. WHAT IS BRT?................................................................................................................................................ 1<br />
2.1. KEY BRT ELEMENTS .................................................................................................................................... 2<br />
2.1.1 Stylish Vehicles .................................................................................................................................. 2<br />
2.1.2 Attractive Stations ............................................................................................................................. 2<br />
2.1.3 Faster Fare Collection ........................................................................................................................ 2<br />
2.1.4 Guideways ......................................................................................................................................... 3<br />
2.1.5 Intelligent Transportation Systems (ITS) ............................................................................................. 4<br />
2.1.6 Operations ........................................................................................................................................ 4<br />
2.1.7 Land Use ........................................................................................................................................... 5<br />
2.1.8 Station Access.................................................................................................................................... 5<br />
2.1.9 Strong Brand Identity ......................................................................................................................... 5<br />
3. STUDY METHODOLOGY ................................................................................................................................. 6<br />
4. STUDY FINDINGS ........................................................................................................................................... 6<br />
4.1. PROPOSED BRT NETWORK AND TREATMENTS ................................................................................................... 6<br />
4.2. RIDERSHIP AND OPERATING COSTS ............................................................................................................... 11<br />
4.3. CAPITAL COSTS ........................................................................................................................................ 15<br />
4.3.1 Capital Costs .................................................................................................................................... 15<br />
5. KEY CONSIDERATIONS ................................................................................................................................. 17<br />
5.1. COSTS ................................................................................................................................................... 17<br />
5.2. LAND USE AND BRT BRANDING .................................................................................................................... 17<br />
5.3. IMPLEMENTATION .................................................................................................................................... 17<br />
i
ii<br />
Figures<br />
FIGURE 1: QUEUE JUMP OPERATION EXAMPLE .................................................................................................................. 3<br />
FIGURE 2: TRANSIT SIGNAL PRIORITY EXAMPLE .................................................................................................................. 4<br />
FIGURE 3: FINAL CORRIDOR ANALYSIS AND SELECTION PROCESS ............................................................................................. 7<br />
FIGURE 4: PROPOSED BRT SYSTEM MAP .......................................................................................................................... 9<br />
Tables<br />
TABLE 1: BRT NETWORK – ROUTE SPECIFICS ................................................................................................................ 8<br />
TABLE 2: FORECASTED (2040) TRAVEL TIMES (HIGHWAY, LOCAL BUS, BRT) ....................................................................... 11<br />
TABLE 3: FORECASTED (2040) TRAVEL SPEEDS (HIGHWAY, LOCAL BUS, AND BRT) ............................................................... 12<br />
TABLE 4: FORECASTED (2040) RIDERSHIP FOR BRT ROUTES (SORTED BY DAILY BOARDINGS PER ROUTE MILE, $2011) .................. 13<br />
TABLE 5: OPERATION AND MAINTENANCE COSTS (2040) FOR BRT ROUTES (SORTED BY FAREBOX RECOVERY RATIOS, $2011)........ 14<br />
TABLE 6: SUMMARY OF TREATMENT ASSUMPTIONS FOR THE NETWORK ............................................................................. 16
1. Context for the <strong>Study</strong><br />
<strong>MCDOT</strong> <strong>Countywide</strong> <strong>Bus</strong> <strong>Rapid</strong> <strong>Transit</strong> <strong>Study</strong><br />
Executive Summary (Draft)<br />
The Montgomery County Department of Transportation (<strong>MCDOT</strong>) initiated the <strong>Countywide</strong> <strong>Bus</strong><br />
<strong>Rapid</strong> <strong>Transit</strong> (BRT) <strong>Study</strong> to identify key corridors within the county that could facilitate<br />
premium rapid transit service. The intent of this effort was to complete a planning-level analysis<br />
to draw conclusions regarding the feasibility of a network of BRT routes. The background for the<br />
study was established by conducting several individual corridor studies that explored BRT<br />
service through analysis conducted by the Metropolitan Washington Council of Governments<br />
(MWCOG), through a regional premium transit study, and through a BRT system concept<br />
developed by Montgomery County Councilmember Marc Elrich.<br />
The consulting team was directed by the <strong>MCDOT</strong> to explore the feasibility of constructing a set<br />
of BRT corridors within the available constrained rights-of-way on county and state roads. The<br />
study provided analysis results at a level to allow <strong>MCDOT</strong> to identify possible BRT routes,<br />
determine treatments that would enhance speed, reliability, rider comfort, and convenience, and<br />
measure the system’s performance in the horizon planning year 2040.<br />
Based on the study’s proposed implementation of BRT treatments—including exclusive<br />
transitways, transit signal priority (TSP) and queue jump lanes, and improved stations—a<br />
system of BRT routes could operate effectively within the county. The recommended 150-mile<br />
network of BRT routes could significantly increase daily transit use, with 210,000 to 270,000<br />
BRT riders and 85,000 new transit trips in Montgomery County, which would represent an<br />
increased peak-hour mode share from 9 to 11 percent.<br />
2. What is BRT?<br />
The study focused on implementing a BRT system that would emulate light rail operations in<br />
terms of the features provided, but would operate on the arterial roadway system in the county.<br />
This BRT system would rely on walk access, local bus transfers, and some park-and-ride<br />
access, and would combine the most attractive features of light rail with the lower costs of bus<br />
technology. Instead of trains and tracks, BRT invests in improvements to vehicles, roadways,<br />
rights-of-way, intersections, and traffic signals to speed up bus transit service.<br />
BRT service differs from commuter bus service, which focuses on peak-period service during<br />
the weekday with a limited schedule, intermediate stops, and dependence on park-and-ride<br />
access. BRT was assumed for this study to be premium bus service operating with the following<br />
characteristics:<br />
All-day service<br />
Higher service frequencies<br />
Stops at 0.5- to 1-mile spacing<br />
Provision for exclusive lanes where possible<br />
1
<strong>Transit</strong> signal priority and other queue jump lanes where appropriate<br />
Enhanced stations with greater passenger amenities<br />
Real-time passenger information<br />
Potential for off-board fare collection<br />
Efficient boarding and alighting<br />
2.1. Key BRT Elements<br />
2.1.1 Stylish Vehicles<br />
Many BRT vehicles have sleek, modern designs that emulate<br />
light rail features. They can be standard, 40-foot or articulated<br />
60-foot buses (as assumed for this study). They should have<br />
level floors and multiple wide doors for easy boarding and<br />
alighting. Vehicles should have comfortable interiors<br />
designed for different configurations, including space for<br />
bicycle storage.<br />
2.1.2 Attractive Stations<br />
BRT stations should reflect the level of investment and<br />
permanence of the system. They should welcome<br />
passengers and feature a comfortable, attractive design.<br />
Stations should provide a variety of passenger amenities,<br />
including real-time information displays, benches,<br />
substantial shelters, and security features. Station<br />
platforms should be at the same level as the floor of the<br />
BRT vehicle to accommodate efficient boarding and<br />
alighting. This study assumed level-floor boarding for all<br />
stations.<br />
2.1.3 Faster Fare Collection<br />
On- or off-board fare collection options can help reduce BRT<br />
dwell time at stations and increase speed of service. Some<br />
on-board fare collection options include exact change<br />
payment and pass scanners. Examples of off-board fare<br />
collection include the use of ticket vending machines as<br />
proof of payment and special prepayment boarding areas.<br />
Pass scanners, such as those using the SmarTrip system in<br />
the Washington, DC region, provide complete integration<br />
with the area-wide transit system.<br />
2<br />
Eugene Emx<br />
(Source: LTD)<br />
Cleveland Healthline Station<br />
(with protective shelter, ticket vending,<br />
and information kiosk)<br />
On-Board Smart Card Reader<br />
(Source: WMATA)
2.1.4 Guideways<br />
Guideways can serve to increase BRT travel speeds,<br />
improve service reliability, and reinforce the system’s<br />
permanence by separating the vehicles from mixed<br />
traffic. Examples of guideways applicable to BRT<br />
include median, side-of-road, or separate busways and<br />
exclusive bus lanes within the roadway cross section.<br />
BRT vehicles may operate in mixed traffic in areas with<br />
constrained rights-of-way. In these conditions,<br />
implementing queue jumps can help increase operating<br />
<strong>MCDOT</strong> <strong>Countywide</strong> <strong>Bus</strong> <strong>Rapid</strong> <strong>Transit</strong> <strong>Study</strong><br />
Executive Summary (Draft)<br />
speed and service reliability. A queue jump (Figure 1), as assumed in this study, is when a rapid<br />
transit vehicle can use an auxiliary lane (such as a right-turn lane) at a signalized intersection to<br />
bypass the general traffic queue at the intersection. An advanced green signal would allow the<br />
vehicle to move through the intersection unimpeded ahead of general traffic.<br />
Source: TCRP Report 118<br />
Figure 1: Queue Jump Operation Example<br />
(a) <strong>Bus</strong> receives green signal before other vehicles<br />
(b) Other vehicles proceed a few seconds later<br />
EmX Median Guideway<br />
(Eugene, Oregon)<br />
3
2.1.5 Intelligent Transportation Systems (ITS)<br />
Using ITS technology can help<br />
increase quality of service,<br />
improve operations, and provide<br />
passengers with timely and reliable<br />
information about BRT service. A<br />
key ITS application assumed for<br />
this study was transit signal priority<br />
(TSP). TSP technology allows a<br />
vehicle to request priority through<br />
a signalized intersection (Figure 2)<br />
by extending the green phase or<br />
truncating the red phase by a few<br />
Figure 2: <strong>Transit</strong> Signal Priority Example<br />
seconds. This is a different<br />
application from signal pre-emption, which is often applied at locations of emergency vehicles<br />
where signals are controlled to stop all traffic. Typically TSP saves only a few seconds per<br />
intersection. TSP implementation may be conditional, depending on whether the vehicle is<br />
behind schedule.<br />
TSP, in this study, was assumed to be feasible where the roadway level of service (LOS) was in<br />
the C or D range. LOS A or B represents more free-flow traffic conditions, where priority would<br />
not give a BRT vehicle an extra advantage. LOS E or F represents failing traffic conditions,<br />
where congestion would be so great a BRT vehicle cannot effectively actuate priority calls. In<br />
those cases, BRT would provide minimal benefit to bus operations and increase overall delay to<br />
other vehicles.<br />
Other ITS applications can aid<br />
passengers with travel decisions by<br />
providing timely and reliable information.<br />
Riders can learn of the next BRT vehicle<br />
to arrive or route delays over the internet,<br />
through real-time information displays at<br />
BRT stations, or through a user’s mobile<br />
phone. This study assumed the use of<br />
real-time passenger information for the<br />
proposed network.<br />
2.1.6 Operations<br />
BRT service should provide reliable, frequent service with fewer stops compared to local bus<br />
service. It should also provide connectivity to other transportation modes such as local buses,<br />
rail, park-and-rides, and bicycle and pedestrian paths. Routes should be easy to understand<br />
and designed for passengers to have a one-seat ride to the extent possible. Local transit service<br />
should be re-oriented to provide access to BRT corridors.<br />
4<br />
Real-time information display in shelter
2.1.7 Land Use<br />
BRT routes operating along corridors with high<br />
concentrations of development that support<br />
transit make BRT service more effective as a<br />
transportation option. <strong>Transit</strong>-oriented<br />
development is a key component for successful<br />
BRT. BRT takes advantage of the pedestrian and<br />
customer activity found in areas with higher land<br />
use densities and a mixture of types of<br />
development, including residential, retail,<br />
employment, and entertainment.<br />
<strong>MCDOT</strong> <strong>Countywide</strong> <strong>Bus</strong> <strong>Rapid</strong> <strong>Transit</strong> <strong>Study</strong><br />
Executive Summary (Draft)<br />
Automobile use and parking needs can decrease where there are clusters of such development.<br />
BRT corridors require a minimal level of concentrated development. For this study, a threshold<br />
of at least six households or five employees per acre was used during early analysis as a<br />
method for identifying corridors where BRT service may be appropriate. The planning horizon<br />
year of 2040 includes the recently approved White Flint, Great Seneca Science Corridor and the<br />
Germantown Plans, all of which focus on transit–oriented<br />
communities.<br />
2.1.8 Station Access<br />
Improved bicycle, pedestrian and auto access to stations, and<br />
the correct placement of the station locations are critical factors<br />
in the success of a BRT system. Considerations for station<br />
locations in this study included placement at existing bus stops,<br />
Metrorail or planned light rail stations, transit centers, and parkand-ride<br />
lots. Detailed corridor implementation programs<br />
following this study should also consider the surrounding<br />
physical environment to enhance or improve access to BRT<br />
stations. BRT stations also must be accessible to passengers<br />
with varying levels of physical abilities.<br />
2.1.9 Strong Brand Identity<br />
Branding of BRT service conveys to new transit users and<br />
users unfamiliar with BRT that they are encountering a<br />
premium transit system with enhanced service and<br />
amenities. Typical branding methods include: 1<br />
Branding stations and terminal features such as<br />
bus/BRT stop signs, passenger information boards, fare<br />
collection equipment, and media.<br />
Giving vehicles a special styling, unique livery, added<br />
passenger amenities, and marketing panels.<br />
1 TCRP Report 118: <strong>Bus</strong> <strong>Rapid</strong> <strong>Transit</strong> Practitioner’s Guide<br />
Dense land use near<br />
Cleveland Healthline Station<br />
Ensure BRT is accessible to<br />
all riders<br />
BRT Branding - Orange Line<br />
5
Branding running ways by using special paving materials, colors, and markings.<br />
Branding marketing materials such as route maps, route schedules, web sites, and media<br />
information.<br />
3. <strong>Study</strong> Methodology<br />
This feasibility study consisted of several tasks to identify a final set of viable BRT routes that<br />
could operate along state and county roadways in Montgomery County. These tasks were as<br />
follows:<br />
6<br />
1. Conduct an initial screening to identify a set of county roads that exhibit characteristics<br />
consistent with BRT operations.<br />
2. Conduct field reviews and planning level right-of-way analysis along potential BRT<br />
corridors to determine potential design options, primarily within the existing right of way.<br />
3. Determine travel demand along identified corridors.<br />
4. Determine capital and operating costs for the BRT network.<br />
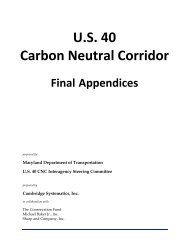
Figure 3 depicts the study methodology in flow chart form and identifies the steps taken to<br />
determine the final network and analyze that network for viability.<br />
The work conducted for these tasks ultimately produced a network of 16 high-investment BRT<br />
routes that would incorporate most of the key elements discussed in Section 2.1 and could be<br />
built within the existing right-of-way. The conceptual level of this study did not involve identifying<br />
the locations of right-of-way impacts; therefore, this proposed network would involve realigning<br />
roadway cross-sections, sometimes beyond the existing right-of-way. For example, exclusive<br />
guideways would be constructed through the spaces of existing medians and left-turn lanes at<br />
signalized intersections. However, constructing exclusive guideways would include replacing the<br />
left-turn lanes to maintain similar levels of traffic operations along the corridors.<br />
4. <strong>Study</strong> findings<br />
4.1. Proposed BRT Network and Treatments<br />
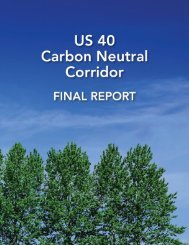
Table 1 summarizes the proposed BRT network of 16 routes forecasted by 2040 to be viable<br />
BRT corridors. Figure 4 illustrates this network.<br />
The specific guideway and intersection treatments options for each route can be found in the<br />
main body or the report.
All county<br />
roadways<br />
High-level Roadway<br />
Screening<br />
screened against minimum<br />
density thresholds<br />
Define BRT Routes and<br />
Station Locations<br />
Capital/O&M Costs<br />
developed unit costs for BRT<br />
elements<br />
determined costs for lowand<br />
high-investment BRT<br />
networks<br />
Corridor Development and<br />
Initial Corridor Screening<br />
developed corridors<br />
screened corridor subset<br />
against four criteria<br />
Refined Route Assessment<br />
identified BRT treatments by<br />
route<br />
<strong>MCDOT</strong> <strong>Countywide</strong> <strong>Bus</strong> <strong>Rapid</strong> <strong>Transit</strong> <strong>Study</strong><br />
Executive Summary (Draft)<br />
Figure 3: Final Corridor Analysis and Selection Process<br />
-Roads from<br />
BRT system<br />
concept<br />
-Roads from<br />
PCN corridors<br />
Baseline<br />
roadway<br />
network<br />
Proposed BRT<br />
Network<br />
16 routes,<br />
150 miles<br />
Screened<br />
BRT<br />
corridors<br />
Operating statistics<br />
Field Review<br />
collected data on<br />
physical/operational<br />
infrastructure<br />
Demand Modeling/Policy<br />
Area Analysis<br />
defined transportation<br />
network<br />
modeled unconstrained and<br />
constrained BRT networks<br />
7
TABLE 1: BRT NETWORK – ROUTE SPECIFICS<br />
8<br />
Route<br />
Length<br />
(miles)<br />
Number<br />
of<br />
Stations<br />
Route<br />
Number Corridor From To<br />
3<br />
MD 586/Veirs Mill<br />
Road<br />
Rockville Metrorail<br />
Station<br />
Wheaton Metrorail<br />
Station<br />
6.7 11<br />
4a<br />
Georgia Avenue<br />
North<br />
Montgomery General<br />
Hospital<br />
Wheaton Metrorail<br />
Station<br />
9.8 12<br />
4b<br />
Georgia Avenue<br />
South<br />
Wheaton Metrorail<br />
Station<br />
Silver Spring <strong>Transit</strong><br />
Center<br />
3.9 6<br />
5<br />
Rockville Metrorail-<br />
Life Sciences Center<br />
Life Sciences Center<br />
Rockville Metrorail<br />
Station<br />
5.3 7<br />
7<br />
MD 124/Muddy<br />
Branch Road<br />
Lakeforest Mall Life Sciences Center 7.2 10<br />
8<br />
MD 185/Connecticut<br />
Avenue<br />
Georgia Avenue and<br />
Bel Pre Road<br />
Medical Center<br />
Metrorail Station<br />
9.5 10<br />
10a MD 355 North<br />
MD 355 and<br />
Stringtown Road<br />
Rockville Metrorail<br />
Station<br />
14.6 16<br />
10b MD 355 South<br />
Rockville Metrorail<br />
Station<br />
Bethesda Metrorail<br />
Station<br />
8.8 13<br />
11<br />
MD 650/New<br />
Hampshire Avenue<br />
White Oak <strong>Transit</strong><br />
Center<br />
Fort Totten Metrorail<br />
Station<br />
8.8 9<br />
12<br />
Montgomery Mall/<br />
Old Georgetown<br />
Road<br />
Montgomery Mall<br />
<strong>Transit</strong> Center<br />
Bethesda Metrorail<br />
Station<br />
6.9 9<br />
14 Randolph Road<br />
White Flint Metrorail<br />
Station<br />
Glenmont Metrorail<br />
Station<br />
5.5 7<br />
18<br />
MD 193/University<br />
Boulevard<br />
Wheaton Metrorail<br />
Station<br />
Takoma/Langley<br />
Park <strong>Transit</strong> Center<br />
6.4 9<br />
19<br />
US 29/Columbia<br />
Pike/Colesville Road<br />
Burtonsville Parkand-Ride<br />
Lot<br />
Silver Spring <strong>Transit</strong><br />
Center<br />
13.5 11<br />
20 ICC Life Sciences Center<br />
Briggs Chaney Parkand-Ride<br />
lot<br />
22.9 3<br />
21<br />
North Bethesda<br />
<strong>Transit</strong>way<br />
Montgomery Mall<br />
<strong>Transit</strong> Center<br />
Grosvenor Metrorail<br />
Station<br />
5.1 7<br />
23 Midcounty Highway<br />
Snowden Farm<br />
Parkway and<br />
Stringtown Road<br />
Shady Grove<br />
Metrorail Station<br />
13.4 10<br />
Total 148.3 150
Figure 4: Proposed BRT System Map<br />
<strong>MCDOT</strong> <strong>Countywide</strong> <strong>Bus</strong> <strong>Rapid</strong> <strong>Transit</strong> <strong>Study</strong><br />
Executive Summary (Draft)<br />
9
10<br />
THIS PAGE LEFT BLANK INTENTIONALLY.
4.2. Ridership and Operating Costs<br />
<strong>MCDOT</strong> <strong>Countywide</strong> <strong>Bus</strong> <strong>Rapid</strong> <strong>Transit</strong> <strong>Study</strong><br />
Executive Summary (Draft)<br />
The study applied the transit forecasting model developed by the <strong>Maryland</strong> <strong>Transit</strong><br />
Administration and accepted by the Federal <strong>Transit</strong> Administration for use on the Purple Line<br />
and Corridor Cities <strong>Transit</strong>way Alternative Analysis projects. Forecasts were developed for the<br />
proposed BRT network, and ridership and operating costs were determined for the planning<br />
forecast year of 2040. In addition to the 16 proposed BRT routes, the modeled transportation<br />
networks assumed some modified commuter local bus service to reflect enhanced commuter<br />
access to the western county and to other regional transit options.<br />
Model outputs used to determine ridership and operating costs were based on travel times<br />
developed from field work. Table 2 identifies the end-to-end travel times for the routes and<br />
compares highway and local bus travel times. Table 3 shows a similar comparison based on<br />
highway and local bus speeds and BRT speeds, as generated by the forecasting model.<br />
TABLE 2: FORECASTED (2040) TRAVEL TIMES (HIGHWAY, LOCAL BUS, BRT)<br />
BRT Time<br />
Savings over<br />
Local <strong>Bus</strong><br />
(min)<br />
% BRT Time<br />
Savings over<br />
Local <strong>Bus</strong><br />
Average Highway Average Local Average BRT<br />
Route Number Time (min) <strong>Bus</strong> Time (min) Time (min)<br />
3 20.5 28.1 19.5 8.6 31%<br />
4a 28.6 35.8 25.6 10.2 28%<br />
4b 15.1 20.7 18.7 2.0 10%<br />
5 19.3 28.8 22.4 6.4 22%<br />
7 30.1 42.1 33.1 9.0 21%<br />
8 31.9 42.6 29.2 13.4 31%<br />
10a 43.1 63.4 45.4 18.0 28%<br />
10b 34.2 50.2 34.7 15.5 31%<br />
11 32.6 45.0 38.1 6.9 15%<br />
12 19.1 26.4 20.5 5.9 22%<br />
14 16.9 22.5 17.3 5.2 23%<br />
18 17.5 24.7 16.1 8.6 35%<br />
19 40.9 55.7 38.2 17.5 31%<br />
20 37.7 41.7 37.7 4.0 10%<br />
21 11.7 16.8 14.5 2.3 14%<br />
23 32.7 42.7 32.7 10.0 23%<br />
Average 27.0 36.7 27.7 9.0 24%<br />
11
TABLE 3: FORECASTED (2040) TRAVEL SPEEDS (HIGHWAY, LOCAL BUS, AND BRT)<br />
12<br />
Route Number<br />
Average<br />
Highway<br />
Travel Speed<br />
(mph)<br />
Average Local<br />
<strong>Bus</strong> Speed<br />
(mph)<br />
Average BRT<br />
Travel Speed<br />
(mph)<br />
BRT Speed<br />
Increase<br />
over Local<br />
<strong>Bus</strong> (mph)<br />
% BRT Speed<br />
Increase over<br />
Local <strong>Bus</strong><br />
3 18.8 13.7 19.8 6.1 45%<br />
4a 20.3 16.2 22.7 6.5 40%<br />
4b 13.8 10.1 11.2 1.1 11%<br />
5 14.8 9.9 12.8 2.9 29%<br />
7 11.4 8.2 10.4 2.2 27%<br />
8 15.3 11.5 16.8 5.3 46%<br />
10a 19.1 13.0 18.1 5.1 39%<br />
10b 15.3 10.4 15.1 4.7 45%<br />
11 13.9 10.1 11.9 1.8 18%<br />
12 15.7 11.4 14.7 3.3 29%<br />
14 15.9 12.0 15.6 3.6 30%<br />
18 21.7 15.3 23.6 8.3 54%<br />
19 18.0 13.2 19.3 6.1 46%<br />
20 30.2 27.3 30.2 2.9 11%<br />
21 15.4 10.7 12.4 1.7 16%<br />
23 23.3 17.8 23.3 5.5 31%<br />
Average 17.7 13.2 17.4 4.2 32%<br />
Detailed analyses of forecasts (highway networks, land use, speeds, etc.) were developed for<br />
the year 2040 to determine the functioning of the system in the forecast planning horizon year.<br />
In response to a request from <strong>MCDOT</strong> staff, the consulting team also conducted an analysis of<br />
land use projections only for the year 2020 (keeping all other factors constant for 2040) as a<br />
method to determine information that could be used for later decision making on corridor<br />
phasing. This information is presented in Table 4 and Table 5 to provide context on assumed<br />
ridership and operating costs by the year 2040, as well as assumed by 2020. The forecasted<br />
ridership for 2040 is almost double the ridership for existing Ride On service throughout the<br />
county.
<strong>MCDOT</strong> <strong>Countywide</strong> <strong>Bus</strong> <strong>Rapid</strong> <strong>Transit</strong> <strong>Study</strong><br />
Executive Summary (Draft)<br />
TABLE 4: FORECASTED (2040) RIDERSHIP FOR BRT ROUTES (SORTED BY DAILY BOARDINGS PER ROUTE MILE, $2011)<br />
Route<br />
Number Route Name<br />
Daily Boardings<br />
Daily Boardings/<br />
Route Mile<br />
Required Peak<br />
Headway (min)<br />
% of 2040<br />
Achieved<br />
w/ 2020 LU<br />
10b MD 355 South 28,200 - 35,300 3,600 - 4,500 2.8 - 2.3 72%<br />
14 Randolph Road 16,000 - 20,000 3,500 - 4,400 3.9 - 3.2 82%<br />
4b MD 97/Georgia Avenue South 10,500 - 13,100 3,000 - 3,800 3.0 - 2.5 92%<br />
10a MD 355 North 37,600 - 47,000 2,700 - 3,400 2.4 - 2.0 72%<br />
21 North Bethesda T ransitway 8,200 - 10,200 2,700 - 3,400 4.6 - 3.8 80%<br />
18 MD 193/University Boulevard 14,600 - 18,300 2,300 - 2,900 2.9 - 2.5 84%<br />
5 Rockville Metro-LSC 10,000 - 12,500 2,100 - 2,600 5.9 - 4.9 77%<br />
3 MD 586/Veirs Mill Road 12,700 - 15,900 2,000 - 2,500 6.1 - 5.1 84%<br />
7 Lakeforest Mall/Muddy Branch Road 9,400 - 11,700 1,600 - 2,000 6.5 - 5.4 73%<br />
12 MD 187/Old Georgetown Road 7,700 - 9,600 1,500 - 1,900 7.0 - 5.8 95%<br />
4a MD 97/Georgia Avenue North 14,700 - 18,400 1,500 - 1,900 3.1 - 2.6 88%<br />
11 MD 650/New Hampshire Avenue 10,600 - 13,200 1,400 - 1,800 5.2 - 4.3 81%<br />
19 US 29 14,700 - 18,400 1,200 - 1,500 3.1 - 2.6 92%<br />
8 MD 185/Connecticut Avenue 6,600 - 8,300 800 - 1,000 5.7 - 4.7 94%<br />
23 Mid-County 6,700 - 8,400 600 - 700 6.8 - 5.7 83%<br />
20 ICC 4,900 - 6,100 200 - 300 8.1 - 6.8 44%<br />
Total 213,100 - 266,400 1,600 - 2,000 80%<br />
13
TABLE 5: OPERATION AND MAINTENANCE COSTS (2040) FOR BRT ROUTES (SORTED BY FAREBOX RECOVERY RATIOS, $2011)<br />
Route<br />
Number Route Name<br />
14<br />
Annual O&M Cost<br />
O&M Cost/<br />
Boarding<br />
Farebox Recovery<br />
14 Randolph Road $5,480,000 - $6,576,000 $0.92 - $1.11 87% - 69%<br />
3 MD 586/Veirs Mill Road $4,855,000 - $5,826,000 $1.03 - $1.23 78% - 62%<br />
5 Rockville Metro-LSC $4,580,000 - $5,496,000 $1.23 - $1.48 65% - 52%<br />
21 North Bethesda <strong>Transit</strong>way $3,827,000 - $4,592,400 $1.26 - $1.51 64% - 51%<br />
18 MD 193/University Boulevard $7,574,000 - $9,088,800 $1.39 - $1.67 58% - 46%<br />
12 MD 187/Old Georgetown Road $4,064,000 - $4,876,800 $1.42 - $1.70 56% - 45%<br />
10b MD 355 South $16,152,000 - $19,382,400 $1.54 - $1.84 52% - 42%<br />
4b MD 97/Georgia Avenue South $6,497,000 - $7,796,400 $1.66 - $1.99 48% - 39%<br />
7 Lakeforest Mall/Muddy Branch Rd $5,845,000 - $7,014,000 $1.67 - $2.00 48% - 38%<br />
10a MD 355 North $26,657,000 - $31,988,400 $1.90 - $2.28 42% - 34%<br />
4a MD 97/Georgia Avenue North $11,747,000 - $14,096,400 $2.14 - $2.57 37% - 30%<br />
11 MD 650/New Hampshire Avenue $8,495,000 - $10,194,000 $2.15 - $2.58 37% - 30%<br />
8 MD 185/Connecticut Avenue $6,836,000 - $8,203,200 $2.77 - $3.32 29% - 23%<br />
19 US 29 $15,735,000 - $18,882,000 $2.87 - $3.44 28% - 22%<br />
23 Mid-County $7,922,000 - $9,506,400 $3.15 - $3.78 25% - 20%<br />
20 ICC $8,230,000 - $9,876,000 $4.55 - $5.46 18% - 14%<br />
Total $144,496,000 - $173,395,200 - 44% - 35%<br />
* Farebox recovery ratio is the percentage of annual O&M costs regained from fares, based on an assumed trip fare.<br />
Ratio*
4.3. Capital Costs<br />
4.3.1 Capital Costs<br />
<strong>MCDOT</strong> <strong>Countywide</strong> <strong>Bus</strong> <strong>Rapid</strong> <strong>Transit</strong> <strong>Study</strong><br />
Executive Summary (Draft)<br />
The capital costs for the proposed network were derived using estimating methods. Unit costs<br />
used were taken from <strong>Maryland</strong> State Highway Administration’s 2010 Price Index. Professional<br />
experience on other BRT system and corridor studies nationwide, and documentation of unit<br />
costs from the FTA Characteristics of <strong>Bus</strong> <strong>Rapid</strong> <strong>Transit</strong> for Decision-Making report and TCRP<br />
Report 118: <strong>Bus</strong> <strong>Rapid</strong> <strong>Transit</strong> Practitioner’s Guide also were applied. The costs do not include<br />
right-of-way, as right-of-way was not assessed for this study.<br />
Costs comprise the following elements:<br />
BRT guideway and exclusive bus lane treatments.<br />
Intersection treatments: TSP and queue treatments, as well as widening of signalized<br />
intersections.<br />
Construction of station platforms, concrete bus pads for BRT vehicles serving curb-side<br />
stations while operating in mixed traffic.<br />
Articulated BRT vehicles.<br />
Maintenance facility.<br />
Add-ins, totaling 25 percent of route and system costs, include preliminary engineering, final<br />
design, construction management, insurance, and start-up costs for the system.<br />
40 percent contingency applied to guideways, intersection treatments, station elements, and<br />
maintenance facilities.<br />
The cost of the system, a network of approximately 150 route miles including all the elements<br />
listed previously, is estimated to be $2.5 billion (without right-of-way costs) in current year<br />
dollars. This reflects the cost of incorporating the highest level of design possible for the<br />
proposed BRT system. Actual total system costs would vary based on anticipated funding<br />
availability and implementation strategy.<br />
Table 6 summarizes the elements comprising the network.<br />
15
TABLE 6: SUMMARY OF TREATMENT ASSUMPTIONS FOR THE NETWORK<br />
Guideway and bus lane segments<br />
Queue jumps<br />
16<br />
two-way guideway only<br />
one-way guideway only<br />
guideway and bus lane<br />
bus lane (both directions)<br />
bus lane (one direction)<br />
Elements Quantity<br />
no guideway and bus lanes<br />
by location<br />
by direction<br />
Absolute total<br />
24 route miles<br />
48 route miles<br />
27 route miles<br />
1 route mile<br />
7 route miles<br />
44 route miles<br />
26 intersections<br />
37 queue jumps<br />
TSP 176 intersections<br />
Stations<br />
by location<br />
by platforms<br />
150 sites<br />
Concrete pads 209 pads<br />
367 (median and curb)<br />
Percentage of network<br />
16%<br />
32%<br />
18%<br />
< 1%<br />
Articulated vehicles 360 buses (peak period); 430 buses (total fleet)<br />
A 40 percent contingency was applied to the derived construction costs, given the conceptual<br />
nature of the study. This contingency does not assume right-of-way purchase. The consulting<br />
team allocated a portion of the estimated costs to utility modifications, pavement drainage, and<br />
maintenance of traffic. However, refined costs for elements such as major utility relocation and<br />
structures (including drainage structures and overhead lane use control structures) and offroadway<br />
stormwater detention were not included in the capital costs but would be covered by<br />
the construction contingency. The estimated capital costs derived for this study are to be<br />
considered only as a planning level assessment. More detailed studies identifying specific<br />
alignments, cross-sections, and roadway characteristics along each of the 16 routes would be<br />
required to develop a more specific estimate.<br />
5%<br />
29%
5. Key Considerations<br />
<strong>MCDOT</strong> <strong>Countywide</strong> <strong>Bus</strong> <strong>Rapid</strong> <strong>Transit</strong> <strong>Study</strong><br />
Executive Summary (Draft)<br />
This study presents a conceptual high-investment BRT network operating within the rights-ofway<br />
of county and state roadway corridors. While it provides a foundation for a viable network,<br />
several considerations must be addressed as individual routes are refined and prepared for<br />
implementation.<br />
5.1. Costs<br />
It is difficult to know all the impacts along a corridor based on the level of analysis consistent<br />
with a feasibility study. Constructing a high-investment BRT network affects elements such as<br />
right-of-way and utility relocation. While the consulting team allotted some of the capital costs<br />
and applied contingencies toward utility reconstruction and pavement drainage systems,<br />
detailed corridor studies would extensively document the infrastructure impacts of constructing<br />
and implementing BRT treatments. Additionally, detailed field reviews and measurements would<br />
identify specific right-of-way impacts expected. Again, right-of-way estimates are not included in<br />
the cost estimates generated by this study.<br />
5.2. Land use and BRT branding<br />
Two of the key BRT elements—land use and branding—can significantly affect system<br />
ridership. Additional studies should consider whether increased transit-oriented development is<br />
warranted along individual BRT corridors to help assure the viability of the system. The county<br />
should institute a branding campaign should this network advance to implementation. Attracting<br />
passengers who associate BRT with a form of premium transit service would be expected to<br />
increase the system’s chance of strong, sustained ridership.<br />
5.3. Implementation<br />
Next steps toward implementation based upon the findings of this study will be defined by the<br />
County Executive, County Council, <strong>MCDOT</strong>, M-NCPPC, <strong>Maryland</strong> State Highway<br />
Administration, and <strong>Maryland</strong> <strong>Transit</strong> Administration. Refined studies focused on specific<br />
corridors would identify more factors affecting the success of BRT routes, and consider the<br />
refined package of facility and service improvements based on anticipated funding availability.<br />
17