Spectral Unmixing Applied to Desert Soils for the - Naval ...
Spectral Unmixing Applied to Desert Soils for the - Naval ...
Spectral Unmixing Applied to Desert Soils for the - Naval ...

Create successful ePaper yourself
Turn your PDF publications into a flip-book with our unique Google optimized e-Paper software.
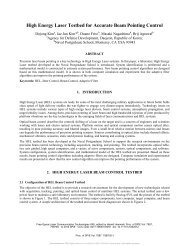
The absorption feature band depths <strong>for</strong> <strong>the</strong> ~500 nm, 1125 nm, and 2200 nm<br />
features are 0.0232, 0.0176, and 0.0304 <strong>for</strong> burnt clay (Table 1). The field road clay<br />
values were 0.052, 0.0193, 0.0745, gate clay values 0.057, 0.021, 0.0645, gopher till<br />
values 0.0419, 0.026, 0.073, home hill clay values 0.092, 0.0087, 0.137, and hard picnic<br />
area clay values 0.0805, 0.154, 0.000 (flat) are <strong>for</strong> 500 nm, 1125nm, and 2200 nm,<br />
respectively (Table 1). The continuum removed values are representative of <strong>the</strong> depths of<br />
<strong>the</strong> absorption features at each wavelength calculated using (5) and (6), and are thought<br />
<strong>to</strong> be associated with how <strong>the</strong> soil components are altered with various levels of<br />
disturbance. As previously mentioned, Clark and Roush (1984) discussed how <strong>the</strong> use of<br />
<strong>the</strong> continuum removed function allows one <strong>to</strong> analyze a spectrum that is not heavily<br />
influenced by <strong>the</strong> processes of o<strong>the</strong>r minerals in a mixture or those within <strong>the</strong> mineral<br />
itself. There<strong>for</strong>e, <strong>the</strong> depths of <strong>the</strong> absorption features and <strong>the</strong> changes occurring<br />
amongst <strong>the</strong>m must be related <strong>to</strong> some change in <strong>the</strong> intrinsic properties of <strong>the</strong> soils<br />
<strong>the</strong>mselves, as was suggested by Prose (1985) and postulated by this study.<br />
Table 1. This table lists <strong>the</strong> absorption feature depths <strong>for</strong> each soil spectrum<br />
using <strong>the</strong> continuum removed function and <strong>the</strong> deepest portion of <strong>the</strong><br />
feature. The values listed show changes in <strong>the</strong> depth of features <strong>for</strong> <strong>the</strong><br />
same material under different disturbance conditions <strong>for</strong> wavelengths of<br />
~500 nm, 1125 nm, and 2200 nm. The depths are ordered by least <strong>to</strong><br />
greatest disturbance and show, <strong>for</strong> <strong>the</strong> most part, a trend of decreasing<br />
depth, increasing depth, and decreasing depth at 500 nm, 1125 nm, and<br />
2200 nm, respectively.<br />
51