Spectral Unmixing Applied to Desert Soils for the - Naval ...
Spectral Unmixing Applied to Desert Soils for the - Naval ...
Spectral Unmixing Applied to Desert Soils for the - Naval ...

You also want an ePaper? Increase the reach of your titles
YUMPU automatically turns print PDFs into web optimized ePapers that Google loves.
<strong>the</strong> situation where mixing freedom within <strong>the</strong> pixel is halfway between <strong>the</strong> background-<br />
plus-noise freedom of a 0% filled pixel and <strong>the</strong> noise-only-freedom of <strong>the</strong> pixel filled <strong>to</strong><br />
50% (Boardman and Kruse, 2011). It is this concept that allows <strong>the</strong> MTMF process <strong>to</strong><br />
identify false positives by placing pixels well outside <strong>the</strong>ir plausible mixing freedom in<strong>to</strong><br />
an infeasible mixtures category. Finally, MTMF creates a distribution range <strong>for</strong> feasible<br />
mixtures (Boardman and Kruse, 2011). Fur<strong>the</strong>r details on <strong>the</strong> ma<strong>the</strong>matics behind this<br />
process are given in <strong>the</strong> paper by Boardman and Kruse (2011).<br />
The MNF process revealed that <strong>the</strong> eigenvalues <strong>for</strong> <strong>the</strong> AVIRIS<br />
f110512t01p00r07 flight log drop <strong>to</strong> 1 at approximately eigenvalue band 49, which<br />
means that <strong>the</strong> bands after eigenvalue band 49 contain mainly noise. Based on this, <strong>the</strong><br />
data were <strong>the</strong>n reduced from <strong>the</strong> initial 207 bands used <strong>to</strong> using only <strong>the</strong> first 50 bands in<br />
steps after <strong>the</strong> MNF process in order <strong>to</strong> eliminate noise from <strong>the</strong> data and providing a new<br />
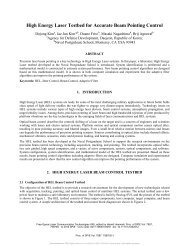
dimensionality of 50 (Figure 22).<br />
Figure 22. The plot (A) shows that <strong>the</strong> eigenvalues calculated <strong>for</strong> <strong>the</strong> image drop<br />
<strong>to</strong>ward 1 at approximately eigenvalue band 50, meaning that most of <strong>the</strong><br />
data in this band is noise. The bot<strong>to</strong>m figure (B) is a visualization of<br />
eigenvalue band 50, confirming that though <strong>the</strong>re is some signal present,<br />
band 50 is dominated by noise.<br />
As an example of <strong>the</strong> Pixel Purity Index (PPI) calculation using <strong>the</strong> f110512t01p00r07<br />
data set, <strong>the</strong> number of PPI iterations was set at <strong>the</strong> default setting of 5,000 iterations, and<br />
a PPI threshold value of 2.5. The resulting plot can be seen in Figure 23. When looking<br />
at <strong>the</strong> plot, <strong>the</strong> curve flattens off at around 2000 iterations, so <strong>the</strong> index was run a second<br />
time with 3000 iterations because 5000 seemed unnecessary. The lower iteration plot can<br />
45