building a STRONGER foundation - Cemex
building a STRONGER foundation - Cemex
building a STRONGER foundation - Cemex

You also want an ePaper? Increase the reach of your titles
YUMPU automatically turns print PDFs into web optimized ePapers that Google loves.
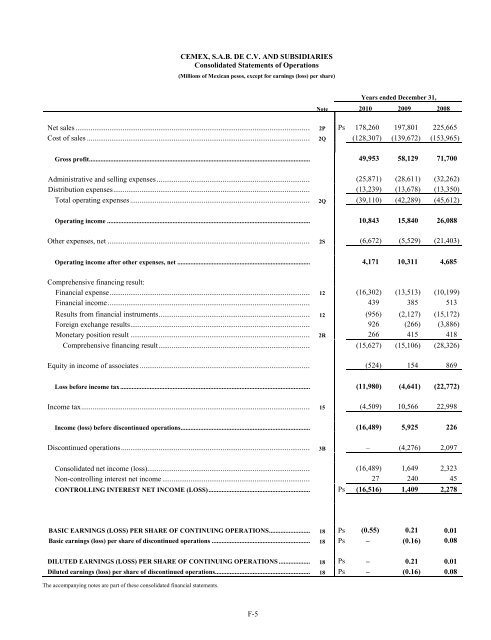
CEMEX, S.A.B. DE C.V. AND SUBSIDIARIES<br />
Consolidated Statements of Operations<br />
(Millions of Mexican pesos, except for earnings (loss) per share)<br />
F-5<br />
Years ended December 31,<br />
Note 2010 2009 2008<br />
Net sales ............................................................................................................................. 2P Ps 178,260 197,801 225,665<br />
Cost of sales ....................................................................................................................... 2Q (128,307) (139,672) (153,965)<br />
Gross profit....................................................................................................................................... 49,953 58,129 71,700<br />
Administrative and selling expenses .................................................................................. (25,871) (28,611) (32,262)<br />
Distribution expenses......................................................................................................... (13,239) (13,678) (13,350)<br />
Total operating expenses ................................................................................................ 2Q (39,110) (42,289) (45,612)<br />
Operating income ............................................................................................................................ 10,843 15,840 26,088<br />
Other expenses, net ............................................................................................................ 2S (6,672) (5,529) (21,403)<br />
Operating income after other expenses, net ................................................................................. 4,171 10,311 4,685<br />
Comprehensive financing result:<br />
Financial expense........................................................................................................... 12 (16,302) (13,513) (10,199)<br />
Financial income............................................................................................................ 439 385 513<br />
Results from financial instruments................................................................................. 12 (956) (2,127) (15,172)<br />
Foreign exchange results................................................................................................ 926 (266) (3,886)<br />
Monetary position result ................................................................................................ 2R 266 415 418<br />
Comprehensive financing result................................................................................. (15,627) (15,106) (28,326)<br />
Equity in income of associates ........................................................................................... (524) 154 869<br />
Loss before income tax.................................................................................................................... (11,980) (4,641) (22,772)<br />
Income tax.......................................................................................................................... 15 (4,509) 10,566 22,998<br />
Income (loss) before discontinued operations............................................................................... (16,489) 5,925 226<br />
Discontinued operations..................................................................................................... 3B – (4,276) 2,097<br />
Consolidated net income (loss)....................................................................................... (16,489) 1,649 2,323<br />
Non-controlling interest net income ............................................................................... 27 240 45<br />
CONTROLLING INTEREST NET INCOME (LOSS).............................................................. Ps (16,516) 1,409 2,278<br />
BASIC EARNINGS (LOSS) PER SHARE OF CONTINUING OPERATIONS......................... 18 Ps (0.55) 0.21 0.01<br />
Basic earnings (loss) per share of discontinued operations ............................................................ 18 Ps – (0.16) 0.08<br />
DILUTED EARNINGS (LOSS) PER SHARE OF CONTINUING OPERATIONS ................... 18 Ps – 0.21 0.01<br />
Diluted earnings (loss) per share of discontinued operations.......................................................... 18 Ps – (0.16) 0.08<br />
The accompanying notes are part of these consolidated financial statements.