chemical physics of discharges - Argonne National Laboratory
chemical physics of discharges - Argonne National Laboratory chemical physics of discharges - Argonne National Laboratory
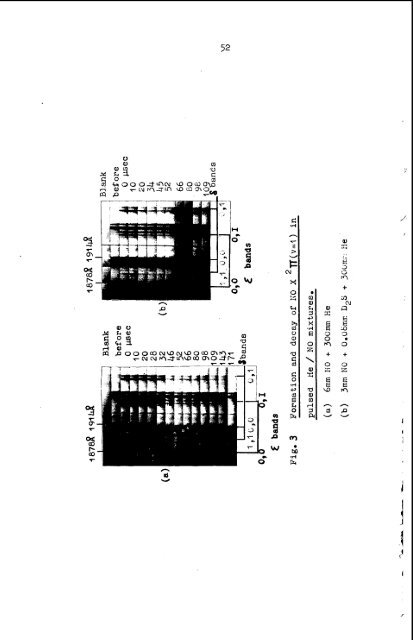
52 3 % %- %- 5- a- 7 h W P H 0 L v) a P o w L 0 + E! c n i3 W al =: .- E 3 (2 rr\ + 0 b=l N E e XJ 3 0 b + 3 z a E rn n P U
'3 (A'ncX'Z') 53 OH (A2Zf + X2n) >'is+ Formation ana decay of (a) cs : 2mm C S ~ + 60 mm He; (b) OH : 5 mm %O + 35 mm HE; (C) SH : 20 mm H28 + 100 mm He. 0.9
- Page 1 and 2: )i 1 reesonably complete and accura
- Page 3 and 4: 3 inquire about the component of ve
- Page 5 and 6: 4 I I 5 To find (t2)av, we assume t
- Page 7 and 8: \ vnich, it is noted can be negativ
- Page 9 and 10: I 7 than or smaller than the second
- Page 11 and 12: i I i I I I ) ) i L , I I . INT1:OD
- Page 13 and 14: 13 field per electron is and per co
- Page 15 and 16: . 11. 5. CharRe-Transfer and Ion-Mo
- Page 17 and 18: 17 In the followin:: sections much
- Page 19 and 20: above. With that EIN, an estimate o
- Page 21 and 22: 21 region in w!iich large, nighlv l
- Page 23 and 24: i ’ understanding: 23 (a) Electro
- Page 25 and 26: Obviously, the secondary ion must h
- Page 27 and 28: 27 (22) Franklin, J. L., Munson, M.
- Page 29 and 30: Tables 1-6 present examples of rela
- Page 31 and 32: Table 8 Some Ions Formed by Process
- Page 33 and 34: 33 velocity of the reacting partn r
- Page 35 and 36: 35 must be added to the Langevin cr
- Page 37 and 38: 37 In our laboratory a microwave di
- Page 39 and 40: + . 4 . r 39 as well as N in a cor0
- Page 41 and 42: ION-MOIECULE REACTION RATES MEASUFI
- Page 43 and 44: 43 excitntion 2onditions so that th
- Page 45 and 46: 45 In 2 like manner Fig. 3, showing
- Page 47: 47 Absorption Spectra of Transient
- Page 50 and 51: 50 maximum fiela. In this manner, a
- Page 54 and 55: References I I . A.B.Callear, J.A.G
- Page 56 and 57: ._ . _-.. - , , . . ,. . The Pyrex
- Page 58 and 59: 58 0 0 0 VI J > I cv . u H a
- Page 60: .... . 0 2 e I / m 0 H F4 : 1
- Page 63 and 64: \ 0.9 0.8 0.7 06 0.5 0.4 0.3 0.2 01
- Page 65 and 66: 65 ' cause of the reduction in the
- Page 67 and 68: INTRODUCTION I' Attachment of polar
- Page 69 and 70: I 69 EXPERIMENTAL The mass spectrom
- Page 71 and 72: + Figure 1 Mixed water and methanol
- Page 73 and 74: 73 ' , radius might be expected bec
- Page 75 and 76: 75 Negative Ion Mass Spectra of Som
- Page 77 and 78: A b 1 1 I H I I I FILAMEN T CONTINU
- Page 79 and 80: 79 for positive and negative ions,
- Page 81 and 82: 51 out to answer some of the questi
- Page 83 and 84: 93 INTERACTIONS OF EXCITED SPECIES
- Page 85 and 86: L 4 I*C z 0'2 = a, a U x I m 4 m 0
- Page 87 and 88: I L I, ; > > E Fig. 3 I50 200 150 1
- Page 89 and 90: I 300 r 1 - 200 i io ;' a cn I I. 0
- Page 91 and 92: where DISCUSSION OF XESULTS PERTAIN
- Page 93 and 94: 93 where the bar indicates values c
- Page 95 and 96: 'I i 'I 0 2. 4 6 8 2 [ N]* x' I 0-2
- Page 97 and 98: Fig. 14 IO 8 6 4F [NO] x IO-" (mole
- Page 99 and 100: for chemiluminescent excitation in
- Page 101 and 102: 101 Chemiluminescent Reactions of E
52<br />
3<br />
%<br />
%-<br />
%-<br />
5-<br />
a-<br />
7<br />
h<br />
W<br />
P<br />
H<br />
0<br />
L<br />
v)<br />
a<br />
P<br />
o w<br />
L<br />
0<br />
+<br />
E!<br />
c<br />
n<br />
i3<br />
W<br />
al<br />
=:<br />
.-<br />
E<br />
3<br />
(2<br />
rr\<br />
+<br />
0<br />
b=l N<br />
E<br />
e<br />
XJ<br />
3<br />
0<br />
b<br />
+<br />
3<br />
z<br />
a<br />
E<br />
rn<br />
n<br />
P<br />
U


