Voter Turnout Rates from a Comparative ... - International IDEA
Voter Turnout Rates from a Comparative ... - International IDEA
Voter Turnout Rates from a Comparative ... - International IDEA

You also want an ePaper? Increase the reach of your titles
YUMPU automatically turns print PDFs into web optimized ePapers that Google loves.
<strong>Voter</strong> <strong>Turnout</strong><br />
<strong>Voter</strong> <strong>Turnout</strong> <strong>Rates</strong><br />
<strong>from</strong> a <strong>Comparative</strong> Perspective<br />
By Rafael López Pintor,<br />
Maria Gratschew and Kate Sullivan<br />
This section provides a brief overview of<br />
worldwide voter turnout statistics since<br />
1945 for both parliamentary and presidential<br />
elections. It is based on the <strong>International</strong><br />
<strong>IDEA</strong> database of elections, which covers<br />
170 independent states and includes data<br />
for 1,256 parliamentary elections and 412<br />
presidential elections. It examines trends<br />
over time since 1945, such as differences in<br />
turnout between geographical regions and<br />
between different types of electoral systems.<br />
Finally, the survey provides some<br />
comparison between voter turnout and<br />
selected political, institutional and socio-economic<br />
factors that are often cited as determinants<br />
of differing voter turnout rates. All<br />
figures refer to parliamentary elections<br />
unless otherwise indicated.<br />
OPERATIONALIZING VOTER<br />
TURNOUT<br />
<strong>Voter</strong> turnout is one measure of citizen participation<br />
in politics. It is usually expressed<br />
as the percentage of voters who cast a vote<br />
(i.e., “turnout”) at an election. This total<br />
number of voters includes those who cast<br />
blank or invalid votes, as they still participate.<br />
75
The pool of eligible voters can be defined<br />
in different ways. <strong>International</strong> <strong>IDEA</strong> uses<br />
two measures: the number of registered<br />
voters and estimated voting age population<br />
(VAP). Information on the number of registered<br />
voters has been compiled <strong>from</strong> electoral<br />
management bodies around the world<br />
and an estimate on voting age population<br />
has been made using population statistics<br />
<strong>from</strong> the United Nations. Further information<br />
on the methodology can be found on page 9.<br />
There are advantages and disadvantages in<br />
using either of these calculations as the<br />
basis for turnout statistics. Registration is<br />
useful in that in many countries it is a prerequisite<br />
for voting, so the number of registered<br />
voters reflects those who may actually<br />
be able to cast a vote. However, in some<br />
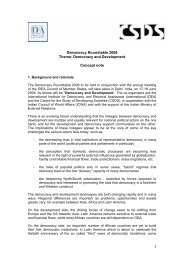
Figure 9: Worldwide turnout, 1945-2001<br />
%<br />
90<br />
85<br />
80<br />
75<br />
70<br />
65<br />
vote/registration<br />
vote/VAP<br />
Key: VAP=voting age population.<br />
<strong>Voter</strong> <strong>Turnout</strong> <strong>Rates</strong> <strong>from</strong> a <strong>Comparative</strong> Perspective<br />
countries registration may not be used or<br />
the register itself may be inaccurate.<br />
The use of voting age population allows for<br />
an estimate of the potential number of voters,<br />
were all systemic and administrative<br />
barriers to be removed. However, as an estimate,<br />
it is not able to exclude those within a<br />
population who may not be eligible for registration<br />
or voting due to factors such as<br />
non-citizenship, mental competence or<br />
imprisonment.<br />
The material presented here is a summary<br />
both of the tables later in this book and of<br />
the data collected for the <strong>International</strong> <strong>IDEA</strong><br />
<strong>Voter</strong> <strong>Turnout</strong> Database. More information<br />
on the database can be found in this report’s<br />
appendix and at <strong>International</strong> <strong>IDEA</strong>’s website<br />
at www.idea.int/turnout.<br />
1945-1949 1950-1959 1960-1969 1970-1979 1980-1989 1990-2001<br />
76 <strong>Voter</strong> <strong>Turnout</strong> Since 1945 A Global Report
100<br />
90<br />
80<br />
70<br />
60<br />
50<br />
40<br />
Figure 9: Worldwide turnout, 1945-2001<br />
shows a notable decline in voter turnout<br />
since the mid-1980s. This decline is similar<br />
whether turnout is measured as a percentage<br />
of registration or as a percentage of the<br />
voting age population. However, this global<br />
trend is not consistently reflected across<br />
regions.<br />
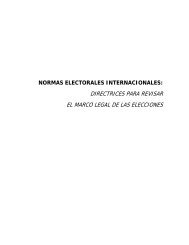
Figure 10: <strong>Turnout</strong> by region over time<br />
Africa experienced a pronounced increase in<br />
turnout, riding the wave of democratization<br />
to the mid-1980s. After ten years of elections,<br />
Central and East European countries<br />
are still increasing voter turnout. <strong>Turnout</strong> in<br />
North and South American countries has<br />
<strong>Voter</strong> <strong>Turnout</strong><br />
Figure 10: <strong>Turnout</strong> by region over time<br />
Vote to registration ratio by region over time, parliamentary elections, 1945-2001<br />
1945-1949 1950-1959 1960-1969 1970-1979 1980-1989 1990-2001<br />
Oceania<br />
Central & South<br />
America<br />
Source: <strong>International</strong> <strong>IDEA</strong>.<br />
Western Europe<br />
Asia<br />
North America<br />
Middle East<br />
Africa<br />
Central & Eastern Europe<br />
remained stable across the time period, as<br />
has that of Oceania and Western Europe.<br />
The Middle East has a varied turnout record,<br />
but Asia has seen the most pronounced variations.<br />
Average turnout <strong>from</strong> 1990 to 2001 peaked<br />
at 79 percent in Oceania, just ahead of<br />
Western Europe with 78 percent. Both Asia<br />
and the Central and Eastern European<br />
region had average voter turnout of 72 percent.<br />
The average in Central and South<br />
America was 69 percent; the average in<br />
North America and the Caribbean was 65<br />
percent, the same as in the Middle East.<br />
Africa’s average turnout was the lowest at<br />
64 percent.<br />
77
Figure 11: League table by country<br />
vote to registration ratio, parliamentary<br />
elections, 1945-2001<br />
Country (no. of elections) vote/reg %<br />
1 Australia(22) 94.5<br />
2 Singapore(8) 93.5<br />
3 Uzbekistan(3) 93.5<br />
4 Liechtenstein(17) 92.8<br />
5 Belgium(18) 92.5<br />
6 Nauru(5) 92.4<br />
7 Bahamas(6) 91.9<br />
8 Indonesia(7) 91.5<br />
9 Burundi(1) 91.4<br />
10 Austria(17) 91.3<br />
11 Angola(1) 91.2<br />
12 Mongolia(4) 91.1<br />
13 New Zealand(19) 90.8<br />
14 Cambodia(2) 90.3<br />
15 Italy(15) 89.8<br />
16 Luxembourg(12) 89.7<br />
17 Cyprus(7) 89.7<br />
18 Iceland(17) 89.5<br />
19 South Africa(1) 89.3<br />
20 Cook Islands(1) 89.0<br />
21 Tajikistan(2) 88.7<br />
22 Guyana(7) 88.5<br />
23 Thailand(15) 88.3<br />
24 Malta(14) 88.2<br />
25 Albania(4) 88.0<br />
26 Netherlands(16) 87.5<br />
27 Sweden(17) 87.1<br />
28 Seychelles(2) 86.6<br />
39 Tunisia(5) 86.2<br />
30 Malawi(2) 86.2<br />
31 East Timor(1) 86.0<br />
32 Denmark(22) 85.9<br />
33 Germany(14) 85.4<br />
34 Slovakia(4) 85.2<br />
35 Mauritius(6) 84.4<br />
36 Argentina(18) 84.2<br />
37 Czech Republic(4) 82.8<br />
38 Western Samoa(3) 82.3<br />
39 Bolivia(11) 82.2<br />
40 Tuvalu(2) 81.9<br />
41 Palau(6) 81.7<br />
<strong>Voter</strong> <strong>Turnout</strong> <strong>Rates</strong> <strong>from</strong> a <strong>Comparative</strong> Perspective<br />
42 Bulgaria(4) 81.4<br />
43 Andorra(3) 81.4<br />
44 Turkey(10) 81.3<br />
45 Fiji(3) 81.0<br />
46 Philippines(7) 80.9<br />
47 Belize(5) 80.4<br />
48 Norway(15) 80.4<br />
49 Peru(9) 80.3<br />
50 Israel(15) 80.3<br />
51 Venezuela(10) 80.0<br />
52 Uruguay(11) 80.0<br />
53 Greece(16) 79.9<br />
54 Kuwait(5) 79.6<br />
55 Chile(11) 78.9<br />
56 Latvia(4) 78.7<br />
57 Namibia(3) 78.6<br />
58 Aruba(3) 78.5<br />
59 Bahrain(1) 78.4<br />
60 San Marino(7) 78.4<br />
61 Paraguay(9) 78.3<br />
62 Mozambique(2) 78.0<br />
63 Kiribati(4) 77.9<br />
64 Brazil(14) 77.8<br />
65 Costa Rica(12) 77.7<br />
66 Iran(1) 77.3<br />
67 Azerbaijan(2) 77.0<br />
68 Portugal(10) 77.0<br />
69 Slovenia(3) 76.6<br />
70 Kazakhstan(1) 76.2<br />
71 Finland(16) 76.0<br />
72 Nicaragua(6) 75.9<br />
73 Panama(4) 75.5<br />
74 Armenia(2) 75.4<br />
75 Palestinian Authority(1) 75.4<br />
76 United Kingdom(16) 75.2<br />
77 Tanzania(2) 74.6<br />
78 Dominica(12) 74.4<br />
79 Sri Lanka(11) 74.3<br />
80 St. Kitts & Nevis(11) 74.2<br />
81 Suriname(6) 74.2<br />
82 Cameroon(4) 74.0<br />
83 Canada(18) 73.9<br />
84 France(15) 73.8<br />
85 Spain(8) 73.6<br />
86 Gambia(5) 73.4<br />
87 Ireland(16) 73.3<br />
88 Ukraine(2) 73.2<br />
78 <strong>Voter</strong> <strong>Turnout</strong> Since 1945 A Global Report
89 Republic of Korea(10) 72.9<br />
90 Honduras(11) 72.8<br />
91 Moldova(3) 72.8<br />
92 Romania(3) 72.5<br />
93 Madagascar(5) 72.5<br />
94 St. Vincent & the Grenadines(14) 72.2<br />
95 Lesotho(4) 72.1<br />
96 Maldives(2) 72.0<br />
97 Togo(2) 71.9<br />
98 Malaysia(6) 71.5<br />
99 Morocco(5) 71.2<br />
100 Croatia(3) 71.2<br />
101 Democratic Rep. of Congo(1) 70.9<br />
102 Monaco(7) 70.9<br />
103 Uganda(3) 70.8<br />
104 Yemen(2) 70.7<br />
105 Taiwan (Republic of China)(5) 70.5<br />
106 Comoros Islands(2) 70.3<br />
107 Grenada(6) 70.3<br />
108 Anguilla(8) 69.5<br />
109 Japan(22) 69.5<br />
110 Nepal(7) 69.1<br />
111 Ecuador(12) 68.9<br />
112 Georgia(3) 68.9<br />
113 Barbados(11) 68.8<br />
114 Cap Verde(3) 68.6<br />
115 Vanuatu(5) 68.3<br />
116 Estonia(4) 68.1<br />
117 Jamaica(12) 68.1<br />
118 Hungary(3) 67.0<br />
119 Dominican Republic(6) 66.6<br />
120 United States of America(17) 66.5<br />
121 Benin(3) 65.9<br />
122 Mexico(19) 65.2<br />
123 Sao Tome e Principe(3) 64.5<br />
124 Papua New Guinea(8) 64.1<br />
125 St. Lucia(12) 64.1<br />
126 Solomon Islands(4) 63.8<br />
127 Trinidad & Tobago(12) 63.3<br />
128 Central African Republic(2) 63.2<br />
129 Burma(2) 62.7<br />
130 Kyrgyzstan(3) 62.5<br />
131 Guinea Bissau(2) 62.5<br />
132 Algeria(2) 62.3<br />
133 Antigua & Barbuda(11) 62.2<br />
134 Kenya(2) 62.1<br />
135 Guinea(1) 61.9<br />
<strong>Voter</strong> <strong>Turnout</strong><br />
136 Syria(1) 61.2<br />
137 Botswana(6) 60.7<br />
138 Belarus(2) 60.6<br />
139 Sierra Leone(1) 60.3<br />
140 Bosnia & Herzegovina(3) 60.2<br />
141 India(13) 59.4<br />
142 Russia(3) 58.4<br />
143 Bangladesh(6) 58.2<br />
144 Sudan(2) 57.6<br />
145 Switzerland(14) 56.5<br />
146 Tonga(4) 56.3<br />
147 Niger(3) 56.2<br />
148 Macedonia(2) 54.1<br />
149 Senegal(6) 53.8<br />
150 Lithuania(3) 52.7<br />
151 Djibouti(2) 52.6<br />
152 Jordan(3) 51.8<br />
153 Zambia(3) 51.7<br />
154 Guatemala(16) 51.6<br />
155 Ghana(6) 50.5<br />
156 Poland(5) 50.3<br />
157 Nigeria(3) 50.3<br />
158 Chad(1) 50.1<br />
159 El Salvador(11) 49.6<br />
160 Zimbabwe(3) 48.7<br />
161 Colombia(18) 47.6<br />
162 Haiti(3) 47.1<br />
163 Mauritania(2) 45.5<br />
164 Pakistan(6) 45.3<br />
165 Egypt(5) 45.1<br />
166 Burkina Faso(4) 41.7<br />
167 Lebanon(3) 39.5<br />
168 Ivory Coast(2) 37.0<br />
169 Mali(2) 21.3<br />
Key: no.=number of elections.<br />
* Argentina included women in the franchise <strong>from</strong> 1947.<br />
* Bahrain only includes men in the franchise.<br />
* Belgium included women in the franchise <strong>from</strong> 1948.<br />
* Czech Republic includes elections in Czechoslovakia 1990<br />
and 1992.<br />
* Greece included women in the franchise <strong>from</strong> 1986.<br />
* Kuwait only includes men in the franchise.<br />
* Liechtenstein included women in the franchise <strong>from</strong><br />
1986.<br />
* Switzerland included women in the franchise <strong>from</strong> 1971.<br />
79
COMPARING TURNOUT<br />
ACROSS NATIONS<br />
Figure 11, p.78 shows the turnout ranking<br />
for all countries in the <strong>International</strong> <strong>IDEA</strong><br />
database. The high ranking of certain countries<br />
may be a surprise; it certainly refutes<br />
the notion that only Western countries have<br />
high voter turnout.<br />
Figure 12: League table by region,<br />
vote to registration ratio.<br />
Ranking of average turnout since 1945<br />
Country (no. of elections)vote/reg %<br />
Oceania<br />
Australia(22) 94.5<br />
Nauru(5) 92.4<br />
New Zealand(19) 90.8<br />
Cook Islands(1) 89.0<br />
Western Samoa(3) 82.3<br />
Tuvalu(2) 81.9<br />
Palau(6) 81.7<br />
Fiji(3) 81.0<br />
Kiribati(4) 77.9<br />
Vanuatu(5) 68.3<br />
Papua New Guinea(8) 64.1<br />
Solomon Islands(4) 63.8<br />
Tonga(4) 56.3<br />
Average(86) 83.1<br />
Western Europe<br />
Liechtenstein(17) 92.8<br />
Belgium(18) 92.5<br />
Austria(17) 91.3<br />
Italy(15) 89.8<br />
Luxembourg(12) 89.7<br />
Cyprus(7) 89.7<br />
Iceland(17) 89.5<br />
Malta(14) 88.2<br />
Netherlands(16) 87.5<br />
Sweden(17) 87.1<br />
<strong>Voter</strong> <strong>Turnout</strong> <strong>Rates</strong> <strong>from</strong> a <strong>Comparative</strong> Perspective<br />
This table is based on voter turnout as a<br />
percentage of registered voters, which may<br />
explain some apparent anomalies. <strong>Turnout</strong><br />
may be high if a voters’ register is not of<br />
high quality or is outdated. Five of the top<br />
seven countries - Australia, Nauru,<br />
Singapore, Belgium, and Liechtenstein -<br />
enforce compulsory voting laws, which may<br />
explain their high turnout.<br />
Denmark(22) 85.9<br />
Germany(14) 85.4<br />
Andorra(3) 81.4<br />
Turkey(10) 81.3<br />
Norway(15) 80.4<br />
Greece(16) 79.9<br />
San Marino(7) 78.4<br />
Portugal(10) 77.0<br />
Finland(16) 76.0<br />
United Kingdom(16) 75.2<br />
France(15) 73.8<br />
Spain(8) 73.6<br />
Ireland(16) 73.3<br />
Monaco(7) 70.9<br />
Switzerland(14) 56.5<br />
Average(339) 82.6<br />
North America<br />
Bahamas(6) 91.9<br />
Aruba(3) 78.5<br />
Dominica(12) 74.4<br />
St. Kitts & Nevis(11) 74.2<br />
Canada(18) 73.9<br />
St. Vincent & the Grenadines(14) 72.2<br />
Grenada(6) 70.3<br />
Anguilla(8) 69.5<br />
Barbados(11) 68.8<br />
Jamaica(12) 68.1<br />
Dominican Republic(6) 66.6<br />
United States of America(17) 66.5<br />
St. Lucia(12) 64.1<br />
Trinidad & Tobago(12) 63.3<br />
Antigua & Barbuda(11) 62.2<br />
Haiti(3) 47.1<br />
Average(162) 69.6<br />
80 <strong>Voter</strong> <strong>Turnout</strong> Since 1945 A Global Report
Africa<br />
Burundi(1) 91.4<br />
Angola(1) 91.2<br />
South Africa(1) 89.3<br />
Seychelles(2) 86.6<br />
Tunisia(5) 86.2<br />
Malawi(2) 86.2<br />
Mauritius(6) 84.4<br />
Namibia(3) 78.6<br />
Mozambique(2) 78.0<br />
Tanzania(2) 74.6<br />
Cameroon(4) 74.0<br />
Gambia(5) 73.4<br />
Madagascar(5) 72.5<br />
Lesotho(4) 72.1<br />
Togo(2) 71.9<br />
Morocco(5) 71.2<br />
Democratic Republic of Congo(1) 70.9<br />
Uganda(3) 70.8<br />
Comoros Islands(2) 70.3<br />
Cap Verde(3) 68.6<br />
Benin(3) 65.9<br />
Sao Tome e Principe(3) 64.5<br />
Central African Republic(2) 63.2<br />
Guinea Bissau(2) 62.5<br />
Algeria(2) 62.3<br />
Kenya(2) 62.1<br />
Guinea(1) 61.9<br />
Botswana(6) 60.7<br />
Sierra Leone(1) 60.3<br />
Sudan(2) 57.6<br />
Niger(3) 56.2<br />
Senegal(6) 53.8<br />
Djibouti(2) 52.6<br />
Zambia(3) 51.7<br />
Ghana(6) 50.5<br />
Nigeria(3) 50.3<br />
Chad(1) 50.1<br />
Zimbabwe(3) 48.7<br />
Mauritania(2) 45.5<br />
Egypt(5) 45.1<br />
Burkina Faso(4) 41.7<br />
Ivory Coast(2) 37.0<br />
Mali(2) 21.3<br />
Average(126) 64.5<br />
<strong>Voter</strong> <strong>Turnout</strong><br />
Central & South America<br />
Guyana(7) 88.5<br />
Argentina(18) 84.2<br />
Bolivia(11) 82.2<br />
Belize(5) 80.4<br />
Peru(9) 80.3<br />
Venezuela(10) 80.0<br />
Uruguay(11) 80.0<br />
Chile(11) 78.9<br />
Paraguay(9) 78.3<br />
Brazil(14) 77.8<br />
Costa Rica(12) 77.7<br />
Nicaragua(6) 75.9<br />
Panama(4) 75.5<br />
Suriname(6) 74.2<br />
Honduras(11) 72.8<br />
Ecuador(12) 68.9<br />
Mexico(19) 65.2<br />
Guatemala(16) 51.6<br />
El Salvador(11) 49.6<br />
Colombia(18) 47.6<br />
Average(220) 71.5<br />
Asia<br />
Singapore(8) 93.5<br />
Indonesia(7) 91.5<br />
Mongolia(4) 91.1<br />
Cambodia(2) 90.3<br />
Thailand(15) 88.3<br />
East Timor(1) 86.0<br />
Philippines(7) 80.9<br />
Sri Lanka(11) 74.3<br />
Republic of Korea(10) 72.9<br />
Maldives(2) 72.0<br />
Malaysia(6) 71.5<br />
Taiwan (Republic of China)(5) 70.5<br />
Japan(22) 69.5<br />
Nepal(7) 69.1<br />
Burma(2) 62.7<br />
India(13) 59.4<br />
Bangladesh(6) 58.2<br />
Pakistan(6) 45.3<br />
Average(134) 74.0<br />
81
(...Figure 12)<br />
Middle East<br />
Israel(15) 80.3<br />
Kuwait(5) 79.6<br />
Bahrain(1) 78.4<br />
Iran(1) 77.3<br />
Palestinian Authority(1) 75.4<br />
Yemen(2) 70.7<br />
Syria(1) 61.2<br />
Jordan(3) 51.8<br />
Lebanon(3) 39.5<br />
Average(32) 72.2<br />
Central & Eastern Europe<br />
Uzbekistan(3) 93.5<br />
Tajikistan(2) 88.7<br />
Albania(4) 88.0<br />
Slovakia(4) 85.2<br />
Czech Republic(4) 82.8<br />
Bulgaria(4) 81.4<br />
Latvia(4) 78.7<br />
Azerbaijan(2) 77.0<br />
Slovenia(3) 76.6<br />
Kazakhstan(1) 76.2<br />
Armenia(2) 75.4<br />
Ukraine(2) 73.2<br />
Moldova(3) 72.8<br />
Romania(3) 72.5<br />
Croatia(3) 71.2<br />
Georgia(3) 68.9<br />
Estonia(4) 68.1<br />
Hungary(3) 67.0<br />
Kyrgyzstan(3) 62.5<br />
Belarus(2) 60.6<br />
Bosnia & Herzegovina(3) 60.2<br />
Russia(3) 58.4<br />
Macedonia(2) 54.1<br />
Lithuania(3) 52.7<br />
Poland(5) 50.3<br />
Average(75) 71.9<br />
Key: no.=number of elections.<br />
<strong>Voter</strong> <strong>Turnout</strong> <strong>Rates</strong> <strong>from</strong> a <strong>Comparative</strong> Perspective<br />
If this data is presented regionally, the differences<br />
within each region can be seen<br />
more clearly. The difference between the<br />
highest and lowest average turnout in<br />
Western Europe - Liechtenstein’s 93 percent<br />
and neighbouring Switzerland’s 56 percent -<br />
may be explained by the use of compulsory<br />
voting in Liechtenstein. On the other hand<br />
the Bahamas enjoys a non-compulsory average<br />
of 92 percent, compared to the Haitian<br />
average of 47 percent. ( Figure 12)<br />
<strong>Turnout</strong> by population<br />
If we rank countries according to turnout as<br />
a percentage of voting age population, the<br />
results are quite different. Our estimate of<br />
voting age population is based on an estimate<br />
of the adult population, and does not<br />
account for legal or systemic barriers to registration.<br />
None of the top ten countries <strong>from</strong> Figure<br />
11 are among the top ten when we express<br />
turnout as a percentage of voting age population;<br />
however five countries maintain their<br />
top twenty ranking (Uzbekistan, New<br />
Zealand, Belgium, Austria and Australia).<br />
Countries <strong>from</strong> diverse regions are among<br />
the top ten: three <strong>from</strong> Africa, three <strong>from</strong><br />
Western Europe, two <strong>from</strong> Asia, one <strong>from</strong><br />
Central and Eastern Europe, and one <strong>from</strong><br />
Latin America.<br />
82 <strong>Voter</strong> <strong>Turnout</strong> Since 1945 A Global Report
Figure 13: League table by country. vote<br />
to voting age population ratio.<br />
Parliamentary elections. 1945-2001<br />
Country (no. of elections) vote/vap %<br />
1 Suriname(8) 93.8<br />
2 Comoros Islands(2) 93.6<br />
3 Seychelles(2) 93.1<br />
4 Albania(5) 92.4<br />
5 Italy(15) 92.0<br />
6 Cambodia(2) 90.5<br />
7 Iceland(17) 89.3<br />
8 Angola(1) 88.3<br />
9 Portugal(10) 88.2<br />
10 Indonesia(7) 87.9<br />
11 Uzbekistan(3) 87.7<br />
12 Cook Islands(1) 87.3<br />
13 Somalia(1) 87.1<br />
14 Malawi(2) 86.9<br />
15 Western Samoa(3) 86.4<br />
16 Guyana(8) 86.0<br />
17 New Zealand(19) 86.0<br />
18 Belgium(18) 84.8<br />
19 Austria(17) 84.4<br />
20 Australia(22) 84.2<br />
21 Sweden(17) 84.1<br />
22 Netherlands(16) 83.8<br />
23 Denmark(22) 83.6<br />
24 Slovakia(4) 82.9<br />
25 Czech Republic(4) 82.8<br />
26 Canada(18) 82.6<br />
27 San Marino(7) 82.5<br />
28 Mauritius(7) 82.4<br />
29 Thailand(14) 82.1<br />
30 Palau(1) 81.7<br />
31 Greece(18) 80.8<br />
32 Aruba(3) 80.4<br />
33 Israel(15) 80.3<br />
34 Germany(14) 80.2<br />
35 Mongolia(4) 79.5<br />
36 Norway(15) 79.2<br />
37 Tajikistan(2) 79.0<br />
38 Malta(14) 78.9<br />
39 Finland(16) 78.1<br />
40 Slovenia(3) 77.9<br />
41 Croatia(3) 77.2<br />
42 Spain(8) 76.4<br />
43 Bulgaria(4) 76.1<br />
<strong>Voter</strong> <strong>Turnout</strong><br />
44 Uruguay(11) 76.1<br />
45 Maldives(2) 76.0<br />
46 Namibia(3) 75.7<br />
47 Burundi(1) 75.4<br />
48 Palestinian Authority(1) 75.4<br />
49 Ireland(16) 74.9<br />
50 South Africa(2) 74.7<br />
51 Turkey(10) 74.2<br />
52 St. Vincent & the Grenadines(14)74.1<br />
53 United Kingdom(16) 73.8<br />
54 Republic of Korea(10) 72.9<br />
55 Dominica(12) 72.9<br />
56 Cap Verde(3) 72.4<br />
57 Papua New Guinea(8) 72.2<br />
58 Romania(3) 72.2<br />
59 Azerbaijan(2) 71.9<br />
60 Cyprus(7) 71.4<br />
61 Ukraine(2) 70.8<br />
62 Taiwan (Republic of China)(4) 70.1<br />
63 Togo(4) 69.3<br />
64 Argentina(18) 69.3<br />
65 Japan(22) 68.7<br />
66 Costa Rica(13) 68.1<br />
67 Hungary(3) 68.1<br />
68 Dominican Republic(11) 67.8<br />
69 Lebanon(3) 67.8<br />
70 Iran(2) 67.6<br />
71 France(15) 67.3<br />
72 Belize(5) 67.2<br />
73 Venezuela(11) 67.2<br />
74 Algeria(2) 67.1<br />
75 Nepal(7) 67.0<br />
76 Trinidad & Tobago(12) 66.5<br />
77 Madagascar(5) 66.1<br />
78 Grenada(12) 66.1<br />
79 Vanuatu(5) 65.7<br />
80 Fiji(3) 64.9<br />
81 Lesotho(4) 64.3<br />
82 Barbados(11) 63.9<br />
83 Georgia(3) 63.7<br />
84 Liechtenstein(17) 63.6<br />
85 Luxembourg(13) 63.5<br />
86 Bahamas(6) 63.4<br />
87 St. Lucia(13) 62.5<br />
88 Sri Lanka(11) 62.4<br />
89 Kiribati(5) 62.4<br />
90 Mozambique(2) 62.3<br />
91 Benin(3) 62.0<br />
83
92 Nicaragua(10) 62.0<br />
93 Moldova(3) 61.6<br />
94 India(13) 61.5<br />
95 Bolivia(13) 61.4<br />
96 Philippines(7) 60.6<br />
97 St. Kitts & Nevis(11) 60.6<br />
98 Latvia(4) 60.3<br />
99 Guinea(1) 59.9<br />
100 Andorra(3) 59.5<br />
101 Solomon Islands(5) 59.0<br />
102 Belarus(2) 58.9<br />
103 Jamaica(12) 58.6<br />
104 Bosnia & Herzegovina(3) 58.3<br />
105 Syria(1) 58.0<br />
106 Panama(5) 58.0<br />
107 Tunisia(5) 57.9<br />
108 Malaysia(8) 57.8<br />
109 Anguilla(2) 57.7<br />
110 Morocco(5) 57.6<br />
111 Lithuania(3) 56.9<br />
112 Russia(3) 56.6<br />
113 Sao Tome e Principe(3) 56.6<br />
114 Paraguay(11) 56.0<br />
115 Niger(3) 56.0<br />
116 Bangladesh(6) 56.0<br />
117 Gambia(6) 55.8<br />
118 Zimbabwe(6) 55.7<br />
119 Honduras(12) 55.3<br />
120 Peru(9) 54.8<br />
121 Kyrgyzstan(3) 54.3<br />
122 Cameroon(4) 53.9<br />
123 Estonia(4) 53.5<br />
124 Guinea Bissau(2) 52.6<br />
125 Tonga(3) 52.4<br />
126 Central African Republic(2) 51.9<br />
127 Switzerland(14) 51.9<br />
128 Poland(5) 51.4<br />
129 Singapore(8) 51.2<br />
130 Uganda(3) 50.6<br />
131 Burma(2) 50.0<br />
132 Antigua & Barbuda(11) 49.6<br />
133 Haiti(3) 48.8<br />
134 Macedonia(2) 48.4<br />
135 Brazil(14) 48.2<br />
136 Mexico(19) 48.1<br />
137 Armenia(2) 48.0<br />
138 United States of America(28) 47.7<br />
139 Nigeria(3) 47.6<br />
<strong>Voter</strong> <strong>Turnout</strong> <strong>Rates</strong> <strong>from</strong> a <strong>Comparative</strong> Perspective<br />
140 Sierra Leone(3) 46.8<br />
141 Tanzania(2) 46.8<br />
142 Botswana(7) 46.2<br />
143 Micronesia(2) 46.2<br />
144 Ghana(6) 46.1<br />
145 Chile(11) 45.9<br />
146 Mauritania(2) 45.1<br />
147 El Salvador(16) 43.9<br />
148 Kenya(2) 43.8<br />
149 Ecuador(15) 42.6<br />
150 Senegal(7) 42.3<br />
151 Zambia(3) 41.4<br />
152 Pakistan(6) 40.7<br />
153 Democratic Rep. of Congo(2) 39.0<br />
154 Nauru(8) 38.8<br />
155 Burkina Faso(4) 38.4<br />
156 Yemen(2) 36.8<br />
157 Colombia(20) 36.2<br />
158 Bahrain(1) 32.6<br />
159 Sudan(2) 32.0<br />
160 Ivory Coast(2) 31.9<br />
161 Jordan(3) 29.9<br />
162 Guatemala(16) 29.8<br />
163 Djibouti(2) 28.1<br />
164 Chad(1) 25.6<br />
165 Egypt(5) 24.6<br />
166 Kazakhstan(1) 22.7<br />
167 Mali(2) 21.7<br />
168 Kuwait(5) 14.0<br />
169 Monaco(7) 13.2<br />
Key: VAP= voting age population; no.=number of<br />
elections.<br />
* Argentina included women in the franchise <strong>from</strong> 1947.<br />
* Bahrain only includes men in the franchise.<br />
* Belgium included women in the franchise <strong>from</strong> 1948.<br />
* Czech Republic includes elections in Czechoslovakia 1990<br />
and 1992.<br />
* Greece included women in the franchise <strong>from</strong> 1986.<br />
* Kuwait only includes men in the franchise.<br />
* Liechtenstein included women in the franchise <strong>from</strong><br />
1986.<br />
* Switzerland included women in the franchise <strong>from</strong> 1971.<br />
84 <strong>Voter</strong> <strong>Turnout</strong> Since 1945 A Global Report
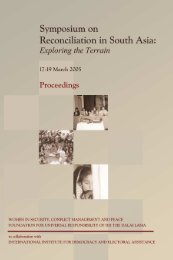
Figure 14: Differences between established democracies<br />
and other states over time<br />
Vote to registration ratio for established democracies and other states since 1945<br />
% vote/registration<br />
90<br />
80<br />
70<br />
60<br />
50<br />
Established<br />
All Other States<br />
1945-1949 1950-1959 1960-1969 1970-1979 1980-1989 1990-2001<br />
Source: <strong>International</strong> <strong>IDEA</strong>.<br />
VOTER TURNOUT AND SOCIO-<br />
ECONOMIC FACTORS<br />
Figure 14: Differences between established<br />
democracies and other states over time<br />
Our data reveals that high-turnout countries<br />
are neither exclusively new nor established<br />
democracies. Arend Lijphart has defined<br />
thirty six countries* as “established democracies”<br />
if they are democratic now and have<br />
been for twenty years (democracy assessed<br />
using a Freedom House scale, as below).<br />
These established democracies have seen a<br />
slow but steady decline in turnout since the<br />
1970s. During the 1970s, however, as a<br />
result of the democratization movement,<br />
<strong>Voter</strong> <strong>Turnout</strong><br />
“other states” experienced an increase in<br />
voter turnout, peaking at about 80 percent.<br />
The current turnout in “other states” is<br />
about 70 percent, lower than the 73 percent<br />
in established democracies.<br />
Our data shows however that a high level<br />
of political freedoms and civil liberties may<br />
contribute to a high level of voter turnout.<br />
The 457 elections conducted in a political<br />
system rated by Freedom House as being<br />
“free” yielded an average turnout of 76 percent.<br />
However, being in either a “partly free”<br />
or a “not free” environment seems less of<br />
an influence on turnout, as both ratings see<br />
an average turnout of 70 percent.<br />
*Australia, Austria, Bahamas, Barbados, Belgium, Botswana, Canada, Colombia, Costa Rica, Denmark, Finland, France, Germany, Greece,<br />
Iceland, India, Ireland, Israel, Italy, Jamaica, Japan, Luxembourg, Malta, Mauritius, Netherlands, New Zealand, Norway, Papua New Guinea,<br />
Portugal, Spain, Sweden, Switzerland, Trinidad and Tobago, United Kingdom, United States of America, Venezuela.<br />
Source: Lijphart, A. 1999. Patterns of Democracy, Government Forms and Performance in Thirty-Six Countries. New Haven: Yale University Press.<br />
85
Figure 15: Freedom House rating and voter turnout<br />
Vote to registration ratio by Freedom House rating, 1945-2000<br />
% vote/registration<br />
80<br />
75<br />
70<br />
65<br />
60<br />
FH 2-5<br />
no.=457<br />
FH 6-10<br />
no.=233<br />
Source: <strong>International</strong> <strong>IDEA</strong>.<br />
Key: no.=number of elections, FH= Freedom House rating of political rights and civil liberties.<br />
“2” indicates the highest possible level of rights and freedoms and 14 the lowest.<br />
FH 11-14<br />
no.=60<br />
Figure 16: Literacy and <strong>Turnout</strong><br />
Vote to registration ratio by literacy rate (1997), most recent parliamentary elections<br />
% vote/registration<br />
80<br />
75<br />
70<br />
65<br />
60<br />
<strong>Voter</strong> <strong>Turnout</strong> <strong>Rates</strong> <strong>from</strong> a <strong>Comparative</strong> Perspective<br />
Below 95%<br />
no.=92<br />
Above 95%<br />
no.=57<br />
Source: <strong>International</strong> <strong>IDEA</strong> and Human Development Report (19<br />
Key: no.=number of elections.<br />
Literacy rate %<br />
86 <strong>Voter</strong> <strong>Turnout</strong> Since 1945 A Global Report
Figure 17: Vote to registration ratio by GDP per capita, most recent<br />
parliamentary elections<br />
% vote/registration<br />
80<br />
75<br />
70<br />
65<br />
60<br />
$ 97-374<br />
23 countries<br />
$ 375-934<br />
24 countries<br />
$ 935-2.010<br />
25 countries<br />
Source: <strong>International</strong> <strong>IDEA</strong> and Human Development Report (1999).<br />
$ 2.011-5.378<br />
24 countries<br />
$ 5.379-28.010<br />
25 countries<br />
Figure 18: Vote to registration ratio by population size, parliamentary<br />
elections, 1945-2001<br />
85<br />
80<br />
75<br />
70<br />
65<br />
60<br />
% vote/registration<br />
under 100000 no.=99 100000-999999<br />
no.=157<br />
Key: no.=number of elections.<br />
<strong>Voter</strong> <strong>Turnout</strong><br />
1-9 million no.=471 10-49 million no.=264 50-99 million no.=97 over 100 million no.=67<br />
87
While the capacity to read and write does<br />
not necessarily equate to an ability to make<br />
coherent and informed political decisions,<br />
turnout does increase with literacy, before<br />
declining in societies where literacy exceeds<br />
90 percent.(See Figure 16)<br />
Similarly, if we measure the wealth of a<br />
country against its gross domestic product<br />
and examine voter turnout performance a<br />
similar effect is seen, although it stays relatively<br />
static at the highest levels. (See Figure<br />
17)<br />
If we examine population size and voter<br />
turnout a clear correlation with regional<br />
results can be seen. Many African countries,<br />
whose low turnout is discussed above, fall<br />
into the 10-49 million group. In the over 100<br />
million group, twenty seven elections are<br />
US congressional elections, with consistently<br />
low levels of turnout. (See Figure 18)<br />
100<br />
Figure 19: Electoral system & turnout<br />
Vote to registration ratio by type of electoral systems, most recent<br />
parliamentary elections<br />
90<br />
80<br />
70<br />
60<br />
50<br />
40<br />
30<br />
20<br />
10<br />
0<br />
% vote/registration<br />
AV no.=3 STV no.=2 List-PR no.=60 Block no.=7 MMP no.=8 Parallel no.=20 FPTP no.=48 TRS no.=15 SNTV no.=2<br />
Key: no. = number of countries<br />
<strong>Voter</strong> <strong>Turnout</strong> <strong>Rates</strong> <strong>from</strong> a <strong>Comparative</strong> Perspective<br />
ELECTORAL SYSTEMS AND<br />
TURNOUT<br />
Within parliamentary elections, there are<br />
nine major electoral systems in use around<br />
the world, as categorized in the <strong>International</strong><br />
<strong>IDEA</strong> Handbook of Electoral System Design<br />
Alternative Vote (used in the three Oceania<br />
countries of Australia, Fiji and Nauru) leads<br />
with an average turnout of 91 percent, while<br />
the two countries with Single Non-<br />
Transferable Vote (Jordan and Vanuatu) have<br />
an average of only 43 percent. The other systems<br />
do not have such a large deviation,<br />
with Single Transferable Vote at 80 percent<br />
and Two-Round System at 63 percent. An<br />
interesting result is the relatively small difference<br />
between the two most widely used<br />
systems, List Proportional Representation at<br />
73 percent and First Past the Post at 67 percent.<br />
88 <strong>Voter</strong> <strong>Turnout</strong> Since 1945 A Global Report
ALTERNATIVE VOTE (AV)<br />
A preferential, plurality majority<br />
system used in single-member<br />
districts in which voters use<br />
numbers to mark their preferences<br />
on the ballot paper. A candidate<br />
who receives over 50 percent of<br />
first preferences is declared<br />
elected. If no candidate achieves<br />
an absolute majority of first<br />
preferences, votes are reallocated<br />
until one candidate has an absolute<br />
majority of votes cast.<br />
BLOCK VOTE (BLOCK)<br />
A majority plurality system used in<br />
multi-member districts in which<br />
electors have as many votes as<br />
there are candidates to be elected.<br />
Voting can be either candidatecentred<br />
or party-centred. Counting<br />
is identical to a First Past the Post<br />
system, with the candidates with<br />
the highest vote totals winning the<br />
seat(s).<br />
FIRST PAST THE POST<br />
(FPTP)<br />
The simplest form of plurality<br />
majority electoral system, using<br />
single-member districts, a<br />
categorical ballot and candidatecentred<br />
voting. The winning<br />
candidate is the one who gains<br />
more votes than any other<br />
candidate, but not necessarily a<br />
majority of votes.<br />
LIST PROPORTIONAL<br />
REPRESENTATION (LIST<br />
PR)<br />
In its simplest form List PR<br />
involves each party presenting a<br />
list of candidates to the electorate.<br />
<strong>Voter</strong>s vote for a party, and parties<br />
receive seats in proportion to their<br />
overall share of the national vote.<br />
Winning candidates are taken <strong>from</strong><br />
the lists.<br />
MIXED MEMBER<br />
PROPORTIONAL (MMP)<br />
Systems in which a proportion of<br />
the parliament (usually half) is<br />
elected <strong>from</strong> plurality majority<br />
districts, while the remaining<br />
members are chosen <strong>from</strong> PR lists.<br />
Under MMP the PR seats<br />
compensate for any<br />
disproportionality produced by the<br />
district seat result.<br />
PARALLEL SYSTEM<br />
(PARALLEL)<br />
A Proportional Representation<br />
system used in conjunction with a<br />
plurality majority system but<br />
where, unlike MMP, the PR seats<br />
do not compensate for any<br />
disproportions arising <strong>from</strong><br />
elections to the plurality majority<br />
seats.<br />
<strong>Voter</strong> <strong>Turnout</strong><br />
Electoral Systems:<br />
The Nine Sub-families<br />
SINGLE NON-<br />
TRANSFERABLE VOTE<br />
(SNTV)<br />
A Semi-Proportional system which<br />
combines multi-member<br />
constituencies with a First Past the<br />
Post method of vote counting, and<br />
in which electors have only one<br />
vote.<br />
SINGLE TRANSFERABLE<br />
VOTE (STV)<br />
A preferential Proportional<br />
Representation system used in<br />
multi-member districts. To gain<br />
election, candidates must surpass<br />
a specified quota of firstpreference<br />
votes. <strong>Voter</strong>s’<br />
preferences are reallocated to<br />
other continuing candidates if a<br />
candidate is excluded or if an<br />
elected candidate has a surplus.<br />
TWO-ROUND SYSTEM<br />
(TRS)<br />
A pluralitymajority system in which<br />
a second election is held if no<br />
candidate achieves an absolute<br />
majority of votes in the first<br />
election.<br />
89
Figure 20: Differences between parliamentary and presidential elections<br />
Vote to registration ratio by parliamentary and presidential<br />
elections, 1945-2001<br />
% vote/registration<br />
80<br />
70<br />
60<br />
50<br />
40<br />
30<br />
20<br />
Parliamentary no.=1175 Presidential no.=369<br />
Key: no=number of elections.<br />
Figure 21. Presidential elections by region<br />
Vote to registration ratio by region, presidential elections 1945-2001<br />
90<br />
80<br />
70<br />
60<br />
50<br />
40<br />
30<br />
20<br />
10<br />
0<br />
% vote/registration<br />
Pacific<br />
no.=6<br />
Western<br />
Europe<br />
no.=52<br />
Key: no=number of elections.<br />
<strong>Voter</strong> <strong>Turnout</strong> <strong>Rates</strong> <strong>from</strong> a <strong>Comparative</strong> Perspective<br />
Middle East<br />
no.=3<br />
Asia<br />
no.=13<br />
North America<br />
& the<br />
Caribbean<br />
no.=20<br />
Latin America<br />
no.=161<br />
CIS, Central<br />
and Eastern<br />
Europe<br />
no.=42<br />
Africa<br />
no.=72<br />
90 <strong>Voter</strong> <strong>Turnout</strong> Since 1945 A Global Report
DIFFERENCE BETWEEN<br />
PARLIAMENTARY AND<br />
PRESIDENTIAL ELECTIONS<br />
Participation at parliamentary elections is<br />
only marginally higher than at presidential<br />
elections, although it should be noted that<br />
the database contains more than three<br />
times as many parliamentary elections as<br />
presidential elections. The 1,175 parliamentary<br />
elections saw an average turnout of 75<br />
percent.(see Figure 20)<br />
Across regions, Oceania still has the lead in<br />
turnout <strong>from</strong> Western Europe, while Africa<br />
has the lowest turnout in both parliamentary<br />
and presidential elections.(see Figure 21)<br />
<strong>Voter</strong> <strong>Turnout</strong><br />
91
Choosing<br />
Politicians by<br />
Lottery: An<br />
Option for the<br />
Future?<br />
For many people today, democracy (“rule of<br />
the people”) has become equal to elections<br />
-to a system of representation and political<br />
parties where ordinary citizens are only<br />
engaged in politics at election day once<br />
every four or five years. Recently, however,<br />
voter participation has decreased, new technologies<br />
have challenged the old system,<br />
and the established democracies have experienced<br />
what has been called a crisis of political<br />
parties. Elections as the only means by<br />
which people can select who is going to govern<br />
are no longer taken for granted. In many<br />
corners of the world, new ways to achieve<br />
rule of the people are being discussed. Why<br />
not use direct, Internet-based discussions?<br />
Or lottery? The ideas are not as unusual as<br />
they may seem.<br />
There is nothing new about selecting politicians<br />
and civil servants by lot. In Classical<br />
Athens, lot was used to select most secular<br />
officials, <strong>from</strong> members of the Executive<br />
Council to port authorities. Some key positions<br />
were rotated daily to prevent people<br />
<strong>from</strong> abusing power. The arguments for the<br />
use of the lot are highly valid today. The lot<br />
was used to prevent the cementation of<br />
political elites and thus allow larger segments<br />
of the population to take an active<br />
part in the governing of society; it guaranteed<br />
a balanced representation between the<br />
tribes and groups in society and it was<br />
believed to protect the equality of the citizens<br />
and allow them an opportunity to experience<br />
how to govern as well as be governed.<br />
The selection by lot also distributed<br />
the duty and responsibilities of running the<br />
state among all citizens.<br />
The ideas <strong>from</strong> ancient Athens have, together<br />
with the development of new technologies,<br />
lead to a wave of experimentation with<br />
citizen juries and other forms of involving<br />
people in the governance of democratic<br />
countries. During the last two decades, programmes<br />
in Germany, Denmark, the United<br />
States and Britain, for example, have tried to<br />
find ways to gather more or less randomly<br />
chosen citizens to discuss political issues in<br />
an environment where they can get their<br />
questions answered and their opinions<br />
heard and respected.<br />
The first of these projects is called “Policy<br />
Juries” at the Jefferson Center for New<br />
Democratic Processes. In this case a highquality<br />
telephone survey is conducted to<br />
randomly selected individuals in a given<br />
community (a city, organization, county,<br />
state, nation, etc.). Survey respondents<br />
92 <strong>Voter</strong> <strong>Turnout</strong> Since 1945 A Global Report
who show an interest in participating are<br />
entered into the jury pool, where they are<br />
coded for certain demographic information<br />
such as age, gender, geographic location,<br />
and so on. The final jury of about twenty-four<br />
citizens is then selected to reflect the general<br />
public. Over several days, the jurors are<br />
provided with information <strong>from</strong> expert witnesses<br />
regarding all sides of the issue (ranging<br />
<strong>from</strong> public health and the federal budget<br />
to US peacemaking in Central America),<br />
and the results of the jury are issued in a<br />
public forum.<br />
In the German “planning cell” project,<br />
twenty-five people are selected at random<br />
through the official registration offices. Their<br />
task is to evaluate problems or solutions,<br />
preparing new laws or planning local projects.<br />
The jurors sit in small groups of five discussing<br />
the issues for a limited time before<br />
the membership in the groups is rotated at<br />
random. The idea is that the jurors should be<br />
faced with four new group members six<br />
times a day to be confronted with a variety<br />
of opinions and knowledge.<br />
Another interesting project is the “citizen<br />
juries” of the Institute for Public Policy<br />
Research in the United Kingdom, a project<br />
built on the idea <strong>from</strong> the U.S. Policy Juries,<br />
but with one important distinction; the<br />
results of the citizen jury are binding for the<br />
government or administration that ordered<br />
the jury. If it does not want to implement the<br />
results of the jury, it has to give a press conference<br />
to present its reasons for not doing<br />
so.<br />
93
94 <strong>Voter</strong> <strong>Turnout</strong> Since 1945 A Global Report
<strong>Voter</strong> <strong>Turnout</strong><br />
Women’s Power<br />
at the Ballot Box<br />
Pippa Norris<br />
The Convention on the Elimination of All<br />
Forms of Discrimination against Women,<br />
adopted by the United Nations General<br />
Assembly in 1979 and subsequently signed<br />
by 165 nation states, emphasizes the importance<br />
of equal participation of women with<br />
men in public life. Yet two decades later<br />
women remain far <strong>from</strong> parity worldwide at<br />
the apex of power, as heads of state at<br />
prime ministerial and presidential levels, in<br />
the executive branch as ministers and as<br />
senior public officials, and within parliamentary<br />
assemblies (<strong>International</strong> <strong>IDEA</strong> 1998;<br />
UN 2000). But what is the situation today at<br />
the most fundamental level of citizenship: in<br />
terms of women’s voting participation?<br />
Laws restricting women’s rights to vote and<br />
to stand for election persist in a handful of<br />
Middle Eastern countries, including Kuwait,<br />
Qatar, Saudi Arabia, Oman and the United<br />
Arab Emirates (UNDP, 2000). In newer<br />
democracies, such as Namibia and South<br />
Africa, most women have only recently<br />
acquired voting rights. In established<br />
democracies, however, women have had<br />
95
Women’s Power at the Ballot Box<br />
the legal franchise for many decades; since<br />
the 1920s in most western countries.<br />
GENDER AND POLITICAL<br />
PARTICIPATION<br />
The earliest studies of voting behaviour in<br />
Western Europe and North America established<br />
that gender, along with age, education<br />
and social class, was one of the standard<br />
demographic and social characteristics<br />
used to predict levels of civic engagement,<br />
political activism, and electoral turnout<br />
(Tingsten, 1937; Almond and Verba, 1963;<br />
Rokkan, 1970; Verba and Nie, 1972),<br />
although observers noted that these gender<br />
differences were narrowing even in the<br />
1950s in advanced industrialized societies<br />
such as Sweden (Lipset, 1960). Based on a<br />
seven-nation comparative study of different<br />
dimensions of political participation, ranging<br />
<strong>from</strong> voter turnout to party membership,<br />
contact activity and community organizing,<br />
Verba, Nie and Kim (1978) concluded: “In all<br />
societies for which we have data, sex is<br />
related to political activity; men are more<br />
active than women.” The study established<br />
that these gender differences persisted as<br />
significant, even after controlling for levels of<br />
education, institutional affiliations like trade<br />
union membership, and psychological<br />
involvement in politics. During the same era,<br />
women were also found to be less engaged<br />
in unconventional forms of participation, like<br />
strikes and protest movements (Barnes and<br />
Kaase, 1979).<br />
In recent decades, however, the orthodox<br />
view that women are less active has been<br />
challenged. More recent studies have found<br />
that traditional gender differences in voting<br />
participation diminished in the 1980s and<br />
1990s, or even reversed, in many advanced<br />
industrialized countries (Christy, 1987;<br />
DeVaus and McAllister, 1989; Verba,<br />
Schlozman and Brady, 1995; Conway et al.<br />
1997). In the United States, for example, in<br />
every presidential election since 1980, the<br />
proportion of eligible female adults who<br />
voted has exceeded the proportion of eligible<br />
male adults who voted, and the same<br />
phenomenon is found in non-presidential<br />
mid-term elections since 1986 (CAWP,<br />
2000). This pattern is clearly generational: in<br />
the 1998 election, for instance, among the<br />
youngest cohort, (the under-25’s), 35 percent<br />
of women and 30 percent of men<br />
reported voting, while among the oldest<br />
generation (75 years and up) 59 percent of<br />
women but 68 percent of men reported voting.<br />
In addition, overall women outnumber<br />
men in the American electorate, so that the<br />
number of female voters has exceeded the<br />
number of men in every presidential election<br />
since 1964, a difference of some 7.2 million<br />
votes in 1996. Similar trends are evident in<br />
Britain, where the gender gap in turnout<br />
reversed in 1979 so that by the 1997 election<br />
an estimated 17.7 million women voted<br />
compared with around 15.8 million men.<br />
Long-term secular trends in social norms<br />
and in structural lifestyles seem to have contributed<br />
towards removing many factors that<br />
inhibited women’s voting participation.<br />
Nevertheless studies commonly suggest<br />
that women remain less involved in more<br />
demanding forms of civic engagement. For<br />
example, a national survey of political participation<br />
conducted in 1990 in the United<br />
States found that, compared with men,<br />
women are less likely to contribute to political<br />
campaigns, to work informally in the<br />
96 <strong>Voter</strong> <strong>Turnout</strong> Since 1945 A Global Report
community, to serve on a local governing<br />
board, to contact a government official or to<br />
be affiliated with a political organization<br />
(Schlozman, Burns and Verba, 1994). Political<br />
knowledge and interest in public affairs are<br />
important preconditions to the more active<br />
forms of engagement. Studies have found<br />
that American women continue to express<br />
less knowledge and interest in conventional<br />
politics, so that they are less likely to discuss<br />
politics, to follow events in the news, or to<br />
care deeply about the outcome of elections<br />
(Bennett and Bennett, 1989).<br />
What explains gender differences in political<br />
participation? Patterns of voting turnout<br />
can be affected by the legal structure of<br />
opportunities, by the mobilizing role of<br />
organizations like parties and NGOs in civic<br />
society, and by the resources and motivation<br />
that people bring to political activity. The<br />
most popular socio-psychological explanations<br />
of why women have commonly been<br />
less engaged in the past have been based<br />
on theories of sex role socialization and the<br />
persistence of traditional attitudes towards<br />
women’s and men’s roles in the private and<br />
public sphere. Alternative structural<br />
approaches have emphasized the social and<br />
economic barriers facing women, such as<br />
the social isolation of full-time homemakers<br />
who are excluded <strong>from</strong> political networks<br />
based on occupational, trade union and professional<br />
associations. The movement of<br />
women into the paid labour force is one of<br />
the prime candidates for explaining changing<br />
patterns of civic engagement. Educational<br />
attainment is also thought likely to play a<br />
role, since education provides cognitive and<br />
civic skills necessary for information processing<br />
in the civic world.<br />
<strong>Voter</strong> <strong>Turnout</strong><br />
POST-WAR TRENDS IN<br />
OFFICIAL RATES OF VOTER<br />
TURNOUT<br />
Therefore what does evidence about trends<br />
in voter turnout suggest about the pattern of<br />
gender differences in civic engagement and<br />
how this varies worldwide, and what<br />
explains any significant differences that are<br />
apparent? There are two main sources of<br />
cross-national evidence that can be analyzed<br />
here. First, official statistics breaking down<br />
voter turnout by gender can be examined in<br />
the eight democracies where trend data is<br />
available in the post-war period, namely in<br />
Barbados, Finland, Germany, Iceland, India,<br />
Malta, New Zealand, and Sweden. This limited<br />
range of countries is far <strong>from</strong> representative<br />
of the broader universe of established<br />
democracies but, nevertheless, it does contain<br />
both large and small nation states, as<br />
well as societies like Sweden and India at<br />
widely different levels of socio-economic<br />
development.<br />
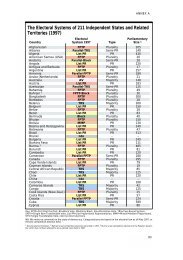
Figure 22 shows the gender gap in voting<br />
turnout, measured as the difference<br />
between the proportion of men and women<br />
officially recorded as voting in general elections<br />
in these societies. The size of the gender<br />
gap displays considerable variations<br />
among the nations under comparison<br />
although at the same time most countries<br />
show a secular rise in female participation<br />
rates during the post-war era. In two<br />
nations, Barbados and Sweden, the data<br />
suggests that more women than men have<br />
consistently turned out to cast their ballot. In<br />
most countries under comparison, however,<br />
in the 1950s and 1960s women participated<br />
less often than men, producing a modest<br />
gender gap in Germany, Finland and Iceland,<br />
97
Women’s Power at the Ballot Box<br />
and a substantial gap evident in India. By the<br />
end of the time series, in the 1990s, the<br />
gender gap has closed or even reversed in<br />
all societies except India, where women<br />
continue to turnout at markedly lower rates<br />
than men, although even here the trend is<br />
towards a slight closure of the gap. While<br />
the official data cannot tell us the reasons<br />
for these trends, multiple explanations can<br />
be suggested for the closure of the gender<br />
gap in turnout, including generational shifts<br />
in lifestyles and social norms.<br />
SURVEY DATA ON REPORTED<br />
TURNOUT<br />
In addition to examining official voter turnout<br />
statistics, to examine the picture more sys-<br />
Figure 22: The gender gap in voter turnout<br />
Women less/more<br />
20<br />
10<br />
0<br />
-10<br />
-20<br />
1945<br />
tematically we need to turn to survey data<br />
estimating reported levels of electoral participation.<br />
This study draws on the<br />
<strong>Comparative</strong> Study of Electoral Systems,<br />
based on national election surveys conducted<br />
in 19 countries <strong>from</strong> 1996 to 1999. The<br />
nations under comparison vary significantly<br />
along multiple dimensions, including levels<br />
of democratic and socio-economic development,<br />
as well as cultural and geographic<br />
regions of the world. The comparison<br />
includes four Anglo-American democracies<br />
(Australia, the United States, Britain, New<br />
Zealand), five West European nations ranging<br />
<strong>from</strong> the Scandinavian north to the far<br />
southern Mediterranean (Spain, Germany,<br />
the Netherlands, Norway, Israel), six post-<br />
1950 1955 1959 1964 1969 1974 1979 1984 1989 1994 1999<br />
Source: Electoral turnout in official statistics.<br />
98 <strong>Voter</strong> <strong>Turnout</strong> Since 1945 A Global Report<br />
Finland<br />
Germany<br />
Iceland<br />
Sweden<br />
Malta<br />
New Zealand<br />
India<br />
Barbados
Figure 23: The proportion of men and women who<br />
reported not voting<br />
communist nations in Central and Eastern<br />
Europe (Ukraine, Czech Republic, Lithuania,<br />
Poland, Romania, Hungary), two Latin<br />
American societies (Mexico, Argentina), and<br />
two Asian countries (Japan, Taiwan). In comparing<br />
levels of turnout among women and<br />
men in different nations we need to control<br />
for intervening factors that can be expected<br />
to influence this process, including levels of<br />
democratization, as well as standard social<br />
background factors at individual level including<br />
age, education, occupational status and<br />
<strong>Voter</strong> <strong>Turnout</strong><br />
Nation Men Women<br />
Difference<br />
women/ men Sig.<br />
Norway 15.7 12.2 -3.5 .021<br />
Britain 17.5 17.1 -0.4 .779<br />
Germany 7.3 7.2 -0.1 .919<br />
Spain 10.3 10.5 +0.2 .909<br />
Taiwan 8.3 8.6 +0.3 .860<br />
Israel 16.9 16.5 +0.4 .868<br />
New Zealand 5.0 5.5 +0.5 .438<br />
Japan 15.8 16.8 +1.0 .611<br />
Australia 3.6 5.5 +1.9 .048<br />
Mexico 23.1 25.0 +1.9 .327<br />
Czech Republic 9.3 11.6 +2.3 .192<br />
Ukraine 21.9 24.2 +2.3 .354<br />
USA 21.8 24.7 +2.9 .180<br />
Netherlands 20.1 23.1 +3.0 .092<br />
Poland 40.4 44.6 +4.2 .056<br />
Hungary 23.9 28.7 +4.8 .035<br />
Romania 7.6 15.6 +8.0 .000<br />
ALL 13.7 15.5 +1.8<br />
<strong>Turnout</strong>: The question measured whether the respondent cast a ballot in the general<br />
election. Functionally equivalent but not identical items were used in each national<br />
election survey. The significance of the difference is measured by gamma.<br />
Source: <strong>Comparative</strong> Study of Electoral Systems, 1996-1999.<br />
income that previous studies have found to<br />
be commonly associated with levels of political<br />
participation.<br />
Figure 23 shows the proportion of men<br />
and women who reported not voting in general<br />
elections in the mid-to late 1990s, the<br />
gender difference in turnout, and the significance<br />
of the gap. The evidence shows that<br />
women reported voting at significantly higher<br />
levels than men in only one nation<br />
(Norway), in thirteen nations there was no<br />
significant gender difference, and women<br />
99
Women’s Power at the Ballot Box<br />
Figure 24 : The gender gap in turnout by social group<br />
Men Women Gap Sig.<br />
Age-group<br />
Younger 27.5 27.1 0.4 0.64<br />
Middle 14.9 16.1 -1.2 0.08<br />
Older 13.1 16.8 -3.7 0.00<br />
Income<br />
Lowest 19.9 23.1 -3.2 0.01<br />
Low 18.9 20.9 -2.0 0.07<br />
Moderate 17.7 18.7 -1.0 0.33<br />
High 16.1 19.3 -3.2 0.01<br />
Highest 17.8 17.9 -0.1 0.96<br />
Length of democracy<br />
Established 12.5 13.1 -0.6 0.26<br />
Newer 32.4 34.0 -1.6 0.05<br />
Urbanization<br />
Rural 20.1 23.4 -3.3 0.00<br />
Small town 20.5 22.8 -2.3 0.02<br />
Suburbs 13.5 13.7 -0.2 0.76<br />
Large city 17.7 19.3 -1.6 0.07<br />
Education<br />
Incomplete primary 22.9 29.1 -6.2 0.01<br />
Primary 22.7 25.3 -2.6 0.04<br />
Secondary 20.6 20.6 0.0 0.98<br />
Post-secondary trade 24.4 26.1 -1.7 0.18<br />
Undergraduate incomplete 20.2 18.7 1.5 0.47<br />
Graduate 14.1 15.8 -1.7 0.12<br />
Work Status<br />
Employed FT 18.6 21.9 -3.3 0.02<br />
Employed PT 16.2 13.9 2.3 0.07<br />
Unemployed 32.5 35.5 -3.0 0.11<br />
Student 28.3 25.3 3.0 0.05<br />
Retired 15.1 18.9 -3.8 0.06<br />
Homeworker 20.4<br />
Disabled 20.4 27.9 -7.5 0.07<br />
Note: The gap represents the difference between men and women’s reported turnout in<br />
general elections. The significance of the difference is measured by gamma.<br />
Source: <strong>Comparative</strong> Study of Electoral Systems, 1996-1999<br />
100 <strong>Voter</strong> <strong>Turnout</strong> Since 1945 A Global Report
eported significantly lower levels of turnout<br />
in the remaining three newer democracies in<br />
Central and Eastern Europe (Poland,<br />
Hungary, Romania), by a margin of four to<br />
seven percentage points. Therefore this picture<br />
provides further confirmation of the pattern<br />
already observed in the official data; any<br />
tendency for women to vote less frequently<br />
than men in the past seems to have disappeared<br />
in established democracies, and this<br />
pattern only remains significant in some (but<br />
not all) of the post-communist societies.<br />
If we turn to the breakdown of the difference<br />
between men’s and women’s reported<br />
turnout by social group, it is apparent that<br />
the gap is evident across most demographic<br />
categories. The age gap reverses: older<br />
women (over 65 years) are significantly less<br />
likely to turn out to vote than older men, a<br />
gap which shrinks to become insignificant<br />
among younger cohorts. What this suggests<br />
is that the process of generational<br />
change is behind the secular trends that we<br />
have already observed in the official statistics,<br />
so that as younger cohorts gradually<br />
replace older ones the residual gender gap<br />
in participation will disappear. The pattern by<br />
household income (as a proxy measure of<br />
socio-economic status) varies, with the<br />
strongest gap among the lowest quintile but<br />
also among the high category. The gap is not<br />
therefore simply reducible to inequalities<br />
between rich and poor. The gap is significant<br />
among newer democracies but not established<br />
ones, as observed earlier. Level of<br />
urbanization proves a weak predictor,<br />
although the gap is least significant among<br />
those living in the suburbs while it is most<br />
marked in rural areas. The education gap is<br />
sharp, especially for those who failed to<br />
<strong>Voter</strong> <strong>Turnout</strong><br />
complete even primary education, and the<br />
gap shrinks with higher levels of education.<br />
Lastly, in terms of work status in the paid<br />
labour force, the pattern is somewhat<br />
mixed, with the gap sharpest among the disabled,<br />
the retired (reflecting the age profile<br />
already observed), and the unemployed, but<br />
also among those in full-time paid employment.<br />
Although it is difficult to compare<br />
against men, because of the small number<br />
of cases, the level of non-voting among<br />
female home-workers is not a particularly<br />
strong predictor of electoral participation<br />
compared with women in the paid labour<br />
force.<br />
CONCLUSIONS<br />
The comparison based on the limited official<br />
data on voter turnout presented here suggests<br />
that many countries have seen a gradual<br />
shrinking of the disparities in participation<br />
between women and men during the<br />
post-war era. Countries like Sweden,<br />
Iceland, Malta and Germany have seen<br />
women’s turnout gradually rise to achieve<br />
parity with or even slightly exceed that of<br />
men’s, although the survey data indicates<br />
that some of the post-communist countries<br />
are lagging behind this trend. The breakdown<br />
in the CSES survey data suggests<br />
many of the factors underlying this phenomenon,<br />
especially the role of generational<br />
replacement that has closed the gap in most<br />
of the post-industrial societies under comparison.<br />
As the younger generation gradually<br />
becomes the majority, this promises to<br />
have important implications for women’s<br />
influence at the ballot box.<br />
101
REFERENCES<br />
Women’s Power at the Ballot Box<br />
Note: I am most grateful to the <strong>Comparative</strong> Study of<br />
Electoral Systems (CSES), based at the Center for<br />
Political Studies, University of Michigan, Ann Arbor,<br />
Mich., for release of this dataset, particularly Phil<br />
Shively, and all the national collaborators who made this<br />
possible. More details of the research design are available<br />
at www.umich.edu/~nes/cses.<br />
Almond, G. A. and S. Verba. 1963. The Civic Culture:<br />
Political Attitudes and Democracy in Five Nations.<br />
Princeton, N.J.: Princeton University Press.<br />
Barnes, S. and M. Kaase. 1979. Political Action: Mass<br />
Participation in Five Western Democracies. Beverly<br />
Hills, Calif.: Sage.<br />
Bennett, L. and S. Bennett. 1989. Enduring gender differences<br />
in political interest. American Politics Quarterly<br />
17:105–122.<br />
Centre for American Women and Politics. 2000. Sex<br />
Differences in Voting <strong>Turnout</strong>, www.cawp.org.<br />
Christy, C. 1987. Sex Differences in Political<br />
Participation: Processes of Change in Fourteen Nations.<br />
New York: Praeger.<br />
Conway, M., G. A. Steuernagel, and D. Ahern. 1997.<br />
Women and Political Participation. Washington, D.C.:<br />
CQ Press.<br />
DeVaus, D. and I. McAllister. 1989. The changing politics<br />
of women: gender and political alignments in 11<br />
nations. European Journal of Political Research<br />
17:241–262.<br />
<strong>International</strong> <strong>IDEA</strong>. 1998. Women in Parliament: Beyond<br />
Numbers. Stockholm: <strong>International</strong> <strong>IDEA</strong>.<br />
Lipset, S. M. 1960. Political Man: the Social Bases of<br />
Politics. Garden City, N.Y.: Doubleday.<br />
Norris, P. 1999. A Gender–Generation Gap? In Critical<br />
Elections: British Parties and <strong>Voter</strong>s in Long-term<br />
Perspective, edited by G. Evans and P. Norris. London:<br />
Sage.<br />
Rokkan, S. 1970. Citizens, Elections, Parties:<br />
Approaches to the <strong>Comparative</strong> Study of the Processes<br />
of Development. Oslo: Universitetsforlaget.<br />
Schlozman, K. L., N. Burns and S. Verba. 1994. Gender<br />
and pathways to participation: the role of resources.<br />
Journal of Politics 56:963–990.<br />
Tingsten, H. L. G. 1937. Political Behavior: Studies in<br />
Election Statistics. London: P. S. King.<br />
United Nations. 2000. The World’s Women 2000: Trends<br />
and Statistics. New York: United Nations.<br />
UN Development Programme. 2000. United Nations<br />
Development Report 2000. New York: Oxford University<br />
Press for UNDP.<br />
Verba, S. and N. Nie. 1972. Participation in America:<br />
Political Democracy and Social Equality. New York:<br />
Harper and Row.<br />
Verba, Sidney, N. Nie and Kim. 1978. Participation and<br />
Social Equality. Cambridge, Mass.: Harvard University<br />
Press.<br />
Verba, S., K. Schlozman and H. E. Brady. 1995. Voice<br />
and Equality. Cambridge, Mass.: Harvard University<br />
Press.<br />
102 <strong>Voter</strong> <strong>Turnout</strong> Since 1945 A Global Report
Voting for the<br />
Disabled<br />
<strong>Turnout</strong> rates can differ greatly both<br />
between countries and over time. One of<br />
the factors that can influence an individual<br />
voter’s decision regarding whether or not to<br />
vote is access to the polling station. Long<br />
queues in bad weather can prevent large<br />
numbers of voters - especially the elderly,<br />
the sick, or single parents that cannot leave<br />
their small children - <strong>from</strong> voting. Increasing<br />
accessibility of the polling station and facilitating<br />
absentee voting can address some of<br />
these problems and at least slightly increase<br />
the level of direct participation in the elections.<br />
The disabled often experience physical<br />
obstacles hindering their right to vote. Since<br />
voting typically takes place in schools or<br />
offices, or even outdoors, the polling station<br />
<strong>Voter</strong> <strong>Turnout</strong><br />
itself is often not suitable for those with<br />
impaired mobility, and resources are not<br />
always available to adjust to special needs.<br />
Ramps at stairs, increased space around the<br />
polling stands, low tables and voting tables<br />
located right at the entrance can often be<br />
sufficient to increase accessibility for voters<br />
in wheelchairs or other disabilities. Other<br />
measures can be taken to help other groups<br />
of disabled, such as having large symbols on<br />
ballot papers for those with bad eyesight or<br />
low literacy. All possible measures should be<br />
taken to enable voters to mark their ballot<br />
papers without assistance, thereby ensuring<br />
their right to secret voting.<br />
Some countries have adopted special<br />
rules, extending the possibility of postal voting<br />
for disabled persons, and new technologies<br />
have now led to Internet voting as a<br />
possible option where resources are available.<br />
There are international and domestic<br />
NGOs advocating facilitation of the vote by<br />
the disabled.<br />
103
104 <strong>Voter</strong> <strong>Turnout</strong> Since 1945 A Global Report
<strong>Voter</strong> <strong>Turnout</strong><br />
Compulsory Voting<br />
CONCEPTUALISING<br />
COMPULSORY VOTING<br />
Maria Gratschew<br />
All democratic governments consider participating<br />
in national elections a right of citizenship<br />
and a citizen’s civic responsibility. Some<br />
consider that participation in elections is also<br />
a citizen’s duty. In some countries, where<br />
voting is considered a duty, voting at elections<br />
has been made compulsory and has<br />
been regulated in the national constitutions<br />
or electoral laws. Some countries impose<br />
sanctions on non-voters.<br />
Compulsory voting is not a new concept.<br />
Belgium (1892), Argentina (1914) and<br />
Australia (1924) were among the first countries<br />
to introduce compulsory voting laws.<br />
Countries such as Venezuela and the<br />
Netherlands practised compulsory voting at<br />
one time but have since abolished it.<br />
Advocates of compulsory voting argue that<br />
decisions made by democratically elected<br />
governments are more legitimate when<br />
higher proportions of the population participate.<br />
They argue further that voting, voluntarily<br />
or otherwise, has an educative effect<br />
upon the citizens. Political parties can save<br />
money as a result of compulsory voting,<br />
since they do not have to spend resources<br />
105
Compulsory Voting<br />
convincing the electorate that it should turn<br />
out to vote. Lastly, if democracy is government<br />
by the people, presumably this<br />
includes all people, so that it is every citizen’s<br />
responsibility to elect his or her representatives.<br />
The leading argument against compulsory<br />
voting is that it is not consistent with the<br />
freedom associated with democracy. Voting<br />
is not an intrinsic obligation and the enforcement<br />
of such a law would be an infringement<br />
of the citizen’s freedom associated with<br />
democratic elections. It may discourage the<br />
political education of the electorate because<br />
people forced to participate will react against<br />
the perceived source of oppression. Is a government<br />
really more legitimate if high voter<br />
turnout is achieved against the will of the voters?<br />
Many countries with limited financial<br />
resources may not be able to justify the<br />
expense of maintaining and enforcing compulsory<br />
voting laws. It has been proved that<br />
forcing the population to vote results in an<br />
increased number of invalid and blank votes<br />
compared to countries that have no compulsory<br />
voting laws.<br />
Another consequence of compulsory voting<br />
is the possible high number of “random<br />
votes”. <strong>Voter</strong>s who are voting against their<br />
free will may check off a candidate at random,<br />
particularly the top candidate on the<br />
ballot paper. The voter does not care whom<br />
they vote for as long as the government is<br />
satisfied that they have fulfilled their civic<br />
duty. What effect does this immeasurable<br />
category of random votes have on the legitimacy<br />
of the democratically elected government?<br />
A figure depicting the exact number of<br />
countries that practise compulsory voting is<br />
quite arbitrary. The simple presence or<br />
absence of compulsory voting laws is in<br />
itself too simplistic. It is more constructive<br />
to analyse compulsory voting as a spectrum<br />
ranging <strong>from</strong> a symbolic, but basically impotent,<br />
law to a government that systematically<br />
follows up each non-voting citizen and<br />
implements sanctions against them.<br />
This spectrum implies that some countries<br />
formally have compulsory voting laws but do<br />
not, and have no intention to, enforce them.<br />
There are a variety of reasons for this.<br />
Not all laws are created to be enforced.<br />
Some laws are created merely to state the<br />
government’s position regarding what the<br />
citizen’s responsibility should be.<br />
Compulsory voting laws that do not include<br />
sanctions may fall into this category.<br />
Although a government may not enforce<br />
compulsory voting laws or even have formal<br />
sanctions in law for failure to vote, the law<br />
may have some effect upon the citizens. For<br />
example, in Austria voting is compulsory in<br />
only two regions, with sanctions being<br />
weakly enforced. However, these regions<br />
have a higher turnout than the national average.<br />
Other possible reasons for not enforcing<br />
the laws could be the complexity of the law<br />
or the resources required for enforcement.<br />
Countries with limited budgets may not<br />
place the enforcement of compulsory voting<br />
laws as a high priority; still they hope that<br />
the presence of the law will encourage citizens<br />
to participate. The cost of enforcement<br />
may lead some electoral administrations to<br />
lower their standards of enforcement.<br />
Can a country be considered to practise<br />
compulsory voting if the compulsory voting<br />
laws are ignored and irrelevant to the voting<br />
106 <strong>Voter</strong> <strong>Turnout</strong> Since 1945 A Global Report
habits of the electorate? Is a country practising<br />
compulsory voting if there are no<br />
penalties for not voting? What if there are<br />
penalties for failing to vote but they are<br />
never or scarcely ever enforced? Or if the<br />
penalty is negligible?<br />
Many countries offer loopholes, intentionally<br />
and otherwise, which allow non-voters<br />
to go unpunished. For example, in many<br />
countries it is required to vote only if you are<br />
a registered voter, but it is not compulsory<br />
LAWS, SANCTIONS, AND<br />
ENFORCEMENT<br />
Figure 25 lists all the countries that have a<br />
law that provides for compulsory voting. The<br />
first column lists the name of the country,<br />
the second column lists the type of sanctions<br />
that the country imposes against nonvoters,<br />
and the third column states to what<br />
extent the compulsory voting laws are<br />
enforced in practice. The numbers listed in<br />
the column for “type of sanction” stand for<br />
different types of sanctions, as follows:<br />
Explanation. The non-voter has to provide a<br />
legitimate reason for his or her failure to<br />
vote to avoid further sanctions, if any exist.<br />
Fine. The non-voter faces a fine. The amount<br />
varies by country: three Swiss francs in<br />
Switzerland, between 300 and 3,000<br />
schillings in Austria, 200 pounds in Cyprus,<br />
10 to 20 pesos in Argentina, 20 soles in<br />
Peru, and so on.<br />
<strong>Voter</strong> <strong>Turnout</strong><br />
to register. People might then have incentives<br />
not to register. In many cases, like<br />
Australia, voters will face sanctions unless<br />
they can provide an excuse that is acceptable<br />
under the legal framework.<br />
The diverse forms that compulsory voting<br />
has taken in different countries focus the<br />
attention not on whether compulsory voting<br />
is present or absent but rather on the<br />
degree and manner in which the government<br />
forces its citizens to participate.<br />
Possible imprisonment. The non-voter may<br />
face imprisonment as a sanction (we do not<br />
know of any such documented cases). This<br />
can also happen in countries such as<br />
Australia where a fine is common. In cases<br />
where the non-voter does not pay the fines<br />
after being reminded or after refusing several<br />
times, the courts may impose a prison<br />
sentence. This is, however, imprisonment<br />
for failure to pay the fine, not imprisonment<br />
for failure to vote.<br />
Infringements of civil rights or disenfranchisement.<br />
In Belgium, for example, it is<br />
possible that the non-voter, after not voting<br />
in at least four elections within 15 years, will<br />
be disenfranchised. In Peru, the voter has to<br />
carry a stamped voting card for a number of<br />
months after the election as a proof of having<br />
voted. This stamp is required in order to<br />
obtain some services and goods <strong>from</strong> certain<br />
public offices. In Singapore the voter is<br />
removed <strong>from</strong> the voter register until he or<br />
107
Compulsory Voting<br />
she reapplies to be included and submits a<br />
legitimate reason for not having voted. In<br />
Bolivia, the voter is given a card when he or<br />
she has voted as proof of participation. The<br />
voter cannot receive a salary <strong>from</strong> the bank<br />
if he or she cannot show proof of voting during<br />
three months after the election.<br />
Other. In Belgium, for example, it might be<br />
difficult to get a job within the public sector.<br />
In Greece if you are a non-voter it may be difficult<br />
to obtain a new passport or driver’s<br />
licence in. There are no formal sanctions in<br />
Mexico or Italy but there may be possible<br />
social sanctions or sanctions based on random<br />
choice. This is called the “innocuous<br />
sanction” in Italy, where it might for example<br />
be difficult to get a place in childcare for your<br />
child, but this is not formalized in any way.<br />
The figure shows that not all countries that<br />
have compulsory voting laws provide for<br />
sanctions against non-voters or enforce<br />
these in practice. The actual presence and<br />
enforcement of sanctions varies dramatically<br />
between countries and regions. All<br />
regions except for North America and<br />
Central and Eastern Europe have countries<br />
with compulsory voting laws. Latin America,<br />
Western Europe, Asia and Oceania all have<br />
countries where compulsory voting is strictly<br />
enforced in practice. The table shows that<br />
the most common sanction practised is the<br />
explanation sanction alone or together with<br />
a fine.<br />
Less common is deprivation of civil rights<br />
or disenfranchisement, which is only possible<br />
in a small number of countries, as is<br />
imprisonment. Imprisonment has, as the<br />
sole sanction, never been imposed on a nonvoter<br />
according to the sources.<br />
According to Figure 26, there is clearly a<br />
strong correlation between the level of<br />
enforcement of compulsory voting laws and<br />
voter turnout. The obvious theory supporting<br />
the positive relationship between compulsory<br />
voting and higher participation at elections<br />
is simple; each citizen’s desire to avoid<br />
being punished for not voting increases the<br />
likelihood of them making the effort to vote.<br />
As shown in Figure 26, enforced compulsory<br />
voting increases turnout by a little more<br />
than 15 percent, compared with countries<br />
where voting is voluntary. However, compulsory<br />
voting is not the only factor to increase<br />
turnout in a country. Socio-economic, political<br />
and institutional factors have all been proposed<br />
as having an impact on voter turnout.<br />
108 <strong>Voter</strong> <strong>Turnout</strong> Since 1945 A Global Report
Figure 25: Compulsory voting and sanctions<br />
Level of<br />
Country Sanctions Enforcement<br />
Argentina 1, 2, 4 Weak<br />
Australia 1, 2 Strict<br />
Austria (Tyrol) 1, 2 Weak<br />
Austria (Vorarlberg) 2, 3 Weak<br />
Belgium 1, 2, 4, 5 Strict<br />
Bolivia 4 Not available<br />
Brazil 2 Weak<br />
Chile 1, 2, 3 Weak<br />
Costa Rica None Not enforced<br />
Cyprus 1, 2 Strict<br />
Dominican<br />
Republic None Not enforced<br />
Ecuador 2 Weak<br />
Egypt 1, 2, 3 Not available<br />
Fiji 1, 2, 3 Strict<br />
Gabon N/A Not available<br />
Greece 1, 5 Weak<br />
Guatemala None Not enforced<br />
Honduras None Not enforced<br />
Italy 5 Not enforced<br />
Liechtenstein 1, 2 Weak<br />
Luxembourg 1, 2 Strict<br />
Mexico None / 5 Weak<br />
Nauru 1, 2 Strict<br />
Netherlands - Enforced<br />
until 1970<br />
Paraguay 2 Not available<br />
Peru 2, 4 Weak<br />
Singapore 4 Strict<br />
Switzerland<br />
(Schaffhausen) 2 Strict<br />
Thailand None Not enforced<br />
Turkey 2 Weak<br />
Uruguay 2,4 Strict<br />
Venezuela - In practise<br />
1961-1999<br />
<strong>Voter</strong> <strong>Turnout</strong><br />
109
Figure 26: Compulsory voting and turnout<br />
Vote to registration ratio by level of enforcement,<br />
most recent parliamentary elections<br />
% vote/registration<br />
90<br />
85<br />
80<br />
75<br />
70<br />
65<br />
60<br />
Non-Compulsory no.<br />
=147<br />
Key: no=number of elections.<br />
Compulsory Voting<br />
Compulsory Not Enforced<br />
no.=10<br />
REFERENCES<br />
Electoral Management Bodies of the above-mentioned<br />
countries and extracts <strong>from</strong> electoral laws that these<br />
institutions have provided. Please refer to the list of<br />
Country-Specific Sources.<br />
Administration and Cost of Elections Project (ACE) by<br />
<strong>International</strong> <strong>IDEA</strong>, IFES and the United Nations,<br />
www.aceproject.org.<br />
Australian Electoral Commission, Electoral<br />
Backgrounder 8: Compulsory Voting, at<br />
www.aec.gov.au/pubs/backgrounders/vol_8/main.htm.<br />
Australian Electoral Commission. Voting. Fact Sheet 22<br />
at www.aec.gov.au/pubs/factfiles/factsheet22.htm.<br />
Gratschew, Maria, July 2001, Compulsory Voting,<br />
ARENA, Association of Electoral Administrators,<br />
Oxonian Rewley Press Ltd, United Kingdom.<br />
Hirczy de Mino, W. 1994. The impact of mandatory voting<br />
laws on turnout: a quasi-experimental approach.<br />
Electoral Studies 13:64–76.<br />
Compulsory Enforced<br />
no.=9<br />
<strong>International</strong> <strong>IDEA</strong>. 1997. <strong>Voter</strong> <strong>Turnout</strong> <strong>from</strong> 1945 to<br />
1997: A Global Report on Political Participation.<br />
Stockholm: <strong>International</strong> <strong>IDEA</strong>. www.idea.int/turnout<br />
LeDuc, L., R. Niemi and P. Norris (eds). 1996.<br />
Comparing Democracies: Elections and Voting in Global<br />
Perspectives. Thousand Oaks: Sage Publications.<br />
Lijphart, A. March 1997. Unequal participation: democracy’s<br />
unresolved dilemma. Presidential Address.<br />
American Political Science Review 91(1).<br />
Major, S.. 1995. To Vote or Not to Vote? Compulsory<br />
Voting in Australia. Western Australian Electoral<br />
Commission.<br />
The Parline Database of the Inter-Parliamentary Union in<br />
Geneva, Switzerland, www.ipu.org.<br />
Puplick, C. and P. McGuiness. 1998. The pros and cons<br />
of compulsory voting. Elections Today 7(3).<br />
110 <strong>Voter</strong> <strong>Turnout</strong> Since 1945 A Global Report
<strong>Voter</strong> <strong>Turnout</strong><br />
Youth <strong>Voter</strong> <strong>Turnout</strong><br />
Julie Ballington<br />
This is a summary of several reports of on<br />
youth electoral behaviour which were commissioned<br />
and published by <strong>International</strong><br />
<strong>IDEA</strong>. The degree to which citizens, particularly<br />
young people, participate in democracy<br />
has become an area of increased interest in<br />
recent years. Moreover, recent research<br />
seems to point to growing dissatisfaction<br />
and apathy among young people in new and<br />
old democracies alike.<br />
In an effort to analyse turnout among<br />
young people, <strong>International</strong> <strong>IDEA</strong> published<br />
a study, Youth <strong>Voter</strong> Participation: Involving<br />
Today’s Young in Tomorrow’s Democracy<br />
(1999). Mostly based on survey data, the<br />
study attempts to document the scope of<br />
the problem internationally, investigating its<br />
causes and identifying potential strategies<br />
to increase youth participation. Included in<br />
the study is a comparative analysis of the<br />
participation rates of young people in 15<br />
Western European democracies.<br />
One classical finding of election research<br />
appears well documented in the sense that<br />
voter turnout is indeed lowest among young<br />
voters (18-29 years). The average for voters<br />
aged 60-96 was 93 percent (Eva Anduiza<br />
Perea, in <strong>International</strong> <strong>IDEA</strong> 1999b, 24). The<br />
111
Youth <strong>Voter</strong> <strong>Turnout</strong><br />
average turnout rate for all citizens across<br />
the 15 nations was 88.6 percent, and 80 percent<br />
for those aged 18-29. Further, in countries<br />
where overall voter participation is relatively<br />
low, the difference between youth<br />
turnout and the average turnout is greater<br />
than in countries with higher overall turnout<br />
rates. Unsurprisingly, where voting is compulsory,<br />
the turnout of young voters is substantially<br />
higher than in countries with voluntary<br />
voting. For example, in Switzerland<br />
(with voluntary voting in 25 out of 26 cantons),<br />
the average turnout is around 63 percent,<br />
while the 18-29 age cohort rate is over<br />
13 percent lower. This is in contrast to<br />
Belgium (with compulsory voting) where the<br />
youth turnout rate was less than one percentage<br />
point lower than the average of 97<br />
percent (idem).<br />
Surveys <strong>from</strong> other countries confirm<br />
lower levels of electoral turnout among<br />
young people. In Britain, age has been found<br />
to be a key factor in explaining involvement<br />
in formal politics, with widespread non-participation<br />
and political withdrawal apparent<br />
among young people, especially in voter registration.<br />
Ahead of the election in Britain in<br />
1997, young people were less likely to register<br />
to vote than other age-groups: 20 percent<br />
of 18 to 25-year-olds were not registered<br />
in 1995. Up to 40 percent of those<br />
aged 18-24 did not vote in the 1997 British<br />
elections (Fahmy, 1999). A similar trend was<br />
evident during the 2001 election, where the<br />
Market and Opinion Omnibus Survey (MORI<br />
surveys) found that 29 percent of 18 to 24 -<br />
year-old non-voters did not register to vote.<br />
The survey also estimates that turnout<br />
among 18-24 year olds fell to around 39 percent<br />
(Electoral Commission, 2001, 15).<br />
Low levels of youth participation are apparent<br />
not only in developed democracies but<br />
also in emerging democracies, for example<br />
an analysis of South Africa’s voters’ roll<br />
revealed that registration for the 1999 election<br />
decreased noticeably with age. Those<br />
citizens 80 years or older demonstrated the<br />
highest rate of registration at 97 percent of<br />
potential voters, and the lowest was among<br />
first-time voters aged 18 to 20 where not<br />
even 50 percent of those eligible registered<br />
to vote. As with many other countries, participation<br />
rates in the June 1999 election<br />
were not disaggregated by age or gender.<br />
However, given the low rate of registration<br />
by eligible young people, it is likely that<br />
turnout among potential first-time voters<br />
was well below 50 percent.<br />
However, it should not be concluded that<br />
age is the only variable that accounts for low<br />
voter turnout. Research has established that<br />
turnout is affected by a number of other factors,<br />
some relating to the individual microlevel<br />
(income, education, interest in politics)<br />
and others to the macro-level of the political<br />
system (the party system, the electoral system,<br />
election procedures). A multi-continental<br />
study commissioned by <strong>International</strong><br />
<strong>IDEA</strong> (Lagos and Rose, 1999) attempted to<br />
assess the extent of young people’s political<br />
involvement and how their outlook differed<br />
<strong>from</strong> that of older people. Their findings<br />
demonstrate that, while older people are<br />
more likely to vote than younger people, age<br />
112 <strong>Voter</strong> <strong>Turnout</strong> Since 1945 A Global Report
is only one variable (albeit important) that<br />
affects participation in the political process.<br />
Prosperity and education also show a positive<br />
correlation with democratic involvement.<br />
These conclusions are substantiated<br />
by research in other countries, for example<br />
the MORI Omnibus survey in Britain found<br />
that respondents who were unemployed or<br />
living on low incomes were less likely to be<br />
politically active than respondents with average<br />
or above-average incomes (Fahmy,<br />
1999). The cumulative effects of age, class<br />
and income seemingly influence patterns of<br />
political participation.<br />
Macro-level explanations, focusing on institutions<br />
and the political environment, go<br />
even further in accounting for low turnout<br />
among young people. The <strong>International</strong> <strong>IDEA</strong><br />
study, Youth <strong>Voter</strong> Participation highlights a<br />
number of factors that may affect participation:<br />
• the nature of the electoral system and<br />
whether all votes are seen to have equal<br />
weighting in the final result;<br />
• the registration system, if automatic or<br />
compulsory, facilitates higher voter<br />
turnout;<br />
• the frequency of elections is another factor,<br />
as “voter fatigue” increases with the<br />
number of elections;<br />
• the competitiveness of elections and the<br />
number of parties contesting them may<br />
also influence voting patterns. Highly competitive<br />
contests tend to increase interest<br />
and turnout; and<br />
• Countries with compulsory voting, like<br />
Australia, have higher levels of turnout<br />
<strong>Voter</strong> <strong>Turnout</strong><br />
(<strong>International</strong> <strong>IDEA</strong>, 1999, 31 - 32).<br />
In 1999, one hundred young people participated<br />
in the annual <strong>International</strong> <strong>IDEA</strong><br />
Democracy Forum “What’s So Great about<br />
Democracy? The Youth Speak Up!”. Key<br />
discussions centred on the future of democracy<br />
and the challenges and opportunities<br />
that confront young people. Participants<br />
noted several factors affecting youth participation<br />
in politics, <strong>from</strong> “not understanding<br />
how the system works, to a growing distrust<br />
of political institutions and leaders, to a lack<br />
of time in today’s competitive environment”.<br />
They also emphasized that they are not apathetic<br />
about politics but rather that they feel<br />
alienated <strong>from</strong> traditional political processes<br />
and are not convinced their participation can<br />
make a difference.<br />
Some participants said that they lacked<br />
confidence in the system and its leaders and<br />
felt that politicians only appeal to them during<br />
elections. “This gap between those who<br />
govern and those being governed seems to<br />
be getting wider and appears to be a fundamental<br />
reason for low participation.” Other<br />
reasons cited include lack of interest and<br />
disillusionment with the political and electoral<br />
system, doubts about the effectiveness<br />
of their votes, complaints about corruption in<br />
politics, and that they were not informed<br />
about where or how to vote (<strong>International</strong><br />
<strong>IDEA</strong> 1999c, 8, 33). It is also possible that<br />
young people take time to develop an interest<br />
in politics, as they lack experience with<br />
political matters and are less socially and<br />
politically integrated.<br />
While traditional party politics may be<br />
113
Youth <strong>Voter</strong> <strong>Turnout</strong><br />
unappealing to many, this is not to say that<br />
young people are not politically active. They<br />
are interested in specific issues, such as<br />
education, the environment and health care,<br />
and are consequently joining interest<br />
groups, non-governmental organizations or<br />
other associations that address their specific<br />
concerns. In turn, they are finding new<br />
ways to express themselves politically.<br />
However, in order to draw young people into<br />
the electoral process, different strategies<br />
may be considered:<br />
• Make it easier to register to vote: In most<br />
countries, registration is a prerequisite for<br />
voting. It is therefore strategic to encourage<br />
young people to register, through public<br />
information campaigns, school visits,<br />
information displays, by placing registration<br />
facilities in places frequented by young<br />
people or by making registration available<br />
REFERENCES<br />
Electoral Commission. 2001 run on<br />
Election 2001: The official Results.London, Politicos<br />
Fahmy, E. 1999. Young people’s political participation:<br />
results <strong>from</strong> a 1996 MORI [Market and Opinion]<br />
Omnibus survey. Radical Statistics 70,<br />
www.radstats.org.uk/no070/article3.htm.<br />
<strong>International</strong> <strong>IDEA</strong>. 1999. Youth <strong>Voter</strong> Participation:<br />
Involving Today’s Young in Tomorrow’s Democracy.<br />
Stockholm: <strong>International</strong> <strong>IDEA</strong>.<br />
over the Internet.<br />
• Facilitate easy voting: By making voting<br />
procedures simple and accessible and by<br />
disseminating information widely, young<br />
people may be more encouraged to participate.<br />
• Lower the voting age: Although considered<br />
somewhat controversial, this is one way to<br />
encourage the early politicisation of young<br />
people as participants in democracy.<br />
Minimum voting ages vary <strong>from</strong> 15 to 21<br />
years, but 18 years is the most common<br />
worldwide.<br />
• Support preparatory exercises like mock<br />
elections: This allows first-time voters to<br />
explore the practical workings of electoral<br />
procedures (<strong>International</strong> <strong>IDEA</strong>, 1999, 42-<br />
56).<br />
<strong>International</strong> <strong>IDEA</strong>. 1999. Democracy Forum Report.<br />
Youth and Democracy: Is There a Crisis? Stockholm:<br />
<strong>International</strong> <strong>IDEA</strong>.<br />
Lagos, M. and R. Rose. 1999. Young People in Politics:<br />
A Multi-Continental Survey. <strong>International</strong> <strong>IDEA</strong><br />
Democracy Forum, Stockholm, June 1999 (unpublished<br />
paper).<br />
114 <strong>Voter</strong> <strong>Turnout</strong> Since 1945 A Global Report
Internet<br />
Voting<br />
There has been much discussion on the use<br />
of Internet voting as a method for boosting<br />
turnout at elections and governments have<br />
shown an increasing willingness to experiment<br />
with the Internet.<br />
However, there is relatively little experience<br />
that suggests that Internet voting<br />
would increase turnout to any significant<br />
extent. Very few government level elections<br />
have featured Internet voting, so comparisons<br />
are not easily made.<br />
The 2000 report of the California Internet<br />
Voting Task Force predicts that Internet voting<br />
would increase turnout, especially<br />
among the young and busy professionals,<br />
Several-Day<br />
Polling<br />
The most cost-effective and practical procedure<br />
is to hold elections in one day. By<br />
doing so, ballot papers and ballot boxes do<br />
not have to be stored overnight, alleviating<br />
security concerns, and the workload of election<br />
officials is reduced. Only about 10 percent<br />
of the democracies in the world practise<br />
several-day polling. One example is<br />
who have easy access to the Internet and<br />
whose turnout rates are low. On the other<br />
hand, Internet voting may only make voting<br />
easier for the already privileged and not<br />
increase access for marginalized groups. In<br />
the United States, for example, black and<br />
Latino households are much less likely to<br />
have access to the Internet than white<br />
households.<br />
Much of the “hype” surrounding such elections<br />
comes <strong>from</strong> private companies and<br />
suppliers. Very few studies have examined<br />
the issue to determine if Internet voting can<br />
really increase access and therefore turnout.<br />
India, the largest electorate in the world with<br />
600 million voters, where elections are held<br />
on a staggered timetable across the country.<br />
There are countries, like Sierra Leone or<br />
Lesotho, where elections were held on one<br />
day but for logistical reasons polling time<br />
was extended in certain regions.<br />
115
Day of<br />
Election<br />
There is an active debate, especially in older<br />
democracies on how to increase voter<br />
turnout. Some of the factors that may<br />
increase turnout would require complicated<br />
changes in electoral laws and even in constitutions,<br />
while others, like changing the day<br />
of election, would require little effort but<br />
could have a significant impact.<br />
Of the 86 countries that Freedom House<br />
labelled as democratic in 1996, and that held<br />
election in one single day almost half of<br />
them had their latest election on Sunday.<br />
Saturday and Monday were the second<br />
most frequent election days. More recent<br />
figures also suggest that about half of the<br />
countries hold their elections on a non-business<br />
day.<br />
A study in 2000 suggested that weekend<br />
voting increases turnout rates far above statistical<br />
relevance. One analysis found that<br />
turnout figures would on average increase<br />
between five and six percentage points if<br />
Election Day for national elections changed<br />
<strong>from</strong> a weekday to a rest day. When it<br />
comes to elections for the European<br />
Parliament (which feature extremely low<br />
turnout in most EU countries), the same<br />
change could account for a nine percentage<br />
point increase.<br />
If election day were moved <strong>from</strong> a weekday<br />
to a Saturday or a Sunday, religious<br />
groups that worship on these days might be<br />
offended, but there is another possible solution<br />
to follow the example of a vast number<br />
of countries, including South Africa,<br />
Germany, India, Chile, Samoa, Vanuatu and<br />
the Philippines, where the election day automatically<br />
becomes a holiday.<br />
116 <strong>Voter</strong> <strong>Turnout</strong> Since 1945 A Global Report