Programm Photovoltaik Ausgabe 2009 ... - Bundesamt für Energie BFE
Programm Photovoltaik Ausgabe 2009 ... - Bundesamt für Energie BFE Programm Photovoltaik Ausgabe 2009 ... - Bundesamt für Energie BFE
5/9 Fig. 1.2) Summary of photovoltaic properties of solar cells treated with different amounts of sodium after the CIGS growth process: Shown are averaged values of 15 cells. An investigation of the CIGS cross-section with the scanning electron microscope (SEM), reveals, that the absorber microstructure is not affected by the post deposition treatment. Figure 1.3 shows a comparison of cross sections of sodium treated and un-treated samples. Both cells show a similar, dense structures and large grain size. Fig. 1.3) A comparison of SEM pictures of the cross section of treated and non-treated cells show, that the post deposition treatment leaves the microstructure of the CIGS absorber unaffected. Comparison of different methods of sodium incorporation In this section, results for different incorporation methods will be discussed. In addition to the post deposition treatment, co-evaporation of NaF parallel to the evaporation of the absorber material Cu, In, Ga and Se was performed. Based on the previous findings, the sodium fluoride evaporation rate was adjusted such, that during a deposition time of 15 min. the dosage was equivalent to the optimum 20 nm thick Na-layer. Using this evaporation rate, we deposited sodium i) during the first stage and ii) during the second stage of CIGS growth. Figure 1.4 shows the best results of the so processed solar cells. The cells which were processed at low substrate temperature of ~450°C yield efficiencies of 12,2% for Na co-evaporation in the 1 st stage and 12,7% for the Na co-evaporation during the 2 nd stage. The low temperature process was chosen here, since the temperature of ~450°C is the limit, when flexible cells on polyimide foils are produced. Furthermore stronger effects were expected at lower temperatures. Thus, the time of sodium LARCIS, A. N. Tiwari, ETH Zurich 99/290
application might become more important for the layer formation, in particular, since it is assumed that the presence of sodium hinders the elemental inter-diffusion during the CIGS growth process. However, as it is shown in figure 1.4, no significant differences in the electronic properties of the cells can be obtained. All electronic cell parameters show similar values, only the fill factor is slightly improved, when sodium is added to the absorber during the second growth stage. Fig. 1.4) Current-Voltage characteristics of 0,6 cm 2 CIGS solar cells: Sodium was added to the absorber by means of co-evaporation during i) the first stage (dashed – dotted line) and during ii) the second stage (solid - line) of the absorber growth process. Also the cross-sectional SEM photos of both solar cells in figure 1.5 show no differences. However, it is noticeable, that the grain size near the molybdenum back contact is significantly reduced for both samples. The thickness of this region corresponds to that evaporated during the first stage of the 3stage process, where only Ga, In and Se is deposited. It is known, that a Ga rich composition results in smaller grains. Thus it can be concluded, that due the presence of sodium the diffusion of Ga during the layer formation in the second process stage is impeded, what may lead to a Ga-rich composition. Fig. 1.5) Cross-sectional SEM photos of solar cells. The sodium was co-evaporated during the first stage (left) and during the second stage of the CIGS 3-stage process (right). The presence of sodium during the absorber growth results in small grain sizes near the Mo back contact. LARCIS, A. N. Tiwari, ETH Zurich 100/290 6/9
- Page 51 and 52: Goals of the project The goals of t
- Page 54 and 55: Eidgenössisches Departement für U
- Page 56: 3/3 on the front side. All the laye
- Page 59 and 60: Introduction / Project Goals Prior
- Page 62 and 63: Eidgenössisches Departement für U
- Page 64 and 65: 3/4 Effective light trapping scheme
- Page 66 and 67: Département fédéral de l’envir
- Page 68 and 69: 3/6 The Athlet consortium comprises
- Page 70 and 71: 5/6 Large area thin-film silicon ce
- Page 72 and 73: Eidgenössisches Departement für U
- Page 74 and 75: 3/4 Der verbesserte Lichteinfang is
- Page 76 and 77: Eidgenössisches Departement für U
- Page 78 and 79: 3/5 Results Microstructure characte
- Page 80: 5/5 Mechanical testing: The mechani
- Page 83 and 84: Introduction / Project goals The fo
- Page 85 and 86: Optimization of CdS chemical bath d
- Page 87 and 88: Fig. 5: J-V curve (left) and extern
- Page 90 and 91: Eidgenössisches Departement für U
- Page 92 and 93: 3/7 Work performed and results achi
- Page 94 and 95: 5/7 Fig. 3: Raman spectra recorded
- Page 96: 7/7 Measurements of solar cells per
- Page 99 and 100: Introduction / project objectives T
- Page 101: Optimum Na dosage Sodium layer with
- Page 105 and 106: In a second experiment the amount o
- Page 108 and 109: Eidgenössisches Departement für U
- Page 110 and 111: 3/9 After optimizing the In2S3 buff
- Page 112 and 113: 5/9 Indium sulfide layer characteri
- Page 114 and 115: 7/9 3) Semitransparent CIGS solar c
- Page 116: 9/9 Steps towards multi-junction so
- Page 119 and 120: Introduction / project objectives T
- Page 121 and 122: Figure 2: SEM picture of laser-abla
- Page 123 and 124: Introduction / project objectives T
- Page 125 and 126: Work progress and achievements duri
- Page 127 and 128: Furthermore, with a good reproducib
- Page 129 and 130: Main achievements - The association
- Page 131 and 132: Introduction Dye-sensitized solar c
- Page 134 and 135: Eidgenössisches Departement für U
- Page 136 and 137: 3/4 So far, experiments were perfor
- Page 138 and 139: Eidgenössisches Departement für U
- Page 140 and 141: 3/5 Tasks of the collaboration part
- Page 142: 5/5 Figure 4: Maximum achievable sh
- Page 145 and 146: Project Goals The goal is the estab
- Page 147 and 148: Evaluation 2008 and Outlook 2009 L'
- Page 149 and 150: Project Goals NAPOLYDE industrials
- Page 151 and 152: � Organic large solar panel and
5/9<br />
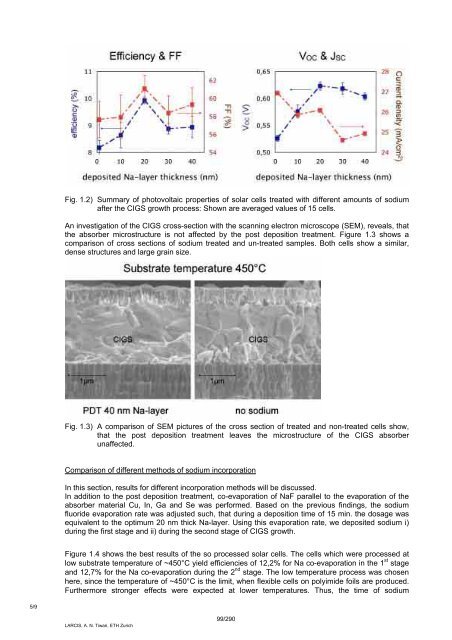
Fig. 1.2) Summary of photovoltaic properties of solar cells treated with different amounts of sodium<br />
after the CIGS growth process: Shown are averaged values of 15 cells.<br />
An investigation of the CIGS cross-section with the scanning electron microscope (SEM), reveals, that<br />
the absorber microstructure is not affected by the post deposition treatment. Figure 1.3 shows a<br />
comparison of cross sections of sodium treated and un-treated samples. Both cells show a similar,<br />
dense structures and large grain size.<br />
Fig. 1.3) A comparison of SEM pictures of the cross section of treated and non-treated cells show,<br />
that the post deposition treatment leaves the microstructure of the CIGS absorber<br />
unaffected.<br />
Comparison of different methods of sodium incorporation<br />
In this section, results for different incorporation methods will be discussed.<br />
In addition to the post deposition treatment, co-evaporation of NaF parallel to the evaporation of the<br />
absorber material Cu, In, Ga and Se was performed. Based on the previous findings, the sodium<br />
fluoride evaporation rate was adjusted such, that during a deposition time of 15 min. the dosage was<br />
equivalent to the optimum 20 nm thick Na-layer. Using this evaporation rate, we deposited sodium i)<br />
during the first stage and ii) during the second stage of CIGS growth.<br />
Figure 1.4 shows the best results of the so processed solar cells. The cells which were processed at<br />
low substrate temperature of ~450°C yield efficiencies of 12,2% for Na co-evaporation in the 1 st stage<br />
and 12,7% for the Na co-evaporation during the 2 nd stage. The low temperature process was chosen<br />
here, since the temperature of ~450°C is the limit, when flexible cells on polyimide foils are produced.<br />
Furthermore stronger effects were expected at lower temperatures. Thus, the time of sodium<br />
LARCIS, A. N. Tiwari, ETH Zurich<br />
99/290


