Canada - World Health Organization Regional Office for Europe
Canada - World Health Organization Regional Office for Europe
Canada - World Health Organization Regional Office for Europe

Create successful ePaper yourself
Turn your PDF publications into a flip-book with our unique Google optimized e-Paper software.
92<br />
15<br />
14<br />
13<br />
12<br />
11<br />
10<br />
9<br />
8<br />
7<br />
6<br />
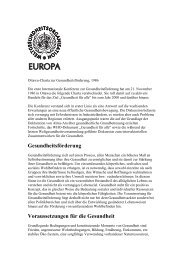
<strong>Health</strong> systems in transition <strong>Canada</strong><br />
Fig. 4.3<br />
Number of nurses per 1 000 population in <strong>Canada</strong> and selected countries, 1990–2010<br />
Nurses per 1 000<br />
1990<br />
1991 1992 1993 1994 1995 1996 1997 1998 1999 2000 2001 2002 2003 2004 2005 2006 2007 2008 2009 2010<br />
Sweden<br />
United States<br />
Australia<br />
United Kingdom<br />
<strong>Canada</strong><br />
Source: OECD (2011a).<br />
Note: Data <strong>for</strong> Australia, <strong>Canada</strong> and the United Kingdom are limited to non-administrative practising nurses, while data <strong>for</strong> France,<br />
Sweden and the United States include nurses working in administration, management or research.<br />
The trend in the number of dentists per 1000 population shows a marked<br />
contrast with that of nurses. The density of dentists has grown steadily since<br />
1990, a trend shared by only Australia among the countries in the comparator<br />
group (Fig. 4.4).<br />
When it comes to the density of pharmacists, <strong>Canada</strong> again shows steady<br />
growth in the last two decades. As can be seen in Fig. 4.5, this density level is<br />
similar to the comparator countries. The one exception is France, where the<br />
population has historically been among the largest consumers of prescription<br />
drugs in the world (Chevreul et al., 2010).<br />
France