Kshipra Sub Basin - Asian Development Bank
Kshipra Sub Basin - Asian Development Bank Kshipra Sub Basin - Asian Development Bank
Support to the National Water Mission NAPCC Appendix 3 Kshipra Sub Basin 3 C. Projects 3. There are three small dams on Kshipra as shown in Figure 4 and Table 1 summarises the details of the three medium scale projects Table 1 Medium Irrigation Projects Name District Potential Irrigated Area Year of created (ha) completion Sahibkhedi Ujjain 1440 984 1983 Kazikhedi Ujjain 1240 1366 1990 Dholavar Ratlam 6440 1353 Total 9120 3703 D. Climatic Norms, Kshipra Basin Figure 4: Project Locations 4. An assessment has been made of climatic norms in the Kshipra Basin using data for the station at Indore. The location of the stations is shown in Figure 2. In absence of meteorological data from the IMD at time for the preparation of this report, use was therefore made of the FAO CLIMWAT database1 which includes mean monthly meteorological data for over 5000 stations worldwide. 1 http://www.fao.org/nr/water/infores_databases_climwat.html
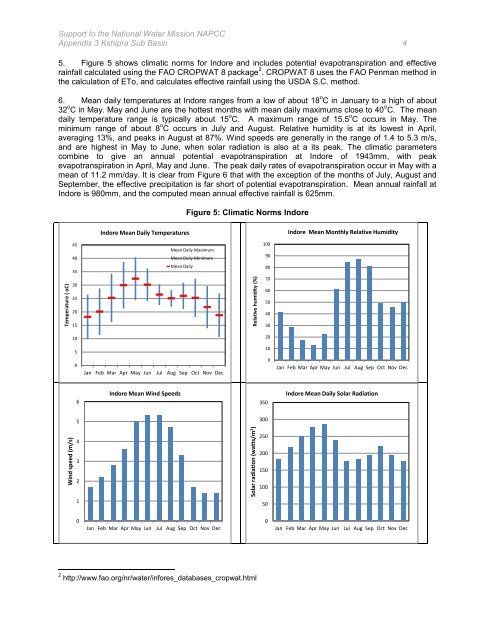
Support to the National Water Mission NAPCC Appendix 3 Kshipra Sub Basin 4 5. Figure 5 shows climatic norms for Indore and includes potential evapotranspiration and effective rainfall calculated using the FAO CROPWAT 8 package 2 . CROPWAT 8 uses the FAO Penman method in the calculation of ETo, and calculates effective rainfall using the USDA S.C. method. 6. Mean daily temperatures at Indore ranges from a low of about 18 o C in January to a high of about 32 o C in May. May and June are the hottest months with mean daily maximums close to 40 o C. The mean daily temperature range is typically about 15 o C. A maximum range of 15.5 o C occurs in May. The minimum range of about 8 o C occurs in July and August. Relative humidity is at its lowest in April, averaging 13%, and peaks in August at 87%. Wind speeds are generally in the range of 1.4 to 5.3 m/s, and are highest in May to June, when solar radiation is also at a its peak. The climatic parameters combine to give an annual potential evapotranspiration at Indore of 1943mm, with peak evapotranspiration in April, May and June. The peak daily rates of evapotranspiration occur in May with a mean of 11.2 mm/day. It is clear from Figure 6 that with the exception of the months of July, August and September, the effective precipitation is far short of potential evapotranspiration. Mean annual rainfall at Indore is 980mm, and the computed mean annual effective rainfall is 625mm. Temperature ( oC) Wind speed (m/s) 45 40 35 30 25 20 15 10 5 0 6 5 4 3 2 1 0 Indore Mean Daily Temperatures Jan Feb Mar Apr May Jun Jul Aug Sep Oct Nov Dec Indore Mean Wind Speeds Figure 5: Climatic Norms Indore Mean Daily Maximum Mean Daily Minimum Mean Daily Jan Feb Mar Apr May Jun Jul Aug Sep Oct Nov Dec 2 http://www.fao.org/nr/water/infores_databases_cropwat.html Relative humidity (%) Solar radiation (watts/m 2 ) 100 90 80 70 60 50 40 30 20 10 350 300 250 200 150 100 50 0 0 Indore Mean Monthly Relative Humidity Jan Feb Mar Apr May Jun Jul Aug Sep Oct Nov Dec Indore Mean Daily Solar Radiation Jan Feb Mar Apr May Jun Jul Aug Sep Oct Nov Dec
- Page 1 and 2: TA 7417- IND: Support for the Natio
- Page 3 and 4: Appendix 3 Kshipra Sub Basin Madhya
- Page 5 and 6: Support to the National Water Missi
- Page 7 and 8: Support to the National Water Missi
- Page 9 and 10: Support to the National Water Missi
- Page 11 and 12: Support to the National Water Missi
- Page 13 and 14: Support to the National Water Missi
- Page 15: Support to the National Water Missi
- Page 19 and 20: Support to the National Water Missi
- Page 21 and 22: Support to the National Water Missi
- Page 23 and 24: Support to the National Water Missi
- Page 25 and 26: Support to the National Water Missi
- Page 27 and 28: Support to the National Water Missi
- Page 29 and 30: Support to the National Water Missi
- Page 31 and 32: Support to the National Water Missi
- Page 33 and 34: Support to the National Water Missi
- Page 35 and 36: Support to the National Water Missi
- Page 37 and 38: Support to the National Water Missi
- Page 39 and 40: Support to the National Water Missi
- Page 41 and 42: Support to the National Water Missi
- Page 43 and 44: Support to the National Water Missi
- Page 45 and 46: Support to the National Water Missi
- Page 47 and 48: Support to the National Water Missi
- Page 49 and 50: Support to the National Water Missi
- Page 51 and 52: Support to the National Water Missi
- Page 53 and 54: Support to the National Water Missi
- Page 55 and 56: Support to the National Water Missi
- Page 57 and 58: Support to the National Water Missi
- Page 59 and 60: Support to the National Water Missi
- Page 61 and 62: Support to the National Water Missi
- Page 63 and 64: Support to the National Water Missi
- Page 65 and 66: Support to the National Water Missi
Support to the National Water Mission NAPCC<br />
Appendix 3 <strong>Kshipra</strong> <strong>Sub</strong> <strong>Basin</strong> 4<br />
5. Figure 5 shows climatic norms for Indore and includes potential evapotranspiration and effective<br />
rainfall calculated using the FAO CROPWAT 8 package 2 . CROPWAT 8 uses the FAO Penman method in<br />
the calculation of ETo, and calculates effective rainfall using the USDA S.C. method.<br />
6. Mean daily temperatures at Indore ranges from a low of about 18 o C in January to a high of about<br />
32 o C in May. May and June are the hottest months with mean daily maximums close to 40 o C. The mean<br />
daily temperature range is typically about 15 o C. A maximum range of 15.5 o C occurs in May. The<br />
minimum range of about 8 o C occurs in July and August. Relative humidity is at its lowest in April,<br />
averaging 13%, and peaks in August at 87%. Wind speeds are generally in the range of 1.4 to 5.3 m/s,<br />
and are highest in May to June, when solar radiation is also at a its peak. The climatic parameters<br />
combine to give an annual potential evapotranspiration at Indore of 1943mm, with peak<br />
evapotranspiration in April, May and June. The peak daily rates of evapotranspiration occur in May with a<br />
mean of 11.2 mm/day. It is clear from Figure 6 that with the exception of the months of July, August and<br />
September, the effective precipitation is far short of potential evapotranspiration. Mean annual rainfall at<br />
Indore is 980mm, and the computed mean annual effective rainfall is 625mm.<br />
Temperature ( oC)<br />
Wind speed (m/s)<br />
45<br />
40<br />
35<br />
30<br />
25<br />
20<br />
15<br />
10<br />
5<br />
0<br />
6<br />
5<br />
4<br />
3<br />
2<br />
1<br />
0<br />
Indore Mean Daily Temperatures<br />
Jan Feb Mar Apr May Jun Jul Aug Sep Oct Nov Dec<br />
Indore Mean Wind Speeds<br />
Figure 5: Climatic Norms Indore<br />
Mean Daily Maximum<br />
Mean Daily Minimum<br />
Mean Daily<br />
Jan Feb Mar Apr May Jun Jul Aug Sep Oct Nov Dec<br />
2 http://www.fao.org/nr/water/infores_databases_cropwat.html<br />
Relative humidity (%)<br />
Solar radiation (watts/m 2 )<br />
100<br />
90<br />
80<br />
70<br />
60<br />
50<br />
40<br />
30<br />
20<br />
10<br />
350<br />
300<br />
250<br />
200<br />
150<br />
100<br />
50<br />
0<br />
0<br />
Indore Mean Monthly Relative Humidity<br />
Jan Feb Mar Apr May Jun Jul Aug Sep Oct Nov Dec<br />
Indore Mean Daily Solar Radiation<br />
Jan Feb Mar Apr May Jun Jul Aug Sep Oct Nov Dec


