Kshipra Sub Basin - Asian Development Bank
Kshipra Sub Basin - Asian Development Bank
Kshipra Sub Basin - Asian Development Bank

Create successful ePaper yourself
Turn your PDF publications into a flip-book with our unique Google optimized e-Paper software.
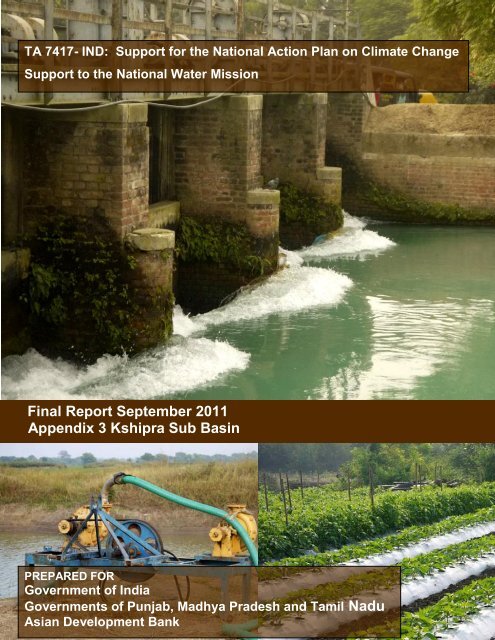
TA 7417- IND: Support for the National Action Plan on Climate Change<br />
Support to the National Water Mission<br />
Final Report September 2011<br />
Appendix 3 <strong>Kshipra</strong> <strong>Sub</strong> <strong>Basin</strong><br />
PREPARED FOR<br />
Government of India<br />
Governments of Punjab, Madhya Pradesh and Tamil Nadu<br />
<strong>Asian</strong> <strong>Development</strong> <strong>Bank</strong>
Support to the National Water Mission NAPCC<br />
Appendix 3 <strong>Kshipra</strong> <strong>Sub</strong> <strong>Basin</strong> ii
Appendix 3<br />
<strong>Kshipra</strong> <strong>Sub</strong> <strong>Basin</strong> Madhya Pradesh<br />
``
Support to the National Water Mission NAPCC<br />
Appendix 3 <strong>Kshipra</strong> <strong>Sub</strong> <strong>Basin</strong> ii
Support to the National Water Mission NAPCC<br />
Appendix 3 <strong>Kshipra</strong> <strong>Sub</strong> <strong>Basin</strong> iii<br />
SUMMARY OF ABBREVIATIONS<br />
A1B IPCC Climate Change Scenario A1 assumes a world of very rapid economic growth, a global<br />
population that peaks in mid-century and rapid introduction of new and more efficient technologies.<br />
A1 is divided into three groups that describe alternative directions of technological change: fossil<br />
intensive (A1FI), non-fossil energy resources (A1T) and a balance across all sources (A1B).<br />
A2 IPCC climate change Scenario A2 describes a very heterogeneous world with high population<br />
growth, slow economic development and slow technological change.<br />
ADB <strong>Asian</strong> <strong>Development</strong> <strong>Bank</strong><br />
AGTC Agriculture Technocrats Action Committee of Punjab<br />
AOGCM Atmosphere Ocean Global Circulation Model<br />
APHRODITE <strong>Asian</strong> Precipitation - Highly-Resolved Observational Data Integration Towards Evaluation of Water<br />
Resources - a observed gridded rainfall dataset developed in Japan<br />
APN <strong>Asian</strong> Pacific Network for Global Change Research<br />
AR Artificial Recharge<br />
AR4 IPCC Fourth Assessment Report<br />
AR5 IPCC Fifth Assessment Report<br />
AWM Adaptive Water Management<br />
B1 IPCC climate change Scenario B1 describes a convergent world, with the same global population as<br />
A1, but with more rapid changes in economic structures toward a service and information economy.<br />
B2 IPCC climate change Scenario B2 describes a world with intermediate population and economic<br />
growth, emphasising local solutions to economic, social, and environmental sustainability.<br />
BBMB Bhakra Beas Management Board<br />
BCM Billion Cubic Metres<br />
BML Bhakra Main Line Canal<br />
BPL Below the Poverty Line<br />
BPMO <strong>Basin</strong> Planning and Management Organisation of the CWC<br />
CAD Command Area <strong>Development</strong><br />
CADA Command Area <strong>Development</strong> Authority<br />
CBO Community Based Organisation<br />
CCA Command Control Area<br />
CCIP Climate Change Implementation Plan<br />
CDM Clean <strong>Development</strong> Mechanism<br />
CDMR Cauvery Delta Modernisation Report<br />
CESER Centre for Earth Systems Engineering Research, Newcastle University, UK<br />
CGIAR Consultative Group on International Agricultural Research<br />
CGWA Central Ground Water Authority<br />
CGWB Central Ground Water Board<br />
CMIP Coupled Model Intercomparison Project - an IPCC initiative to compare climate models<br />
CMR Cauvery Modernization Report<br />
CNES French Centre National d‘Etudes Spatiales<br />
CPCB Central Pollution Control Board<br />
CSK HPAU CSK Himachal Pradesh Agricultural University<br />
CUSECS Cubic feet per second<br />
CWC Central Water Commission<br />
CWPRS Central Water and Power Research Station<br />
DEA Department of Economic Affairs<br />
DEM Digital Elevation Model<br />
DJF December-January-February<br />
DMC Developing Member Country<br />
DMR Delta Management Report<br />
DSS Decision Support System<br />
DSSAT Decision Support System for Agricultural Technology<br />
DTR Diurnal Temperature Range<br />
EC Electrical Conductivity<br />
ED&MM Exploratory Drilling and Materials Management<br />
EIA Environmental Impact Assessment<br />
EMC Environmental Monitoring Committee<br />
EMP Environmental Management Plan<br />
ESSP Earth System Science Programme<br />
ETo Evapotranspiration<br />
FAO Food and Agriculture Organisation of the United Nations<br />
FASS Farmers Advisory Services Schemes
Support to the National Water Mission NAPCC<br />
Appendix 3 <strong>Kshipra</strong> <strong>Sub</strong> <strong>Basin</strong> iv<br />
FPARP Farmer's Participatory Action Research Programme<br />
FYP Five Year Plan<br />
GCM Global Circulation or Climate Model<br />
GIS Geographic Information Systems<br />
GLOF Glacial Lake Outburst Flood<br />
GOI Government of India<br />
GRBMP Ganga River <strong>Basin</strong> Management Plan<br />
GSI Geological Survey of India<br />
GW Groundwater<br />
HAM Hectare Metres<br />
HIS Hydrological Information System<br />
HP Himachal Pradesh<br />
HP2 Hydrology Project 2<br />
I&D Irrigation and Drainage<br />
ICIMOD International Centre for Integrated Mountain <strong>Development</strong><br />
ICT Information and Communication Technologies<br />
IITM Indian Institute for Tropical Meteorology<br />
IMD Indian Meteorological Department<br />
IMTI Irrigation Management Training Institute<br />
INCCA Indian Network of Climate Change Assessment<br />
IPCC International Panel on Climate Change<br />
IRBM Integrated River <strong>Basin</strong> Management<br />
IS Institutional Strengthening<br />
ISRO Indian Space Research Organisation<br />
IWRM Integrated Water Resources Management<br />
JF January-February<br />
JJAS June-July-August-September<br />
KVK Krishi Vigyan Kendras<br />
LBC Lateral Boundary Conditions<br />
l/s/ha litre per second per hectare<br />
LBC Lateral Boundary Conditions<br />
LIS Legal Information System<br />
MAM March-April-May<br />
MCM Million Cubic Meters<br />
MODFLOW Three-dimensional finite-difference groundwater flow model developed by the US Geological Survey<br />
MoEF Ministry of Environment and Forests<br />
MOHC Met Office Hadley Centre (UK)<br />
MOU Memorandum of Understanding<br />
MoWR Ministry of Water Resources<br />
MP Madhya Pradesh<br />
msl Mean Sea Level<br />
MSP Minimum Support Price<br />
MTM Megha-Tropiques Mission<br />
NAPCC National Action Plan for Climate Change<br />
NARBO Network of <strong>Asian</strong> River <strong>Basin</strong> Organisations<br />
NCDS National Committee on Dam Safety<br />
NCIWRD National Commission for Water Resources <strong>Development</strong><br />
NCMRFF National Centre for Medium Range Weather Forecasting<br />
NDC National Data Centre, India<br />
NDMA National Disaster Management Agency<br />
NGO Non-Governmental Organisation<br />
NIH National Institute of Hydrology<br />
NMSKCC National Mission on Strategic Knowledge for Climate Change<br />
NREGA National Rural Employment Guarantee Act<br />
NRSA National Remote Sensing Agency<br />
NSRC National Remote Sensing Centre<br />
NWH North-western Himalayan Region<br />
NWM National Water Mission of the NAPCC<br />
ON October-November<br />
OND October-November-December<br />
PAFC Punjab Agro Foods Corporation<br />
PAO Project Appraisal Organisation
Support to the National Water Mission NAPCC<br />
Appendix 3 <strong>Kshipra</strong> <strong>Sub</strong> <strong>Basin</strong> v<br />
PATA Policy Advisory Technical Assistance<br />
PAU Punjab Agricultural University<br />
PES Payment for Environmental Services<br />
PIM Participatory Irrigation Management<br />
PPE Perturbed Physics Ensemble<br />
PPP Public Private Partnerships<br />
PRA Participatory Rural Appraisal<br />
PRECIS Providing Regional Climates for Impacts Studies<br />
PRI Panchayati Raj Institutions<br />
PWD Public Works Department<br />
Q14, Q1 Q0 Identifiers for runs with different perturbations<br />
QUMP Quantifying Uncertainty in Model Predictions is an approach which aims to provide probabilistic<br />
projections of future climate.<br />
RegCM Regional Climate Model system RegCM<br />
R&R Rehabilitation and Resettlement<br />
RBO River <strong>Basin</strong> Organisation<br />
RCM Regional Circulation or Climate Model<br />
RCP Representative Concentration Pathways<br />
RGNGT&RI Rajiv Gandhi National Ground Water Training and Research Institute<br />
RSC Residual Sodium Carbonate<br />
RTDSS Real Time Data Support Systems<br />
SAM Survey Assessment and Monitoring<br />
SAPCC State Action Plans for Climate Change<br />
SD&MA Service Delivery and Management Alternatives<br />
SGWA State Ground Water Authority<br />
SML Sustainable Management and Liaison<br />
S-NWM ADB Support TA to the National Water Mission of the NAPCC<br />
SRES Special Report on Emission Scenario (IPCC SRES November 2000<br />
SRI System of Rice Intensification<br />
SRTM90 A DEM with 90m resolution developed by the Shuttle Radar Topography Mission<br />
START Global change system for analysis, research and training coordinated by IIT Mumbai<br />
SWAP Soil-Water-Atmosphere-Plant<br />
SWAT Soil and Water Assessment Tool<br />
T&TT Training and Technology Transfer<br />
TA Technical Assistance<br />
TERI The Energy and Resources Institute<br />
TN Tamil Nadu<br />
TNRRI Tamil Nadu Rice Research Institute<br />
TNSEB Tamil Nadu State Electricity Board<br />
UKIERI UK India Education and Research Initiative<br />
UNDP United Nations <strong>Development</strong> Programme<br />
UNEP United Nations Environment Programme<br />
USDA United States Department of Agriculture<br />
UT Union Territory<br />
WC Conveyance efficiency<br />
WD Drainage efficiency<br />
WEAP Water Evaluation and Planning System- planning tool from Stockholm Environment Institute<br />
WF On-farm application efficiency<br />
WHS Water Harvesting Structures<br />
WP Water use efficiency at the project level<br />
WQAA Water Quality Assessment Authority<br />
WR Reservoir or weir efficiency<br />
WRCRC Water Resources Control and Review Council<br />
WRD Water Resources Department<br />
WRIS Water Resources Information System<br />
WRO Water Resources Organisation<br />
WUA Water Users Association<br />
WWF World Wildlife Fund<br />
TABLE OF CONTENTS
Support to the National Water Mission NAPCC<br />
Appendix 3 <strong>Kshipra</strong> <strong>Sub</strong> <strong>Basin</strong> vi<br />
PART 3A SUB BASIN PROFILE<br />
I. SURFACE WATER RESOURCES ............................................................................ 1<br />
A. <strong>Kshipra</strong> <strong>Sub</strong> <strong>Basin</strong> Characteristics ......................................................................... 1<br />
B. The Hydrometric Network ....................................................................................... 2<br />
C. Projects .................................................................................................................. 3<br />
D. Climatic Norms, <strong>Kshipra</strong> <strong>Basin</strong> ............................................................................... 3<br />
E. Precipitation in the <strong>Kshipra</strong> <strong>Basin</strong> ........................................................................... 5<br />
F. Trends in Annual and Seasonal Rainfall .............................................................. 14<br />
II. GROUNDWATER ................................................................................................ 18<br />
A. Introduction .......................................................................................................... 18<br />
B. Groundwater......................................................................................................... 18<br />
C. Groundwater Levels and Trends .......................................................................... 18<br />
D. Artificial Recharge: ............................................................................................... 21<br />
E. Groundwater Irrigation .......................................................................................... 22<br />
F. Regulatory Framework Relating to Groundwater ................................................. 24<br />
G. Groundwater Problems and issues ...................................................................... 24<br />
III. IRRIGATION AND DRAINAGE ............................................................................ 33<br />
A. Introduction .......................................................................................................... 33<br />
B. Agriculture ............................................................................................................ 33<br />
C. Surface Water Schemes ...................................................................................... 34<br />
D. Potable Water....................................................................................................... 35<br />
E. Constraints Faced by Farmers in the <strong>Basin</strong> ......................................................... 35<br />
IV. WATER SECTOR COMMUNITIES AND STAKEHOLDERS................................ 36<br />
A. Introduction .......................................................................................................... 36<br />
B. Stakeholder Perceptions to Surface Groundwater and Environment ................... 37<br />
PART 3B STRATEGIC FRAMEWORK PLAN<br />
V. INSTITUTIONS .................................................................................................... 50<br />
A. Summary of Policy Acts and Institutions .............................................................. 50<br />
VI. INTRODUCTION .................................................................................................. 54<br />
A. Approach .............................................................................................................. 54<br />
B. Summary of Key Issues ....................................................................................... 54<br />
VII. STRATEGIES TO ADDRESS CURRENT ISSUES .............................................. 55<br />
A. Strategy for Adaptation Planning .......................................................................... 55<br />
B. Farmers‘ Perceptions ........................................................................................... 55<br />
C. Surface Water Resources .................................................................................... 57<br />
D. Agriculture Options to Reduce Water Demand..................................................... 59
Support to the National Water Mission NAPCC<br />
Appendix 3 <strong>Kshipra</strong> <strong>Sub</strong> <strong>Basin</strong> vii<br />
E. Groundwater......................................................................................................... 62<br />
F. Government Institutions ....................................................................................... 67<br />
VIII. CLIMATE CHANGE SCENARIOS .................................................................... 73<br />
A. Introduction .......................................................................................................... 73<br />
B. Summary of Observed Changes to the Present Time .......................................... 73<br />
C. Relevant Climate Change Studies and Findings .................................................. 73<br />
D. Scenarios for Change ........................................................................................... 74<br />
E. Analysis of the Climate Change Data ................................................................... 80<br />
F. Water Resources .................................................................................................. 80<br />
FIGURES<br />
Figure 1: <strong>Kshipra</strong> sub-basin .......................................................................................................................... 1<br />
Figure 2: Hydrometric Network ..................................................................................................................... 2<br />
Figure 3: Hydrometeorological Sites ............................................................................................................. 2<br />
Figure 4: Project Locations ........................................................................................................................... 3<br />
Figure 5: Climatic Norms Indore ................................................................................................................... 4<br />
Figure 6: Potential Evapotranspiration and Effective Rainfall ....................................................................... 5<br />
Figure 7: Mean Annual Precipitation ............................................................................................................. 6<br />
Figure 8: Coefficients of Variation of Annual Rainfall ................................................................................... 6<br />
Figure 9: Deviation from Mean Annual Rainfall at IMD Grids ....................................................................... 7<br />
Figure 10: Mean Annual Precipitation in the <strong>Kshipra</strong> .................................................................................... 8<br />
Figure 11: Coefficient of Variation in Mean Precipitation .............................................................................. 9<br />
Figure 12: Coefficients of Variation in JJAS Rainfall .................................................................................. 10<br />
Figure 13: Mean JJAS Precipitation ............................................................................................................ 10<br />
Figure 14: Coefficients of Variation in OND Rainfall ................................................................................... 11<br />
Figure 15: Mean JF Precipitation ................................................................................................................ 11<br />
Figure 16: Co-efficient of Variation in JJAS Rainfall ................................................................................... 12<br />
Figure 17: Kharif Season Drought with 10mm threshold ............................................................................ 13<br />
Figure 18: Rabi Season Drought Durations with 10mm threshold.............................................................. 13<br />
Figure 19: Time Series of Annual Droughts with 10mm threshold in Kharif Season .................................. 14<br />
Figure 20: Locations of IMD observed raingauge stations in the <strong>Kshipra</strong> basins ...................................... 15<br />
Figure 21: Time series of southwest monsoon rainfall at Indore ................................................................ 17<br />
Figure 22 Time series of southwest monsoon rainfall at Ujjain .................................................................. 17<br />
Figure 23: Drip Irrigation in Dewas ............................................................................................................. 24<br />
Figure 25: Hydrogeological Map ................................................................................................................ 25<br />
Figure 26: Groundwater Ujjain .................................................................................................................... 26<br />
Figure 27: Groundwater Dewas .................................................................................................................. 27<br />
Figure 28: Groundwater Observation Wells ................................................................................................ 28<br />
Figure 29: Pre and Post Monsoon Depth to Groundwater .......................................................................... 29<br />
Figure 30: Hydrographs Dewas and Ujjain ................................................................................................. 30<br />
Figure 31: Hydrograph of Indore and Ujjain ................................................................................................ 31<br />
Figure 32: Electrical Conductivity ................................................................................................................ 32<br />
Figure 33: Areas Identified for Artificial Recharge in MP ............................................................................ 32<br />
Figure 34: Structure of Users and Providers............................................................................................... 37<br />
Figure 35: Possible Methods to Improve Water Efficiency (% households) Dewas ................................... 41<br />
Figure 36: Possible Methods to Improve Water Efficiency (% households) Indore .................................... 42<br />
Figure 37: Possible Methods to Improve Efficiency (% households) Ujjain ................................................ 43<br />
Figure 38: Climate Changes as Observer in the Last 10 years .................................................................. 46<br />
Figure 39: Water Management Issues ........................................................................................................ 48<br />
Figure 40: Indore Potential Evapotranspiration and Effective Rainfall ....................................................... 60<br />
Figure 41 : Gated Pipe and Furrow Irrigation.............................................................................................. 61<br />
Figure 42: Cross Section of the Aquifer ...................................................................................................... 63
Support to the National Water Mission NAPCC<br />
Appendix 3 <strong>Kshipra</strong> <strong>Sub</strong> <strong>Basin</strong> viii<br />
Figure 43: Linkage of Surface and Groundwater Resources ...................................................................... 65<br />
Figure 44: The PRECIS Data Grids ............................................................................................................ 74<br />
Figure 45: Change in Average Daily Temperatures ................................................................................... 76<br />
Figure 46: Change in Average Precipitation ............................................................................................... 77<br />
Figure 47 : Change in Average Seasonal Precipitation .............................................................................. 78<br />
Figure 48: Simulated Seasonal and Annual Rainfall, A1B scenario .......................................................... 79<br />
Figure 49: Digital Elevation Model of <strong>Kshipra</strong> <strong>Basin</strong> .................................................................................. 83<br />
Figure 50: <strong>Sub</strong>-basin delineation ................................................................................................................ 84<br />
Figure 51: <strong>Kshipra</strong> <strong>Basin</strong> land use .............................................................................................................. 85<br />
Figure 52: <strong>Kshipra</strong> <strong>Basin</strong> soils..................................................................................................................... 86<br />
Figure 53 <strong>Kshipra</strong> <strong>Basin</strong> – Observed Stream gauge locations .................................................................. 87<br />
Figure 54: <strong>Kshipra</strong> <strong>Basin</strong> – Calibration at Ujjain ........................................................................................ 88<br />
Figure 55: <strong>Kshipra</strong> <strong>Basin</strong> – Calibration at Mahidpur .................................................................................. 89<br />
Figure 56: <strong>Kshipra</strong> <strong>Basin</strong> – Annual, JJAS and OND precipitation ............................................................. 90<br />
Figure 57: <strong>Kshipra</strong> <strong>Basin</strong> – Coefficient of Variation in Annual, JJAS and OND precipitation .................... 90<br />
Figure 58: Mean Monthly Discharges Simulated from Observed and PRECIS A1B Baseline .................. 91<br />
Figure 59: Change in Annual Water Balance to Mid Century ................................................................... 94<br />
Figure 60: Change in JJAS Water Balance to Mid Century ...................................................................... 95<br />
Figure 61: Change in OND Water Balance to Mid Century ....................................................................... 96<br />
Figure 62: Change in Monsoon Drought Weeks with Respect to Baseline ............................................... 98<br />
Figure 63: Annual Average Flow Dependability towards 2030s and 2080s with respect to 1970s ............ 99<br />
TABLES<br />
Table 1: Medium Irrigation Projects .............................................................................................................. 3<br />
Table 2: Annual rainfall trends .................................................................................................................... 16<br />
Table 3: Seasonal rainfall trends, southeast monsoon (June-September) ................................................ 16<br />
Table 4: Seasonal rainfall trends, northeast monsoon (October-December) ............................................ 16<br />
Table 5: Mean Groundwater Levels in <strong>Kshipra</strong> sub-basin ......................................................................... 18<br />
Table 6: Groundwater Levels and Trend ................................................................................................... 19<br />
Table 7: Fluoride and Nitrate Levels of Shallow Groundwater in <strong>Kshipra</strong> sub-basin................................. 19<br />
Table 8: Dynamic Groundwater Resources of Chambal <strong>Basin</strong> (in BCM) .................................................. 19<br />
Table 9: Groundwater Resources by District (MCM)) ................................................................................ 20<br />
Table 10: Dynamic Groundwater Resources of District and by Block ........................................................ 20<br />
Table 11: Feasibility of Artificial recharge .................................................................................................. 21<br />
Table 12: Irrigation Dug Wells ..................................................................................................................... 22<br />
Table 13: Cultivable Command Area and Irrigation Through Dug Well ...................................................... 22<br />
Table 14: Irrigation from Shallow Tubewells ............................................................................................... 22<br />
Table 15: Distribution of Shallow Tubewells by Type ................................................................................. 22<br />
Table 16: Cultivable Command Area and Irrigation potential created Through Shallow Tubewell ............ 22<br />
Table 17 : Deep Tube Wells........................................................................................................................ 22<br />
Table 18: Cultivable Command Area and Irrigation Potential Through Deep Tubewell ............................. 23<br />
Table 19: Cultivable Command Area and Irrigation Potential created Through Deep Tube Well .............. 23<br />
Table 20: Distribution of Dugwells as Per Average Pumping Hours And Distribution System ................... 23<br />
Table 21: Distribution of Shallow Tubewells ............................................................................................... 23<br />
Table 22: Distribution of Deep Tubewells ................................................................................................... 23<br />
Table 23 Area of Horticulture ...................................................................................................................... 34<br />
Table 24 Farmer Response to Possible Initiatives...................................................................................... 40<br />
Table 25: Primary drinking water in wet season (% of households from the sample ) ............................... 44<br />
Table 26: Primary drinking water in dry seasons (% of households from the sample) .............................. 44<br />
Table 27: Drinking Water Availability (% of Households from the sample) ................................................ 44<br />
Table 28: Drinking Water Quality (% of Households from the sample) ...................................................... 44<br />
Table 29: Number of Blocks and Stage of GW <strong>Development</strong>..................................................................... 54<br />
Table 30: Net Area Irrigated from Different Sources (ha) ........................................................................... 57<br />
Table 31: Proposed Dams in <strong>Kshipra</strong> ......................................................................................................... 58<br />
Table 32: Crop Water Needs ...................................................................................................................... 59
Support to the National Water Mission NAPCC<br />
Appendix 3 <strong>Kshipra</strong> <strong>Sub</strong> <strong>Basin</strong> ix<br />
Table: 33 Key Issues ................................................................................................................................... 67<br />
Table 34: Key Areas for Capacity Building ................................................................................................. 71<br />
Table 35: PRECIS Simulated seasonal temperatures, A1B scenario ........................................................ 75<br />
Table 36 Comparison of projected changes in temperatures, A1B, A2 and B2 scenarios, 2080s ............. 75<br />
Table 37: PRECIS Simulated seasonal precipitation in the <strong>Kshipra</strong> sub-basin, A1B scenario (mm) ......... 77<br />
Table 38: Projected changes in seasonal precipitation under the A1B, A2 and B2 scenarios, to 2080s ... 77<br />
Table 39; Elevation Summary – <strong>Kshipra</strong> <strong>Basin</strong> ......................................................................................... 83<br />
Table 40: Land use Categories – <strong>Kshipra</strong> <strong>Basin</strong>......................................................................................... 85<br />
Table 41: SWAT model efficiency parameters for the <strong>Kshipra</strong> <strong>Basin</strong> ......................................................... 88<br />
Table 42: Mean Monthly Flows simulated from Observed and PRECIS A1B Baseline Weather ............... 91<br />
Table 43: Summary of Change in water balance ++ expressed as percent change in precipitation ............ 92
Appendix 3A: <strong>Kshipra</strong> <strong>Sub</strong> <strong>Basin</strong>, Madhya<br />
Pradesh<br />
<strong>Sub</strong> <strong>Basin</strong> Profile
Support to the National Water Mission NAPCC<br />
Appendix 3 <strong>Kshipra</strong> <strong>Sub</strong> <strong>Basin</strong> xi
Support to the National Water Mission NAPCC<br />
Appendix 3 <strong>Kshipra</strong> <strong>Sub</strong> <strong>Basin</strong> 1<br />
A. <strong>Kshipra</strong> <strong>Sub</strong> <strong>Basin</strong> Characteristics<br />
I. SURFACE WATER RESOURCES<br />
1. The <strong>Kshipra</strong> is a river of Central India, also called <strong>Kshipra</strong> or Avanti nadi. The <strong>Kshipra</strong> river<br />
originates in the Vindhya Range and flows in a northerly direction across the Malwa plateau to join the<br />
Chambal River. Upstream of its confluence with the Chambal, the <strong>Kshipra</strong> has a catchment area of 5600<br />
km 2 . Its nominal source is on the Kokri Bardi hill, 20km south-east of Indore near the small village of Ujeni<br />
(22° 31' N. and 76° E.). It is considered as sacred as the Ganga river by the Hindus. The holy city of<br />
Ujjain is located on the right bank of the <strong>Kshipra</strong> river. The river flows in a general north-westerly direction<br />
and has a very sinuous course. The total course of about 190km flows through Indore, Dewas and<br />
Gwalior districts of the state; it finally joins the Chambal near Kalu-Kher village (23° 53' N. and 75° 31'').<br />
The main tributaries of <strong>Kshipra</strong> include the Khan river near Ujjain and the Ghambir river near Mahidpur.<br />
The main course of the <strong>Kshipra</strong> lies over the grassy plains of Malwa between low banks and from<br />
Mahidpur and it is characterised by high rocky banks. Over the years the river has lost its perennial<br />
nature and now runs dry for a period of 5 to 6 months per year. The water of the <strong>Kshipra</strong> is used for<br />
drinking, industrial and lift irrigation purposes. The main land use along the river is agriculture. The basin<br />
location and key topographic and drainage details are shown in Figure 1.<br />
Figure 1: <strong>Kshipra</strong> sub-basin
Support to the National Water Mission NAPCC<br />
Appendix 3 <strong>Kshipra</strong> <strong>Sub</strong> <strong>Basin</strong> 2<br />
B. The Hydrometric Network<br />
2. The hydrometric network in the basin consists six rain gauges and four meteorological stations<br />
maintained by the Indian Meteorological Department (IMD) as shown in Figure 2 and Figure 3 .<br />
Figure 2: Hydrometric Network<br />
Figure 3: Hydrometeorological Sites
Support to the National Water Mission NAPCC<br />
Appendix 3 <strong>Kshipra</strong> <strong>Sub</strong> <strong>Basin</strong> 3<br />
C. Projects<br />
3. There are three small dams on <strong>Kshipra</strong> as shown in Figure 4 and Table 1 summarises the details<br />
of the three medium scale projects<br />
Table 1 Medium Irrigation Projects<br />
Name District Potential Irrigated Area Year of<br />
created (ha)<br />
completion<br />
Sahibkhedi Ujjain 1440 984 1983<br />
Kazikhedi Ujjain 1240 1366 1990<br />
Dholavar Ratlam 6440 1353<br />
Total 9120 3703<br />
D. Climatic Norms, <strong>Kshipra</strong> <strong>Basin</strong><br />
Figure 4: Project Locations<br />
4. An assessment has been made of climatic norms in the <strong>Kshipra</strong> <strong>Basin</strong> using data for the station at<br />
Indore. The location of the stations is shown in Figure 2. In absence of meteorological data from the IMD<br />
at time for the preparation of this report, use was therefore made of the FAO CLIMWAT database1 which<br />
includes mean monthly meteorological data for over 5000 stations worldwide.<br />
1 http://www.fao.org/nr/water/infores_databases_climwat.html
Support to the National Water Mission NAPCC<br />
Appendix 3 <strong>Kshipra</strong> <strong>Sub</strong> <strong>Basin</strong> 4<br />
5. Figure 5 shows climatic norms for Indore and includes potential evapotranspiration and effective<br />
rainfall calculated using the FAO CROPWAT 8 package 2 . CROPWAT 8 uses the FAO Penman method in<br />
the calculation of ETo, and calculates effective rainfall using the USDA S.C. method.<br />
6. Mean daily temperatures at Indore ranges from a low of about 18 o C in January to a high of about<br />
32 o C in May. May and June are the hottest months with mean daily maximums close to 40 o C. The mean<br />
daily temperature range is typically about 15 o C. A maximum range of 15.5 o C occurs in May. The<br />
minimum range of about 8 o C occurs in July and August. Relative humidity is at its lowest in April,<br />
averaging 13%, and peaks in August at 87%. Wind speeds are generally in the range of 1.4 to 5.3 m/s,<br />
and are highest in May to June, when solar radiation is also at a its peak. The climatic parameters<br />
combine to give an annual potential evapotranspiration at Indore of 1943mm, with peak<br />
evapotranspiration in April, May and June. The peak daily rates of evapotranspiration occur in May with a<br />
mean of 11.2 mm/day. It is clear from Figure 6 that with the exception of the months of July, August and<br />
September, the effective precipitation is far short of potential evapotranspiration. Mean annual rainfall at<br />
Indore is 980mm, and the computed mean annual effective rainfall is 625mm.<br />
Temperature ( oC)<br />
Wind speed (m/s)<br />
45<br />
40<br />
35<br />
30<br />
25<br />
20<br />
15<br />
10<br />
5<br />
0<br />
6<br />
5<br />
4<br />
3<br />
2<br />
1<br />
0<br />
Indore Mean Daily Temperatures<br />
Jan Feb Mar Apr May Jun Jul Aug Sep Oct Nov Dec<br />
Indore Mean Wind Speeds<br />
Figure 5: Climatic Norms Indore<br />
Mean Daily Maximum<br />
Mean Daily Minimum<br />
Mean Daily<br />
Jan Feb Mar Apr May Jun Jul Aug Sep Oct Nov Dec<br />
2 http://www.fao.org/nr/water/infores_databases_cropwat.html<br />
Relative humidity (%)<br />
Solar radiation (watts/m 2 )<br />
100<br />
90<br />
80<br />
70<br />
60<br />
50<br />
40<br />
30<br />
20<br />
10<br />
350<br />
300<br />
250<br />
200<br />
150<br />
100<br />
50<br />
0<br />
0<br />
Indore Mean Monthly Relative Humidity<br />
Jan Feb Mar Apr May Jun Jul Aug Sep Oct Nov Dec<br />
Indore Mean Daily Solar Radiation<br />
Jan Feb Mar Apr May Jun Jul Aug Sep Oct Nov Dec
Support to the National Water Mission NAPCC<br />
Appendix 3 <strong>Kshipra</strong> <strong>Sub</strong> <strong>Basin</strong> 5<br />
Figure 6: Potential Evapotranspiration and Effective Rainfall<br />
Potential evapotranspiration / effective rainfall (mm)<br />
400<br />
350<br />
300<br />
250<br />
200<br />
150<br />
100<br />
50<br />
0<br />
E. Precipitation in the <strong>Kshipra</strong> <strong>Basin</strong><br />
7. At the time of preparing this report, precipitation data had not been received from IMD, and it has<br />
not therefore been possible to carry out any meaningful analysis for the detection of long term trends or<br />
analysis of rainfall extreme maximum events. The analysis presented here is based on the IMD gridded<br />
0.5 o ×0.5 o data that covers the 35 year period (1971-2005).<br />
1. Annual Precipitation<br />
Indore Potential Evapotranspiration and Effective Rainfall<br />
Potential Evapotranspiration<br />
Effective Rainfall<br />
Jan Feb Mar Apr May Jun Jul Aug Sep Oct Nov Dec<br />
8. Figure 7 presents isohyets of mean annual precipitation over the <strong>Kshipra</strong> <strong>Basin</strong>. About 93% of the<br />
total annual rainfall takes place during the southwest monsoon period (June to September). The<br />
maximum monthly rainfall takes place during the months of July and August. Season-wise distribution of<br />
the annual rainfall is about 6% in winter and 1% in summer prior to the monsoon, giving about 7% of the<br />
annual rainfall from October to about the first week of June. The very small amount of rainfall between<br />
November and the first week of June is insufficient to build up the soil-moisture and thus it does not<br />
contribute to the groundwater potential of the area. It is only during the monsoon period that surplus water<br />
for deep percolation can be available. Annual precipitation varies from about 984mm in the southeast to<br />
865mm in the northwest.<br />
9. Coefficients of variation in annual rainfall are shown in Figure 8. Inter annual variability is more or<br />
less spatially uniform across the basin, with marginally higher variability in the north western part
Support to the National Water Mission NAPCC<br />
Appendix 3 <strong>Kshipra</strong> <strong>Sub</strong> <strong>Basin</strong> 6<br />
Figure 7: Mean Annual Precipitation<br />
Figure 8: Coefficients of Variation of Annual Rainfall
Support to the National Water Mission NAPCC<br />
Appendix 3 <strong>Kshipra</strong> <strong>Sub</strong> <strong>Basin</strong> 7<br />
Figure 9: Deviation from Mean Annual Rainfall at IMD Grids<br />
% Deviation from mean<br />
200<br />
150<br />
100<br />
50<br />
0<br />
-50<br />
-100<br />
1971<br />
1973<br />
1975<br />
1977<br />
1979<br />
1981<br />
10. Figure 9 shows deviations from the mean of annual precipitation in the <strong>Kshipra</strong> basin in the period<br />
from 1971 to 2005. Precipitation is variable in space and time, and there is no evidence of trend in the<br />
data.<br />
2. Seasonal Precipitation<br />
1983<br />
1985<br />
1987<br />
11. Seasonal precipitation has been analysed in a similar way to that of annual precipitation. For the<br />
purposes of analysis, seasons were defined as; March, April, May (MAM) June, July, August, September<br />
(JJAS); October, November, December (OND); January, February (JF).<br />
12. Figure 10 shows mean annual precipitation for the four seasons and Figure 11 the coefficients of<br />
variation. During MAM precipitation is generally negligible and coefficients of variation are thus high, and<br />
increase from southeast to northwest. During JJAS season approximately 93% of the annual rainfall in<br />
the <strong>Kshipra</strong> basin occurs, coefficients of variation are significantly lower than in MAM, and the data are<br />
less skewed. During OND there is little variation precipitation across the basin, with mean values of<br />
approximately 50mm. January-February (JF) is the driest season, with such low rainfall there is significant<br />
inter-annual variability and coefficients of variation are high. variations higher in the northwest than in the<br />
southeast.<br />
1989<br />
1991<br />
760230pcp 755235pcp<br />
1993<br />
1995<br />
1997<br />
1999<br />
2001<br />
2003<br />
2005
Support to the National Water Mission NAPCC<br />
Appendix 3 <strong>Kshipra</strong> <strong>Sub</strong> <strong>Basin</strong> 8<br />
Figure 10: Mean Annual Precipitation in the <strong>Kshipra</strong>
Support to the National Water Mission NAPCC<br />
Appendix 3 <strong>Kshipra</strong> <strong>Sub</strong> <strong>Basin</strong> 9<br />
Figure 11: Coefficient of Variation in Mean Precipitation
Support to the National Water Mission NAPCC<br />
Appendix 3 <strong>Kshipra</strong> <strong>Sub</strong> <strong>Basin</strong> 10<br />
Figure 12: Coefficients of Variation in JJAS Rainfall<br />
Figure 13: Mean JJAS Precipitation
Support to the National Water Mission NAPCC<br />
Appendix 3 <strong>Kshipra</strong> <strong>Sub</strong> <strong>Basin</strong> 11<br />
Figure 14: Coefficients of Variation in OND Rainfall<br />
Figure 15: Mean JF Precipitation
Support to the National Water Mission NAPCC<br />
Appendix 3 <strong>Kshipra</strong> <strong>Sub</strong> <strong>Basin</strong> 12<br />
3. Drought Characteristics<br />
Figure 16: Coefficient of Variation in JJAS Rainfall<br />
13. An analysis has been made of drought durations with a 10 mm precipitation threshold in the Kharif<br />
(JJAS) and Rabi (ONDJF) seasons. The mean annual drought durations are shown in Figure 17 and<br />
Figure 18 respectively. This analysis is of most interest as it is indicative of agricultural risk and irrigation<br />
needs. In the Kharif season, mean annual drought durations vary from 20 to 23 days in the basin. The<br />
range in drought durations during the Rabi season is less significant, and clearly periods of over 3 months<br />
with virtually no precipitation in the Rabi season are common throughout the basin.
Support to the National Water Mission NAPCC<br />
Appendix 3 <strong>Kshipra</strong> <strong>Sub</strong> <strong>Basin</strong> 13<br />
Figure 17: Kharif Season Drought with 10mm threshold<br />
Figure 18: Rabi Season Drought Durations with 10mm threshold
Support to the National Water Mission NAPCC<br />
Appendix 3 <strong>Kshipra</strong> <strong>Sub</strong> <strong>Basin</strong> 14<br />
Figure 19: Time Series of Annual Droughts with 10mm threshold in Kharif Season<br />
14. The time series of annual droughts with a 10 mm threshold in the Kharif season on IMD grids in the<br />
<strong>Kshipra</strong> basin are shown in Figure 19. There is no evidence changes in drought characteristics, and<br />
generally similar conditions are experienced across the whole catchment. The records analysed are not<br />
considered long enough to establish the existence of long term trend, and for this reason statistical tests<br />
have not been carried out.<br />
F. Trends in Annual and Seasonal Rainfall<br />
15. Tests for trend have been made with two IMD raingauges in the <strong>Kshipra</strong> basin. ImD made data<br />
available for the period from 1971 to 2005. The stations used were Indore and Ujjain. There locations<br />
are shown in Figure 20. Thirty five years of data would generally be considered rather short for long term<br />
trend analysis, and it was possible to create composite records at both sites dating from 1901 using data<br />
archived by GHCN (GHCN precipitation 3 ).<br />
3 http://www.ncdc.noaa.gov/oa/climate/ghcn-daily/
Support to the National Water Mission NAPCC<br />
Appendix 3 <strong>Kshipra</strong> <strong>Sub</strong> <strong>Basin</strong> 15<br />
Figure 20: Locations of IMD Observed Raingauge Stations in the <strong>Kshipra</strong> basins<br />
1. Mann-Kendall Analysis<br />
16. The Mann-Kendall test has been used in trend analysis. The Mann-Kendall test is a nonparametric<br />
test for identifying trends in time series data. The test compares the relative magnitudes of<br />
sample data rather than the data values themselves (Gilbert, 1987 4 ). One benefit of this test is that the<br />
data need not conform to any particular distribution.<br />
17. The data values are evaluated as an ordered time series. Each data value is compared to all<br />
subsequent data values. The initial value of the Mann-Kendall statistic, S, is assumed to be 0 (no trend).<br />
If a data value from a later time period is higher than a data value from an earlier time period, S is<br />
incremented by 1. On the other hand, if the data value from a later time period is lower than a data value<br />
sampled earlier, S is decremented by 1. The net result of all such increments and decrements yields the<br />
final value of S.<br />
Mann-Kendall statistic (S) is given by<br />
where: x1, x2,….xn represent n data points, where xj represents the data point at time j.<br />
sign(kj-xk) = 1 if kj - Xk >0<br />
= 0 if if kj - Xk = 0<br />
= -1 if if kj - Xk < 0<br />
4 Gilbert, R.O., 1987. Statistical methods for environmental pollution monitoring. Van Nostrand Reinhold, New York.<br />
Kendall, M.G., 1975. Rank correlation methods, 4th ed. Charles Griffin, London
Support to the National Water Mission NAPCC<br />
Appendix 3 <strong>Kshipra</strong> <strong>Sub</strong> <strong>Basin</strong> 16<br />
A very high positive value of S is an indicator of an increasing trend, and a very low negative value<br />
indicates a decreasing trend. However, it is necessary to compute the probability associated with S and<br />
the sample size, n, to statistically quantify the significance of the trend.<br />
2. Data Quality<br />
18. A large number of missing values were found in the IMD records of both stations. Each station had<br />
almost three complete years of missing data, and several years in which 10-20% of data were missing.<br />
This would be a concern for many types of analysis. In the long term GHCBN record there were only two<br />
missing records at Indore, but 1107 missing records at Ujjain.<br />
3. Test Results<br />
19. The results of the Mann-Kendall trend analysis at Indore and Ujjain, using the composite records<br />
from 1901 are summarised in Table 2, Table 3 and Table 4. Generally in the evaluation of these tests, a<br />
significance level of less than 0.05 would indicate the existence of trend, or there would be 95%<br />
confidence in the existence of trend.<br />
20. There is evidence of a slight trend of increasing annual rainfall at Indore, that has a significance<br />
level of 0.06. The trend is most evident in southwest monsoon rainfall, for which the significance level is<br />
0.03. The increase in monsoon rainfall amounts to 194 mm over a 102 year period (22%). The time<br />
series southwest monsoon rainfall at Indore is shown in Figure 21. There is a mild decreasing trend in<br />
northeast monsoon rainfall.<br />
21. At Ujjain, where it will be noted there more missing records, there is no statistically significant trend<br />
in annual or seasonal rainfall, although the regressions fitted to the data are similar to those at Indore.<br />
The time series for southwest monsoon rainfall at Ujjain is shown in Figure 22..<br />
Table 2: Annual rainfall trends<br />
Stations <strong>Basin</strong> Linear equations Mann-Kendall test Significance level<br />
Indore <strong>Kshipra</strong> y = 2.0019x + 868.19<br />
statistics (Calculated z)<br />
1.88 >0.05<br />
Ujjain <strong>Kshipra</strong> y = 2.0107x + 802.12 1.45 >0.10<br />
Table 3: Seasonal rainfall trends, southeast monsoon (June-September)<br />
Stations <strong>Basin</strong> Linear equations Mann-Kendall test Significance level<br />
Indore <strong>Kshipra</strong> y = 1.9x + 783.82<br />
statistics (Calculated z)<br />
2.19 0.10<br />
Table 4: Seasonal rainfall trends, northeast monsoon (October-December)<br />
Rainfall <strong>Basin</strong> Linear equations Mann-Kendall test Significance<br />
Stations<br />
statistics (Calculated z) level<br />
Indore <strong>Kshipra</strong> y = -0.0013x + 17.541 1.88 >0.05<br />
Ujjain <strong>Kshipra</strong> y = 0.0083x + 15.591 1.45 > 0.10
Support to the National Water Mission NAPCC<br />
Appendix 3 <strong>Kshipra</strong> <strong>Sub</strong> <strong>Basin</strong> 17<br />
Figure 21: Time series of southwest monsoon rainfall at Indore<br />
Figure 22: Time series of southwest monsoon rainfall at Ujjain
Support to the National Water Mission NAPCC<br />
Appendix 3 <strong>Kshipra</strong> <strong>Sub</strong> <strong>Basin</strong> 18<br />
A. Introduction<br />
II. GROUNDWATER<br />
22. The Chambal river is a tributary of Yamuna river and rises in Vidhyan hill range in western Madhya<br />
Pradesh. The Banas, Kali Sindh, <strong>Kshipra</strong> and Parbati are its tributaries. The Chambal basin lies between<br />
latitude 22 0 27‘ N & 27 0 20‘ N and longitude 73 0 20‘E and 79 0 15‘ E.. The total area drained upto its<br />
confluence with Yamuna is 143,219km 2 and out of which 76,854km 2 lies in state of Madhya Pradesh. This<br />
basin is characterized by undulating flood-plain and ravines. River Chambal is utilized for hydro-power<br />
generation and for irrigation. The <strong>Kshipra</strong> tributary of Chambal was a perennial river, however, now it<br />
stops flowing a few months after the monsoon. <strong>Kshipra</strong> originates at 560m (amsl) from a hill near village<br />
of Kampell in Indore district. The catchment area of <strong>Kshipra</strong> is 4751km 2 . The rivers Khan and Ghambir<br />
are its main tributaries. <strong>Kshipra</strong> basin intersects the three districts of Dewas, Indore and Ujjain.<br />
B. Groundwater<br />
1. Aquifers<br />
23. The main aquifer in Indore is made up of a basaltic rock formation, which is unconfined to semi<br />
confined in nature. The hydrogeological map of the basin is shown in Figure 24. The borewells tapping<br />
basaltic aquifer in the northern and southern part of the district to a depth of 100m have capacity to yield<br />
discharge of the order of 6.2 to 14.6 litres per second (lps). In the southern part of the district, the yield<br />
capacity of borewells is 1.2 to 3.8 lps.<br />
24. Dewas district is mostly occupied with basaltic rocks except southern part of the district where<br />
Vindhyan sandstones and Archean granites form aquifers. The open wells in granite rock aquifer yield<br />
8lps of discharge on an average whereas Vindhyan sandstone aquifer yield upto 11lps. Basalts form<br />
extensive aquifer system in the district in which large diameter open wells to a depth of 20m yield 3.5 to 9<br />
lps and borewells to a depth of 200m yield 1 to 3 lps.<br />
25. Basalts also form extensive aquifers in Ujjain district. The open wells to a depth of 20m in<br />
weathered zone of basalt yield 1 to 2 lps. Borewells in the depth range of 50-200m yield between 1 and<br />
20 lps, the average being 3.5 for drawdown ranging from 2.85-66m. The static water level in boreholes in<br />
the district ranges from 7.14-49m. The groundwater maps of districts of Kishpra basin are given in Figure<br />
25 and Figure 26.<br />
C. Groundwater Levels and Trends<br />
26. Groundwater observation wells <strong>Kshipra</strong> sub-basin are shown in Figure 27. The mean water level<br />
for the year 1980 and 2009 for the Dewas, Indore and Ujjian districts in Kishpra basin are given in Table 5<br />
below for long-term comparison. It may be observed that in the pre-monsoon average water level in<br />
general, there is severe decline, however in post monsoon there is not much change. Mean water levels<br />
in <strong>Kshipra</strong> sub-basin are shown in Table 5, with trends iin Table 6 below:<br />
Sl No District<br />
Table 5: Mean Groundwater Levels in <strong>Kshipra</strong> sub-basin<br />
Mean GW Depth (m bgl)<br />
May-80 Nov-80 May-09 Nov-09<br />
1 Dewas 8.72 6.2 15.64 4.63<br />
2 Indore 7.84 5.37 16.65 6.49<br />
3 Ujjain 7.32 2.65 12.14 7.64<br />
27. The Pre and post monsoon groundwater levels and their trends in three districts of Dewas, Indore<br />
and Ujjain falling in <strong>Kshipra</strong> sub-basin are given in the table below. The pre and post monsoon depth to
Support to the National Water Mission NAPCC<br />
Appendix 3 <strong>Kshipra</strong> <strong>Sub</strong> <strong>Basin</strong> 19<br />
water level maps are given in Figure 28 . The hydrographs of select observation stations drawn are given<br />
in Figure 29 and Figure 30.<br />
District Depth to<br />
groundwater<br />
(Pre-monsoon)<br />
Table 6: Groundwater Levels and Trend<br />
Depth to<br />
groundwater<br />
(Post-monsoon)<br />
Fall in levels<br />
(Premonsoon)<br />
Fall in levels<br />
(post-monsoon)<br />
Ujjain 8.96-17.00 1.45-11.90 0.05-0.39 0.01-0.43<br />
Dewas 3.06-24.05 0.55-10.30 0.05-0.33 0.05-0.60<br />
Indore 6.30-15.70 1.40-10.08 0.02-0.28 0.08-0.80<br />
1. Water quality<br />
28. The groundwater quality in general is good in the basin. The EC value of groundwater in entire<br />
Kishpra sub-basin is less than 3000 micro Siemens/cm. Water quality map with EC contours is given in<br />
Figure 31. High levels of nitrate and fluoride have also been reported from some blocks of the district of<br />
Dewas, Indore and Ujjain. A table indicating levels of Fluoride and Nitrate is given in Table 7 below:<br />
Table 7: Fluoride and Nitrate Levels of Shallow Groundwater in <strong>Kshipra</strong> sub-basin<br />
District Block Nitrate(mg/l) Block Fluoride(mg/l)<br />
Dewas Bagla 52-156 Khategaon 1.5<br />
Dewas 51-111 - -<br />
Indore Depala 139 - -<br />
Indore 79-179 - -<br />
Ujjain Badnagar 67 - -<br />
Mahidpur 48-76 - -<br />
Ujjain 67-94 - -<br />
2. Groundwater resources:<br />
29. The Chambal basin encompasses a large number districts but the present study focuses on the<br />
<strong>Kshipra</strong> sub-basin of Chambal basin. The state government has estimated the availability of groundwater<br />
of <strong>Kshipra</strong> sub-basin as 1100 million cubic meters. The status of groundwater potential of the whole<br />
Chambal river basin is given in Table 8 below.<br />
Total<br />
replenishable<br />
groundwater<br />
Table 8: Dynamic Groundwater Resources of Chambal <strong>Basin</strong> (in BCM)<br />
Provision for<br />
domestic,<br />
industrial and<br />
other uses<br />
Available<br />
groundwater<br />
resources for<br />
irrigation<br />
Net<br />
groundwater<br />
draft<br />
Balance<br />
groundwater<br />
available<br />
Extent of<br />
groundwater<br />
use ( %)<br />
7.19 1.08 6.11 2.45 3.66 49%<br />
30. The district wise position of groundwater availability in the district of Indore, Dewas and Ujjain<br />
covering <strong>Kshipra</strong> sub -basin is given in Table 9. It may be observed that in general the extent of<br />
groundwater use in Indore and Ujjain exceeds 100%, whereas in Dewas the stage of development is<br />
66%. By block it can be seen there is some significant differences between the blocks as shown in Table<br />
9.
Support to the National Water Mission NAPCC<br />
Appendix 3 <strong>Kshipra</strong> <strong>Sub</strong> <strong>Basin</strong> 20<br />
District Annual<br />
replenishable<br />
groundwater<br />
Table 9: Groundwater Resources by District (MCM))<br />
Natural<br />
groundwater<br />
drainage<br />
Net<br />
groundwater<br />
availability<br />
Annual<br />
groundwater<br />
draft<br />
Extent of<br />
groundwater<br />
use(%)<br />
Dewas 92.7 4.6 88.1 58.5 66 0<br />
Indore 59.8 3.0 56.9 59.4 104 2<br />
Ujjain 83.4 4.2 79.3 86.4 109 3<br />
Table 10: Dynamic Groundwater Resources of District and by Block<br />
Type<br />
(see<br />
notes<br />
at<br />
bottom<br />
of<br />
Net Annual<br />
Groundwater<br />
Availability<br />
(MCM)<br />
Existing (MCM) Future (MCM)<br />
Gross<br />
Draft for<br />
irrigation<br />
Gross<br />
Draft for<br />
Domestic<br />
&<br />
Industry<br />
Total<br />
gross<br />
draft<br />
Stage of<br />
GW<br />
devpment<br />
Estim<br />
draft for<br />
domestic<br />
& industry<br />
over next<br />
25 years<br />
Number of<br />
groundwater<br />
overexploited<br />
block<br />
Net avail<br />
for future<br />
irrig.<br />
District/<br />
Block table)<br />
Dewas C<br />
NC 164.1 151.3 5.6 156.9 96 10.3 2.5<br />
BT 164.1 151.3 5.6 156.9 96 10.3 2.5<br />
Sonkutch C - - - - - -<br />
NC 100.7 95.1 2.4 97.5 97 2.7 3.0<br />
BT 100.7 95.1 2.4 97.5 97 2.7 3.0<br />
Tonkkhurd C - - - - - -<br />
NC 99.2 63.0 2.5 65.4 66 2.7 33.5<br />
BT 99.2 63.0 2.5 65.4 66 2.7 33.5<br />
Bagli C 8.5 0.5 0.1 0.6 7 0.2 7.8<br />
NC 249.0 123.4 5.0 128.3 52 5.3 120.3<br />
BT 257.4 123.9 5.1 128.9 50 5.5 128.1<br />
Kannod C 29.9 1.4 0.5 1.9 6 0.7 27.9<br />
NC 106.7 59.7 3.8 63.5 59 5.3 41.8<br />
BT 136.7 61.0 4.3 65.3 48 6.0 69.7<br />
Khategaon C - - - - - -<br />
NC 122.6 67.4 3.2 70.6 58 3.7 51.4<br />
BT 122.6 67.4 3.2 70.6 58 3.7 51.4<br />
DEWAS TOTAL 880.7 561.7 23.0 584.7 66 30.9 288.1<br />
Indore C - - - - - -<br />
NC 163.7 211.6 12.1 223.7 137 39.5 -87.4<br />
BT 163.7 211.6 12.1 223.7 137 39.5 -87.4<br />
Sanwer C - - - - -<br />
NC 131.2 170.5 3.7 174.2 133 6.1 -45.3<br />
BT 131.2 170.5 3.7 174.2 133 6.1 - 45.3<br />
Depalpur C 4.6 1.2 0.2 1.4 31 0.4 3.0<br />
NC 124.1 115.8 3.9 119.6 96 6.3 2.0<br />
BT 128.7 117.0 4.1 121.1 94 6.7 5.0<br />
Mhow C 19.4 1.6 0.3 1.8 9 0.3 17.5<br />
NC 126.1 68.9 4.7 73.5 58 7.2 50.1<br />
BT 145.5 70.4 4.9 75.4 52 7.4 67.6<br />
INDORE TOTAL 569.0 569.4 24.8 594.3 104 59.7 - 60.1<br />
Ujjain C 4.7 2.6 0.1 2.7 59 0.1 1.9<br />
NC 101.2 147.5 2.7 150.2 148 3.5 - 49.7<br />
BT 105.9 150.1 2.8 152.9 144 3.6 - 47.8<br />
Ghatia C - - - - - -<br />
NC 82.7 81.0 2.3 83.4 101 2.6 - 1 .0<br />
BT 82.7 81.0 2.3 83.4 101 2.6 -1.0<br />
Mahidpur C 13.4 3.6 0.3 4.0 29 0.4 9.4<br />
NC 142.0 103.1 4.2 107.3 76 5.0 33.9
Support to the National Water Mission NAPCC<br />
Appendix 3 <strong>Kshipra</strong> <strong>Sub</strong> <strong>Basin</strong> 21<br />
District/<br />
Block<br />
Type<br />
(see<br />
notes<br />
at<br />
bottom<br />
of<br />
table)<br />
Net Annual<br />
Groundwater<br />
Availability<br />
(MCM)<br />
Existing (MCM) Future (MCM)<br />
Gross<br />
Draft for<br />
irrigation<br />
Gross<br />
Draft for<br />
Domestic<br />
&<br />
Industry<br />
Total<br />
gross<br />
draft<br />
Stage of<br />
GW<br />
devpment<br />
Estim<br />
draft for<br />
domestic<br />
& industry<br />
over next<br />
25 years<br />
Net avail<br />
for future<br />
irrig.<br />
BT 155.5 106.7 4.5 111.2 72 5.4 43.3<br />
Tarana C - - - - - -<br />
NC 122.1 96.0 4.4 100.4 82 5.5 20.6<br />
BT 122.1 96.0 4.4 100.4 82 5.5 20.6<br />
Badnagar C - - - - - -<br />
NC 162.7 269.3 4.8 274.1 168 5.4 - 112.0<br />
BT 162.7 269.3 4.8 274.1 168 5.4 - 112.0<br />
Kachrod C - - - - - -<br />
NC 164.0 136.2 6.2 142.4 87 8.0 19.8<br />
BT 164.0 136.2 6.2 142.4 87 8.0 19.8<br />
UJJAIN TOTAL 792.8 839.3 25.0 864.4 109 30.6 - 77.1<br />
OVERALL TOTAL 2,242.5 1,970.5 72.8 2,043.3 91<br />
Notes: Inside Irrigation Command (C), Outside Irrigation Command (NC) BT Block Total<br />
D. Artificial Recharge:<br />
121.1 150.9<br />
31. The Central Groundwater Board (CGWB ) has worked out preliminary feasibility of recharging<br />
groundwater in the state of Madhya Pradesh. The estimates for Chambal, <strong>Kshipra</strong> and Ghambir tributary<br />
basins areas given in table below. The total feasibility for Artificial recharge the <strong>Kshipra</strong> watershed is<br />
estimated to be 14 MCM with Ghambir 32MCM giving a total of 46MCM. Area feasible for artificial<br />
recharge in the State of Madhya Pradesh including upper Chambal and <strong>Kshipra</strong> sub-basin as given in<br />
Figure 32 and summarised in Table 11. The National Rural Employment Guarantee Act (NREGA)<br />
programmes are very focused on soil and water conservation with 70% of NREGA funds in the state<br />
being directed at soil and water conservation<br />
Table 11: Feasibility of Artificial recharge<br />
<strong>Basin</strong> / Potential<br />
Volume ( in MCM) of water to be recharged and Type /<br />
Watershed Artificial<br />
Number of Water harvesting Structures<br />
recharge Percolation Check dams/ Dug well/Tube Gully plugs/<br />
(MCM) tanks Nala bunds wells & shafts Gabions<br />
Vol. Nos Vol. of Nos Vol. of Nos Vol. of water No<br />
of<br />
water<br />
water<br />
water<br />
Upper<br />
Chambal<br />
9.58 4.79 24 2.40 80 0.96 96 1.44 287<br />
Middle<br />
Chambal<br />
9.31 4.66 23 2.33 78 0.93 93 1.40 279<br />
Siwana 47.88 23.94 120 11.97 399 4.79 479 7.18 1436<br />
<strong>Kshipra</strong> 14.36 7.18 36 3.59 120 1.44 144 2.15 431<br />
Idar-retan 25.54 12.77 64 6.39 213 2.55 255 3.83 766<br />
Ghambir 31.92 15.96 80 7.98 266 3.19 319 4.79 958<br />
Maten 18.35 9.18<br />
46 4.59<br />
153 1.84<br />
184 2.75 551
Support to the National Water Mission NAPCC<br />
Appendix 3 <strong>Kshipra</strong> <strong>Sub</strong> <strong>Basin</strong> 22<br />
E. Groundwater Irrigation<br />
1. Government and Private wells<br />
32. In <strong>Kshipra</strong> sub-basin the irrigation is mainly from private dug wells and tubewell. These<br />
groundwater abstraction units predominantly belongs to individuals or groups of farmers. The<br />
Government intervention in groundwater irrigation is limited. The district wise status of irrigation dugwell,<br />
shallow and deep tube wells for the <strong>Kshipra</strong> sub-basin is given in Table 12 to Table 19 below:.<br />
Table 12: Irrigation Dug Wells<br />
District Government Cooperative Panchayat Group of Individual Others Total<br />
Farmers Farmer<br />
Dewas 19 2 5 1274 32173 21 33494<br />
Indore 87 37 4 80 12479 20 12707<br />
Ujjain 398 19 4 1064 39267 129 40881<br />
Table 13: Cultivable Command Area and Irrigation Through Dug Well<br />
District Cultivable Command Irrigation Potential created Potential utilised<br />
(ha)<br />
(ha)<br />
Dewas 92516 93864 52562<br />
Indore 30198 36406 16963<br />
Ujjain 90654 93790 23406<br />
Table 14: Irrigation from Shallow Tubewells<br />
District Government Cooperative Panchayat Group of Individual Others Total<br />
Farmers Farmer<br />
Dewas 5 2 2 1233 18409 17 19668<br />
Indore 93 22 1 54 29272 24 29466<br />
Ujjain 47 7 1 590 34774 76 35495<br />
Table 15: Distribution of Shallow Tubewells by Type<br />
District Shallow TW Bore Wells Filter Point TW Others Total<br />
Dewas 5375 94 14179 20 19668<br />
Indore 26346 254 949 1917 29466<br />
Ujjain 29059 1191 4953 292 35495<br />
Table 16: Cultivable Command Area and Irrigation potential created Through Shallow Tubewell<br />
District Cultivable Command Irrigation Potential created Potential utilised (ha)<br />
(ha)<br />
(ha)<br />
Dewas 61316 62310 40930<br />
Indore 92406 102453 47500<br />
Ujjain 93897 96680 36921<br />
Table 17 : Deep Tube Wells<br />
District Govt Cooperative Panchayat Group<br />
Farmers<br />
of Others Total<br />
Dewas 10 14 8 329 1273 1634<br />
Indore 7 4 2 253 1475 1741<br />
Ujjain 0 0 0 1 307 308
Support to the National Water Mission NAPCC<br />
Appendix 3 <strong>Kshipra</strong> <strong>Sub</strong> <strong>Basin</strong> 23<br />
Table 18: Cultivable Command Area and Irrigation Potential Through Deep Tubewell<br />
District Cultivable Command Irrigation Potential created Potential utilised (ha)<br />
(ha)<br />
(ha)<br />
Dewas 4643 4720 2530<br />
Indore 6633 7588 2964<br />
Ujjain 555 566 350<br />
Table 19: Cultivable Command Area and Irrigation Potential created Through Deep Tube Well<br />
District Cultivable<br />
(ha)<br />
Command Irrigation Potential created (ha) Potential utilised (ha)<br />
Dewas 4643 4720 2530<br />
Indore 6633 7588 2964<br />
Ujjain 555 566 350<br />
2. Power for Tubewells<br />
33. The distribution of the irrigation wells as per average pumping hours in the basin is given in Table<br />
20, Table 21 and Table 22 below. Photographs of micro irrigation being adopted are given in Figure 23.<br />
Table 20: Distribution of Dugwells as Per Average Pumping Hours And Distribution System<br />
District Average<br />
pumping hour<br />
during peak<br />
season<br />
Sprinkler Drip Open<br />
Channel<br />
Water distribution system Total<br />
Under<br />
Ground<br />
Channel<br />
Others<br />
Dewas 33484 388 1271 21904 7382 2549 33494<br />
Indore 12707 110 436 7910 1722 2530 12708<br />
Ujjain 40871 283 138 23157 11919 5374 40871<br />
Table 21: Distribution of Shallow Tubewells<br />
District Average<br />
Water distribution system Total<br />
Pumping Hour Sprinkler Drip Open Under Others<br />
(peak season)<br />
Channel Ground<br />
Channel<br />
Dewas 19668 148 203 9878 7505 1934 19668<br />
Indore 29466 178 235 21238 1701 6114 29466<br />
Ujjain 35495 410 722 21010 8240 5113 35495<br />
District Average<br />
Pumping<br />
Hour during<br />
peak season<br />
Table 22: Distribution of Deep Tubewells<br />
Water distribution system Total<br />
Sprinkler Drip Open Underground Others<br />
Channel Channel<br />
Dewas 1634 2 1 1089 431 51 1634<br />
Indore 1741 621 23 941 124 32 1741<br />
Ujjain 308 1 0 259 28 20 308
Support to the National Water Mission NAPCC<br />
Appendix 3 <strong>Kshipra</strong> <strong>Sub</strong> <strong>Basin</strong> 24<br />
Figure 23: Drip Irrigation in Dewas<br />
F. Regulatory Framework Relating to Groundwater<br />
34. The Government of India has circulated to state governments including the Government of Madhya<br />
Pradesh (GoMP) a Model for enactment of suitable legislation to setup state government authority for<br />
control and regulation of groundwater development. The MP Peya Jal Parirakshan Adhiniyam, 1986<br />
provides for the preservation of water in water sources and for the regulation of digging of tubewells in<br />
order to maintain the water supply for the public for domestic purposes and for matters ancillary thereto.<br />
The state of MP vide notification dated 26.6.2006 have made roof top rainwater harvesting mandatory for<br />
all types of new buildings having plot size of more than 140km 2 . The CGWB constituted under the<br />
Environmental Protection Act have notified Dhar and Manawar blocks of Dhar district, Indore Muncipal<br />
Corporation, Mandasuaur and Sitamau blocks of Mandsaur district, Neemuch block of Neemuch district<br />
and Jaora block of Ratlam district of MP for regulation of groundwater development.<br />
G. Groundwater Problems and issues<br />
35. The basin has several issues related to groundwater such as:<br />
o Limited availability of groundwater in hard rock aquifer system of Malwa Region.<br />
o Diminishing surface water resources.<br />
o Polluted stream water with untreated urban and industrial wastewater.<br />
o Decline levels of groundwater due to excessive use.<br />
o High levels of fluoride in deep aquifers.<br />
o Parts of the districts of Dewas, Indore and Ujjain are affected with high levels of nitrate in<br />
groundwater.<br />
o Inadequate interaction among supply and demand side initiatives and lack of decision<br />
making at basin level.<br />
o inadequate knowledge-base and awareness at grass root level.<br />
o The number of districts with falling groundwater levels in the state have increased from 33 in<br />
2001 to 47 in year 2004.
Support to the National Water Mission NAPCC<br />
Appendix 3 <strong>Kshipra</strong> <strong>Sub</strong> <strong>Basin</strong> 25<br />
Figure 24: Hydrogeological Map
Support to the National Water Mission NAPCC<br />
Appendix 3 <strong>Kshipra</strong> <strong>Sub</strong> <strong>Basin</strong> 26<br />
Figure 25: Groundwater Ujjain
Support to the National Water Mission NAPCC<br />
Appendix 3 <strong>Kshipra</strong> <strong>Sub</strong> <strong>Basin</strong> 27<br />
Figure 26: Groundwater Dewas
Support to the National Water Mission NAPCC<br />
Appendix 3 <strong>Kshipra</strong> <strong>Sub</strong> <strong>Basin</strong> 28<br />
Figure 27: Groundwater Observation Wells
Support to the National Water Mission NAPCC<br />
Appendix 3 <strong>Kshipra</strong> <strong>Sub</strong> <strong>Basin</strong> 29<br />
Figure 28: Pre and Post Monsoon Depth to Groundwater
Support to the National Water Mission NAPCC<br />
Appendix 3 <strong>Kshipra</strong> <strong>Sub</strong> <strong>Basin</strong> 30<br />
Figure 29: Hydrographs Dewas and Ujjain
Support to the National Water Mission NAPCC<br />
Appendix 3 <strong>Kshipra</strong> <strong>Sub</strong> <strong>Basin</strong> 31<br />
Figure 30: Hydrograph of Indore and Ujjain
Support to the National Water Mission NAPCC<br />
Appendix 3 <strong>Kshipra</strong> <strong>Sub</strong> <strong>Basin</strong><br />
Figure 31: Electrical Conductivity<br />
Figure 32: Areas Identified for Artificial Recharge in MP<br />
32
Support to the National Water Mission NAPCC<br />
Appendix 3 <strong>Kshipra</strong> <strong>Sub</strong> <strong>Basin</strong><br />
A. Introduction<br />
III. IRRIGATION AND DRAINAGE<br />
36. The Chambal river originates from the of northern slopes of Vindhyan hills in Madhya Pradesh<br />
at an elevation of 840 Meter. The river flows in the northerly direction in the state of Madhya Pradesh<br />
for length of 345kms. It flows for a distance of 217km forming a border between Madhya Pradesh and<br />
Rajasthan and another 145 kms borders of Madhya Pradesh and Uttar Pradesh. After travelling a<br />
distance about 960kms and a fall of 730meters, it joins the river Yamuna in Uttar Pradesh draining an<br />
area about 143220 Km2. Chambal is rainfed river and passes through a flat terrain of Malwa plateau<br />
in Madhya Pradesh where some of the tributaries like <strong>Kshipra</strong>, Kali, Sindh, Parbati, Gambhir etc join<br />
the main river. The Malwa region in MP lies in the semi-arid zone has an elevation of about 500 m and<br />
is also known as Malwa Plateau and fully lies in the catchment (drainage) area of the Chambal river.<br />
The <strong>Kshipra</strong> River also known as Shipra rises in the Vindhya range and flows across the Malwa<br />
plateau to join the Chambal river. It is a sacred river to the Hindus and holy city of Ujjain is situated on<br />
its right <strong>Bank</strong>. Ujjain is venue of mammoth Kumbh Mela, held once in twelve year.<br />
37. The catchment area of <strong>Kshipra</strong> sub-basin is 4750 Km 2 and is fed by two major tributaries<br />
namely Khan and Gambhir rivers which meet <strong>Kshipra</strong> at 70 and 120 Kms from origin of the river<br />
respectively. Climate of <strong>Kshipra</strong> basin is characterized by hot summer and well distributed rainfall<br />
during the south west monsoon season. About 91% of total annual rainfall takes place during<br />
monsoon (June to September). About 9% meager rainfall from October to first week of June is hardly<br />
sufficient to build up soil moisture for agricultural purposes and groundwater recharge.<br />
38. As a rough estimate, the existing water bodies in the basin are having capacity of about 200<br />
MCM, mostly in minor size irrigation dams namely Sahibkhedi, Dholawad, and Kazikhedi.<br />
Groundwater is the major sources of irrigation, drinking and industrial water in the basin. The<br />
groundwater occurs within the weathered and fractured zone of underlying multilayer hard compact<br />
basalts. Groundwater resources are quite variable in quantity and quality.<br />
39. <strong>Kshipra</strong> river is reported to be perennial river up to 1980 but gradually the river has become dry<br />
during the non-monsoon season primarily due to over exploitation of groundwater. The river is not<br />
receiving sub-surface base flow. It is estimate that about 1.2 lack tubewells have been constructed<br />
during the last 25 years. Because of depletion of groundwater for irrigation purposes, the acute<br />
shortage of drinking has also been reported in many places. The drinking water requirement is met by<br />
transporting water. The cities of Indore and Dewas are dependent on river Narmada for their water<br />
supply, which is lifted and is reported to be very costly arrangement.<br />
40. The farmers in the <strong>Kshipra</strong> sub-basin mostly harvest two crops. The main crops are: wheat,<br />
soybean, sugar cane, vegetable, gram, ground nuts and some other seasonal crops.<br />
41. Considering that the average annual rainfall in the basin is 840mm and there is no possibility of<br />
major and medium irrigation projects in the basin, conservation of water, recharge of groundwater<br />
storage and efficient use of water appear to be the only solution to the existing water shortage in the<br />
basin.<br />
B. Agriculture<br />
42. Madhya Pradesh is the second largest state in the country in terms of area and seventh largest<br />
in terms of population; the state has 48 districts. The state is classified as a sub tropical region.<br />
Agriculture contributes 24% of the State GDP and employs 78% of the total workforce. The net sown<br />
area is 47.5% of the total geographic area (compared to the National average of 46%). The Gross<br />
cropped area is 18. 2million ha with a cropping intensity of 124. Small and marginal farmers account<br />
for 60% of land holdings and 22% of operated area. Irrigation covers 31% of the net sown area while<br />
the remaining 69% of the net sown area is rainfed. Madhya Pradesh with high geographical diversity,<br />
eleven agro-climatic zones and varied soil types is better placed for production of various horticultural<br />
crops. Horticulture crop covers 2.6% of the gross cropped area in the State. The area under<br />
Horticulture is 640,000 ha, with an annual production of 3.8 million tonnes.<br />
33
Support to the National Water Mission NAPCC<br />
Appendix 3 <strong>Kshipra</strong> <strong>Sub</strong> <strong>Basin</strong><br />
43. Agricultural growth in the state during the Tenth plan (2002-2007) was 4% with a projected<br />
growth of 4.4% for the Eleventh plan against the India average of 4% and 4.4% for the Tenth and<br />
Eleventh plans. Despite the heavy outlay in agriculture, there remains nationally a declining GDP<br />
contribution from agriculture. The major constraints 5 include rapid urbanisation and land use for non<br />
agriculture,lack of assured and perenial irrigation, uncertain rainfall, lack of technologies to support<br />
higher productivities, lack of diversification in crops and poor supply of agricultural inputs,inadequate<br />
credit for small and marginal farmers and changes in climate.<br />
44. Horticulture: The horticulture sector has contributed significantly to GDP in agriculture (28.5%<br />
from 8.5% area) is shown in Table 23.<br />
Table 23: Area of Horticulture<br />
Type Area ('000 Ha) Production (MillionTons)<br />
1 Fruits 63 1.2<br />
2 Vegetables 246.2 2.2<br />
3 Spices 309.8 0.3<br />
4 Flowers 6.7 0.004<br />
5 Medicinal Crops 15.6 Na<br />
Total 641.5<br />
45.<br />
C. Surface Water Schemes<br />
46. Some surface water schemes are in the planning and construction stage to augment the water<br />
resources. These are:<br />
(i) Khan Reservoir Irrigation Project: On the river Khan irrigation to 18000 hectare land (cost<br />
estimate not firmed up as scheme at planning stage)<br />
(ii) Chambal-Gambhir River Link Project: To augment drinking water storage on Gambher<br />
drinking water reservoir for Ujjain town water supply by diverting Chambal water to Gamber.<br />
(cost estimate not formed up as scheme at planning stage).<br />
(iii) Irrigation Water Supply Project: For villages and Town of Dewas, Ujjain and Shajapur districts<br />
of Madhya Pradesh. The project is diversion of water from Narmada to 1500 villages and 27<br />
town of Ujjain, Dewas and Shajapur districts at an pre-feasibility estimated cost of Rs, 2988<br />
crores.<br />
(iv) Construction of fourteen checkdams on the river <strong>Kshipra</strong> at at an estimated cost of Rs3.21<br />
crores. These check dams are mostly about 2M high structures across the river to check the<br />
river flow in order to restore the perennial nature of the river <strong>Kshipra</strong> for aesthetic and religious<br />
purposes. This project is recently completed.<br />
(v) Various watershed development programmes being executed by government departments<br />
with focus of water harvesting and soil conservation from the annual budgets of these<br />
departments.<br />
47. Two important water management initiatives have become popular in the <strong>Kshipra</strong> sub-basin<br />
particularly in Dewas district.<br />
(i) Spread of micro-irrigation schemes; and<br />
(ii) Construction of farm (ponds/tanks) also called Balsam Talab.<br />
48. During the field visits by the consultants to the farm lands with tanks, it is learnt that such<br />
measure are highly efficient in water conservation and groundwater recharge. Balram Tanks is a<br />
government subsidized scheme with 50% subsidy subject to maximum of Rs 50,000 is provided for all<br />
categories of farmers for construction of large tanks in the fields.<br />
5 Field study report on Impact Assessment of Micro Irrigation Schemes in Indore, Dr Venkataramanalah Indian<br />
Institute Management, Indore<br />
34
Support to the National Water Mission NAPCC<br />
Appendix 3 <strong>Kshipra</strong> <strong>Sub</strong> <strong>Basin</strong><br />
49. Micro irrigation schemes have gained popularity in the <strong>Kshipra</strong> particularly in Dewas district.<br />
Many farmers have adopted micro irrigation because of increased crop productivity, saving in water<br />
and increased revenue. Crop production estimates were reported to be about 30% high where as<br />
water saving is reported to be 50%. Various soil moisture retentions techniques likes mulching the<br />
farmland with black plastic sheets were also seen to be popular in the basin.<br />
D. Potable Water<br />
50. Drinking groundwater problems are widely reported in the basin. Water shortage has been<br />
caused by large scale irrigation schemes, which have caused lowering of groundwater table in the<br />
basin as well as making the <strong>Kshipra</strong> river dry in the non-monsoon season. The annual requirement of<br />
domestic water is estimated to be about 200MCM.<br />
51. It was found that drinking water problems are being tackled in some of the villages by adoption<br />
of local water conservation to support recharge to dug wells and small tubewells. With more than<br />
800mm annual rainfall, the drinking water problem there are opportunities to support sustainable<br />
potable water at village level through conservation and storage of water with people‘s participation.<br />
52. The GOMP is presently formulating a major water supply project for supply drinking water to<br />
1500 villages and 27 town in Ujjain, Dewas and Shajapur district from the Narmada river. This project<br />
when implemented is designed to solve drinking water problems of the <strong>Kshipra</strong> sub-basin. This very<br />
large project will require multiple pumping with pumping heads of around 800 metres at an estimated<br />
cost of Rs2988 crore.<br />
53. Indore Urban Water Supply: Indore is the largest population centre, population growth over<br />
the last census decade shows growth of 40%. The city has a very high population density of 1028<br />
persons per ha and severe problems of water and sanitation. Water supply is available for only 45<br />
minutes on alternate days, covering 54% of the city population. Average water supply is 80 lpcd. 50%<br />
of water is unaccounted for (UFW) including 40% transmission and distribution losses. Only 55%<br />
population has access to sewerage network and 80% of sewers are underutilised for want of<br />
maintenance. Only 20% of roads have storm water drainage solid waste collection suffers from poor<br />
handling and management narrow road widths, high vehicular ownership, and a heterogeneous mix of<br />
transport modes resulting in traffic congestion problems and a high accident rate.<br />
54. The city development plan for Indore is planning to provide 24/7 water supplies. The Indore<br />
Urban Water Supply is presently being upgraded through ADB support with an additional 360 MLD of<br />
new water supply with raw water intake completed. Testing and Commissioning in progress. The<br />
laying of water mains for 127Kms has been completed. This would add an indicative volume of 65<br />
MCM per year to the <strong>Kshipra</strong> water balance (assuming 70% of capacity pumped and 70% non<br />
consumption).<br />
E. Constraints Faced by Farmers in the <strong>Basin</strong><br />
(i) Because of the high cost of micro-irrigation scheme, poor farmers are finding it difficult to<br />
install the micro-irrigation schemes in spite of government subsidy.<br />
(ii) Farm ponds have come up in Dewas district but have not been adopted in large scale in<br />
Indore and Ujjain districts because shortage of land and lack of awareness about its utility.<br />
(iii) Higher transaction cost in proper packaging, and lack of logistics of farm produce marketing is<br />
the major worry for the farmers.<br />
(iv) Inadequate weather forecasting system particularly seasonal forecasts and timely advisory<br />
information sharing is cause of concern among farmers.<br />
(v) Crop risk management, like crop insurance and micro-credit flows have not become popular in<br />
the basin.<br />
35
Support to the National Water Mission NAPCC<br />
Appendix 3 <strong>Kshipra</strong> <strong>Sub</strong> <strong>Basin</strong><br />
A. Introduction<br />
IV. WATER SECTOR COMMUNITIES AND STAKEHOLDERS<br />
55. Inclusive growth paradigm has made it almost mandatory to have stakeholders‘ participation in<br />
the design, implementation of public policy and decisions about the delivery of services (Martin, 2005)<br />
and also as peer monitoring group. Stakeholders are those who have an interest in a particular<br />
decision, either as individuals or representatives of a group. People who influence or can influence a<br />
decision as well as those affected by it can be considered as stakeholders. Community of<br />
stakeholders can become active with some specific goal. Without going into the definitional debate on<br />
‗community‘ across disciplines we can use it here to describe a group who shares identity on some<br />
specific respect and shares (any one or all) belief, resources, concerns, needs etc. The size of a<br />
community can vary.<br />
56. A commonly shared vision by all stakeholders to have a successful intervention be it policy,<br />
technology or systemic. For the current assignment, specific goal around which we are trying to<br />
identify a community is ―to examine intervention requirements, scope and strategies to improve the<br />
efficiency of water systems and how improved efficiency may be applied to climate change<br />
adaptation‖.<br />
57. To identify water sector stakeholders from climate change point of view within the scope of this<br />
assignment we consider the community associated with the issue at hand. It covers part of the human<br />
society whose employment/livelihood/income/productivity stream will be directly impacted in future -<br />
become riskier/decline- with change in stock and/or flow of water. The stakeholders who are active<br />
with this goal are both national and state government across various departments, knowledge<br />
generators engaged in technological and social innovation, farmers, NGOs. In the context of this<br />
study stakeholders/community are broadly: water source owners, water flow service providers and<br />
water stock and flow users.<br />
58. Water source ownership in the state is represented by multiple categories of stakeholders not<br />
fully coordinated and rules on human interventions on the natural water system if not governed by fully<br />
defined rules.<br />
o Primary sources of water flow are natural 6 (rainfall) defining the overall constraint on primary<br />
water supply. In climate change context adaptation challenge is if the community has<br />
knowledge and preparedness to take actions now so that the individuals, households and<br />
community becomes resilient to uncertain water supply condition in future without affecting<br />
wellbeing (in micro sense we consider current and future income stream of farmers and in<br />
macro sense productivity in agriculture to make state domestic product resilient).<br />
o Secondary sources are various institutional sources based on surface water flow: Interstate<br />
high level body (e.g ., Gandhisagar dam) in control of surface water flow with 10% share for<br />
MP, WRD department owned canal system, Agriculture department owned micro and medium<br />
irrigation systems and famers withdrawing water from open access ground water aquifers with<br />
variety of pumping technology and farm pond based water harvesting systems.<br />
59. Stakeholder can be categorised into water providers and water users as shown in Figure 33.<br />
6 nature do not play an active role as stakeholder for our decision making purpose<br />
36
Support to the National Water Mission NAPCC<br />
Appendix 3 <strong>Kshipra</strong> <strong>Sub</strong> <strong>Basin</strong><br />
Figure 33: Structure of Users and Providers<br />
STAKEHOLDER<br />
WATER USERS WATER PROVIDER<br />
Water for final use:<br />
Household demand for drinking purpose<br />
Water for intermediate use/input in<br />
production process:<br />
Household demand for cooking, hygine and<br />
sanitation, bathing, gardening etc.<br />
Agricultural water demand for irrigation<br />
Industrial water demand for process<br />
37<br />
Water suppliers/managers<br />
Formal:<br />
Government managed water supply<br />
department for distribution of canal water for<br />
irrigation and drinking water<br />
Water users association<br />
Informal: Farmers with pump to lift ground<br />
water and sells at a cost either monetized<br />
(cash) or non monetized (in kind)<br />
B. Stakeholder Perceptions to Surface Groundwater and Environment<br />
60. In the <strong>Kshipra</strong> river sub-basin major water user is agriculture sector with changing and ever<br />
increasing demand. Residential sector as water user is important here with declining water table in<br />
and around urban areas of Indore and Ujjain. So, we have focused on farmers, rural households of<br />
various income strata (defined by landholding size) and water managers from irrigation, horticulture<br />
and public health and hygiene departments. Source of information is primary first hand data collected<br />
through rapid rural appraisal through face to face participatory focused group discussions and<br />
community consultations, household surveys and some secondary sources obtained from local<br />
scientists and government handouts. Goal is to identify key issues regarding surface water,<br />
groundwater, water related sectors and the environment to help in preparation of strategic framework<br />
planning. Also, to examine intervention requirements, scope, and strategies to improve the efficiency<br />
of water systems and study how climate change dimensions may effectively be incorporated in IWRM<br />
climate change adaptation roadmaps.<br />
61. The specific goal of PRA and household survey has been to understand community<br />
perception at various levels and to get first hand :<br />
o stakeholder assessment of current issues related to surface and ground water<br />
o the problems and causes of issues<br />
o perception of change in climate induced parameters and impact on water resource<br />
o to test the response to potential initiatives to address water issues<br />
o identify possible initiatives that could be further investigated<br />
1. Adopted Methodology for the PRA<br />
62. The PRA is designed to support the stakeholders through the process of analysis of the<br />
problems and help them identify appropriate response to the difficulties and opportunities. We have<br />
used preset questionnaire as checklist to get structured response. Qualitative response during<br />
focused group discussions has also been recorded, compiled, assessed and presented in the report.<br />
We have followed the conceptual framework of (livelihood, Institutions, Food security and<br />
Empowerment) LIFE approach 7 and Nine Square Mandal in preparation of questionnaire in<br />
cooperation with other team members involved in TA. In the sub basin three locations have been<br />
identified through prior visits, consultative processes with stakeholders. Locations selected are<br />
characterized by primarily diversity in conjunctive water use practices and related challenges. ADB-<br />
PRA team held stakeholder meetings 8 at the villages with stakeholders assembled in focused group<br />
discussion (FGD) in each of the three locations. However, primary data has been collected not only<br />
from FGD but also through household survey (39 households covered) and case analysis (three) – for<br />
7 Ghosh and Roy (2006)<br />
8 PRA meeting participant lists are given in annexure II
Support to the National Water Mission NAPCC<br />
Appendix 3 <strong>Kshipra</strong> <strong>Sub</strong> <strong>Basin</strong><br />
progressive farmers 9 . These three levels of interview methods have been followed to get community,<br />
household and individual perceptions.<br />
2. <strong>Kshipra</strong> River <strong>Sub</strong>-basin<br />
63. The primary criterion for selection of the field survey locations has been the diversity in<br />
conjunctive water use pattern and suggestion from state departments. Goal has been to understand if<br />
the stakeholders‘ challenges in diverse locations spread over the sub basin are diverse or not.<br />
Secondary criteria for survey location selection have been crop diversity, followed by ground and<br />
surface water quality and quantity. The site selections have been preceded by investigative field visit 10 ,<br />
consultation with all kinds of broad categories of stakeholders.<br />
3. Community Perceptions<br />
64. The stakeholders of various interest groups shared more or less a common vision on current<br />
water availability, access, distribution and quality in the region. Diverging views are reflected in<br />
quantification of the issues. This is presented below through ranges of values for various variables<br />
and parameters.<br />
65. The perceptions to current issues relating to irrigation water access include:<br />
o Multipurpose irrigation project with canal system from large village ponds (sasakiya talab)<br />
meet only very limited irrigation water demand with very limited command area. It is by gravity<br />
flow. As per rule there are water users association elected by command area residents. WRD<br />
department is in custody of these systems. Warabandi system was tried but failed. Surface<br />
water supply system leaves huge unmet demand in agriculture sector thereby shifting the<br />
demand pressure on unregulated ground water extraction at farmers‘ private initiative and<br />
cost. The traditional crop varieties : gram, cotton, paddy have now ( more than a decade ago)<br />
been replaced by soyabean during rainy season followed by wheat in dry season where<br />
irrigation is available otherwise black gram, vegetables, horticulture. Major driver is level of<br />
certainty in current economic return (due to market support price for soyabeans, short crop<br />
duration, less water need, availability of processing units) from agricultural production to<br />
provide stable income flow to farmers.<br />
o Surface water can meet only 0%-50% of irrigation demand in wheat cultivation.<br />
o Farmers have high dependence (100-50%) on uncontrolled/open access ground water<br />
resources. During consultations it could be assessed that perception of common<br />
property/open access resource and knowledge on possible management practices either at<br />
theoretical level or from practical point of view is almost nil across all stakeholders. But open<br />
to new ideas when discussed. Ground water quality is hard.<br />
o With introduction of tank at farm level in Dewas the conjunctive water use scenario changed.<br />
Lining of canal is costly almost four times than tank cost.<br />
o Next generation is not all moving away from agriculture with increasing level of education<br />
and that itself is good for technology intensive horticulture practice scaling up, introduction of<br />
best practices, modernization etc. Labour is becoming scarce with competing demand in<br />
NREGA which is almost timed with harvesting season. Community feel activities can be timed<br />
differently to benefit both kinds of activities. Chart below show percentage of younger people<br />
interested to staying in agriculture across districts.<br />
o In Chidawad Village 100% village households have agriculture as only primary occupation.<br />
40% households have family members in Indian army. 90% have own land others work in<br />
others‘ lands as labour. Historically they used to grow Jowar and cotton when it was only one<br />
crop but now it is wheat, gram, groundnut. This has been made possible by water and<br />
electricity availability.<br />
o In Khejuria-Rewari it is mostly inhabited by OBC community. It is 300-400 years old village.<br />
Migrants from Rajasthan got settled in the village. Migration was mainly due to drought. 250<br />
households live of which 100% are agricultural farmers with 85% own land others work in<br />
other‘s land. Size varies between 100-150 bighas. 148 households are in BPL category.<br />
9 Omprakash Patel: Chrawat Village, Yogendra Kausik –Ujjain, Rajendra Singh Solanki, village Barkheri-Ujjain.<br />
10 November 2010: Bhopal, Ujjain, Dewas, Indore<br />
38
Support to the National Water Mission NAPCC<br />
Appendix 3 <strong>Kshipra</strong> <strong>Sub</strong> <strong>Basin</strong><br />
o In Naugaon 300 years old village two brothers from Marwar in Rajasthan started the village<br />
with Jowar and opium cultivation. Now it is soyabeans and cotton in last 30 years. 375<br />
households are there. Bore hole based handpump (7-8) at 100-150 depth provide drinking<br />
water . 100 dugwells are seconday drinking water source. There are 75% households who can<br />
have one crop alone based on rainfall and 25% area can be under two crops. Dug well and<br />
electric motor based boreholes (25%) are water sources for agriculture. There has been no<br />
testing on quality. 144 BPL households . Four households have 100-250 bighas, 50<br />
households with larger than 5 bighas and rest have 1-5 bighas. Water table is at 50ft but until<br />
January.<br />
o In Indore there are 384 gram panchayats and 600 villages. 100% are agriculture dependent<br />
5% have milk production for market as non farm income source. 70% have own land and 30%<br />
work in others‘ lands. Out of 7000 acres of cultivable land 41.82% is from ground water, 2%<br />
from canals and rest practice dry agriculture.<br />
o Boreholes at 100-400 ft depth provide ground water source. There is over exploitation of<br />
ground water with increased agricultural activities and during dry season productivity is less by<br />
30%.<br />
o Farmers have very inequitable and high dependence (50-100%) on uncontrolled/open access<br />
ground water resources. Perception of common property/open access resource and<br />
knowledge on possible management practices either at theoretical level or practical point of<br />
view is almost nil across all stakeholders. But were receptive to new ideas when discussed.<br />
Ground water is depleting very fast. The area was known for high ground water level in the<br />
past historically but is drying up. Ground water exploitation is exclusively driven by<br />
unregulated private demand and affordability.<br />
o Boring and recharge at various points in <strong>Kshipra</strong> river is happening. Nadi purnavaran project<br />
of state government has started with the aid of an NGO.<br />
o Water quality is declining : Salinity and hardness is causing problem for agricultural<br />
productivity<br />
o Tail enders do not get adequate water in gravity flow system due to declining water level in<br />
Government tanks. These tanks beds are allowed to be used for cultivation when there is low<br />
water level and understood to be very highly productive due to silt and organic matter etc. But<br />
there is discontent among community by caste for this privilege being given to lower caste.<br />
Government argument is that those whose lands were historically taken for tank are being<br />
allowed to use the tank bed for cultivation. The other complaining community has high<br />
demand for silt due to it‘s fertility and feel tank excavation can enhance gravity flow of canals.<br />
o Current subsidy scheme on drip and sprinkler is seen as inefficient as these are targeted at<br />
BPL farmers who do not have other compatible infrastructure to take advantage of the<br />
scheme. There is a general feeling that it should have been for all and not BPL which could<br />
have scaled up the efforts faster.<br />
o Most of the farmers have reported that they have not taken any loan from money lenders. The<br />
farmers who taken loan have used KCC facility.<br />
o The Kharif crop is rain-fed. The rabi crop depends on irrigation. Two crops are grown in a<br />
year. About 25% of the agricultural area is single cropped for the lack of irrigation.<br />
o Flood is not an issue in the region as the region is water scarce. Drought is major threat.<br />
Community want drought resistant shorter variety of soybeans, wheat.<br />
o The households surveyed are of various landholding sizes. The small farmers have challenge<br />
in accessing ground water this share crop 50:50 with large farmers to get irrigation water lifted<br />
by pump at private cost.<br />
4. Participatory Irrigation Management (PIM)<br />
o Currently diverse irrigation water supply systems are run by diverse departments: agriculture<br />
department, horticulture department, WRD, watershed management programme, farmers‘<br />
individual initiatives. There is need for integration of efforts, targets, information compilation<br />
and monitoring through coordinated community mobilization.<br />
o High degree of farming community participation are characterise <strong>Kshipra</strong> basin. Pro-active<br />
farmers in <strong>Kshipra</strong> basin have been historically harvesting rainwater at the private farm level.<br />
There is strong community support to stop any run off from the basin to Narmada and hold the<br />
water where it drops.<br />
39
Support to the National Water Mission NAPCC<br />
Appendix 3 <strong>Kshipra</strong> <strong>Sub</strong> <strong>Basin</strong><br />
o There is demand from farmers to de-silt the sasakiya Talabs (government owned public ponds<br />
that are very large in size with available infrastructure) that can enhance water retention<br />
capacity and meet irrigation water demand of the command area.<br />
o Need for government regulation on ground water extraction was supported by all in PRA<br />
meetings. Household response for regulation and control vary district wise. While in Dewas<br />
83% households feel there is need for regulation and control over ground water for long term<br />
sustainability responses are low in Ujjain and Indore (58% and 11% respectively). However,<br />
less support is found for electricity charges to control water withdrawal. The farmers are<br />
unhappy with current electricity charge collection system based on horse power of machines.<br />
5. Response to Regulation and Control<br />
66. The responses to various possible interventions on regulation and control are summarised in<br />
Table 24.<br />
Table 24: Farmer Response to Possible Initiatives<br />
Strongly Strongly<br />
Mixed No<br />
Agree<br />
Disagree Agree Disagree Feeling Opinion<br />
D I U D I U D I U D I U D I U D I U<br />
For long term sustainability some type of regulations<br />
(control and restrictions) on groundwater is required<br />
Government to introduce charges for power used for<br />
67 37 0 0 5 0 17 16 11 0 37 56 0 5 33 17 0 0<br />
tubewell water to control use and reduce demand<br />
Government to provide more subsidy for tank and micro<br />
0 11 0 8 0 0 8 5 0 25 63 89 33 11 0 25 0 11<br />
irrigation<br />
Government to take on greater control and regulation of<br />
17 37 67 0 0 0 75 53 33 0 0 0 8 0 0 0 0 0<br />
groundwater use.<br />
Greater Government controls to be introduced in tandem<br />
with programmes to support greater water use<br />
17 26 0 0 0 0 67 5 0 8 42 89 0 16 0 8 0 11<br />
efficiencies and higher return cropping systems 58 53 22 0 0 0 33 5 67 0 21 0 8 5 11 0 0 0<br />
Government to restrict the number of wells 8 11 0 0 0 0 42 5 0 33 58 ## 17 16 0 0 11 0<br />
Farmers and Community associations to take on<br />
greater control of surface and groundwater management 25 16 0 0 0 0 58 32 56 8 32 33 0 16 11 8 5 0<br />
Community associations could take on responsibilities<br />
to control and mange groundwater abstractions<br />
Government to change the price guarantees subsidies<br />
8 0 0 0 0 0 83 32 78 0 32 0 8 32 22 0 0 0<br />
to promote non rice crops<br />
Note D-Dewas, I-Indore and U-Ujjain<br />
50 32 ## 0 0 0 33 11 0 8 21 0 0 16 0 0 0 0<br />
67. Farmers‘ strongly believe they can contribute towards ground water recharge through farm<br />
ponds. But there is no scientific monitoring of this. Over the years community has taken leadership to<br />
innovate farm ponds to get private access to secure water supply. This has now become a practice<br />
and been mainstreamed in policy action. There exist 70-80% government subsidy for balaram talab<br />
(farm ponds) which can be created in 10% of the farmer‘s own land. Madhyapradesh model of<br />
government support for scaling up community efforts is a good method to deliver adaptive action.<br />
Deamnd for more subsidy is observable from household responses (100% in Indore, 89% and 92% in<br />
Ujjain and Dewas). Jalabhishek, jal sangbad published regularly in Ujjain all are examples of is<br />
community participation in water management.<br />
68. In promotion of drip and sprinkler irrigation in horticulture is also example of participatory<br />
management system. With government providing subsidy to the tune of 30-40% (higher for SC/ST<br />
categories ) show cost sharing for promotion of water use efficiency.<br />
69. While 100% of households in Dewas and Ujjain favour better surface water management as<br />
desirable strategy, in Indore it is for artificial ground water recharge and managing pollution in rivers<br />
are the most favoured strategies.<br />
40
Support to the National Water Mission NAPCC<br />
Appendix 3 <strong>Kshipra</strong> <strong>Sub</strong> <strong>Basin</strong><br />
70. Both policy makers and farmers feel they need to work in tandem for providing water access<br />
security. But instead of government taking more control households prefer more community control. In<br />
Dewas 83-93% households feel community can better manage water systems, while in Ujjain the<br />
figure in favour of community participation 32-47% feel so and in Indore 56-78% think community can<br />
do a better job. However, all feel presence of government is necessary as a catalyst otherwise<br />
community on their own might not be able to take collective action. People are interested for role for<br />
the government for water management as this will help reduce social conflict. The household choice<br />
pattern for strategies to enhance water use efficiency across districts are shown in Figure 34, Figure<br />
35 and Figure 36.<br />
:<br />
Particulars<br />
Figure 34: Possible Methods to Improve Water Efficiency (% households) Dewas<br />
Seasonal w eather forecasts to be provided for<br />
farmers<br />
Cleaning of Pollution of <strong>Kshipra</strong> River needed<br />
Creating Recharge points in <strong>Kshipra</strong> River<br />
Introduce some level charges for electric pow er<br />
for tubew ells in return for improve electricity<br />
availability and subsidies to reduce w ater losses.<br />
Introduce increased support for improved irrigation<br />
systems.<br />
Develop the use of pipe irrigation<br />
Develop strategies to improve the conjunctive use<br />
of surface and groundw ater<br />
Expand the use of drip and sprinkler irrigation<br />
Expand the use of laser leveling to improve<br />
efficiencies<br />
Improve the surface w ater management through<br />
tanks<br />
Promotion of high value cash crop<br />
Promote the use of shorter duration<br />
horticulture/vegetables<br />
Improve the artificial recharge through community<br />
participation and incentives<br />
8<br />
17<br />
17<br />
58<br />
83<br />
92<br />
92<br />
92<br />
100<br />
100<br />
100<br />
100<br />
100<br />
0 20 40 60 80 100 120<br />
Percentage of households<br />
41
Support to the National Water Mission NAPCC<br />
Appendix 3 <strong>Kshipra</strong> <strong>Sub</strong> <strong>Basin</strong><br />
Figure 35: Possible Methods to Improve Water Efficiency (% households) Indore<br />
Particulars<br />
Seasonal w eather forecasts to be provided for<br />
farmers<br />
Cleaning of Pollution of <strong>Kshipra</strong> River needed<br />
Creating Recharge points in <strong>Kshipra</strong> River<br />
Introduce some level charges for electric pow er<br />
for tubew ells in return for improve electricity<br />
availability and subsidies to reduce w ater losses.<br />
Introduce increased support for improved irrigation<br />
systems.<br />
Develop the use of pipe irrigation<br />
Develop strategies to improve the conjunctive use<br />
of surface and groundw ater<br />
Expand the use of drip and sprinkler irrigation<br />
Expand the use of laser leveling to improve<br />
efficiencies<br />
Improve the surface w ater management through<br />
tanks<br />
Promotion of high value cash crop<br />
Promote the use of shorter duration<br />
horticulture/vegetables<br />
Improve the artificial recharge through community<br />
participation and incentives<br />
16<br />
63<br />
74<br />
79<br />
79<br />
84<br />
84<br />
89<br />
89<br />
89<br />
95<br />
95<br />
100<br />
0 20 40 60 80 100 120<br />
Percentage of households<br />
42
Support to the National Water Mission NAPCC<br />
Appendix 3 <strong>Kshipra</strong> <strong>Sub</strong> <strong>Basin</strong><br />
Figure 36: Possible Methods to Improve Efficiency (% households) Ujjain<br />
Particulars<br />
Seasonal w eather forecasts to be provided for<br />
farmers<br />
Cleaning of Pollution of <strong>Kshipra</strong> River needed<br />
Creating Recharge points in <strong>Kshipra</strong> River<br />
Introduce some level charges for electric pow er<br />
for tubew ells in return for improve electricity<br />
availability and subsidies to reduce w ater losses.<br />
Introduce increased support for improved<br />
irrigation systems.<br />
Develop the use of pipe irrigation<br />
Develop strategies to improve the conjunctive use<br />
of surface and groundw ater<br />
Expand the use of drip and sprinkler irrigation<br />
Expand the use of laser leveling to improve<br />
efficiencies<br />
Improve the surface w ater management through<br />
tanks<br />
Promotion of high value cash crop<br />
Promote the use of shorter duration<br />
horticulture/vegetables<br />
Improve the artificial recharge through community<br />
participation and incentives<br />
6. Challenges in Drinking Water<br />
71. Potable Use: The primary source of drinking water in all the three villages is bore well except for<br />
Dewas where piped water supply through public stand posts are primary sources. Drinking water<br />
availability is a major issue especially in Indore. A summary of the drinking water is shown in Table 25<br />
to Table 28<br />
11<br />
56<br />
56<br />
56<br />
67<br />
78<br />
89<br />
100<br />
100<br />
100<br />
100<br />
100<br />
100<br />
0 20 40 60 80 100 120<br />
Percentage of households<br />
43
Support to the National Water Mission NAPCC<br />
Appendix 3 <strong>Kshipra</strong> <strong>Sub</strong> <strong>Basin</strong><br />
Table 25: Primary drinking water in wet season (% of households from the sample )<br />
Piped Supplyhouse<br />
Borehole Hand Borehole<br />
Districts Pump<br />
Electric Pump Dug Well connection<br />
Indore 53 47 0 0 0<br />
Ujjain 33 33 33 0 0<br />
Dewas 17 8 8 25 42<br />
Total 38 33 10 8 13<br />
44<br />
Piped Supply<br />
stand pipe<br />
Table 26: Primary drinking water in dry seasons (% of households from the sample)<br />
Borehole<br />
Electric<br />
Pump<br />
Piped Supplyhouse<br />
connection<br />
Piped<br />
Supply<br />
stand<br />
pipe<br />
Borehole Hand<br />
Dug<br />
Districts Pump<br />
Well<br />
Indore 42 53 5 0 0 0<br />
Ujjain 22 33 33 0 0 11<br />
Dewas 75 0 0 0 8 17<br />
Total 48 33 10 0 3 8<br />
Table 27: Drinking Water Availability (% of Households from the sample)<br />
Districts Major issue Some issue Not an issue<br />
Indore 53 0 47<br />
Ujjain 22 22 56<br />
Dewas 33 25 42<br />
Total 40 13 48<br />
Table 28: Drinking Water Quality (% of Households from the sample)<br />
Not<br />
Available<br />
Districts Major issue Some issue Not an issue<br />
Indore 0 0 100<br />
Ujjain 0 0 100<br />
Dewas 0 0 100<br />
Total 0 0 100<br />
72. Ground water availability; even though ground water table is falling year after year, the<br />
groundwater is still used for irrigation. The government tube wells for drinking purposes are broadly at<br />
the same depth as the irrigation boreholes, as a result the drinking water well are very vulnerable<br />
Over the last 20 years, farmers have shifted from tanks/ dug well to bore well for their source of<br />
drinking water due to declining water table. Women and children now travel a long distance and spend<br />
time for fetching good quality drinking water. This is was observed to be very acute in Khajuria rewari<br />
village.<br />
73. Ground water quality; was not seen as a major problem in all the districts surveyed. The waste<br />
water from the city of Indore released into the river Khan was seen as a problem. in one community.<br />
The polluted water enter into the village through canal, generating a foul smell. It also leached into the<br />
ground water. Villagers have reported that 10% of the bore holes are getting affected.<br />
7. Challenges in the Agriculture Sector: crop choice and farming practice<br />
o Farmers mainly grow Soya in the Kharif season and wheat in the Rabi season. Soya<br />
cultivation has significantly changed farming practices, To ensure good drainage field bund<br />
types and contouring has changed. Land preparation is now designed to drain quickly excess
Support to the National Water Mission NAPCC<br />
Appendix 3 <strong>Kshipra</strong> <strong>Sub</strong> <strong>Basin</strong><br />
water out of the fields during rain. this has increased runoff and downstream silt deposition<br />
and reduced infiltration.<br />
o Horticulture is labour intensive so which is a major limitational factor for horticulture expansion.<br />
o Policy innovation and technological innovation along with training for farmers has had major<br />
impacts on the agricultural system in Madhya Pradesh. The opportunity niches have<br />
significantly scaled up over time, and good benefits have been achieved in the short term.<br />
More recently the rising scarcity in availability of agricultural labour has affected the production<br />
models. Food security has dominated the goal from public policy perspective while profitability<br />
and higher income has been the driving motivate of the farmers.<br />
o The support price for soya has provided a major incentive towards income security and led<br />
into the major expansion in the area grown under soya.<br />
o Organic farming practice is increasing slowly in Dewas. Farming household however do not<br />
feel there is enough scope for changing cropping pattern given their soya-wheat–vegetable<br />
cycles. Continuing research by BISA on wheat and maize, of JAICA on soybean to get short<br />
duration variety are seen as positive steps by farmers. There is a need for<br />
research/information on applicability of drip irrigation for soybean. Cotton cultivation has been<br />
identified as a potential interest by the communities.<br />
o Ujjain and Indore felt that with changing temperature mulching is becomeing a necessity to<br />
keep soil moisture content stable.<br />
o Only 11-42% of households think there is some possibility as they grow very little paddy<br />
anyway (0-32%). There can be substitution of wheat by zero tillage oil seed<br />
(kusum)/pisiculture etc. But shift to horticulture with irrigation infrastructure subsidy is<br />
preferred by larger number (22-53%). While farming households (83%) in Dewas think future<br />
sustainability of water supply strategy is important it is somewhat different in Indore (42% )<br />
and Ujjain (0%). But they express funding need for strategic actions towards water quality<br />
management, management of nallas, series of dams creation etc. , desiltation.<br />
o Experts feel monocropping pattern with soyabean crop disease risk is increasing and there is<br />
need for crop diversification. Soil is becoming zinc deficient.<br />
8. Future issues : Perception about Climate Change<br />
74. Future issues have been very interestingly identified by the stakeholders based on their<br />
perception of changing climatic parameters and rising demand; there is less divergence among<br />
stakeholders in this regard. The objective was to ascertain the past ten year‘s perception of climate.<br />
Given the presence of stakeholders of varied age group historical past this is reflected in recall based<br />
statements.<br />
75. Perceived change in temperature and consequent rainfall is supported by all interviewed across<br />
all cross sections during PRA or household survey. While farmers in Ujjain and Dewas are more<br />
(100%) concerned about the declining surface water availability in Indore similar (100%) concern is for<br />
declining ground water table. Increased urbanization and competing demand for water is suggested as<br />
one source of concern by the community. While 100% of households in Dewas and Ujjain favour<br />
better surface water management as desirable strategy, in Indore it is for artificial ground water<br />
recharge and managing pollution in rivers are the most favoured strategies. Villagers have very strong<br />
opinion about deforestation that is causing changes in local level rainfall patterns, as described below<br />
and in Figure 37<br />
:<br />
o Changing climate is affecting high value cash crop as well: gram, potato, chilli, fruits papaya,<br />
vegetables. Untimely harvest time rain is damaging crops more than 40%.<br />
o Household responses on perceived changes in the last 10 years on following parameters are<br />
shown in charts below.<br />
o Most of the households are unanimous about rising temperature, declining surface water<br />
availability and ground water.<br />
45
Support to the National Water Mission NAPCC<br />
Appendix 3 <strong>Kshipra</strong> <strong>Sub</strong> <strong>Basin</strong><br />
Figure 37: Climate Changes as Observer in the Last 10 years<br />
Dewas<br />
Particulars<br />
Indore<br />
Particulars<br />
Ujjain<br />
Flood<br />
Ground Water Quality<br />
Grounr Water availability<br />
Depth to Ground Water<br />
Surface w ater availability<br />
Drought<br />
Start date of the monsoon<br />
Frost<br />
Extreme Rainfall<br />
Total Rainfall<br />
Temperature<br />
Flood<br />
Ground Water Quality<br />
Grounr Water availability<br />
Depth to Ground Water<br />
Surface w ater availability<br />
Drought<br />
Start date of the monsoon<br />
Frost<br />
Extreme Rainfall<br />
Total Rainfall<br />
Temperature<br />
8<br />
17<br />
25<br />
33<br />
83<br />
83<br />
100<br />
100<br />
100<br />
100<br />
100<br />
0 20 40 60 80 100 120<br />
0<br />
Percentage of households<br />
21<br />
53<br />
58<br />
63<br />
68<br />
79<br />
89<br />
95<br />
100<br />
100<br />
0 20 40 60 80 100 120<br />
Percentage of households<br />
46
Support to the National Water Mission NAPCC<br />
Appendix 3 <strong>Kshipra</strong> <strong>Sub</strong> <strong>Basin</strong><br />
Particulars<br />
Flood<br />
Ground Water Quality<br />
Grounr Water availability<br />
Depth to Ground Water<br />
Surface w ater availability<br />
Drought<br />
Start date of the monsoon<br />
Frost<br />
Extreme Rainfall<br />
Total Rainfall<br />
Temperature<br />
22<br />
9. Water Management Issues<br />
76. Water Management issues and possible solutions received a very high support from all<br />
stakeholders as described below..<br />
77. While check dam in Dewas were identified by most households as an issue ; in Indore and<br />
Ujjain electric supply was identified as the major issue. In Dewas second the second key issues on the<br />
list was lowering of ground water table and concern for future sustainability appears as majority issue<br />
in both Ujjain and Indore. The need for check dams was identified as second important priority. Poor<br />
maintenance of tanks is identified as next major issue if judged by household response. The<br />
responses are summarised in Figure 38.<br />
10. Possible Mechanisms to Enhance Resilience and Reduce Vulnerability<br />
78. Household were asked what do they consider to be the most important from list of actions.<br />
Responses favoured market support price as the highest priority, followed by ground water recharge<br />
and water access security, followed by crop insurance, revival of old tanks and reservoirs, least<br />
importance has been attached to subsidy . The household responses are described below and shown<br />
in Figure 38: Water Management Issues<br />
o In Madhya Pradesh the need was seen to create adaptive capacity for water resource<br />
management and to reduce future vulnerabilities. The need is also for institutional<br />
reorganization was considered important, the need to get the forest department as an active<br />
partner was seen important; which is not the case now.<br />
o Villagers during PRA expressed that best way to deliver adaptive action to reduce vulnerability<br />
to climate change risks might be by rejuvenation through desiltation of all kinds of traditional<br />
water storage facilities within the villages: farm ponds, government ponds (shasakiya Talab),<br />
wells (kuaon), drainage channels (nallas), <strong>Kshipra</strong> river perennial flow revival, cleaning of<br />
pollution of tributaries like khan, artificial recharge of ground water through abandoned<br />
tubewells. This however they feel needs technical knowledge and equipments. Community<br />
involvement through sharing of silt, putting in labour/equipments to supplement government<br />
effort is offered by all the farmers interviewed. Local NGO s are working as a bridge to<br />
community and government for the <strong>Kshipra</strong> punarbharikarn (rejuvenation) programme.<br />
o Securing water and sanitation systems to climate change risks are priority areas for the state.<br />
o River linking discussion may be revived and explored more. Some people have argued that<br />
<strong>Kshipra</strong> should be linked with Narmada and Khan rivers.<br />
78<br />
89<br />
89<br />
100<br />
100<br />
100<br />
100<br />
100<br />
100<br />
100<br />
0 20 40 60 80 100 120<br />
Percentage of households<br />
47
Support to the National Water Mission NAPCC<br />
Appendix 3 <strong>Kshipra</strong> <strong>Sub</strong> <strong>Basin</strong><br />
Figure 38: Water Management Issues<br />
Dewas Indore<br />
Particulars<br />
Ujjain Preferences to Reduce Vulnerabilities<br />
Particulars<br />
Farmers w ant to go for horticulture<br />
for subsidy in irrigation system<br />
How keen are Farmers for paddy<br />
due to support price?<br />
Change in cropping pattern is using<br />
too much groundw ater<br />
Low charging for pow er is causing<br />
overexploitation<br />
Long term sustainability of<br />
groundw ater<br />
Low ering of groundw ater due to<br />
overexploitation.<br />
Lack of dependable electric pow er<br />
Poor maintenance of tanks<br />
Water quality<br />
Equitability in access to w ater for the<br />
individual fields<br />
Farm tanks of varied sizes<br />
proportional to land holding<br />
Check dams on river <strong>Kshipra</strong><br />
Farmers w ant to go for horticulture<br />
for subsidy in irrigation system<br />
How keen are Farmers for paddy<br />
due to support price?<br />
Change in cropping pattern is using<br />
too much groundw ater<br />
Low charging for pow er is causing<br />
overexploitation<br />
Long term sustainability of<br />
groundw ater<br />
Low ering of groundw ater due to<br />
overexploitation.<br />
Lack of dependable electric pow er<br />
Poor maintenance of tanks<br />
Water quality<br />
Equitability in access to w ater for<br />
the individual fields<br />
Farm tanks of varied sizes<br />
proportional to land holding<br />
Check dams on river <strong>Kshipra</strong><br />
11. Recommendations for Community Capacity Building and Training Needs<br />
79. A summary of responses include;<br />
8<br />
17<br />
25<br />
25<br />
42<br />
50<br />
58<br />
67<br />
75<br />
83<br />
83<br />
92<br />
0 20 40 60 80 100<br />
0<br />
0<br />
0<br />
0<br />
Percentage of households<br />
11<br />
22<br />
44<br />
44<br />
44<br />
78<br />
89<br />
100<br />
0 20 40 60 80 100 120<br />
Percentage of households<br />
Particulars<br />
Particulars<br />
Farmers w ant to go for horticulture<br />
for subsidy in irrigation system<br />
How keen are Farmers for paddy<br />
due to support price?<br />
Change in cropping pattern is using<br />
too much groundw ater<br />
Low charging for pow er is causing<br />
overexploitation<br />
Long term sustainability of<br />
groundw ater<br />
Low ering of groundw ater due to<br />
overexploitation.<br />
Lack of dependable electric pow er<br />
Poor maintenance of tanks<br />
Water quality<br />
Equitability in access to w ater for<br />
the individual fields<br />
Farm tanks of varied sizes<br />
proportional to land holding<br />
Check dams on river <strong>Kshipra</strong><br />
o Training of farmers by farmer master trainers can enhance community cooperation and<br />
scaling up of best practices.<br />
o Youths with better education and exposure, veteran farmers with leadership quality can be<br />
further trained to act as master trainers.<br />
o Training for drip irrigation technique be made widespread.<br />
16<br />
21<br />
21<br />
32<br />
32<br />
42<br />
47<br />
47<br />
53<br />
53<br />
68<br />
89<br />
0 20 40 60 80 100<br />
Percentage of households<br />
NA<br />
w ater access<br />
support price<br />
subsidy for tank irrigation<br />
subsidy for MI<br />
more revival of old/ potential tanks<br />
ground w ater recharge<br />
crop insurance<br />
3<br />
3<br />
8<br />
13<br />
15<br />
18<br />
18<br />
48<br />
25<br />
0 5 10 15 20 25 30<br />
Percentage of households
Support to the National Water Mission NAPCC<br />
Appendix 3 <strong>Kshipra</strong> <strong>Sub</strong> <strong>Basin</strong><br />
o Training for non farm income generation capacity. Farmers feel their eco-service generation<br />
through ponds and cascade of those can become a point of attraction. They need more<br />
training for making use of idle months which is sometimes as high as four months.<br />
80. Based on assessment of community response it is clear that a strategic plan aimed at providing<br />
micro level livelihood/income and macro level productivity security/risk minimization through a portfolio<br />
of measures is required.. No single action can ensure adequate adaptive capacity. Simultaneous<br />
implementation of portfolio of actions might bring in desired radical change. The portfolio of actions<br />
can range over a number of interventions, including;<br />
o Water security at farm level<br />
o Community empowerment through knowledge dissemination<br />
o Provision of desiltation mechanism and funding.<br />
o Afforestation programmes.<br />
o Crop diversification from soya to move away with adverse impacts of monocropping practice.<br />
Marketing facility, storage facility and market support price for crops other than soya and<br />
wheat, promotion of horticulture practice, oil seed like kusum.<br />
o Alternative irrigation techniques: drip , piped, mulching<br />
o Ground water recharge<br />
o Water quality management<br />
o Water course lining vs. farm ponds need further assessment<br />
o Managed conjunctive water use<br />
o Water use monitoring by ground water permit system /bore hole restrictions/ground water use<br />
regulation/reliable electric supply/rationalization of surface water supply/payment for eco<br />
service<br />
o Improved Weather forecast<br />
o Enhancement of non farm income sources such as milk or pisiculture<br />
o Farmers training regarding the optimum use of water for improving overall water situation<br />
12. Road Map for Community Actions<br />
81. The implementation of strategic plan need an Integrated approach, including:<br />
o How information systems on water use and supply can be developed. Such a system can<br />
bring the roles of the stakeholders together observationally. Current level of information is<br />
scattered across different departments and does not lead to integrated approach in strategic<br />
action plan on a cross cutting issue like water.<br />
o How informal ground water market can be transformed into formal participatory water<br />
management system needs to be explored further through research and subsequent<br />
consultation with the stakeholders.<br />
o What combination of actions in strategic risk minimizing policy portfolio be included for various<br />
districts need to be checked through simple cost benefit analysis and further stakeholder<br />
consultation.<br />
o <strong>Sub</strong>sidy versus PES (payment for environmental services) as strategic policy instrument<br />
needs further community consultation.<br />
o How IWRM institution can work towards formalizing informal ground market needs further<br />
check.<br />
o What can be the contribution of changes in technology, policy and behavior of farmers needs<br />
an assessment.<br />
49
Support to the National Water Mission NAPCC<br />
Appendix 3 <strong>Kshipra</strong> <strong>Sub</strong> <strong>Basin</strong><br />
V. INSTITUTIONS<br />
A. Summary of Policy Acts and Institutions<br />
82. State Water Policy of MP is in accordance with the guidelines and general directions in the<br />
National Water Policy. The State water policy makes specific reference among others to: (i)<br />
Information system development as principal necessity in the planning of water resources; (ii) Water<br />
resource planning to be multipurpose and accord priority for drinking water and development of<br />
hydroelectricity; (iii) development and conjunctive use of surface and groundwater; (iv) The quality of<br />
the surface water and groundwater shall be tested on regular basis by concerned departments; (v)<br />
water rates should be such which conveys the beneficiary the scares value of water; (v) The water<br />
resources planning structure to be correlated with demand base of water distribution and necessary<br />
institutional reforms are taken; (vi) establishment of Water Zones and Water Shed Management; (vii<br />
safety of water conservation structures, Research on river formation works and construction material<br />
and (viiii) water distribution system and Remote sensing techniques.<br />
Acts: Good water governance includes regulatory measures. Regulations are necessary to maximize<br />
the economic and social benefits, resulting from water use in an equitable manner. Good water<br />
resource regulation requires an enabling environment, which ensures the rights and assets of all<br />
stakeholders and protects public assets such as intrinsic environmental values. Madhya Pradesh<br />
Irrigation Act, 1931 is progressive in terms of asserting direct state control over water. Further, the<br />
Regulation of Waters Act, 1949 of MP reasserted that ‗all rights in the water of any natural source of<br />
supply shall vest in the Government.<br />
83. With regard to surface water, existing rules still derive from the early common rule of riparian<br />
rights. Thus, the basic rule was that riparian owners had a right to use the water of a stream flowing<br />
past their land equally with other riparian owners to have the water come to them undiminished in flow,<br />
quantity or quality. In recent times, the riparian right theory has increasingly been rejected as the<br />
appropriate basis for adjudicating water claims. In respect of groundwater, the basic principle<br />
governing the groundwater use is that access to and use of groundwater is a right of the landowner, in<br />
other words, it is one of the rights that landowners enjoy over their possessions. The state WRD<br />
prepared the Madhya Pradesh Boojal Vidheyak 1999 (draft) in line with the Model bill circulated by the<br />
Ministry of Water Resources (MOWR) Government of India (GOI) and the draft bill got approved by<br />
the department of law in 1999. However, model bill 2005 received from MOWR, GOI prompted the<br />
state to revise their earlier bill of 1999 and the new Madhya Pradesh (Regulation and control of<br />
<strong>Development</strong> and Management) Act 2007 has been prepared and awaiting approval by the<br />
government of MP. The key features of groundwater bill are: (i) notification of areas, (ii) grant of permit<br />
to extract and use groundwater in the notified area; (iii) registration of existing users in the notified<br />
area; (iv) registration of users of new wells in non-notified areas; (v) registration of drilling agencies;<br />
(vi) rain water harvesting for groundwater recharge in over exploited areas (vii) protection of public<br />
drinking water sources and (viii) two tier of authority i.e. State level Groundwater Authority and District<br />
level groundwater authority as an implementation mechanism.<br />
84. PIM Act 11 : The basic idea behind Farmers‘ Managed Irrigation Systems (FAMIS) was to<br />
improve the overall efficiency of irrigation system, generate sense of ownership among farmers and to<br />
improve the irrigation revenue recovery rate. This laid the seeds for Participatory Irrigation<br />
Management (PIM) in India. The first Farmers‘ Management of Irrigation System Act was enacted by<br />
Andhra Pradesh in 1997. <strong>Sub</strong>sequently many other states i.e. Chattishgarh, Gujarat, Madhya<br />
Pradesh, Maharashtra, Orissa, and Tamil Nadu came up with act or legislation governing farmers‘<br />
involvement in irrigation management. Before formulation of PIM act, GOMP took several other<br />
initiatives to have farmers‘ involvement in irrigation management. They established the Irrigation<br />
Panchayats (IPs) in early 1984-85 under MP Irrigation Act, 1931. The functions of these IPs, their<br />
rights and duties were not clearly defined under the then existing MP Irrigation Rules, 1974.<br />
Consequently these IPs became defunct. In 1994-95, Farmers Management Committees (FMCs)<br />
were formed on pilot basis. Their design principles were very much similar to the farmers‘<br />
cooperatives in the state of Gujarat and Maharashtra. These FMCs were registered under the<br />
11 Source: Irrigation Management Transfer In India: The Processes and Constraints by Nitin Bassi, Research<br />
Consultant, Institute for Resource Analysis and Policy (IRAP)<br />
50
Support to the National Water Mission NAPCC<br />
Appendix 3 <strong>Kshipra</strong> <strong>Sub</strong> <strong>Basin</strong><br />
Cooperative Society Act of the State, but these FMCs were not able to deliver goods as desired of<br />
them and did little to involve farmers in irrigation management. in 1999 MP PIM act called as ―Madhya<br />
Pradesh Sinchai Prabandhan Mein Krishkonka Bhagidhari Adhiniyam 1999‖ was brought into force for<br />
the entire state. The rules for act implementation were passed in the same year (Madhya Pradesh<br />
Farmers Organization Rules, 1999) by the state government. The Act provides for a three-tier farmer‘s<br />
organizations (FOs) for irrigation management. The lowest tier in the institutional hierarchy is Water<br />
Users‘ Association (WUA) at minor canal level of the irrigation system, secondary unit is Distributory<br />
Committee (DC) at distributory canal of the irrigation system and tertiary unit is Project Committee<br />
(PC) at the whole irrigation project level.<br />
85. The apex institution in Madhya Pradesh for development and management of water resources<br />
is the Water Resources Department (WRD). The department has extensive expertise in design,<br />
construction, operation & maintenance of water resources projects and has offices in all parts of the<br />
state. Other water sector line agencies include the Public health engineering Department, Panchayat<br />
and Rural <strong>Development</strong> Department, Agricultural Department, Energy Department, Tourism<br />
department, Forest Department, Fisheries department, Urban <strong>Development</strong> Department, Industries<br />
Department, etc., which have vital stakes in the management of water resources. However, various<br />
institutions are operating within the state having functions related to water sector. Specific functions of<br />
WRD in the state of MP could be broadly classified as: (i) planning and development functions to<br />
cover preliminary and detailed project planning and project preparation including Investigation and<br />
project design; (ii) field Functions relating to operations, maintenance and construction. The<br />
operational functions include: (i) operating the irrigation systems, including dams, canals,<br />
distributaries, minors, outlets; (iii) scheduling water distribution along with WUAs and the instructions<br />
of the water (c) determining water services provided and computing cost of water delivery (iv)<br />
interfacing with WUA, NGO/CBO, and private parties to manage and maintain distribution system at<br />
designated levels, and in the case of WUAs to assist in providing engineering support in activities like<br />
land levelling, alignment of watercourses, construction of small structures, use of simple water<br />
measuring devices, and drainage channels etc. (v) of new technologies like underground water<br />
distribution system, sprinkler irrigation, drip (vi) irrigation etc. for effective utilization and conservation<br />
of water and (vii) public grievance handling while maintenance functions cover: and (viii) drawing up<br />
planned preventive maintenance schedules and scheduling requirements including repairs and<br />
maintenance and estimating funds for maintenance.<br />
86. IWRM principles and practices necessitate the need for role transformation within the existing<br />
departments. It is clear from an institutional mapping exercise in the three states is the sectoral<br />
approach to water resource development has little or no emphasis on integrated approach to water<br />
management. The functions carried out by various departments do not necessarily indicate<br />
institutional readiness to plan and manage the adaptation response to climate change impacts<br />
requiring strong and well coordinated planning and management.<br />
87. An overview of the main institutional mechanism for state-level planning and management of<br />
water resources indicates that: there is a lack of conjunctive planning and regulation of surface and<br />
groundwater, poor understanding of the conjunctive water balance systems. Water quality data is<br />
monitored but not linked planning and management and artificial recharge is important but not<br />
incorporated into the overall water resource planning. Further, all the agencies see their responsibility<br />
as developing water resources for the public good.<br />
88. In conclusion, one could say that any sound policy, acts and mandates of water centric<br />
institutions aiming at water resource development and management should recognize in its totality: (i)<br />
Information Systems and Resource Planning to provide much needed information about groundwater<br />
availability, quality and withdrawal, etc., for use by planners and for the purposes of monitoring and<br />
further research; (ii) Demand-Side Management for regulating groundwater withdrawals at sustainable<br />
levels and such mechanisms to include, for example, licences, laws, pricing systems, use of<br />
complementary water sources and water-saving crop-production technologies (In conformity with<br />
IWRM principles) (iii) Supply-Side Management to augment Groundwater recharge by means of mass<br />
rainwater harvesting and recharge activities and to maximize surface water use for recharge and the<br />
introduction of incentives for water conservation and artificial recharge and (iv) Groundwater<br />
Management in a River <strong>Basin</strong> Context to maximize efficiency and the focus of interventions could be<br />
expanded (from a very ‗local‘ level to the level of entire river basins).<br />
51
Support to the National Water Mission NAPCC<br />
Appendix 3 <strong>Kshipra</strong> <strong>Sub</strong> <strong>Basin</strong><br />
`<br />
Appendix 3B <strong>Kshipra</strong> <strong>Sub</strong> <strong>Basin</strong>,Madhya<br />
Pradesh<br />
Strategic Framework Plan<br />
52
Support to the National Water Mission NAPCC<br />
Appendix 3 <strong>Kshipra</strong> <strong>Sub</strong> <strong>Basin</strong><br />
53
Support to the National Water Mission NAPCC<br />
Appendix 3 <strong>Kshipra</strong> <strong>Sub</strong> <strong>Basin</strong><br />
APPENDIX 3B STRATEGIC FRAMEWORK PLAN<br />
A. Approach<br />
VI. INTRODUCTION<br />
89. The issues of water resources in <strong>Kshipra</strong> sub-basin are complex; with very limited surface water<br />
there is a very high reliance on groundwater and with evidence that current use of groundwater is<br />
unsustainable. There are reports that climate change effects are already occurring and projections of<br />
the likely climate changes are presented.<br />
90. The approach taken for this study is to: (i) assess and prepare a strategic framework to meet<br />
current issues; (ii) review and assess these proposals against projected climate change impacts and<br />
(iii) revise and adjust the strategic framework to incorporate the projected changes into a climate<br />
resilient adaptation framework plan<br />
B. Summary of Key Issues<br />
91. Water is an very major issue in the <strong>Kshipra</strong> sub-basin, with very limited surface water,<br />
groundwater is a critical resource and groundwater overexploitation in some parts presents a key<br />
challenge.<br />
92. Water supplies and sanitation are major issues especially during the dry season when many<br />
wells run dry and water has to be brought in by tanker; gradually declining groundwater is increasing<br />
the problem. Data on rural water supplies show that only about 45%-50% of rural households are fully<br />
covered with access to safe water 12. Rural sanitation is poor with 91% of rural households do not have<br />
access to any form of toilets. Among those who had toilets, 43% had pit latrines and only 29% had<br />
water closet latrines 13 . The urban centres also suffer similar problems; in Indore, water from the town<br />
supply is severely rationed.<br />
93. The major expansion of groundwater irrigation has provided significant benefit to the<br />
communities and there is now a large dependency on groundwater to meet household income<br />
requirements. Groundwater depths now require the use of submersible pumps and increased pumping<br />
depth. Groundwater resources are depleting, the depletion is not uniform; with eight of sixteen blocks<br />
as critical (>90% stage of groundwater GW) and the rest probably in a semi critical/marginal category.<br />
The stage of development is shown in Table 29.<br />
Table 29: Number of Blocks and Stage of GW <strong>Development</strong><br />
Nr of<br />
Stage of GW <strong>Development</strong> (%)<br />
90-<br />
District Blocks >100% 100% 70-90%
Support to the National Water Mission NAPCC<br />
Appendix 3 <strong>Kshipra</strong> <strong>Sub</strong> <strong>Basin</strong><br />
A. Strategy for Adaptation Planning<br />
VII. STRATEGIES TO ADDRESS CURRENT ISSUES<br />
96. The application of climate projections into the development of adaptation planning requires to<br />
be cautious and pragmatic. Framework planning for the sub-basins has been based on three stages<br />
as described below;<br />
Stage 1: Adaptation Strategies for Current Issues: The <strong>Kshipra</strong> sub-basin has very significant<br />
levels of issues that are already affecting long term sustainablity. The approach will be to develop an<br />
initial adaptation plan for current issues based on present climate variabilities. Current issues include<br />
meeting the development needs of increasing population and intensifying agricultural production<br />
systems.<br />
Stage 2: Viabilities of Adaptation Strategies Against Climate Change Impacts: The resilience of<br />
the 'Adaptation Plans for Current Issues' will be tested against projected climate change impacts. The<br />
incorporation of the projected climate changes into the planning will depend on:<br />
(i) The level of confidence of the projections; some projections are more robust than others; for<br />
example projections for temperature are more robust than rainfall patterns.<br />
(ii) The type and estimated design life of any investment: Major investments/programmes<br />
with long design life require to incorporate climate projections beyond 30 years whereas<br />
shorter simpler initiatives can be designed to meet present climate variations. Major long term<br />
investments based on low levels of projection confidence would be avoided.<br />
(iii) Scope for flexibility of the adaptation design: Incorporating facilities wherever possible to<br />
upgrade adaptation design step-by-step to meet progressive climate changes.<br />
(iv) An assessment of the incremental costs: To meet the projected impacts will be made;<br />
where incremental costs are low then it these might be factored into the adaptation design<br />
whereas major cost implication maybe left out in the interim. The aspects of safety and<br />
implications of delayed action would be assessed.<br />
Stage 3: Preparation of a Climate Change Adaptation Framework: Adjustments will be made the<br />
present issues planning based on the outputs of the testing under stage 2.<br />
97. This section describes the various possible strategies to address current issues<br />
B. Farmers’ Perceptions<br />
98. To understand the issues of the communities a Participatory Rural Appraisal was carried out as<br />
described in the sub-basin profile. The farmers in the <strong>Kshipra</strong> have shown that in general they are well<br />
aware of climate change; key points include:<br />
(i) Temperature: farmers observed there is significant change in the temperature in the last 10<br />
years. The summer temperature has risen significantly and the winter temperature has fallen<br />
significantly in all the districts.<br />
(ii) Total Rainfall: there is variation in the change in the total rainfall pattern in the last 10 years<br />
across the regions. Respondents from Indore told that rainfall has not changed significantly in<br />
the last few years, though people in the other districts said that there is significantly less<br />
rainfall.<br />
(iii) Frost: in Indore, frost has caused huge damage on agricultural production in all the districts,<br />
though the damage is seen to be less in Indore.<br />
(iv) Start day of the Monsoon: farmers assess that on average starting day of the monsoon has<br />
been delayed by 10-15 days.<br />
(v) Water Table: farmers report that the average water table has gone down from an average<br />
level of 200-250 ft to 400 ft in Dewas.<br />
99. It is felt that high temperature and erratic rainfalls are causing part of the problem; the water<br />
table is declining in all the districts surveyed. Farmers are of the view that this was due to the<br />
55
Support to the National Water Mission NAPCC<br />
Appendix 3 <strong>Kshipra</strong> <strong>Sub</strong> <strong>Basin</strong><br />
increased temperature causing more evaporation. It is reported that there is less rainfall in the recent<br />
years except for some villages in Indore. Stakeholders mostly believe that climate change will have<br />
perceptible impact on their livelihood through its effect on agricultural production, human health and<br />
livestock population. The main areas of vulnerability of climate change is seen to be the agricultural<br />
sector and drinking water.<br />
1. Perceived Water Management Issues and Possible Solutions<br />
100. Communities identified a wide number of possible mechanisms to enhance future resilience and<br />
reduce future vulnerabilities, these include:<br />
o Enhanced access to drinking and irrigation water was considered of the highest priority;<br />
drinking water access was first priority by women groups.<br />
o Tank irrigation was seen to be very important. There is widespread support for the<br />
enhancement of the depth of the irrigation tanks (talav) and construction of new tanks. Poor<br />
maintenance of tanks is an issue, tanks are supposed to be taken care of by the government.<br />
There is no water users‘ association (WUA) for the tank command area in surveyed villages.<br />
<strong>Sub</strong>sidies for micro tank irrigation are already exist. Desilting of rivers and tanks is considered<br />
important; silt material can be used for road construction.<br />
o The river linking process may be explored more. Some people have argued that <strong>Kshipra</strong><br />
should be linked with Narmada and Khan rivers.<br />
o Drip irrigation should be supported by creating more awareness amongst cultivators; the<br />
subsidy for micro irrigation is important; the present subsidy mechanisms limit this to some<br />
farmers only. The level of awareness of the farmers is very low about the new technologies,<br />
and the slow take up is reported to be due to the lack of awareness. In Dewas, some farmers<br />
have expressed doubt about the use of sprinkler for agriculture. In general most of the farmers<br />
have supported the use of new technologies. Some big farmers have adopted sprinkler<br />
irrigation in their own initiative, but the technology needs to be improved for greater use in the<br />
agricultural fields. There is a need for improved training and subsidy on sprinkler an drip<br />
irrigation. Farmers showed some support for pipe irrigation for surface water, two problems<br />
are: (i) the cost of irrigation pipe is very high and (ii) the river dries up in the rabi season.<br />
o It was considered that recharging of groundwater for each farmer should be made compulsory<br />
for the farmers, roof top rain water harvesting should be made compulsory. Farmers are very<br />
supportive of artificial recharge, if the subsidy is provided,<br />
o More plantation of trees which will not only improve the soil conservation, but also increase<br />
recharge potential. There is huge scope of improving water position through National Rural<br />
Employment Guarantee Act (NREGA). It is not working at all in the village because of some<br />
lapses in the policy. There is much delay in the payment. The NREGA policy of not using of<br />
machineery is causing strain to the labourers for digging because of the hard rock of the<br />
region. In Dewas, villagers have supported check dams on river <strong>Kshipra</strong> and Tillar.<br />
o Water quality; water should be treated properly before it is being released into the river.<br />
o Lack of dependable electric power is seen as a major issue in all the districts. People get<br />
generally get 5-6 hours of intermittent electricity in a day. Farmers are of the view that charges<br />
for electricity are already very high. <strong>Sub</strong>sidy on electricity is not an issue rather farmers are<br />
interested in subsidy on other inputs which is leading to cost escalation and interested in<br />
direct subsidy coming to farmers.<br />
o Support Price: there is a confusion among farmers that there is no support price for soyabean,<br />
which is the major Kharif crop in all the districts. Even though there is support price for wheat,<br />
farmers are compelled to sell it to the private traders in the market because of the delayed<br />
payments from Government. The farmers want support price for vegetables.<br />
o Regulations on groundwater: there is still no regulation for groundwater use. Farmers have a<br />
mixed feeling in this issue. Some farmers feel that even without regulation they will use that<br />
much of water, which is needed. Others feel that regulation is needed to restrict<br />
overexploitation.<br />
o Agriculture: Farmers are supportive of short duration crops if the yield is some, not all farmers<br />
are using short duration crops because of the non accessibility. Farmers have a mixed feeling<br />
of these short duration and high yield crops because high value cash crops with requirement<br />
of more water, which is not feasible in the region. Farmers, in fact have abandoned the<br />
sugarcane cultivation and cotton cultivation for this reason. Because of the topography of the<br />
regions, farmers argue that there is no necessity of laser levelling.<br />
56
Support to the National Water Mission NAPCC<br />
Appendix 3 <strong>Kshipra</strong> <strong>Sub</strong> <strong>Basin</strong><br />
o Artificial recharge points in river: The farmers nearer the river are very supportive of this. Any<br />
enhancement of water efficiency will be taken back by activity rise. If more water becomes<br />
available 25% of the non cultivable months will become come under cultivation. Government<br />
regulation on bore holes number/water withdrawal pattern.<br />
o Equitability in access to water; equitability in the distribution of water is not regarded as a<br />
major issue.<br />
o Water associations are almost non existent.<br />
o Rapid land use change is changing the groundwater hydrology.<br />
o Conjunctive management of surface and groundwater is seen as important.<br />
o It was considered that there is no single solution but portfolio of solutions needed; conjunctive<br />
use with more groundwater recharge farm ponds, re-excavation of govt ponds to enhance<br />
water flow, dams on nallas are all seen as important.<br />
o More technical assessment needed to understand feasibility of various options including the<br />
use of tanks for irrigation and groundwater recharge. Feasibility study for recharge technique<br />
scientific means should be used to better understand the groundwater potential is considered<br />
important.<br />
o Enhance non farm income sources was seen as an important need.<br />
C. Surface Water Resources<br />
101. In the <strong>Kshipra</strong> sub-basin main source of irrigation and drinking water in through groundwater<br />
resources; surface water from canals and tanks is less than 3% with the exception of Indore as<br />
indicate in Table 30 14 below:<br />
Table 30: Net Area Irrigated from Different Sources (ha)<br />
District Name Canals Tank Tube wells + Other<br />
Total<br />
Area (ha)<br />
other wells sources<br />
Dewas 2,360 944 123,955 11,044 138,303<br />
Indore 12,591 528 71,492 9,111 93,722<br />
Ujjain 716 3,229 123,241 16,711 143,897<br />
Total 15,667 4,701 318,688 36,866 375,922<br />
Percent of Total<br />
Dewas 2 1 90 8 100<br />
Indore 13 1 76 10 100<br />
Ujjain 0 2 86 12 100<br />
Total 4 1 85 10 100<br />
102. Farmers are growing two crops. The main crops are wheat, soybean, sugar cane, vegetables,<br />
gram and groundnuts, mostly irrigating from tube wells and other wells..<br />
103. There is no major surface water resources project in the <strong>Kshipra</strong> basin. The river <strong>Kshipra</strong> flows<br />
in the monsoon season only, with no post monsoon flow in the river. Madhya Pradesh has constructed<br />
some check dam in Chambal river for water conservation but the same is objected by Government of<br />
Rajasthan as the inflow into Gandhi-Sager dam are likely to reduce due to upstream utilization through<br />
check dams.<br />
1. Proposed Surface Water Schemes<br />
104. A number of surface water schemes are presently under consideration and are relevant to the<br />
current study. Surface water development must be referred to the interstate board. The inter-state<br />
Board-―Chambal Board is functioning for inter-state co-operation for Chambal water between<br />
Rajasthan and Madhya Pradesh. There is also a Chambal agreement between the two states for<br />
sharing of Chambal waters. Three dams and a barrage have been constructed on the main Chambal<br />
River downstream of the confluence of <strong>Kshipra</strong> with Chambal. The agreement provides for equal<br />
14 Ministry of Agriculture GOI<br />
57
Support to the National Water Mission NAPCC<br />
Appendix 3 <strong>Kshipra</strong> <strong>Sub</strong> <strong>Basin</strong><br />
division of irrigation and power benefits. Due to downstream water utilization any water resources<br />
project in the tributaries in Malwa region needs agreement between the two states through the<br />
Chambal Board<br />
105. Kalisindh Chambal Link Project; this project is a river interlinking project namely- ‗Kalisindh<br />
Chambal link project‘ is under study by NWDA (The National Water <strong>Development</strong> Agency) for which a<br />
feasibility report was also prepared in 1991 by NWDA. The project envisages diversion of 820MCM of<br />
water from Kalisindh to river Chambal at Rana Pratap Sager dam or at Gandhi Sager dam. The water<br />
was proposed to be utilized at Kota Barrage and water of Chambal thus saved was proposed to be<br />
utilized for the irrigation in the Malwa region in Chambal in Ujjain district in <strong>Kshipra</strong> basin. However,<br />
this project is not in progress due to failure to reach any agreement between Rajasthan and Madhya<br />
Pradesh on sharing of water and other issues. Location of seven dams identified by NWDA in the<br />
<strong>Kshipra</strong> and adjoining basin are shown in Table 31.<br />
Name Of Project<br />
Table 31: Proposed Dams in <strong>Kshipra</strong><br />
District Tehsil<br />
Sonechiri Ujjain Khachrod<br />
Ramwasa Ujjain Ujjaina<br />
Bachora Indore Depalpur<br />
Padunia Dhar Badnawar<br />
Sewarbheri Ujjain Ujjain<br />
Sebri Sultanpura Ujjain Barnaga<br />
Chitabal Ujjain Mahidpur<br />
106. Narmada Irrigation Transfer Project: There is also a proposed transfer of Narmada water to<br />
<strong>Kshipra</strong> basin through river linking project, but no proposal for the same has formally been developed.<br />
With about 300metre of lift head it is not generally considered a viable option.<br />
107. Narmada Water Supply Transfer Project: There is also another project under survey and<br />
investigation for transfer of Narmada water for drinking water supply to Indore, Ujjain, and Dewas to<br />
Malwa plateau namely ‘Integrated Water Supply Project for Villages and Towns of Dewas, Ujjain and<br />
Shajapur District of Madhya Pradesh’ at an estimated cost of Rs.2988 crore ( $664 million). The<br />
project report is likely to be completed in about one year's time. This project would be complementary<br />
to the completed water supply systems 15 supplying Indore and Dewas, which are presently sourcing<br />
and lifting Narmada water.<br />
108. Sewarkhedi Project: Located on the <strong>Kshipra</strong> 22km south of Ujjain this project involves<br />
construction of a 2000m wide 17 high storage dam with estimated live storage of 157 MCM. The dam<br />
would provide supplementary water to Ujjain as well as irrigation of about 25000ha. Only very<br />
preliminary studies completed by the Ujjain water resources division.<br />
109. Khan Reservoir Project: Located on the river Khan with estimated live storage of 85 MCM<br />
would provide water for irrigation, industrial and support flushing flow of pollutants in the heavily<br />
polluted and non perennial river Khan. The identified irrigation area is 18000ha, the command area is<br />
largely the same as the Sewarkhedi project.<br />
110. Chambal-Gambhir Link: A link canal from the Chambal river to be provided by a new diversion<br />
barrage on the Chambil at Kapileshwa that would provide supplementary water for water supplies at<br />
Ujjain. The diversion would support the filling of the existing Gambhir Dam, which is yielding<br />
insufficient runoff as well as some loss of yield due to the upstream Yashwant Sagar Dam in Indore<br />
district.<br />
111. The gestation time of surface water projects tends to be long. It is considered important to<br />
directly address the issues of groundwater especially in the immediate term. The average annual<br />
15 The second stage supply for Indore being funded through ADB is presently being commissioned.<br />
58
Support to the National Water Mission NAPCC<br />
Appendix 3 <strong>Kshipra</strong> <strong>Sub</strong> <strong>Basin</strong><br />
rainfall is 939mm in Indore, 1083mm in Dewas and 916mm in Ujjain (CGWB 2009), 91% of this rainfall<br />
occurs during the four monsoon month from June to September only. The water requirement for most<br />
of the Rabi and Kharif crops in the region is 300mm to 500mm. From this, it would appear that<br />
conjunctive use of rainfall and recharge to groundwater would be able to sustain two crops from the<br />
average annual rainfall. Average water requirement for the major crop grown in Chambal basin is<br />
shown in Table 32.<br />
Table 32: Crop Water Needs<br />
Crop<br />
Kharif<br />
Crop<br />
(mm)<br />
Water Requirement Watering regime<br />
Ground nut 400 to 450 (Paleo watering required)<br />
Urd, Moong, Arher 300 (One or Two watering)<br />
Mustard 400 to 450<br />
Oil seeds<br />
Rabi<br />
150 to 200<br />
Wheat 380 to 400 (3 irrigation watering)<br />
Gram 300 (One or Two watering)<br />
Potato 500 to 600 (frequent watering)<br />
D. Agriculture Options to Reduce Water Demand<br />
112. Major constrains for agriculture activities include: hot summer months, low humidity, high<br />
evapotranspiration and meagre rainfall during winters and summer months. Irrigation watering is<br />
provided mostly through tubewells. Stage of groundwater development is 104% in Indore, 64% in<br />
Dewas and 109% in Ujjain. Decline of groundwater table is becoming a problem in the area. Shortage<br />
of drinking water is reported in many areas in the basin. The key requirements for water management<br />
in the sub- basin to meet these needs includes: (i) conservation of water; (ii) recharge of groundwater<br />
and (iii) efficient use of irrigation water. Discussion with farmers 16 revealed that they are partially<br />
aware of water conservation techniques and the linkages sustainability but less aware of the details<br />
and the opportunities of new ideas.<br />
1. Crops<br />
113. There are various cropping options to reduce water demand; these include a move to high yield<br />
shorter duration crops as well adjustments to the planting calendar to optimise the use of the rainfall.<br />
With the present fixed electricity rates for pumping, there is no real incentive to economise on pump<br />
use. The PRA conducted for the study identified some reluctance to change to short term high yield<br />
crops due to uncertainties in the irrigation supplies-for the groundwater erratic power was quoted as<br />
an issue.<br />
114. Delayed monsoon planting offers opportunities to better use the effective rainfall and<br />
consumptive use. From an analysis of the effective rainfall and potential evapotranspiration shown in<br />
the sub-basin profile shows the very large additional water consumption if farmers plant before June<br />
as shown in Figure 39. The net of saving in demand between planting in June as opposed to May<br />
would be about 200mm.<br />
16 NAPPC S-NWM Participatory Rural Appraisal 2011<br />
59
Support to the National Water Mission NAPCC<br />
Appendix 3 <strong>Kshipra</strong> <strong>Sub</strong> <strong>Basin</strong><br />
Figure 39: Indore Potential Evapotranspiration and Effective Rainfall<br />
2. Water Conservation Tank Programmes<br />
115. There are several schemes under which subsidy are provided by the government to the farmers<br />
for construction of ponds in their fields‘ like Khet Talab Yojna, construction of small tank under Micro-<br />
Minor irrigation, Balram Talab Yojna. The water conserved in the ponds provides irrigation to the farm<br />
lands and effective groundwater recharge has also been observed. The objective of this scheme is to<br />
conserve rainwater in the field for irrigation. For digging ponds under Balram Tal Yojana, every<br />
beneficiary is given 25% subsidy, the upper limit of which is Rs 50,000. The benefit of the scheme is<br />
given to the applicants registered after May 25, 2007. The tanks are becoming more popular. There is,<br />
however, some reservation from smaller farmers who have to allocate scare land for the tanks. The<br />
tanks are most effective on the areas of black cotton soils.<br />
116. Balram Talabs are larger water tanks, which can irrigate up to 50 hectare area, the uptake has<br />
been good with a reported 7500 tanks constructed to date. Mulching of crop fields is also becoming<br />
popular, which helps in soil moisture conservation and high reduction of water demand by the crops.<br />
3. Micro Irrigation<br />
117. Micro- irrigation schemes are also becoming popular in the basin. A field study by India Institute<br />
of Management (IIM), Indore on ‗Impact Assessment of Micro Irrigation schemes in Madhya Pradesh‘<br />
reveals that financial benefits of micro irrigation scheme to the farmers outweigh the cost involved in<br />
addition to big water savings. The programme started in 2008 with a 40% subsidy from central<br />
government and initially progress was slow. The state has added a 30% subsidy for general farmers<br />
and 40% subsidy for small farmers and since then the uptake has increased. The promotion of the drip<br />
is being supported by the private sector suppliers; farmers are allowed to select from a list of fifty five<br />
suppliers. A precision farming development centre has recently been established in Bhopal. The<br />
farmers are using the drip to grow a wide range of crops including crops not normally considered so<br />
suitable with drip. It is reported that there is no real evidence that farmers are switching their cropping.<br />
The growth of sprinkler has exceeded drip but this is thought to be the cheaper cost of sprinkler over<br />
drip; however, from studies the productivity of the drip is higher than the sprinkler.<br />
118. The major benefits include:<br />
o Water usage improved by more than 2.5 times. Water saving of about 50% observed in many<br />
cases.<br />
o Increase in the revenue from agriculture, about 20% reduction in labour cost.<br />
o 30% to 50% reduction in fertilizer and pesticide usages.<br />
o About 20% saving in power bills.<br />
o 2-3 times increases in crop yield for many crops.<br />
60
Support to the National Water Mission NAPCC<br />
Appendix 3 <strong>Kshipra</strong> <strong>Sub</strong> <strong>Basin</strong><br />
o Drastic reduction in weed problems.<br />
o Significant improvement in quality of produce.<br />
However, IIM Indore study also reveals that spread of micro irrigation in the Ujjain, Dewas and Indore<br />
district (<strong>Kshipra</strong> sub-basin) is quite low as compared to the adjoining districts in the state. Growth of<br />
micro irrigation is limited because of several constrains including:<br />
o Although Government support in around 70% and farmers share about 30% general farmers<br />
and 40% small farmers but the farmers are spending more. Poor farmers are not able to adopt<br />
the scheme due to higher investment and risk involved. Limited credit support from banks and<br />
high interest rate of private loans and lack of insurance support.<br />
o Uncertainty of power supply.<br />
o Lack of awareness among all categories of farmers on crops selection and benefits of MIS.<br />
o Lack of assured market for produce and no MSP for crops appropriate for MIS.<br />
o Long processing time and delays in approval for MIS grants.<br />
4. Water Saving Benefits of Micro Irrigation.<br />
119. Both drip and sprinkler demonstrate water savings over flood irrigation. Indicative savings put<br />
drip as the most efficient and sprinkler slightly lower. The main loss in sprinkler is evaporation loss;<br />
when considering conjunctive efficiency of surface and groundwater evaporation is effectively a total<br />
loss; infiltration losses on the other support groundwater recharge.<br />
120. Furrow irrigation using gated pipe is slightly less efficient than both sprinkler and drip but is<br />
significantly cheaper (about 50% of sprinkler and 20% of drip capital costs) and works at low pumping<br />
Figure 40 : Gated Pipe and Furrow<br />
Irrigation<br />
heads. Gated pipe and furrow is a potential system<br />
probably appropriate for Madhya Pradesh but not<br />
currently considered; it is less sophisticated than drip.<br />
The losses from furrow irrigation using gated pipe are<br />
largely infiltration losses which in terms of conjunctive<br />
efficiency of the surface and groundwater are not<br />
effectively lost to the overall system. Gated pipe and<br />
furrow irrigation are suitable for surface and<br />
groundwater; efficiencies can be improved by<br />
incorporating surge irrigation 17 , the use of gated pipe to<br />
grow cotton is shown in Figure 40. The use of furrows<br />
has lower evaporative losses than basin irrigation. It is<br />
recommended that economic studies are carried out to<br />
assess the relative merits of different irrigation systems.<br />
An advantage of the gated pipe and furrow irrigation is<br />
that it could be used both for tubewells, farm ponds and<br />
canals which would not be possible for drip or sprinkler<br />
systems due to suspended solids.<br />
121. In groundwater or combined surface and<br />
groundwater systems, it is very important to incorporate the 'conjunctive surface and groundwater'<br />
efficiency into the assessment.<br />
17 Surge is achieved by fully opening the small sliding gate to initially fill the furrow , the gate is partially closed<br />
when the initial furrow filling is completed. Surging can also be achieved by surge valves.<br />
61
Support to the National Water Mission NAPCC<br />
Appendix 3 <strong>Kshipra</strong> <strong>Sub</strong> <strong>Basin</strong><br />
E. Groundwater<br />
1. Issues and Assessment of Sustainability Present and Future<br />
122. The major issue in the basin is diminishing surface and groundwater resources. The net annual<br />
groundwater draft for drinking and irrigated agriculture exceeds the annual recharging availability. The<br />
tributary streams of <strong>Kshipra</strong> are variously polluted with untreated urban and industrial wastewaters.<br />
Nitrate and fluoride was elevated in some groundwater areas. The <strong>Kshipra</strong> river has become<br />
ephemeral and runs dry for periods of the year. This paucity of water limits other beneficial uses<br />
including dilution of wastewater discharges, environmental flows and surface water abstractions.<br />
123. The basin districts of Dewas, Indore and Ujjain are under significant stress due to expanding<br />
groundwater extractions and strong dependence on stakeholders on use of groundwater resources. In<br />
Dewas district, Dewas block, which is located in the headwaters of the <strong>Kshipra</strong> river, is reported as<br />
having a Groundwater <strong>Development</strong> Stage (GDS) of 96% (CGWB-NR, 2007) 18 . In Indore District,<br />
Indore block, Sanwer block and Depalpur, which all cover part of the <strong>Kshipra</strong> sub-basin are reported<br />
as having a GDS of 137%, 133% and 94% respectively (CGWB-NR 2009) 19 . Ujjain district has an<br />
overall GDS of 109%, with Ujjain block, through which the <strong>Kshipra</strong> river flows, having a GDS of 144%<br />
(CGWB-NR, 2008) 20 . Nitrate was reported at elevated levels (>45mg/l) in all three districts and for<br />
Dewas district, fluoride was reported at elevated levels (>1.5mg/l) in Dewas, Sonkatch and Tonk<br />
Khurd blocks.<br />
124. Groundwater in the <strong>Kshipra</strong> basin is derived from weathered Deccan Trap basalts and while its<br />
characteristics are variable typically they have relatively low storage, which has impacts for<br />
sustainable groundwater management and artificial recharge opportunities. Figure 41 below provides<br />
cross-sections of groundwater occurrence in the Deccan trap basalt terrain indicating varying resource<br />
potential and management implications (World <strong>Bank</strong>, 2010) 21 .<br />
2. Framework Strategy for IWRM at <strong>Basin</strong> Level<br />
125. Groundwater is a key element for the integrated water resources management (IWRM) in<br />
Madhya Pradesh and the <strong>Kshipra</strong> sub-basin. The aquifers of the <strong>Kshipra</strong> sub-basin are however in a<br />
highly stressed condition. For the continued and sustainable use of this precious resource a<br />
combination of supply and demand measures will be required within an overall context of better<br />
conjunctive use of surface and groundwater.<br />
126. IWRM is an approach that promotes the coordinated development and management of water,<br />
land, and related resources, in order to maximize the resultant economic and social welfare in an<br />
equitable manner without compromising the sustainability of vital ecosystems. This includes more<br />
coordinated development and management of: land and water; surface water and groundwater; the<br />
river basin and its adjacent coastal and marine environment; upstream and downstream interests as<br />
well as managing physical resources. IWRM is also about reforming human systems to enable people,<br />
both men and women to benefit from those resources.<br />
3. The Enabling Environment<br />
127. Efforts have been made by GoMP to effect change on the demand and supply side concerning<br />
groundwater. For example, on the demand side efforts have been made to promote Micro Irrigation<br />
Systems (MIS), with associated water savings of over 50% per unit area; a recent study indicated that<br />
the districts of Dewas, Indore and Ujjain had 172, 1904 and 462 hectares respectively under MIS by<br />
2009-10. Similarly on the supply side the districts of Dewas and Indore have completed a number of<br />
projects on artificial recharge and rain water harvesting.<br />
18 CGWB Northern Central Region (2007) Dewas District groundwater information booklet, Bhopal.<br />
19 CGWB Northern Central Region (2009) Indore District groundwater information booklet, Bhopal.<br />
20 CGWB Northern Central Region (2008) Ujjain District groundwater information booklet, Bhopal.<br />
21 World <strong>Bank</strong> (2010) Deep Wells and Prudence: Towards Pragmatic Action for Addressing Groundwater Overexploitation in<br />
India. World <strong>Bank</strong>, Washington.<br />
62
Support to the National Water Mission NAPCC<br />
Appendix 3 <strong>Kshipra</strong> <strong>Sub</strong> <strong>Basin</strong><br />
Figure 41: Cross Section of the Aquifer<br />
128. In Indore District, the CGWA has notified Sanwer block and Indore Municipal Corporation due to<br />
overexploitation of groundwater. In Ujjain district the CGWA has notified Ujjain, Ghatia and Badnagar<br />
blocks due to over-exploitation of groundwater. A lot more is however, needed to arrest the overexploitation<br />
of groundwater and to facilitate a move away from groundwater mining to a more<br />
sustainable use of this resource within a wider integrated water resources management approach.<br />
Areas that need further policy approaches include:<br />
(i) Establishment of a clear logical framework for the management of water resources, such as<br />
catchments and aquifers. Whilst the current practice of using administrative units (e.g. districts<br />
and blocks) is practical, it ignores flows between these units either through natural topographic<br />
gradients in the case of surface water or regional aquifer flows in the case of groundwater.<br />
(ii) The subsidized nature of electricity provision to farmers, thereby facilitating lifting groundwater<br />
at ever increasing depths. This is a sensitive topic, however until the true cost of groundwater<br />
abstraction (energy costs, equipment and externalities such as impacts on downstream users)<br />
is factored into an overall resource management equation this element of supply will continue<br />
in an uncontrolled manner. Farmers report problems of erratic power which causes difficulties<br />
in irrigation at the correct times to meet crop needs. Farmers tend to irrigate when power is<br />
available rather than according to proper scheduling. There would appear to be scope to link<br />
improved power supplies with some measures to conserve water.<br />
(iii) Strategies need to be developed to determine effective water allocation mechanisms including<br />
decision support systems to prioritize water needs. Water allocation approaches will need to<br />
adopt the principle of conjunctive use of surface water and groundwater at its core so that all<br />
water is managed as one resource. Conjunctive use, if implemented judiciously can help<br />
maximize the available renewable resource through the storage of excess water in aquifers<br />
during times of surplus and the use of this stored water to augment surface water flows for<br />
irrigation, environmental flows and other beneficial uses during times of water deficit.<br />
63
Support to the National Water Mission NAPCC<br />
Appendix 3 <strong>Kshipra</strong> <strong>Sub</strong> <strong>Basin</strong><br />
4. Institutional roles<br />
129. The institutional framework includes government institutions, local authorities, private sector,<br />
civil society organizations, farmers‘ organizations and other community-based organizations. Capacity<br />
building will be needed at each of these levels either through the development of existing water<br />
management arrangements or by forming new ones. Some particular issues requiring capacity<br />
building within this institutional framework include the following:<br />
(i) As identified above there is a need to link the current approach to groundwater resource<br />
assessment with more hydrogeologically sound approaches. A way forward could be to<br />
maintain the current practice of collecting water resources data at the smallest administrative<br />
units (e.g. block) but when aggregating these data use hydrological based divides<br />
(topographic divides and hydrogeologically connected aquifers units). A precursor to this<br />
approach would be an improved understanding of the hydrogeological system particularly<br />
concerning regional aquifer flows for shallow and deep aquifers and on the nature of<br />
groundwater-surface water interactions. This approach would also require relevant staff at<br />
district level to work together to develop these aggregated datasets supported by a wider state<br />
body or in the case of interstate water resources a central government agency.<br />
(ii) Different methodologies for quantifying groundwater recharge should be trialed in pilot areas<br />
to confirm and improve the current methodology for groundwater resource assessment (Water<br />
Level Fluctuation method). These improved methodologies could subsequently be applied to<br />
the new hydrogeologically sound areas of assessment discussed in the previous bullet. This<br />
catchment based assessment would help overcome the issue of unknown specific yield in the<br />
WLF method. Marechal et al. (2006) 22 provide such an approach for a fractured hard-rock<br />
aquifer in Andra Pradesh. Rangarajan and Athavale (2000) 23 estimate a mean annual natural<br />
recharge of 71mm for a Deccan Traps aquifer in Shahdol district in Madhya Pradesh using the<br />
injected tritium method.<br />
(iii) There is a need to separate water resources management functions (overall management of<br />
water resources as a whole) from service delivery functions (irrigation, hydropower, water<br />
supply and sewerage) to avoid conflicts of interest and encourage commercial autonomy.<br />
Capacity building will be needed to support effective water resources planning of surface<br />
water and groundwater. Such an arrangement is being proposed for Maharashtra 24 State,<br />
which is dominated by Deccan Trap aquifers.<br />
(iv) Effective and early public participation approaches will be required particularly with farmers‘<br />
organizations to ensure that they are involved in the planning and decision-making processes.<br />
Capacity building of WUAs and Panchayats will be particularly important to ensure take-up of<br />
new approaches to groundwater use and aquifer management.<br />
5. Management Instruments<br />
130. The major issue in the basin is diminishing surface and groundwater resources. The net annual<br />
groundwater draft for drinking and irrigated agriculture exceeds the annual recharging availability.<br />
Nitrate and fluoride was elevated in some groundwater areas. There are a number of remedial<br />
measures that are required to arrest the key issues of: (i) current over-exploitation of groundwater<br />
reserves in the <strong>Kshipra</strong> sub-basin; (ii) options for artificial recharge and increasing base flows in the<br />
<strong>Kshipra</strong> rivers and (iii) the issue of some naturally occurring hazards and other contaminants in<br />
localized areas. The management instruments needed to address these issues is outlined below.<br />
131. To address the over-exploitation of groundwater reserves both the supply and demand<br />
approaches need to be addressed. In supply terms this includes developing ways to enhance<br />
recharge to aquifers so that depleted aquifer storage can be replenished (through artificial recharge),<br />
or on the demand side through irrigation methods that result in groundwater resource savings or<br />
changes in cropping patterns, which are discussed below.<br />
22 Marechal, J.C. et al. (2006) Combined estimation of specific yield and natural recharge in a semi-arid<br />
groundwater basin with irrigated agriculture. Journal of Hydrology, 329, 281-293.<br />
23 Rangarajan, R. and Athavale, R.N. (2000) Annual replenishable groundwater potential of India—an estimate<br />
based on injected tritium studies. Journal of Hydrology, 234:38–53.<br />
24 Foster, S. et al. (2007) Confronting the Groundwater Management Challenge in the Deccan Traps Country of<br />
Maharashtra - India . GW-MATE Case Profile Collection Number 18. World <strong>Bank</strong>.<br />
64
Support to the National Water Mission NAPCC<br />
Appendix 3 <strong>Kshipra</strong> <strong>Sub</strong> <strong>Basin</strong><br />
6. Options for Irrigation<br />
132. Concerning irrigation and groundwater resources 25 it is necessary to identify the main fractions<br />
of water when it reaches a permeable soil. One of the potential consequences of improved irrigation<br />
water-use efficiency is further deterioration of groundwater resources due to shifting to spray irrigation<br />
from flood irrigation resulting in loss of return flows to aquifers. The water and energy saved is often<br />
used to extend the irrigation command area resulting in further loss of return flow to groundwater. A<br />
schematic of the utilisation and fate of water applied to permeable soil and their relationships with<br />
groundwater resources and irrigation management is shown in Figure 42.<br />
Figure 42: Linkage of Surface and Groundwater Resources<br />
133. In irrigated systems, the only real savings to groundwater can be achieved where modifications<br />
to irrigations and cropping-practices reduce the 'non-beneficial evapotranspiration'. If more water<br />
savings are needed, than consideration should be given to explore options for switching to cultivation<br />
of less water-consuming crops or crop-strains (with shorter growing season, or suited to cooler periods<br />
when potential evaporation and transpiration are lower). In some areas, it may be appropriate to<br />
restrict cultivation of certain types of irrigated crops in the critical groundwater areas. Dewandel et al.<br />
(2010) 26 modelled the impact on changes in cropping patterns (switch from rice to vegetables) in a<br />
hard rock aquifer system in a watershed in Andhra Pradesh and reported significant recoveries of<br />
water tables.<br />
7. Options for Artificial Recharge to Groundwater<br />
134. Artificial recharge (AR) systems are engineered systems where surface water is put on or in<br />
the ground for infiltration and subsequent movement to aquifers to augment groundwater resources.<br />
AR requires permeable surface soils to infiltrate to the aquifers. Where this is not available trenches or<br />
shafts in the unsaturated zone can be used. To design a system for artificial recharge of groundwater,<br />
infiltration rates of the soil must be determined and the unsaturated zone between land surface and<br />
the aquifer must be checked for adequate permeability and absence of polluted areas. The aquifer<br />
should be sufficiently transmissive to avoid excessive build up of groundwater mounds. Knowledge of<br />
these conditions requires field investigations and, if no fatal flaws are detected, test basins to predict<br />
system performance (Bouwer, 2002) 27 .<br />
135. Some water conservation and artificial recharge projects have been undertaken in the broader<br />
Chambal basin in Dewas and Indore districts (CGWB North Central Region, 2007 and 2009). In<br />
25 Foster, S. and Perry, C. (2010) Improving groundwater resource accounting in irrigated areas: a prerequisite<br />
for promoting sustainable use. Hydrogeological Journal, 18:291-294.<br />
26 Dewandel et al. (2010) <strong>Development</strong> of a tool for managing groundwater resources in semi-arid hard rock<br />
regions: application to a rural watershed in South India. Hydrol. Processes, 24, 2784–2797.<br />
27 Bouwer, H. (2002) Artificial recharge of groundwater: hydrogeology and engineering. Hydrogeology Journal,<br />
10:121-142.<br />
65
Support to the National Water Mission NAPCC<br />
Appendix 3 <strong>Kshipra</strong> <strong>Sub</strong> <strong>Basin</strong><br />
Indore, a roof top rain water harvesting project was completed in Phed colony in Musakhedi involving<br />
a total roof area of 2710sq metre through which water was channelled to troughs into collection<br />
chambers with filters before being recharged. After this project a rise in water level of 4-5m was<br />
recorded in a monitoring well after the monsoon.<br />
136. In Dewas district, five water conservation and artificial recharge projects have been completed.<br />
In Londri river (bordering <strong>Kshipra</strong> basin watershed boundary to the south), a series of control<br />
structures (gabion, boulder check dam, stop dam and sub-surface dyke) across the river, resulting in<br />
water level rises of 0.3 to 2m. It is reported that dug wells that were drying up in January now hold<br />
water until April. Such an approach may be possible in the headwaters of <strong>Kshipra</strong> river, but<br />
investigations would be needed to evaluate the degree of hydraulic connectivity between groundwater<br />
and the river system. In Dewas city, some 1000 houses with existing boreholes were retro fitted for<br />
roof top harvesting. In 2001 it was estimated that this resulted in recharge of 50,000 cubic metres in<br />
an area of 1km 2 . In Tonk Khurd and Dewas blocks a series of recharge shafts were dug in existing<br />
tanks to break through an impermeable layer to ensure hydraulic connectivity with groundwater table.<br />
Two further recharge projects were carried out in district hospital Dewas city and Dewas <strong>Bank</strong> Note<br />
Press.<br />
137. The Central Groundwater Board (CGWB) Groundwater Recharge Master Plan follows two<br />
criteria for identifying recharge: availability of surplus water and availability of storage space in<br />
aquifers. The investments in the program would therefore be driven by the potential available for<br />
groundwater recharge, and not by the need for recharge. Therefore there are some concerns<br />
nationally about whether the implementation of this plan will benefit the most water stressed areas.<br />
Indications are also that AR may not be suited to all hydrogeologically situations and may prove quite<br />
costly. Therefore, AR will be part of the overall solution in certain circumstances but should not be<br />
seen as the panacea for over-exploitation or a justification for not tackling the demand related issues.<br />
138. It is estimated that an area of 448,760 km 2 — about 14% of total land area of India — is suitable<br />
for managed aquifer recharge and that a volume of the order of 36,400 MCM is available for recharge<br />
annually. This is equivalent to an average of 80 mm over the entire area and the volume equates to<br />
about 18% of the 200,000 MCM of groundwater that is currently utilised annually for irrigation.<br />
However, the estimates of recharge sites in a DFID/BGS study (2006) 28 (that are not limited by<br />
storage in the aquifer), were found to be about one order of magnitude lower (4 mm to 10 mm) than<br />
the CGWB estimates and to represent only about 1% of rainfall.<br />
139. The CGWB Master Plan for groundwater recharge has estimated that 14MCM and 32 MCM<br />
could be recharged in the <strong>Kshipra</strong> and Ghambhir basins (4751km 2 based on <strong>Kshipra</strong> Area Water<br />
Partnership, 2002 29 ) respectively through a variety gully plugs, gabion structures, contour bunds in the<br />
upper reaches of the watersheds, percolation tanks, nala bunds in the runoff zones and recharge<br />
shafts, gravity head wells in downstream areas. This equates to a depth of recharge of approximately<br />
10mm across the 4751km 2 ([0.04628 cubic kilometers/4751km 2 ]*1,000,000 = 10mm). This annual<br />
artificial recharge must be put against water table fall rates of upto 0-2 metres per decade (1997-2008)<br />
for Dewas and Ujjain and 2-4 metres per decade (1997-2008) for Indore (CGWB North Central<br />
Region, 2009 30 ). The cost and benefits accrued through this artificial recharge approach will need to<br />
be weighed against groundwater resource savings that could be achieved through other means such<br />
as demand related savings .<br />
8. Options for Geochemical Hazards<br />
140. Groundwater quality issues in the <strong>Kshipra</strong> basin include nitrates (>45mg/l) from suspected<br />
agricultural sources for Dewas, Indore and Ujjain districts and fluoride (>1.5mg/l) in Dewas for blocks<br />
Dewas, Sonkatch and Tonk Khurd. Table: 33 provides an overall strategy in short and long term<br />
horizons to tackle the issue of naturally occurring trace elements in the groundwater. Anthropogenic<br />
28 Calow, R C , Neumann , I, Moench, M, Kulkarni , H, Mudrakartha, S and Palanis ami , K. (2006) Managed<br />
Aquifer Recharge: an assessment of its role and effectiveness in watershed management. British Geological<br />
Survey Commissioned Report, CR/06/107N. 80pp.<br />
29 <strong>Kshipra</strong> Area Water Partnership (2002) Water for the 21 st Century, Vision for Action, <strong>Kshipra</strong> River <strong>Basin</strong> Global<br />
Water Partnership.<br />
30 CGWB North Central Region (2009) Groundwater year book (2008-2009) Madhya Pradesh, Bhopal.<br />
66
Support to the National Water Mission NAPCC<br />
Appendix 3 <strong>Kshipra</strong> <strong>Sub</strong> <strong>Basin</strong><br />
derived contaminants such as nitrate should be targeted to reduce or eliminate their production at<br />
source. Key issues in the definition of an integrated strategy for mitigation of a naturally-occurring<br />
trace element problem in groundwater 31 is shown in Table: 33 below:<br />
Table: 33 Key Issues<br />
ACTION ISSUES TO BE RESOLVED<br />
SHORT TERM<br />
Evaluation of Problem<br />
Water Supply Management<br />
• appropriate scale (local/provincial/national) for groundwater quality<br />
survey<br />
• selection of appropriate analytical technique(s) (field kit/lab<br />
method)<br />
• government initiative versus private responsibility<br />
• availability of specialist advice for hydrogeochemical interpretation<br />
• assessment of other potential groundwater quality problems<br />
• advice on well use (community information/well closure or labelling)<br />
• practical and social considerations on well switching<br />
• prioritization of field analytical screening (to confirm safe wells)<br />
• appropriate screening policy (universal or selective/temporal<br />
frequency)<br />
Public Health Programme • patient identification (active program or via medical consultation)<br />
• establishing relationship between health problem and water<br />
source(s)<br />
• diagnosing incipient symptoms<br />
• immediate patient treatment (organization of bottled water<br />
provision)<br />
LONG TERM<br />
Water Treatment Option •cost at scale of application (town/village/household) and<br />
Alternative Groundwater<br />
Supply<br />
effectiveness/ sustainability at scale of operation.<br />
• usually involving (a) water wells with modified (often deeper)<br />
intakes or (b) reticulation from local high-yielding, acceptable<br />
quality sources, both of which must be based upon systematic<br />
hydrogeological investigation and implemented with appropriate<br />
well construction standards<br />
Alternative Surface • sustainability in terms of drought reliability and quality variability<br />
Water Supply • evaluation of risks associated with treatment plant failure<br />
F. Government Institutions<br />
141. The current functions of the various water sector departments in their present form do not<br />
provide adequate operational basis 32 for implementing IWRM. Effective institutions are characterized<br />
by stability and non fragmentation and non-overlapping of responsibilities, clearly defined but<br />
separated roles and is supported by strong and comprehensive, but flexible legislation, regulations,<br />
decrees, etc. and is lead by an ―apex‖ body with clearly defined regulatory functions. The functions<br />
and tasks performed by the existing institutions do not lend support for integrating climate risk<br />
management in development as adaptive development. Therefore, transformation in roles/rules and<br />
relationship among the institutions is essential which could facilitate: (i) holistic water planning; (ii)<br />
review of financial instruments like targeted subsidies to support adaptation; (iii) participation of<br />
stakeholders in planning and management; (iv) strategizing environmental management and control<br />
measures ; (v) facilitate inter basin planning and management. (vi) separation of roles like service<br />
provider-managers and regulators; (vii) conjunctive planning and regulation of surface and<br />
groundwater (viii) monitoring of quality of water (ix) effective planning for disaster (flood) management<br />
31 Foster et al. (2006b) Natural Groundwater Quality Hazards avoiding problems and formulating mitigation<br />
strategies. GW-MATE Briefing Note Series Note 14, World <strong>Bank</strong>.<br />
32 Source: (ADB TA NO. 7418-IND): Integrated Water Resource Management and Sustainable Water Service<br />
delivery in Karnataka- COMPONENT 1 report on Institutional Analysis and Proposed Reforms for IWRM-2010<br />
67
Support to the National Water Mission NAPCC<br />
Appendix 3 <strong>Kshipra</strong> <strong>Sub</strong> <strong>Basin</strong><br />
(x) revenue recovery mechanism to be effective (xi) post project performance evaluation (outcome &<br />
impact) is not being carried out flow and discharge measuring installations.<br />
142. A nodal agency for ensuring coordinated and integrated planning and management approach<br />
by various water centric institutions is needed. Improved integration of planning between the<br />
departments of groundwater, surface water, agriculture and water supplies all of which are responsible<br />
or affected by the surface and groundwater management principles.<br />
1. Public/private/community roles and initiatives<br />
143. With the change in context, it has become necessary to explore the potentials and risks<br />
associated with the state, private and community sector roles in water management and water service<br />
provision. The appropriateness of different public/private/community roles and responsibilities in<br />
different contexts needs to be addressed. Agenda of assistance/support needs to engage with these<br />
roles and responsibilities to plan appropriate mixes of market-based, institutional and participatory<br />
approaches in management and service provision. An appropriate mix and linkage between roles, and<br />
the social acceptability of this mix and linkage, have to be identified for each specific case.<br />
144. Community-based management raises questions of capacity, financial management and<br />
participation. Long term sustainability and better demand-driven services and infrastructure have been<br />
the major objective of involving communities in the management of the resources. As support for<br />
community systems have moved from household wells to larger-scale and more complex community<br />
piped systems, so the challenges have grown. Operations and maintenance and financial<br />
sustainability have been the biggest challenges with community managed systems, followed closely<br />
by institutional and cultural challenges. Furthermore, recent experience suggests that as rural incomes<br />
increase, communities are demanding both higher levels of service and management arrangements<br />
that release them from day-to-day decision-making. Nevertheless, community involvement in water<br />
resource management remains a significant governance prerogative. Community consultations have<br />
indicated a willingness to participate in planning and policies for sustainability.<br />
145. Key issues: Governance reform to meet the needs the <strong>Kshipra</strong> requires integrating the largely<br />
uncontrolled groundwater abstractions into a more coordinated and directed strategy with<br />
Government and Communities working together to develop mechanisms for sustainability, combined<br />
with maximum productivity from agriculture as well as high levels of service delivery of potable water.<br />
Power is also a factor and strategies for supplying power have also to be incorporated into the<br />
planning. The state departments irrigation, potable water, agriculture, groundwater and power have<br />
to work together to coordinate their activities to develop holistic planning and strategies. It is important<br />
that planning of the rural and urban sectors is better integrated.<br />
2. Catchment Management and Artificial Recharge<br />
146. Integration is a key governance process to address fragmentation in managing water in its<br />
catchment context. IWRM has become the standard for good in this context. But one needs to identify<br />
the operational elements of IWRM for it to become an effective instrument for bringing water<br />
governance as there are number of perceived tensions, in catchment management through IWRM,<br />
between: (i) top-down and bottom-up approaches, (ii) the holistic philosophy that lies behind integrated<br />
river basin management and the participatory ideal of decentred decision making; (iii) the sciencebased<br />
approach that takes advantage of complex ecological knowledge, hydrological and water<br />
allocation models, and tools such as GIS, on the one hand, and community-based initiatives oriented<br />
to local knowledge on the other; (iv) catchment management institutions‘ role to allocate an<br />
increasingly scarce and finite resource (water) versus a catchment management institutional role to<br />
mobilise developmental resources and funds for new infrastructure to take yet more water off the river<br />
and (v) prescriptive approaches to river basin management and institutional design and negotiated<br />
approaches, outcomes and institutional arrangements. There is a need for convergence of the<br />
catchment management departments to better coordinate the various catchment programmes towards<br />
supporting effective groundwater recharge these would include the departments of rural development<br />
(NREGA), groundwater, forestry and panchayats.<br />
68
Support to the National Water Mission NAPCC<br />
Appendix 3 <strong>Kshipra</strong> <strong>Sub</strong> <strong>Basin</strong><br />
3. Equity Implications of Market and Property Rights<br />
147. It is important to understand/analyze different equity implications of market-based approaches<br />
to water. Gender, poverty and indigenous dimensions of water regulation needs to be addressed with<br />
specific reference to the enhanced roles of markets and changing property regimes. <strong>Development</strong><br />
outputs/outcome of the National Action Plan for Climate Change (NAPCC) need to achieve a balance<br />
between efficiency, social equity and sustainability. Equity is a key concern for water related<br />
development assistance. Though many water resource development interventions have been<br />
premised on increasing the supply of water to people and for food, there are raising disparities in<br />
water access between the rich and poor within and between the states.<br />
148. Human intervention, whether through technology or governance, alters the allocation of water.<br />
There is no ‗natural‘ distributive justice in water availability due to the significant variations between<br />
seasons, upland and lowland areas, and regions. Yet human regulation re-distributes water according<br />
to the economic and social objectives of those who control structures at a given scale. Negotiation<br />
over water distribution and equity between various actors, whether they be neighbours sharing a well<br />
or states sharing a large river, are shaped by underlying issues of power, culture and values.<br />
Negotiation and equitable outcomes thus vary greatly according to societal context. Water quality<br />
wherever and whenever available, is an issue. The dimensions of water quality is characterized by: (i)<br />
ways in which water property rights are defined and associated rules for water allocation; (ii) tensions<br />
between equity and efficiency and between equity and sustainability; (iii) provision of ‗safety nets‘ for<br />
the poor to ensure basic water entitlements; (iv) the extent to which water governance engages with<br />
gender inequalities; (v) the extent to which water governance addresses the interests and concerns of<br />
minority groups; (vi) sectoral water equity and competition between agricultural, industrial and urban<br />
water uses; and (vii) the degree to which management of conflict addresses underlying inequalities<br />
and injustices rather than dealing only with superficial symptoms when confrontations occur.<br />
149. The way in which water rights are articulated through a country‘s governance structures<br />
(whether through law or custom) has significant implications for equity. There is always tension<br />
(sometimes creative) between the considerations of water as an economic good and the view of water<br />
as first and foremost a human right. Prioritizing water as an economic good often involves the<br />
privatisation of water rights. When water is seen as a basic human right (and it is recognized as such<br />
in international law), it is more likely to remain in public ownership. Property rights paradigms often<br />
reflect the dominance of one of these positions without appropriately defining a balance between the<br />
two.<br />
150. Water equity can also be considered with reference to competition between sectors.<br />
Agriculture remains the largest water user in the basin. Yet water supply for agriculture is coming<br />
under increasing competition from other water uses, such as industry and urban water supply, as<br />
societies and economies change. Those engaged in agriculture, and other natural resource based<br />
livelihoods may be vulnerable to re-allocations of water to other sectors, or changes in the timing or<br />
quality of water availability. Whilst agriculture may not be the most economically profitable use of<br />
water, however, the provision of adequate supplies of water for agriculture is critical to food security<br />
next only to drinking water.<br />
151. The nature of water is such that it can be easily captured and diverted, and as such water can<br />
be tapped, stolen and systems of regulation subverted. Whether at a community or national scale, for<br />
equity to be maintained in a system it requires a high degree of social acceptance in order to minimize<br />
the cost of regulation and enforcement. In the same way, reform to any system of water governance<br />
also requires a high degree of social acceptance to ensure conflict is avoided. To have some sort of<br />
reallocation of water, for example towards a more equitable, efficient or sustainable arrangement,<br />
requires negotiation, compensation, and a transition process that is both iterative and socially<br />
acceptable.<br />
4. Effective Information Systems for Good Water Governance<br />
152. In the present institutions, participation in decision making is a means to an end, and the goal of<br />
informed decision-making requires good & reliable quality information on a range of issues, spatial,<br />
technical, social, economic, legal and institutional. This necessitates: (i) establishment of an integrated<br />
data and information unit & also basin level knowledge centres; (ii) capitalization of knowledge<br />
69
Support to the National Water Mission NAPCC<br />
Appendix 3 <strong>Kshipra</strong> <strong>Sub</strong> <strong>Basin</strong><br />
emerging form various initiatives like Hydrology project supported by the World <strong>Bank</strong>, land use<br />
information developed under different schemes; (iii) developing climate related information archives to<br />
promote climate literacy among the various stakeholders in general and village panchayat leaders in<br />
particular; (iv) development of decision support systems for effective water management (v)<br />
establishment of updated design parameters to the impact of extreme events due to climate change<br />
and (vi) development of data base related to water and climate for carrying out climate research<br />
5. Knowledge and Human capacity<br />
153. Knowledge and human capacity 33 are critical to implementing successful water resource<br />
development and management initiatives within the framework of IWRM. New skills and capacities<br />
within water management institutions are critically important—at a time when various forces are<br />
supposedly weakening governments‘ capacities to attract and hold people with this expertise. While<br />
capacity development focuses on actors (individuals and institutions) but includes their environments<br />
(systems) that affect their capacity; Capacity development should not be conceived as necessarily<br />
involving formal projects or activities with specific capacity development objectives. Capacity<br />
development also takes place through learning by doing, participation, observation, comparison of<br />
experiences, and a host of other informal activities. The potential area of work in capacity<br />
development extends across a range from individual, through organizations to systems. Within each<br />
grouping separation can be made into capacity development in areas of self, social (interactions<br />
between individuals) and methodological. However, the underlying assumption is that the capacity<br />
building initiative shall help towards new and stronger institutional capacity for management, service<br />
delivery, resource generation and management.<br />
6. Strengthening of Ground and Surface Water Institutions<br />
154. The institutional framework includes government institutions, local authorities, private sector,<br />
civil society organizations, farmers‘ organizations and other community-based organizations. Capacity<br />
building will be needed at each of these levels either through the development of existing water<br />
management arrangements or by forming new ones. Some particular issues requiring capacity<br />
building within the institutional framework for groundwater include the following:<br />
(i) There is a need to link the current approach to groundwater resource assessment with more<br />
hydrogeologically sound approaches. A way forward could be to maintain the current practice<br />
of collecting water resources data at the smallest administrative units (e.g. block) but when<br />
aggregating these data use hydrological based divides (topographic divides and<br />
hydrogeologically connected aquifers units). A precursor to this approach would be an<br />
improved understanding of the hydrogeological system particularly concerning regional aquifer<br />
flows for shallow and deep aquifers and on the nature of groundwater-surface water<br />
interactions. This approach would also require relevant staff at district level to work together to<br />
develop these aggregated datasets supported by a wider state body or in the case of<br />
interstate water resources a central government agency.<br />
(ii) Different methodologies for quantifying groundwater recharge should be trialed in pilot areas<br />
to confirm the viabilities and improve the current methodology for groundwater resource<br />
assessment (Water Level Fluctuation method). These improved methodologies could<br />
subsequently be applied to the new hydrogeologically sound areas of assessment discussed<br />
in the previous bullet.<br />
(iii) There is a need to separate water resources management functions (overall management of<br />
water resources as a whole) from service delivery functions (irrigation, water supply and<br />
sewerage) to avoid conflicts of interest and encourage commercial autonomy. Capacity<br />
building will be needed to support effective water resources planning of surface water and<br />
groundwater.<br />
(iv) Effective and early public participation approaches will be required particularly with farmers‘<br />
organizations to ensure that they are involved in the planning and decision-making processes.<br />
33 Capacity is the ability of actors (individuals, institutions, and societies) to perform functions effectively,<br />
efficiently and sustainably. Capacity is the power of something (person, institution, system) to perform or<br />
produce.<br />
70
Support to the National Water Mission NAPCC<br />
Appendix 3 <strong>Kshipra</strong> <strong>Sub</strong> <strong>Basin</strong><br />
Capacity building of WUAs and Panchayats will be particularly important to ensure take-up of<br />
new approaches to groundwater use.<br />
7. Capacity Building and <strong>Development</strong><br />
155. Based on state consultations, a summary of the key capacity building areas towards institutional<br />
strengthening 34 , water resource and user institutions development are presented in Table 34 below:<br />
Table 34: Key Areas for Capacity Building<br />
o Water Management practices for sustainable agriculture<br />
o Volumetric supply of water and installation of measuring devises<br />
o Basics of Farmers Managed Irrigation Acts and formation of WUA<br />
o GIS and Autocad applications<br />
o On New Institutional arrangements and the roles to be played by WRD<br />
o Community involvement in managing irrigation infrastructure<br />
o Preparation of thematic maps for the selected basins<br />
o Knowledge on and Utilization of modern equipments for Topographical and cadastral survey<br />
o Modern design on irrigation structure and coastal structure<br />
o Budgeting. accounting and financial management including fund-flow arrangements<br />
o Environmental assessment and redressal systems in the social & environmental assessment<br />
framework<br />
o Maintaining MIS<br />
o O & M of the irrigation assets and allocation of adequate funds<br />
o Project Planning, Monitoring and Evaluation<br />
o GIS Applications in Irrigation<br />
o Modern Survey Techniques (Total Station and LADAR- Laser Detection and Ranging<br />
o Environmental Impact Assessment & Management (EIA/EMP of irrigation projects)<br />
o Project Economics<br />
o Procurement & Contract Management (including procurement procedure)<br />
o Procurement/ Tendering<br />
o Planning of Irrigation Projects<br />
o Modern Irrigation Techniques like Sprinkler/Drip Irrigation<br />
o Benchmarking of Irrigation Projects<br />
o Water Use Efficiency/Water Auditing of<br />
o Irrigation Projects<br />
o Productivity Enhancement in Command Area<br />
o Design of Dams<br />
o Land Acquisition and Encroachment Issues<br />
o Modern Construction Technology and Techniques<br />
o Quality Control of Construction<br />
o Revenue Recovery and Related Issues<br />
o Canal and Drainage Hydraulics<br />
o Mirco-distribution Network, Plan & Design<br />
o Preparation of Operational Plan for Irrigation Projects<br />
o SCADA - Canal Automation<br />
o Design & Operation of Canal Flow, Flow Measurement and Control Structures<br />
o Dam Safety Aspects<br />
OTHER DEPARTMENTS<br />
o Integrated Farming<br />
o Adoption of Micro irrigation technology<br />
o Promotion of Hybrid vegetable and Horticultural crops<br />
o Promoting fodder cultivation<br />
o Seed production and seed certification<br />
o Agro-climatic zones and agronomy<br />
o Pest Management<br />
COMMON TO ALL DEPARTMENTS<br />
o Concept, principles and practices of IWRM<br />
o <strong>Basin</strong> approach in Planning and Implementation<br />
34 Main goals of institution strengthening is the strengthening of management and therefore capacity building<br />
areas must cover management issues.<br />
71
Support to the National Water Mission NAPCC<br />
Appendix 3 <strong>Kshipra</strong> <strong>Sub</strong> <strong>Basin</strong><br />
o National and State Acts & Rules<br />
o Formation and functioning of RBO s<br />
o Legal Issues and Related Software<br />
o Legal Issues and Use of LIS (Legal Information System)<br />
o Human Resource Management/Strategic Human Resource Management<br />
o Right to Information ACT<br />
o Leadership, Motivation and Team Building<br />
o Developing Communication Skills<br />
o Time, Stress and Conflict Management<br />
o Participatory Irrigation Management<br />
o Gender Issues and their Integration<br />
o Management of Organizational Change<br />
o Building Organizational Culture for Performance<br />
o Competency Mapping and Management<br />
o Public Private Partnership<br />
72
Support to the National Water Mission NAPCC<br />
Appendix 3 <strong>Kshipra</strong> <strong>Sub</strong> <strong>Basin</strong><br />
A. Introduction<br />
VIII. CLIMATE CHANGE SCENARIOS<br />
156. The <strong>Kshipra</strong> river rises in the Vindhya Range north of Dhar, from a hill called Kokri Tekdi<br />
(situated at a distance of 11km from Ujjain). The <strong>Kshipra</strong> river is 195km long. Its main tributaries are<br />
the Khan and Gambhir rivers. The <strong>Kshipra</strong> flows south across the Malwa Plateau to join the Chambal<br />
river.<br />
157. The Chambal river is a tributary of the Yamuna river in central India, and forms part of the<br />
greater Gangetic drainage system. The river flows north-northeast through Madhya Pradesh, passing<br />
through Rajasthan, then forming the boundary between Rajasthan and Madhya Pradesh before<br />
turning southeast to join the Yamuna in Uttar Pradesh state. The Chambal river is 960km long and its<br />
drainage basin covers an area of 143,219 km².<br />
158. The summer months (April–June) are harsh with temperatures reaching up to 45°C. In addition,<br />
hot winds (called lou) may blow in the afternoons, worsening the heat and increasing<br />
evapotranspiration. The winter months (November–February) are pleasant and cool with daytime<br />
temperatures typically 20°C, though they may drop below zero at night. The monsoon typically arrives<br />
in late June and the months of June through September receive moderate to heavy rainfall. There are<br />
periods of rainfall followed by long periods of bright sunshine and high humidity. The month of October<br />
generally is very warm and with high humidity.<br />
159. The <strong>Kshipra</strong> sub-basin is relatively small and hence the regional climate model has only a small<br />
number of grid points over the area. Gridded data for precipitation and temperature exist for the<br />
region, at resolutions down to 25km. In this study, the India Meteorological Department (IMD) dataset<br />
has been utilised for observed precipitation.<br />
B. Summary of Observed Changes to the Present Time<br />
1. Community Perceptions<br />
160. The communities have observed significant change in the temperature in the last 10 years. The<br />
summer temperature has risen significantly and the winter temperature has fallen significantly in all the<br />
districts. The reports of rainfall change are mixed; respondents from Indore have told that rainfall has<br />
not changed significantly in the last few years, though people in the other districts are of the view that<br />
there is significantly less rainfall. During 2010 frost caused huge damage on agricultural production in<br />
all the districts, though the damage is seen to be less in Indore.<br />
161. The average response from the communities has been that some delays in the starting day of<br />
the monsoon has been observed, with delays reported of around 10-15 days. Stakeholders mostly<br />
believe that climate change will have perceptible impact on their livelihood through its effect on<br />
agricultural production, human health and livestock population.<br />
C. Relevant Climate Change Studies and Findings<br />
162. Researches into the wider Ganges basin are very numerous, but there are only a few key<br />
research outputs for <strong>Kshipra</strong>. Saini, of Geological Survey of India, published in 2008 on ―Climate<br />
Change and its Future Impact on the Indo-Gangetic Plain (IGP)‖, which mentions some of the issues<br />
investigated in this project, namely groundwater depletion.<br />
163. Dasgupta et al performed a review in 2010 ―Indian Agricultural Scenario and Food Security<br />
Concerns in the Context of Climate Change: a Review‖, concluding that the food insecurity situation<br />
was ―moderate‖. They also note ―The available studies on supply and demand for foodgrain and other<br />
food products do not account for the impact of climate change on the production and consumption of<br />
food.‖ .<br />
73
Support to the National Water Mission NAPCC<br />
Appendix 3 <strong>Kshipra</strong> <strong>Sub</strong> <strong>Basin</strong><br />
164. The scoping study for Madhya Pradesh State Climate Change Action Plan has been produced<br />
in 2010 35 . . The study assesses both climate change mitigation/energy as well as adaptation. The main<br />
issues relating to water include: (i) water is identified as being under serious threat both in terms of<br />
quantity and quality; (ii) surface run-off during heavy rainfall of sewage, and fertilisers causes pollution;<br />
(iii) post-monsoon flow in most rivers is used for irrigation which further reduces flows-rivers get<br />
converted into a series of small ponds; (iv) water use efficiency in irrigation is generally very low and<br />
there are major concerns regarding resource depletion; (v) there should be a reduced dependence on<br />
irrigation and enhance agriculture productivity through improved technologies; (vi) in many districts,<br />
groundwater is being drawdown at an alarming rate encouraged by highly subsidised or free<br />
electricity; (vii) continuous efforts are made to reduce the gap between potential and actual irrigation;<br />
(viii) the total storage of rainfall through major and minor irrigation dams is quite small and the tradition<br />
of building small check dams and storage ponds in low lying land has declined in the past 50 years;<br />
(ix) while the Government of Madhya Pradesh (GoMP) has done a good job of initiating water<br />
harvesting and water shed development, investments are required to treat land and a much larger<br />
level of investments will be needed to ensure that a significantly higher proportion of rainwater is<br />
captured and used; and (x) whilst overall fertiliser consumption is low it is heavily applied in some<br />
areas and high concentrations have been found in all groundwater..<br />
D. Scenarios for Change<br />
165. For climate change projections in the <strong>Kshipra</strong> sub-basin, output from a member of the UK<br />
Hadley Centre HADCM3 global climate model (GCM) QUMP ensemble (Quantifying Uncertainty in<br />
Model Predictions) has been downscaled using the Hadley Centre PRECIS (Providing Regional<br />
Climates for Impact Studies) regional climate model (RCM). Apart from the baseline (1961-1990)<br />
which represents the present, the following two time slices for the future have been investigated: midcentury<br />
(2021-2050) and end-century (2071–2100); all three time slices use the IPCC SRES (special<br />
report on emissions scenarios) A1B scenario. The PRECIS data grids are shown in Figure 43. The<br />
SRES A2 and B2 scenarios are also available for the end of century.<br />
Figure 43: The PRECIS Data Grids<br />
1. Temperature<br />
166. HADCM3 simulations downscaled with<br />
PRECIS indicate an all-round warming over the<br />
Indian subcontinent associated with increasing<br />
greenhouse gas concentrations. Seasonal mean<br />
daily maximum and mean daily minimum<br />
temperatures from the PRECIS simulation of the<br />
A1B scenario are given in Table 35 below.<br />
Figure 35 presents a comparison of projected<br />
changes in temperatures for the basin with the<br />
A1B, A2 and B2 scenarios for the end of the<br />
century.<br />
35 Scoping Study for Madhya Pradesh State Climate Change Action Plan MERYLYN HEDGER and<br />
VAIDEESWARAN S IDS and CCDC March 2010<br />
74
Support to the National Water Mission NAPCC<br />
Appendix 3 <strong>Kshipra</strong> <strong>Sub</strong> <strong>Basin</strong><br />
Table 35: PRECIS Simulated seasonal temperatures, A1B scenario<br />
Time Horizon Mean daily maximum temperatures ( o C)<br />
JF MAM JJAS OND Annual<br />
Baseline (1970s) 27.0 39.3 30.2 28.9 31.4<br />
mid-century 29.3 41.4 31.7 30.8 33.3<br />
end-century 30.9 43.3 33.6 32.7 35.1<br />
Mean daily minimum temperatures ( o C)<br />
Baseline (1970s) 10.3 22.5 22.0 12.4 16.8<br />
mid-century 17.3 28.2 23.7 15.2 21.1<br />
end-century 20.1 30.4 26.0 19.1 23.9<br />
Table 36 Comparison of projected changes in temperatures, A1B, A2 and B2 scenarios, 2080s<br />
Mean daily maximum temperatures<br />
Scenario JF MAM JJAS OND Annual<br />
A1B 3.9 4.0 3.4 3.8 3.7<br />
A2 4.4 3.8 3.4 5.4 4.2<br />
B2 2.7 2.3 2.7 4.6 3.0<br />
Mean daily minimum temperatures<br />
A1B 9.8 7.9 4 6.7 7.1<br />
A2 5.8 4.9 3.2 5.3 4.8<br />
B2 4.1 3.4 2.5 5.8 3.9<br />
167. Both maximum and minimum temperatures are projected to rise significantly under the PRECIS<br />
A1B scenario. Mean daily maximums are project to increase by about 2 o C by the 2050s and by<br />
almost 4 o C by the 2080s. Increases in the monsoon season are lower than in the dry seasons. The<br />
A2 scenario produces similar changes in Mean daily maximum temperatures as the A1B scenario, but<br />
the increases under the B2 scenario are much lower. Mean daily minimum temperatures are<br />
projected to increase by as much as 10 o C in the dry season by the 2080s, and by a more modest 4 o C<br />
in the monsoon season under the A1B scenario. The A1B scenario produces much larger increases<br />
in mean daily minimum temperatures than either the A2 or B2 scenarios, particularly in the dry season<br />
months. Temperature changes are shown in Figure 44 for the A1B scenario. The pattern of projected<br />
changes in similar under the A2 and B2 scenarios.<br />
75
Support to the National Water Mission NAPCC<br />
Appendix 3 <strong>Kshipra</strong> <strong>Sub</strong> <strong>Basin</strong><br />
2. Rainfall<br />
Figure 44: Change in Average Daily Temperatures<br />
168. The <strong>Kshipra</strong> river basin receives most of its rain during the monsoon season, which starts in<br />
late June. The mean seasonal precipitation amounts simulated by PRECIS are as shown in Table 37<br />
below. Data are presented for four seasonal periods: JF - January, February; MAM - March, April,<br />
May; JJAS - June, July, August, September; OND - October, November, December. Table 38<br />
presents a comparison of changes to end-century under the A1B, A2 and B2 scenarios. Figure 45<br />
and Figure 46 show the pattern of changes in annual and seasonal rainfall under the A1B scenario.<br />
The pattern of change is very similar under the A2 and B2 scenarios.<br />
169. Under the A1B scenario, rainfall is projected to increase. Mean annual rainfall increases by<br />
about 140mm by mid-century, and by about 180mm by end-century under the A1B scenario. The A2<br />
scenario produces a similar change in precipitation to the A1B scenario, but with the B2 scenario, the<br />
76
Support to the National Water Mission NAPCC<br />
Appendix 3 <strong>Kshipra</strong> <strong>Sub</strong> <strong>Basin</strong><br />
change in precipitation is less than half of that under A2. Most of the increases occur in the monsoon<br />
period. There is a slight decline in OND and JF rainfall to mid-century under the A1B scenario. Mean<br />
monsoon rainfall increases by 160 mm by end-century under the A1B scenario.<br />
Table 37 PRECIS Simulated seasonal precipitation in the <strong>Kshipra</strong> sub-basin, A1B<br />
scenario (mm)<br />
JF MAM JJAS OND Annual<br />
1970s baseline 31 39 745 68 883<br />
mid-century 10 40 918 55 1023<br />
end-century 19 43 905 97 1065<br />
Table 38 Projected changes in seasonal precipitation under the A1B, A2 and B2 scenarios, to<br />
2080s<br />
Scenario JF MAM JJAS OND Annual<br />
A1B -12 4 160 29 182<br />
A2 6 10 132 1 150<br />
B2 2 9 79 -19 71<br />
Figure 45: Change in Average Precipitation<br />
77
Support to the National Water Mission NAPCC<br />
Appendix 3 <strong>Kshipra</strong> <strong>Sub</strong> <strong>Basin</strong><br />
Figure 46 : Change in Average Seasonal Precipitation<br />
3. Combined Rainfall and Temperature<br />
170. Figure 47 given below indicates the absolute changes in seasonal and annual rainfall and<br />
temperature for the A1B scenario.<br />
78
Support to the National Water Mission NAPCC<br />
Appendix 3 <strong>Kshipra</strong> <strong>Sub</strong> <strong>Basin</strong><br />
1800<br />
1600<br />
1400<br />
1200<br />
1000<br />
800<br />
600<br />
400<br />
200<br />
0<br />
Figure 47: Simulated Seasonal and Annual Rainfall, A1B scenario<br />
Rainfall in mm<br />
45.0<br />
40.0<br />
35.0<br />
30.0<br />
25.0<br />
20.0<br />
15.0<br />
10.0<br />
5.0<br />
0.0<br />
1970s 2050s 2080s<br />
<strong>Kshipra</strong><br />
JF MAM JJAS OND Annual<br />
1970s 2050s 2080s<br />
<strong>Kshipra</strong><br />
JF MAM JJAS OND Annual<br />
Maximum temperature in (oC)<br />
35.0<br />
30.0<br />
25.0<br />
20.0<br />
15.0<br />
10.0<br />
5.0<br />
0.0<br />
-5.0<br />
-10.0<br />
-15.0<br />
1970s 2050s 2080s<br />
<strong>Kshipra</strong><br />
JF MAM JJAS OND Annual<br />
Minimum temperature in (oC)<br />
79
Support to the National Water Mission NAPCC<br />
Appendix 3 <strong>Kshipra</strong> <strong>Sub</strong> <strong>Basin</strong><br />
E. Analysis of the Climate Change Data<br />
171. The PRECIS data on precipitation, maximum and minimum temperature have been analysed<br />
for the <strong>Kshipra</strong> basin.The forecast changes in precipitation under the PRECIS A1B and A2 scenarios<br />
are significant, being 15%-20%. The change is less significant with the B2 scenario. These changes<br />
could improve the water resources situation, depending upon the intensity and inter-annual variability<br />
with which the rainfall falls. The extent to which increased temperatures and potential<br />
evapotranspiration offset the increase in precipitation has been investigated using the SWAT (Soil<br />
Water Assesssment Tool) rainfall-runoff model. Increasing rainfall intensity, has implications for<br />
drainage design, and catchment management including water harvesting and soil erosion. At present<br />
regional climate models do not represent rainfall well, and only subjective assessments may be<br />
possible.<br />
F. Water Resources<br />
1. Hydrological Simulation Studies<br />
172. Evaluating the potential impacts of climate change on water resources requires the application<br />
of hydrological simulation modelling techniques, driven by scenarios of changes in precipitation and<br />
potential evapotranspiration derived from global and regional climate modelling studies. As indicated<br />
above, precipitation is one of the least well represented processes in climate models at present, and<br />
the uncertainty in projections of climate change impacts on water resources is therefore high. Current<br />
practice is to try and use a range of different climate models to create an ensemble of possible futures<br />
through which an appreciation of uncertainty can be gained, and the robustness of adaptation<br />
responses evaluated. The near future (2030s) is the main focus for planning, and for this the model<br />
projections are largely independent of the emission scenarios, as the changes are mainly due to<br />
historical emissions and the slow response of the Earth‘s climate system. However, inter-model<br />
uncertainty should be considered<br />
173. The SWAT model has been used with climate simulations from the A1B emissions scenarios<br />
from the PRECIS RCM with HADCM3 boundary conditions. The model was calibrated using data<br />
from the IMD 0.5 o precipitation and temperature data, and observed flow data from the Central Water<br />
Commission (CWC) and state gauging stations.<br />
174. The Indian Institute for Tropical Meteorology (IITM) have run the PRECIS model on the A1B<br />
emissions scenario with three perturbed model parameter sets that provide for some level of intermodel<br />
variability. The full integrations for these PRECIS runs were requested, but only one was<br />
available, and only for the baseline , 2021-2050 and 2071-2098. The PRECIS model has also been<br />
run with the A2 and B2 scenarios, but only for the time slice 2071-2100. The SWAT model was run<br />
only with the A1B scenario.<br />
2. Background to the SWAT Model<br />
175. The Soil and Water Assessment Tool (SWAT) model (Arnold et al., 1998 36 , Neitsch et al.,<br />
2002 37 ) is a distributed parameter and continuous time simulation model. The SWAT model has been<br />
developed to predict the hydrological response of un-gauged catchments to natural inputs as well as<br />
the manmade interventions. Water and sediment yields can be assessed as well as water quality. The<br />
model (a) is physically based; (b) uses readily available inputs; (c) is computationally efficient to<br />
operate and (d) is continuous time and capable of simulating long periods for computing the effects of<br />
management changes. The major advantage of the SWAT model is that unlike the other conventional<br />
conceptual simulation models it does not require much calibration and therefore can be used on ungauged<br />
watersheds (in fact the usual situation).<br />
36 Arnold, J. G., R. Srinivasan, R. S. Muttiah, and J. R. Williams. 1998. Large-area hydrologic modeling and<br />
assessment: Part I. Model development. J. American Water Res. Assoc. 34(1): 73-89<br />
37 Neitsch, S. L., J. G. Arnold, J. R. Kiniry, J. R. Williams, and K. W. King. 2002a. Soil and Water Assessment<br />
Tool - Theoretical Documentation (version 2000). Temple, Texas: Grassland, Soil and Water Research<br />
Laboratory, Agricultural Research Service, Blackland Research Center, Texas Agricultural Experiment Station.<br />
80
Support to the National Water Mission NAPCC<br />
Appendix 3 <strong>Kshipra</strong> <strong>Sub</strong> <strong>Basin</strong><br />
176. The SWAT model is a long-term, continuous model for watershed simulation. It operates on a<br />
daily time step and is designed to predict the impact of land management practices on water,<br />
sediment, and agricultural chemical yields. The model is physically based, computationally efficient,<br />
and capable of simulating a high level of spatial details by allowing the watershed to be divided into a<br />
large number of sub-watersheds. Major model components include weather, hydrology, soil<br />
temperature, plant growth, nutrients, pesticides, and land management. The model has been validated<br />
for several watersheds.<br />
177. In SWAT, a watershed is divided into multiple sub-watersheds, which are then further<br />
subdivided into unique soil/land-use characteristics called hydrologic response units (HRUs). The<br />
water balance of each HRU in SWAT is represented by four storage volumes: snow, soil profile (0-<br />
2m), shallow aquifer (typically 2-20m), and deep aquifer (>20m). Flow generation, sediment yield, and<br />
non-point-source loadings from each HRU in a sub-watershed are summed, and the resulting loads<br />
are routed through channels, ponds, and/or reservoirs to the watershed outlet. Hydrologic processes<br />
are based on the following water balance equation:<br />
SW SW <br />
t<br />
t<br />
<br />
i1<br />
( R<br />
it<br />
Q ET P QR )<br />
178. where SW is the soil water content minus the wilting-point water content, and R, Q, ET, P, and<br />
QR are the daily amounts (in mm) of precipitation, runoff, evapotranspiration, percolation, and<br />
groundwater flow, respectively.<br />
179. The soil profile is subdivided into multiple layers that support soil water processes, including<br />
infiltration, evaporation, plant uptake, lateral flow, and percolation to lower layers. The soil percolation<br />
component of SWAT uses a storage routing technique to predict flow through each soil layer in the<br />
root zone. Downward flow occurs when field capacity of a soil layer is exceeded and the layer below is<br />
not saturated. Percolation from the bottom of the soil profile recharges the shallow aquifer. If the<br />
temperature in a particular layer is 0ºC or below, no percolation is allowed from that layer. Lateral<br />
subsurface flow in the soil profile is calculated simultaneously with percolation. The contribution of<br />
groundwater flow to the total stream flow is simulated by routing a shallow aquifer storage component<br />
to the stream (Arnold, Allen, and Bernhardt 1993 38 ).<br />
180. SWAT also simulates the nutrient dynamics. Sediment yield is calculated based on the Modified<br />
Universal Soil Loss Equation (MUSLE) (Williams, 1975 39 ). The movement of nutrients, i.e. nitrogen<br />
and phosphorus is based on built in equations for their transformation from one form to the other. The<br />
total amounts of nitrates in runoff and subsurface flow is calculated from the volume of water in each<br />
pathway with the average concentration. Phosphorus however is assumed to be a relatively less<br />
mobile nutrient, with only the top 10 mm of soil considered in estimating the amount of soluble P<br />
removed in runoff. A loading function is used to estimate the phosphorus load bound to sediments<br />
(McElroy et al, 1976 40 ). SWAT calculates the amount of algae, dissolved oxygen and carbonaceous<br />
biological oxygen demand (CBOD - the amount of oxygen required to decompose the organic matter<br />
transported in surface runoff) entering the main channel with surface runoff. CBOD loading function is<br />
based on a relationship given by Thomann and Mueller (1987) 41 .<br />
181. The SWAT model possesses most of the attributes which are identified to be the desirable<br />
attributes that a hydrological model should possess. The SWAT model is a spatially distributed<br />
physically based model. It requires site specific information about weather, soil properties, topography,<br />
vegetation, and the land management practices being followed in the watershed. The physical<br />
processes associated with water movement, sediment movement, crop growth, nutrient cycling, etc.<br />
38<br />
Arnold, J.G., Allen, P.M, and Bernhardt, G.T. 1993. A comprehensive surface groundwater flow model. Journal<br />
of Hydrology, 142: 47-69<br />
39<br />
Williams, J.R. 1975. Sediment routing for agricultural watersheds. Water Resources Bulletin, 11 (5): 965-974.<br />
40<br />
McElroy, A.D., Chiu, S.Y. and Nebgen, J.W. 1976. Loading functions for assessment of water pollution from<br />
nonpoint sources. EPA document 600/2-76-151, USEPA, Athens, GA<br />
41<br />
Thomann, R.V. and J.A. Mueller. 1987. Principles of surface water quality modelling and control. Harper & Row<br />
Publishers, New York<br />
i<br />
i<br />
i<br />
i<br />
81
Support to the National Water Mission NAPCC<br />
Appendix 3 <strong>Kshipra</strong> <strong>Sub</strong> <strong>Basin</strong><br />
are directly modelled by SWAT using these input data. This approach results in major advantages,<br />
such as:<br />
o Un-gauged watersheds with no monitoring data (e.g. stream gauge data) can be successfully<br />
modelled.<br />
o The relative impact of alternative input data (e.g. changes in management practices, climate,<br />
vegetation, etc.) on water quantity, quality or other variables of interest can be quantified.<br />
o The model uses readily available inputs. The minimum data required to make a SWAT run are<br />
the commonly available data from local government agencies.<br />
o The model is computationally efficient. Simulation of very large basins or a variety of<br />
management strategies can be performed without excessive investment of time or money.<br />
o The model enables users to study impacts on account of human interventions which makes it<br />
very suitable for scenario generation.<br />
o The model is also capable of incorporating the climate change conditions to quantify the<br />
impacts of change.<br />
o The model has gained a wide global acceptability. Currently 720 peer reviewed papers have<br />
been published based on the SWAT model (http://swatmodel.tamu.edu ). The current rate of<br />
publication is about 120 peer reviewed papers per year. There are more than 90 countries<br />
using the model for practical applications and at the least, more than 200 graduate students all<br />
over the world are using it as part of their M.S. or Ph.D. research program. In the U.S alone,<br />
more than 25 universities have adopted the model in graduate level teaching classes.<br />
182. SWAT is a public domain model actively supported by the Grassland, Soil and Water Research<br />
Laboratory (Temple, TX, USA) of the USDA Agricultural Research Service.<br />
3. SWAT Model Setup<br />
183. Spatial data used in setting up the SWAT model included:<br />
o Digital Elevation Model: SRTM, of 90 m resolution 42<br />
o Drainage Network – Hydroshed 43<br />
o Soil maps and associated soil characteristics (source: FAO Global soil) 44<br />
o Land use: Global Map of Land Use/Land Cover Areas (GMLULCA), IWMI‘s Global Map of<br />
Irrigated Areas (GMIA) (source: IWMI) 45<br />
184. Hydro-meteorological data pertaining to the river basin required for modelling include daily<br />
rainfall, maximum and minimum temperature, solar radiation, relative humidity and wind speed. These<br />
weather data were available as per following details:<br />
o IMD gridded weather data (1971–2004) – 5 years of weather data was used as<br />
warmup/setup period for the <strong>Kshipra</strong> basin model thus outputs were available from 1976<br />
to 2004<br />
o Climate Change: PRECIS Regional Climate Model outputs for Baseline (1961–1990, BL) ,<br />
near term (2021-2050, MC) and long term or end-century (2071-2098, EC) for A1B IPCC<br />
SRES scenario 46 (Q14 QUMP ensemble)<br />
185. Mapping the <strong>Kshipra</strong> <strong>Basin</strong>: The ArcSWAT (Winchell et al., 2007 47 ) interface was used to preprocess<br />
the spatial data for the <strong>Kshipra</strong> river system. Figure 48 shows the DEM derived from the<br />
42 http://srtm.csi.cgiar.org<br />
43 http://hydrosheds.cr.usgs.gov/<br />
44 http://www.lib.berkeley.edu/EART/fao.html<br />
45 http://www.iwmigiam.org/info/main/index.asp<br />
46 http://www.tropmet.res.in/static_page.php?page_id=51<br />
47 Winchell, M., Srinivasan, R., Di Luzio, M., Arnold, J., 2007. ArcSWAT interface for SWAT2005. User's Guide.<br />
BRC, TAES, USDA-ARS, Temple, TX<br />
82
Support to the National Water Mission NAPCC<br />
Appendix 3 <strong>Kshipra</strong> <strong>Sub</strong> <strong>Basin</strong><br />
SRTM 90 data. The DEM is used in basin and sub-basin delineation. A summary of the elevation<br />
statistics is given in Table 39.<br />
Table 39 Elevation Summary – <strong>Kshipra</strong> <strong>Basin</strong><br />
Parameter Elevation (masl)<br />
Minimum Elevation 388<br />
Maximum Elevation 831<br />
Mean Elevation 510<br />
186. <strong>Sub</strong>-basin delineation: ArcSWAT<br />
performs automatic delineation of watersheds<br />
using the DEM with a target outflow point<br />
selected interactively. The <strong>Kshipra</strong> river basin<br />
was delineated using 5,000 ha as minimum<br />
stream threshold. This resulted in 41 sub-basins. These sub-basins are shown in Figure 49. The<br />
basin area of the <strong>Kshipra</strong> up to the basin outflow point is 562,110 ha. Care was also taken to<br />
incorporate the locations of stream gauge measurement locations while undertaking the delineation<br />
process.<br />
187. Land use/land cover is an important element of data that is required for pre-processing. The<br />
merged landuse and irrigation source map from IWMI, as shown in Figure 50, was used for the<br />
present study. IWMI derived the Ganges River <strong>Basin</strong> Irrigated Area product using MODIS 500-m and<br />
AVHRR 10-km satellite sensor data merged with IWMI‘s Global Map of Land Use/Land Cover Areas,<br />
to derive a new landuse map with agriculture landuse as well as sources of irrigation. The <strong>Kshipra</strong><br />
basin is part of the Ganga basin. Land use categories and the area covered under each is<br />
summarised in<br />
188. Table 40. The major part of the basin is under agriculture land use, and soyabean is the<br />
predominant crop.<br />
Figure 48: Digital Elevation Model of <strong>Kshipra</strong> <strong>Basin</strong><br />
83
Support to the National Water Mission NAPCC<br />
Appendix 3 <strong>Kshipra</strong> <strong>Sub</strong> <strong>Basin</strong><br />
Figure 49: <strong>Sub</strong>-basin delineation<br />
84
Support to the National Water Mission NAPCC<br />
Appendix 3 <strong>Kshipra</strong> <strong>Sub</strong> <strong>Basin</strong><br />
Figure 50: <strong>Kshipra</strong> <strong>Basin</strong> land use<br />
Table 40: Land use Categories – <strong>Kshipra</strong> <strong>Basin</strong><br />
Land Use Area (ha) % of Watershed Area<br />
Wheat 126723 23<br />
Rice 18372 3<br />
Sugarcane 9149 2<br />
Tomato 19495 3<br />
Soyabean 388371 69<br />
189. Soils: Information on the soil profile is required for simulating the hydrological character of the<br />
basin. In the absence of high resolution soil data, the FAO global soil map was used for the modelling<br />
of the <strong>Kshipra</strong> basin. The soil is predominantly clay. However, clay loam is also present in the south.<br />
The soils map is shown in Figure 51.<br />
85
Support to the National Water Mission NAPCC<br />
Appendix 3 <strong>Kshipra</strong> <strong>Sub</strong> <strong>Basin</strong><br />
Figure 51: <strong>Kshipra</strong> <strong>Basin</strong> soils<br />
4. SWAT Model Calibration and Performance<br />
190. Model Evaluation Statistics (Dimensionless): Statistical parameters, namely regression<br />
coefficients (R 2 ) and Nash Sutcliffe efficiency coefficient (NSE) were used to assess the model<br />
efficiency on monthly SWAT hydrologic streamflow predictions. The Nash-Sutcliffe efficiency (NSE) is<br />
a normalized statistic that determines the relative magnitude of the residual variance (―noise‖)<br />
compared to the measured data variance (―information‖) (Nash and Sutcliffe, 1970 48 ). NSE indicates<br />
how well the plot of observed versus simulated data fits the 1:1 line. NSE is computed as:<br />
obs th sim th<br />
where Yi is the i observation for the constituent being evaluated, Yi is the i simulated value for<br />
the constituent being evaluated, Y mean is the mean of observed data for the constituent being<br />
evaluated, and n is the total number of observations. NSE ranges between −∞ and 1.0 (1 inclusive),<br />
with NSE = 1 being the optimal value. Values between 0.0 and 1.0 are generally viewed as acceptable<br />
48 Nash, J. E., and J. V. Sutcliffe. 1970. River flow forecasting through conceptual models: Part 1. A discussion of<br />
principles. J. Hydrology 10(3): 282-290<br />
86
Support to the National Water Mission NAPCC<br />
Appendix 3 <strong>Kshipra</strong> <strong>Sub</strong> <strong>Basin</strong><br />
levels of performance, whereas values
Support to the National Water Mission NAPCC<br />
Appendix 3 <strong>Kshipra</strong> <strong>Sub</strong> <strong>Basin</strong><br />
Table 41: SWAT model efficiency parameters for the <strong>Kshipra</strong> <strong>Basin</strong><br />
Gauge Site Catchment<br />
Area*(km 2 Mean<br />
) Flow*(m 3 Start Year End Year COE** Correlation<br />
/s)<br />
coefficient<br />
Ujjain 2070 (2288) 12.9 (15.8) 1976 2009 0.45 0.79<br />
Mahidpur 4430 (4467) 29.8 (30.6) 1976 2009 0.66 0.82<br />
Note: * Model parameter is shown in bracket, ** Nash-Sutcliffe coefficient<br />
Figure 53: <strong>Kshipra</strong> <strong>Basin</strong> – Calibration at Ujjain<br />
88
Support to the National Water Mission NAPCC<br />
Appendix 3 <strong>Kshipra</strong> <strong>Sub</strong> <strong>Basin</strong><br />
Figure 54: <strong>Kshipra</strong> <strong>Basin</strong> – Calibration at Mahidpur<br />
5. Modelling Climate Change Impacts on Hydrological Response<br />
193. Model Outputs: The outputs provided by the model are very extensive, covering all the<br />
components of water balance spatially and temporally. The sub components of the water balance that<br />
are most significant and used for analyses, include:<br />
o Precipitation<br />
o Total flow (Water yield) consisting of surface runoff, lateral and base flow<br />
o Actual evapotranspiration (Actual ET)<br />
194. Mean annual and seasonal precipitation is shown in Figure 55, and the coefficients of variation<br />
in Figure 56. Most precipitation occurs during the southwest monsoon and coefficients of variation<br />
during this period are significantly lower than during the northeast monsoon.<br />
89
Support to the National Water Mission NAPCC<br />
Appendix 3 <strong>Kshipra</strong> <strong>Sub</strong> <strong>Basin</strong><br />
Figure 55 <strong>Kshipra</strong> <strong>Basin</strong> – Annual, JJAS and OND precipitation<br />
Figure 56 <strong>Kshipra</strong> <strong>Basin</strong> – Coefficient of Variation in Annual, JJAS and OND precipitation<br />
195. Simulation with A1B baseline: Prior to analysis of climate change scenarios, and assessment<br />
was made how well the characteristics of SWAT streamflows simulated from the PRECIS A1B<br />
baseline weather, matched with those simulated from observed weather. Figure 57 presents a<br />
comparison of mean monthly discharges at Ujjain and Mahidpur simulated from observed weather and<br />
90
Support to the National Water Mission NAPCC<br />
Appendix 3 <strong>Kshipra</strong> <strong>Sub</strong> <strong>Basin</strong><br />
from the PRECIS A1B baseline weather. The indication is that the PRECIS simulation of baseline<br />
weather is quite satisfactory. Comparison of mean monthly flows is given in Table 42<br />
Figure 57: Mean Monthly Discharges Simulated from Observed and PRECIS A1B Baseline<br />
Table 42: Mean Monthly Flows simulated from Observed and PRECIS A1B Baseline Weather<br />
Date<br />
Mahidpur flows (m 3 /s) Ujjain flows (m 3 /s)<br />
Simulated using<br />
Observed Weather<br />
Simulated using<br />
A1B Baseline<br />
Weather<br />
Simulated using<br />
Observed Weather<br />
Jan 0.50 7.47 0.27 3.98<br />
Feb 0.27 7.93 0.10 4.35<br />
Mar 0.12 4.84 0.01 2.59<br />
Apr 0.01 0.31 0.00 0.15<br />
May 0.00 1.61 0.00 0.97<br />
Jun 12.93 25.38 7.02 14.16<br />
Jul 64.55 94.82 34.85 52.60<br />
Aug 160.63 83.54 83.01 45.02<br />
Sep 115.53 126.89 60.49 69.06<br />
Oct 25.18 58.67 12.83 31.60<br />
Nov 5.80 17.85 2.62 9.26<br />
Dec 1.50 4.24 0.65 2.09<br />
Mean 32.25 36.13 16.82 19.65<br />
CV 0.67 0.63 0.65 0.62<br />
91<br />
Simulated using<br />
A1B Baseline<br />
Weather<br />
196. Potential climate change impacts: climate change and climate variability will affect irrigated<br />
agriculture, installed power capacity, drought frequency and duration, flood frequency, water supply,<br />
and urban drainage.<br />
197. Approach and methodology: the calibrated SWAT model was used to run the climate<br />
change scenarios. For the analysis the weather conditions of the present and future have been<br />
provided by the IITM Pune 53 at daily interval and at a resolution of about 50 km. Simulated climate<br />
outputs from PRECIS for present (1961–1990, BL) near term (2021-2050, MC) and long term (2071-<br />
2098, EC) for A1B SRES scenario Boundary conditions for the RCM were from one realisation of the<br />
Hadley Centre HADCM3 QUMP (Quantifying Uncertainty in Model Predictions) ensemble (Q14).<br />
198. The SWAT model has been used to determine present water availability in space and time<br />
without incorporating any man made changes like dams, diversions, etc. The same framework was<br />
then used to predict the impact of climate change on the water resources with the assumption that the<br />
land use does not change over time. A total of 90 years of simulation was conducted; 30 years<br />
belonging to IPCC SRES A1B baseline (BL), 30 years belong to IPCC SRES A1B near term or mid-<br />
53 PRECIS (Providing Regional Climate for Impact Studies) is the Hadley Centre portable regional climate model,<br />
developed to run on a PC with a grid resolution of 0.44° x 0.44°. PRECIS simulation datasets is provided by<br />
the Indian Institute of Tropical Meteorology, Pune
Support to the National Water Mission NAPCC<br />
Appendix 3 <strong>Kshipra</strong> <strong>Sub</strong> <strong>Basin</strong><br />
century (MC) climate scenario and 30 years belong to IPCC SRES A1B long term or end-century (EC)<br />
climate scenario.<br />
199. Projected changes in precipitation in the <strong>Kshipra</strong> catchment have been discussed as part of the<br />
climatic assessment reported in section III of this report. The detailed outputs of the SWAT<br />
hydrological model were analysed with respect to the two major water balance components of water<br />
yield and actual evapotranspiration. These are significantly influenced by the intensity and temporal<br />
distribution of precipitation, and by the weather conditions dictated by temperature and allied<br />
parameters. All the analyses have been performed by aggregating the inputs/outputs at the sub-basin<br />
level that are the natural boundaries controlling the hydrological processes.<br />
200. Analysis of Change in Water balance components: the outputs have been analyzed with<br />
respect to the baseline considering possible impacts on the runoff, baseflow, actual evapotranspiration<br />
and ground water recharge to mid-century and end-century. Table 43 gives the summary of changes<br />
in water balance components as percentage of the change in precipitation from baseline to mid<br />
century.<br />
201. The PRECIS A1B scenario indicates an increase in annual precipitation in the <strong>Kshipra</strong> basin of<br />
about 16% by mid-century. The model results indicate that around 83% of this increase in precipitation<br />
will get converted to runoff. Baseflow which contributes to stream flow during dry periods will increase<br />
by 4%. An increase in aquifer recharge of 17% is projected, and a decrease in evapotranspiration of<br />
4% is projected.<br />
202. Figure 58 shows the distribution of the major water balance components expressed in terms of<br />
percentage change to mid-century. The figure also shows the change in water balance component<br />
averaged over the entire basin expressed as a depth (mm) in bar chart form.<br />
203. Precipitation changes vary locally in magnitude, sign, and seasonal details for the <strong>Kshipra</strong><br />
basin. Seasonal changes in precipitation and its effect on water balance components obtained from<br />
the SWAT model for the A1B scenario are included for JJAS (southwest monsoon) and OND (North<br />
east monsoon) in Table 43. There is an increase in JJAS precipitation in the <strong>Kshipra</strong> basin of about<br />
23% by mid-century. The model results indicate that around 70% of this increase in precipitation will<br />
get converted to runoff and 4% to baseflow. Aquifer recharge increases by 29% and<br />
evapotranspiration decreases by 4%.<br />
204. Figure 59 shows the change in the major water balance components expressed in terms of<br />
percentage for the JJAS season to mid-century. From Figure 59 it can be seen that most of the<br />
increased precipitation forms runoff and groundwater recharge. The indication is that in parts of the<br />
basin surface runoff would double under the A1B scenario. This should be treated as a very optimistic<br />
projection from a water resources perspective, but would offer opportunities for increased water<br />
harvesting and groundwater recharge. A concern should be the potential impact on drainage and on<br />
flood risk. Clearly this should be investigated further, and drainage design criteria reviewed. The bar<br />
chart depicts the water balance component averaged over the entire basin and expressed as a depth<br />
(mm).<br />
Table 43: Summary of Change in water balance ++ expressed as percent change in precipitation<br />
Scenario/Season Precipitation Evapotranspiration Surface<br />
Runoff<br />
Baseflow+ Total<br />
Water<br />
Yield*<br />
Avg Annual (A1B-<br />
Baseline)<br />
883 699 180 42 222 354<br />
Avg Annual (A1B-<br />
Mid Century)<br />
1023 694 297 47 345 378<br />
Percent Change 16<br />
in precipitation<br />
Net change (mm) 141 -6 117 6 122 25<br />
Change (%)*** -4 83 4 87 17<br />
Avg JJAS (A1B-<br />
Baseline)<br />
745 274 155 17 173 311<br />
Avg JJAS (A1B- 918 266 275 25 300 362<br />
92<br />
Ground<br />
Recharge**
Support to the National Water Mission NAPCC<br />
Appendix 3 <strong>Kshipra</strong> <strong>Sub</strong> <strong>Basin</strong><br />
Mid Century)<br />
Percent Change 23<br />
in precipitation<br />
Net change (mm) 173 -7 120 8 128 51<br />
Change (%)*** -4 70 4 74 29<br />
Avg OND (A1B-<br />
Baseline)<br />
68 120 19 19 38 12<br />
Avg OND (A1B-<br />
Mid Century)<br />
55 133 20 22 42 3<br />
Percent Change -19<br />
in precipitation<br />
Net change (mm) -13 13 1 3 3 -9<br />
Change (%)*** -100 -6 -20 -27 67<br />
+: Baseflow: contributes to stream flow during non rainy period<br />
* Water Yield (streamflow): surface runoff+baseflow+lateral flow<br />
** Groundwater Recharge: shallow and deep aquifer recharge<br />
***Distribution of water balance components as percentage of change in precipitation<br />
++ All units are in millimetres<br />
93
Support to the National Water Mission NAPCC<br />
Appendix 3 <strong>Kshipra</strong> <strong>Sub</strong> <strong>Basin</strong><br />
Figure 58: Change in Annual Water Balance to Mid Century<br />
94
Support to the National Water Mission NAPCC<br />
Appendix 3 <strong>Kshipra</strong> <strong>Sub</strong> <strong>Basin</strong><br />
Figure 59 Change in JJAS Water Balance to Mid Century<br />
95
Support to the National Water Mission NAPCC<br />
Appendix 3 <strong>Kshipra</strong> <strong>Sub</strong> <strong>Basin</strong><br />
Figure 60 Change in OND Water Balance to Mid Century<br />
96
Support to the National Water Mission NAPCC<br />
Appendix 3 <strong>Kshipra</strong> <strong>Sub</strong> <strong>Basin</strong><br />
205. During the Rabi season (OND), precipitation is projected to decrease by 13% by mid-century<br />
under the A1B scenario, resulting in a 67% decrease in ground water recharge. Evapotranspiration is<br />
projected to increase and base flow is projected to decrease. Figure 60 presents the changes in water<br />
balance components in percentage form. Average changes over the basin are included in a bar chart<br />
and expressed as depths (mm). During this season changes appear large when expressed in<br />
percentage terms, but the changes are to small numbers.<br />
206. Annual average streamflow is projected to increase because of climate change, with the largest<br />
increase occurring in southwest monsoon period (JJAS). There is a reduction during northeast<br />
monsoon (OND). The disproportionate change in average annual streamflow relative to the increase in<br />
average annual precipitation, can be attributed to more precipitation falling on saturated soils. Increase<br />
in evapotranspiration is more during northwest monsoon period (OND). The bar chart depicts the<br />
water balance component averaged over the entire basin as depth in mm, as a result of decrease in<br />
rainfall by 13 mm<br />
207. Drought analysis: Drought indices are widely used for the assessment of drought severity by<br />
indicating relative dryness or wetness effecting water sensitive economies. The Palmer Drought<br />
Severity Index (PDSI) is one such widely used index that incorporates information on rainfall, landuse,<br />
and soil properties in a lumped manner (Palmer, 1965 54 ). The Palmer index categorize drought<br />
into different classes. PDSI value below 0.0 indicates the beginning of drought situation and with a<br />
value below -3.0 as severe drought condition.<br />
208. A soil moisture index has been developed (Narasimhan and Srinivasan, 2005 55 ) to monitor<br />
drought severity using SWAT output to incorporate the spatial variability. This has been used to focus<br />
on agricultural drought where severity implies cumulative water deficiency. Weekly information has<br />
been derived using daily SWAT outputs which in turn have been used for subsequent analysis of<br />
drought severity.<br />
209. The severity of drought is proportional to the relative change in climate. For example, if a<br />
climate that usually has very nominal deviations from the normal even experiences a moderate dry<br />
period, the effects could be quite dramatic. On the other hand, a very dry period would be needed in a<br />
climate that is used to large variations to produce equally dramatic effects. In the current context scale<br />
1 (Index between 0 to -1) represent the drought developing stage and scales 2 (Index between -1 to -<br />
4) represent mild to moderate and extreme drought conditions.<br />
210. For the present study, the Soil Moisture Deficit Index (SMDI) was calculated for 30 years of<br />
simulated soil moisture data from baseline (1961-1990), MC (2021-2050) and EC (2071-2098). Weeks<br />
when the soil moisture deficit may start drought development (drought index value between 0 to -1) as<br />
well as the areas which may fall under moderate to extreme drought conditions (drought index value<br />
between -1 to -4) have been assessed and are shown in Figure 61.. The indication is that the number<br />
of mild developing drought weeks decreases over most of the area to mid-century, but then increases<br />
a little towards to end-century. The number of severe drought weeks on the other hand increases a<br />
little to mid-century, and significantly to end-century. This is indicative of greater variability in climatic<br />
conditions. Thus while on average the water resource situation is projected to improve under the A1B<br />
scenario with higher average rainfall, droughts will be more severe when they do occur.<br />
211. The concept of a drought week is reflective of the change in the normal moisture condition of a<br />
location. In this sense, if a dry or desert area is analysed which has uniform conditions over a long<br />
period, it shall declare all the weeks to be normal weeks since there is no change in the character of<br />
the area on the basis of the conditions prevalent in the specific week of the year over a long period<br />
e.g., 30 years.<br />
54<br />
Palmer, W.C., 1965. Meteorological drought. Research Paper 45. U.S. Department of Commerce, Weather<br />
Bureau, Washington, D.C. 58pp.<br />
55<br />
Narasimhan, B. and Srinivasan, R., 2005. <strong>Development</strong> and evaluation of Soil Moisture Deficit Index (SMDI)<br />
and Evapotranspiration Deficit Index (ETDI) for agricultural drought monitoring, Agricultural and Forest<br />
Meteorology 133 (2005) 69–88<br />
97
Support to the National Water Mission NAPCC<br />
Appendix 3 <strong>Kshipra</strong> <strong>Sub</strong> <strong>Basin</strong><br />
Figure 61: Change in Monsoon Drought Weeks with Respect to Baseline<br />
212. Changes in flood discharges: An assessment has been made of changes in simulated<br />
maximum daily discharges for each sub-basin. Analysis was directed at identifying the basins where<br />
flooding conditions may deteriorate under the A1B scenario. Changes in the magnitude of flood peaks<br />
above 99 th percentile flow for baseline (1961-1990), MC (2021-2050) and EC (2071-2098) are shown<br />
in Figure 24. Very significant increases are indicated, with the majority of basins showing increases in<br />
flood flows of between 45% and 100%. This could have a significant implication for existing<br />
infrastructure such as dams, bridges, roads, etc., and will require appropriate adaptation measures to<br />
be taken up. The situation changes to certain extent towards the end-century where the extent of<br />
increase reduces to around 45 to 65% for the majority of the area. While these changes in runoff<br />
response are based on one climate scenario, it is clear that attention must be given to drainage design<br />
and flood mitigation design criteria.<br />
98
Support to the National Water Mission NAPCC<br />
Appendix 3 <strong>Kshipra</strong> <strong>Sub</strong> <strong>Basin</strong><br />
213. Figure 62 also shows the changes discharge at non-exceedance probabilities of 25% and 10%,<br />
from baseline to mid-century and end-century <strong>Kshipra</strong> Flows at 25% and 10% non-exceedance<br />
probability show an increase, indicating increased flow reliability.<br />
Figure 62: Annual Average Flow Dependability towards 2030s and 2080s with respect to 1970s<br />
99
100
101