Hyperbaric Oxygen Therapy - Hyperbaric Chamber Information ...
Hyperbaric Oxygen Therapy - Hyperbaric Chamber Information ...
Hyperbaric Oxygen Therapy - Hyperbaric Chamber Information ...

You also want an ePaper? Increase the reach of your titles
YUMPU automatically turns print PDFs into web optimized ePapers that Google loves.
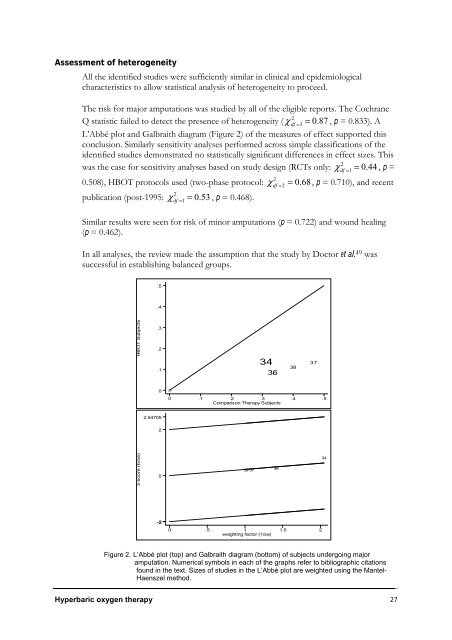
Assessment of heterogeneity<br />
All the identified studies were sufficiently similar in clinical and epidemiological<br />
characteristics to allow statistical analysis of heterogeneity to proceed.<br />
The risk for major amputations was studied by all of the eligible reports. The Cochrane<br />
2<br />
Q statistic failed to detect the presence of heterogeneity ( χ df = 3 = 0.<br />
87 , p = 0.833). A<br />
L’Abbé plot and Galbraith diagram (Figure 2) of the measures of effect supported this<br />
conclusion. Similarly sensitivity analyses performed across simple classifications of the<br />
identified studies demonstrated no statistically significant differences in effect sizes. This<br />
2<br />
was the case for sensitivity analyses based on study design (RCTs only: χ df = 1 = 0.<br />
44 , p =<br />
2<br />
0.508), HBOT protocols used (two-phase protocol: χ df = 2 = 0.<br />
68,<br />
p = 0.710), and recent<br />
2<br />
publication (post-1995: χ 0.<br />
53 , p = 0.468).<br />
df = 1 =<br />
Similar results were seen for risk of minor amputations (p = 0.722) and wound healing<br />
(p = 0.462).<br />
In all analyses, the review made the assumption that the study by Doctor et al. 49 was<br />
successful in establishing balanced groups.<br />
HBOT Subjects<br />
z-score (b/se)<br />
.5<br />
.4<br />
.3<br />
.2<br />
.1<br />
0<br />
2.54705<br />
2<br />
0<br />
-2<br />
35<br />
34<br />
36<br />
0 .1 .2 .3 .4 .5<br />
Comparison <strong>Therapy</strong> Subjects<br />
.<br />
0 .5 1<br />
weighting factor (1/se)<br />
1.5 2<br />
Figure 2. L’Abbé plot (top) and Galbraith diagram (bottom) of subjects undergoing major<br />
amputation. Numerical symbols in each of the graphs refer to bibliographic citations<br />
found in the text. Sizes of studies in the L’Abbé plot are weighted using the Mantel-<br />
Haenszel method.<br />
<strong>Hyperbaric</strong> oxygen therapy 27<br />
38 37<br />
36<br />
38<br />
37<br />
34