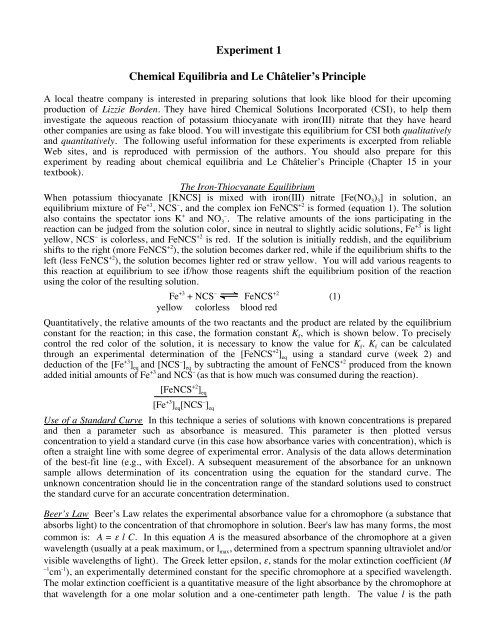
Experiment 1 Chemical Equilibria and Le Châtelier's Principle
Experiment 1 Chemical Equilibria and Le Châtelier's Principle
Experiment 1 Chemical Equilibria and Le Châtelier's Principle

Create successful ePaper yourself
Turn your PDF publications into a flip-book with our unique Google optimized e-Paper software.
<strong>Experiment</strong> 1<br />
<strong>Chemical</strong> <strong>Equilibria</strong> <strong>and</strong> <strong>Le</strong> Châtelier’s <strong>Principle</strong><br />
A local theatre company is interested in preparing solutions that look like blood for their upcoming<br />
production of Lizzie Borden. They have hired <strong>Chemical</strong> Solutions Incorporated (CSI), to help them<br />
investigate the aqueous reaction of potassium thiocyanate with iron(III) nitrate that they have heard<br />
other companies are using as fake blood. You will investigate this equilibrium for CSI both qualitatively<br />
<strong>and</strong> quantitatively. The following useful information for these experiments is excerpted from reliable<br />
Web sites, <strong>and</strong> is reproduced with permission of the authors. You should also prepare for this<br />
experiment by reading about chemical equilibria <strong>and</strong> <strong>Le</strong> Châtelier’s <strong>Principle</strong> (Chapter 15 in your<br />
textbook).<br />
The Iron-Thiocyanate Equilibrium<br />
When potassium thiocyanate [KNCS] is mixed with iron(III) nitrate [Fe(NO3) 3] in solution, an<br />
equilibrium mixture of Fe +3 , NCS – , <strong>and</strong> the complex ion FeNCS +2 is formed (equation 1). The solution<br />
also contains the spectator ions K + –<br />
<strong>and</strong> NO3 . The relative amounts of the ions participating in the<br />
reaction can be judged from the solution color, since in neutral to slightly acidic solutions, Fe +3 is light<br />
yellow, NCS – is colorless, <strong>and</strong> FeNCS +2 is red. If the solution is initially reddish, <strong>and</strong> the equilibrium<br />
shifts to the right (more FeNCS +2 ), the solution becomes darker red, while if the equilibrium shifts to the<br />
left (less FeNCS +2 ), the solution becomes lighter red or straw yellow. You will add various reagents to<br />
this reaction at equilibrium to see if/how those reagents shift the equilibrium position of the reaction<br />
using the color of the resulting solution.<br />
Fe +3 + NCS – FeNCS +2<br />
yellow colorless blood red<br />
Quantitatively, the relative amounts of the two reactants <strong>and</strong> the product are related by the equilibrium<br />
constant for the reaction; in this case, the formation constant Kf, which is shown below. To precisely<br />
control the red color of the solution, it is necessary to know the value for Kf. Kf can be calculated<br />
through an experimental determination of the [FeNCS +2 ] eq using a st<strong>and</strong>ard curve (week 2) <strong>and</strong><br />
deduction of the [Fe +3 ] eq <strong>and</strong> [NCS – ] eq by subtracting the amount of FeNCS +2 produced from the known<br />
added initial amounts of Fe +3<br />
<strong>and</strong> NCS –<br />
(as that is how much was consumed during the reaction).<br />
[FeNCS +2 ] eq<br />
[Fe +3 ] eq[NCS – ] eq<br />
Use of a St<strong>and</strong>ard Curve In this technique a series of solutions with known concentrations is prepared<br />
<strong>and</strong> then a parameter such as absorbance is measured. This parameter is then plotted versus<br />
concentration to yield a st<strong>and</strong>ard curve (in this case how absorbance varies with concentration), which is<br />
often a straight line with some degree of experimental error. Analysis of the data allows determination<br />
of the best-fit line (e.g., with Excel). A subsequent measurement of the absorbance for an unknown<br />
sample allows determination of its concentration using the equation for the st<strong>and</strong>ard curve. The<br />
unknown concentration should lie in the concentration range of the st<strong>and</strong>ard solutions used to construct<br />
the st<strong>and</strong>ard curve for an accurate concentration determination.<br />
Beer’s Law Beer’s Law relates the experimental absorbance value for a chromophore (a substance that<br />
absorbs light) to the concentration of that chromophore in solution. Beer's law has many forms, the most<br />
common is: A = ε l C. In this equation A is the measured absorbance of the chromophore at a given<br />
wavelength (usually at a peak maximum, or l max, determined from a spectrum spanning ultraviolet <strong>and</strong>/or<br />
visible wavelengths of light). The Greek letter epsilon, ε, st<strong>and</strong>s for the molar extinction coefficient (M<br />
–1 cm -1 ), an experimentally determined constant for the specific chromophore at a specified wavelength.<br />
The molar extinction coefficient is a quantitative measure of the light absorbance by the chromophore at<br />
that wavelength for a one molar solution <strong>and</strong> a one-centimeter path length. The value l is the path<br />
(1)
2<br />
CH 142- <strong>Experiment</strong> 1- Spring 2012<br />
length, or the distance the light travels through the solution in the cuvette (container) used for the<br />
absorbance measurement. Lastly, C is the molar concentration of the chromophore (mol/L) used for the<br />
measurement. Beer's law says that the relationship between the absorbance of the chromophore <strong>and</strong> its<br />
concentration is linear, allowing construction of a st<strong>and</strong>ard curve by plotting absorbance versus<br />
concentration, such as shown in Figure 1. This particular curve is most reliable for absorbance values<br />
between 0.0 -1.0. The concentration for an unknown solution can be determined by measuring its<br />
absorbance first. Then use the known absorbance value <strong>and</strong> the equation for the st<strong>and</strong>ard curve to solve<br />
for x, the concentration.<br />
Figure 1. Absorbance vs. concentration (M) of a chromophore.
Pre-Laboratory Assignment<br />
3<br />
CH 142- <strong>Experiment</strong> 1- Spring 2012<br />
Week 1: Buy your lab notebook (see Lab Syllabus for specific requirements). This week (<strong>and</strong> every<br />
week), come to lab with a h<strong>and</strong> written outline of the experimental procedure in your lab<br />
notebook.<br />
Week 2: In addition to the usual outline of the procedure in your lab notebook, please answer the<br />
following questions. Due before 9 AM, Fri., Feb. 10 th (in white bookcase by Keyes 310).<br />
A. Calculate the concentrations of NCS - <strong>and</strong> Fe +3 in each of the following solutions. Note that the final<br />
total volume is 10.0 mL in each case due to the addition of H 2O. As always, all work must be shown<br />
to receive full credit. Watch those units <strong>and</strong> sig figs.<br />
volume 0.0020 M KNCS (mL) volume 0.0020 M Fe(NO 3) 3 (mL) total solution volume (mL)<br />
1.0 5.0 10.0<br />
2.5 5.0 10.0<br />
B. 1. Construct a st<strong>and</strong>ard curve in Excel using the following data (<strong>and</strong> 0.0 micromolar concentration<br />
gives 0.000 absorbance) based on the absorbance at 275 nm of protein sample. Print your graph once<br />
it is titled (Y vs X), includes the equation of the line <strong>and</strong> the R 2 value, has a label for each axis <strong>and</strong><br />
includes any appropriate units.<br />
2. Use this graph to determine the unknown concentrations of two samples of the protein, showing<br />
your work.<br />
3. Would you expect these determinations to be accurate or not? Explain your answer.<br />
Concentration of Protein Sample Absorbance at 275 nm<br />
2.0 micromolar 0.460<br />
1.0 micromolar 0.251<br />
0.50 micromolar 0.117<br />
0.20 micromolar 0.067<br />
unknown concentration 1 0.178<br />
unknown concentration 2 0.603
<strong>Experiment</strong>al Procedure- Week 1, Feb. 6 th -10 th<br />
Fe<br />
4<br />
+3 -2 +<br />
+ HPO4 FeHPO4<br />
CH 142- <strong>Experiment</strong> 1- Spring 2012<br />
For each of the external stresses described below, necessary information is provided regarding the<br />
manner in which one or more of the chemical species is affected. You will use a spot plate containing<br />
multiple wells <strong>and</strong> use a different well for each of the operations described, recording your observations<br />
of the color change of the solution.<br />
In the Data section of your lab book, create a detailed table summarizing your observations for each<br />
of the reactions that you’ll perform (see below) on the iron-thiocyanate equilibrium. As an example, if<br />
you added a drop of concentrated HCl to the st<strong>and</strong>ard solution, the blood-red color would lighten or<br />
perhaps even disappear altogether. This indicates that the FeNCS +2 concentration has decreased. To<br />
explain this result, it is necessary to know that in the presence of a large excess of Cl - , Fe +3 forms<br />
complex ions:<br />
Fe +3 + 6 Cl -<br />
-3<br />
FeCl6 This change reduces the Fe +3 concentration, so in accord with <strong>Le</strong> Chatelier’s <strong>Principle</strong>, some FeNCS +2<br />
dissociates to replace some of the Fe +3 removed by reaction with Cl - . This would be summarized in your<br />
lab book as follows:<br />
Stress Observation Reactions of Interest Explanation<br />
+1 drop soln turned yellow Fe<br />
HCl (the original red<br />
(6 M) color went away)<br />
+3 + NCS – ß FeNCS +2<br />
Fe +3 + 6 Cl – –3<br />
à FeCl6 A. Operations to Introduce an External Stress- Record all observations in your data table.<br />
1. Add one drop each of 1 M Fe(NO 3) 3 <strong>and</strong> 1 M KNCS to 25 mL of distilled water. Mix well.<br />
2. Add a few drops of this solution to each of seven wells of a spot plate. One well will serve as a color<br />
st<strong>and</strong>ard against which to judge color changes in the other wells. The other six wells will be for<br />
performing your operations to introduce an external stress. Record the appearance of the reaction<br />
before adding stress.<br />
3. Add one drop of 1 M Fe(NO 3) 3 to one of the wells, mix, <strong>and</strong> observe. Record observation.<br />
4. Add one drop of 1 M KNCS to a second well, mix, <strong>and</strong> record observation.<br />
5. Add one drop of 0.1M SnCl 2 to a third well, mix, <strong>and</strong> record observation. Tin(II) ions reduce<br />
iron(III) ions to iron(II) ions:<br />
Sn +2 + 2 Fe +3 Sn +4 + 2 Fe +2<br />
6. Add one drop of 0.1 M AgNO 3 to a fourth well, mix, <strong>and</strong> record observation. Silver ions react with<br />
thiocyanate ions to give a white precipitate of silver thiocyanate:<br />
Ag + + NCS -<br />
AgNCS(s)<br />
Equilibrium shifted left in<br />
response to a decrease in<br />
[Fe +3 ], which was removed<br />
by its reaction with Cl – .<br />
7. Add one drop of 0.1 M Na 2HPO 4 to a fifth well, mix, <strong>and</strong> record observation. Hydrogen phosphate<br />
ions form a complex ion with iron(III) ions:
5<br />
CH 142- <strong>Experiment</strong> 1- Spring 2012<br />
8. Add one drop of 1 M NH 3 to a sixth well, mix, <strong>and</strong> record observation. Any base will form a<br />
precipitate or a colloidal suspension of iron(III) hydroxide when mixed with iron(III) ions:<br />
+ -<br />
NH3 + H2O NH4 + OH<br />
Fe +3<br />
+ 3 OH- Fe(OH) 3 (s)<br />
B. Effect of Heat on the Equilibrium- Also record your observations in the data table.<br />
1. Pour about 4-5 mL of the iron-thiocyanate solution made earlier into three test tubes. Set one tube<br />
aside as a color st<strong>and</strong>ard against which to judge color changes in the other tubes.<br />
2. Gently warm one tube in a hot water bath but don’t boil the solution. Record observation.<br />
3. Take the hot tube <strong>and</strong> stick it into an ice bath, along with an unheated tube of solution. Observe all<br />
three tubes <strong>and</strong> note how they compare. Is the reaction reversible? Do these results indicate that the<br />
forward reaction is exothermic or endothermic? Make notes to help you report back to the client on<br />
the significance of what you’ve seen today.<br />
<strong>Experiment</strong>al Procedure- Week 2, Feb. 13 th -17 th<br />
Last week’s phase of the experiment was qualitative, relying on the observation of color changes by<br />
eye, but this week you will be measuring the amount of color with a spectrophotometer. For this type of<br />
quantitative analysis, you need to be as exact as possible about the volumes that you measure. You will<br />
use 10.00 mL volumetric flasks to make up your solutions- with a volumetric flask you bring the total<br />
volume up to the white line to achieve a very accurate final volume. You will use automatic<br />
micropipettors to obtain known amounts of the reagents which are then dispensed into the volumetric<br />
flasks. Although many of you may have used these before in Biology laboratories, a few notes on their<br />
proper use follows. You will use a 200-1000 µL Finnpipette that we recommend setting to “500”- this is<br />
500 µL or 0.5 mL. By dispensing 0.5 mL portions, you can conveniently add 0.5 mL, 1 mL, 1.5 mL, <strong>and</strong><br />
so on by simply making multiple additions. Please make sure that you never dial the pipettor past the<br />
maximum volume, in this case 1000 µL. To draw up the sample into the pipette tip, first place a clean tip<br />
on your pipette. Pour some reagent into the provided beaker. Push the top pipette button downwards<br />
until you feel it catch on a notch, immerse the pipette tip in the sample, <strong>and</strong> slowly release the pressure<br />
you are exerting on the button. Check the tip to make sure you didn’t capture any air bubbles. To<br />
dispense the sample, push the button all the way down. You can keep a pipette tip in the beaker <strong>and</strong> use<br />
it over <strong>and</strong> over. Each solution beaker can have one pipette tip <strong>and</strong> you’ll be helping CSI to be green. If<br />
you have any questions about the micropipettors, please ask your instructor or student assistant<br />
before use. Micropipettors can be severely damaged if they are incorrectly used.<br />
A. Determination of the Wavelength of Maximal Absorbance of the FeNCS +2 Ion<br />
You will establish a st<strong>and</strong>ard curve to calibrate the absorbance-concentration dependence of the<br />
FeNCS +2 complex ion, but first you will need to determine the wavelength of maximal absorbance of the<br />
chromophore using the spectrophotometers. Refer to the “Spectrophotometer” h<strong>and</strong>out (provided at each<br />
instrument) for detailed instructions on the use of these instruments. These very small<br />
spectrophotometers are interfaced to the computers in the laboratory for data acquisition during this<br />
experiment <strong>and</strong> <strong>Experiment</strong> II.
6<br />
CH 142- <strong>Experiment</strong> 1- Spring 2012<br />
1. Using your 10-mL volumetric flask, prepare 10.0 mL of an iron-thiocyanate solution containing 1.00<br />
mL of 0.200 M Fe(NO 3) 3 <strong>and</strong> 2.00 mL of 0.00200 M KNCS. Use the micropipettes to measure these<br />
volumes once you have poured the liquid into a beaker. ONLY pipette from beakers, never from<br />
bottles!<br />
Carefully add enough distilled H 2O to the flask to bring the final volume to the white etched line on<br />
the flask. Fill a cuvette three-quarters full with this solution. Be sure to wipe the cuvette with a<br />
Kimwipe to remove fingerprints.<br />
2. Blank the spectrophotometer according to the h<strong>and</strong>out. Use 0.200 M Fe(NO 3) 3 alone as your<br />
reference solution in its own cuvette.<br />
3. Determine the wavelength of maximal absorbance (the λ max) for the FeNCS +2 solution <strong>and</strong> use this<br />
wavelength in subsequent absorbance measurements. If the peak has an absorbance that is greater<br />
than about 2, the peak may be somewhat flattened or “off-scale.” In this case, it may be difficult to<br />
determine exactly what wavelength is the λ max. You should therefore dilute the solution with water<br />
(by a known factor) until the absorbance reading is on scale. Record the absorbance reading- you can<br />
use this as one of the data points for your st<strong>and</strong>ard curve.<br />
B. Generation of the St<strong>and</strong>ard Curve<br />
Ideally, for a good st<strong>and</strong>ard curve, the absorbance readings should be in the range of about 0.01->1.8 (an<br />
absorbance of 2 corresponds to 99% of the light being absorbed, which is at the upper limit of what can<br />
be measured accurately). You will have to select an appropriate range of FeNCS +2 concentrations based<br />
on your observations from Part A. You will use a large excess of Fe +3 ion, which will drive the reaction<br />
to completion. Thus, you can assume that the final FeNCS +2 concentration is equal to the initial<br />
concentration of KNCS, as the KNCS is the limiting reagent. Note that the Fe(NO 3) 3 solution is made up<br />
to include HNO 3 at a final concentration of 0.0100 M to prevent the formation of other iron complexes<br />
that may exist in the presence of base, but you do not have to account for this in any of your<br />
calculations.<br />
1. Prepare five more solutions in 10-mL volumetric flasks containing varying concentrations of<br />
FeNCS +2 in a total final volume of 10.00 mL. Each solution should contain 1.00 mL of 0.200 M<br />
Fe(NO 3) 3 <strong>and</strong> known, varying amounts of 0.00200 M KNCS. Add water to bring the final volume to<br />
10.0 mL in each case. We recommend that in all cases your final concentration of KNCS is no<br />
higher than 0.8 mM, or the sample is likely to have an off-scale absorbance reading.<br />
2. Take the absorbance at the wavelength determined in Part A for each of the solutions. If the<br />
absorbance readings are not within appropriate limits, make up more solutions until you have at least<br />
six concentrations that are within the 0.01 – 1.8 absorbance range.<br />
3. Construct a st<strong>and</strong>ard curve using Excel as described in the Data Analysis section. Save & print the<br />
curve & data table for your client report.<br />
C. Determination of the K f<br />
You will now make up a solution containing constant amounts of Fe +3 <strong>and</strong> varying amounts of NCS -<br />
<strong>and</strong> use the st<strong>and</strong>ard curve to determine the final FeNCS +2 concentration based on the measured<br />
absorbance. This will allow you to calculate K f.
7<br />
CH 142- <strong>Experiment</strong> 1- Spring 2012<br />
1. Mix five combinations of Fe +3 <strong>and</strong> NCS - each in a total final volume of 10.00 mL. For each, use 5.00<br />
mL of 0.00200 M Fe(NO 3) 3 [this is a different solution than the one used above!], <strong>and</strong> known,<br />
varying amounts of the 0.00200 M KNCS, making up the total volume with water.<br />
2. Determine the absorbance of the FeNCS +2 complex ion for each solution after blanking appropriately<br />
(WHAT SHOULD YOUR REAGENT BLANK BE THIS TIME? THINK CAREFULLY.). Use the<br />
st<strong>and</strong>ard curve generated in Part B to convert the absorbance value into a concentration. This<br />
concentration reflects the [FeNCS +2 ] eq. Remember that your absorbance values should lie on the<br />
st<strong>and</strong>ard curve for best accuracy. If some of your trials are off the st<strong>and</strong>ard curve, make up new<br />
solutions until you have at least five absorbances that are on your st<strong>and</strong>ard curve, besides the blank.<br />
Data Analysis<br />
• In Excel, construct a st<strong>and</strong>ard curve of absorbance versus [FeNCS +2 ] (mol/L) for your st<strong>and</strong>ard<br />
solutions of Part B. Remember that in Excel the first data column corresponds to X <strong>and</strong> the second<br />
corresponds to Y; thus, your first column should be concentration, not absorbance. Note that [0, 0]<br />
should be included as a data point. Determine the equation of the best-fit line <strong>and</strong> the R 2 value. Make<br />
sure that you print your st<strong>and</strong>ard curve <strong>and</strong> have it to attach to your client report. Don’t forget to<br />
have axes labeled, including units (<strong>and</strong> in this case include what specific wavelength was used). The<br />
convention for a graph title is “what’s on Y axis” vs. “what’s on X axis”.<br />
• From the st<strong>and</strong>ard curve, calculate the [FeNCS +2 ] eq for each of your trials of Part C.<br />
• Use the stoichiometry of the FeNCS +2 complex ion formation to determine how much of each<br />
reactant was consumed <strong>and</strong> what the corresponding equilibrium concentrations of Fe +3 <strong>and</strong> NCS -<br />
would be for your five trials of Part C.<br />
• Use the equilibrium values of the [Fe +3 ], [NCS - ], <strong>and</strong> [FeNCS +2 ] to calculate K f as in equation (2)<br />
above for each of your solutions. Calculate an average K f, , the st<strong>and</strong>ard deviation, the relative<br />
st<strong>and</strong>ard deviation, <strong>and</strong> the % precision for your trials of Part C. You may wish to refer to the Error<br />
Analysis (found on lab web page) for information on the relative st<strong>and</strong>ard deviation.<br />
Client Report<br />
Prepare a ONE-PAGE typed letter for the theatre client that hired you, summarizing your findings.<br />
You should attach to this letter all spreadsheets, graphs, <strong>and</strong> tables that you used to make your findings.<br />
You want to include both your qualitative <strong>and</strong> quantitative findings. Make sure that your report is at an<br />
appropriate level for your audience: in this case, the highly intelligent props manager at the theatre<br />
company who has not seen any chemistry since high school. Include a description of the underlying<br />
principle that explains the shift of the iron-thiocyanate reaction in terms of a response to the particular<br />
stress that was added. Using this theory, hypothesize whether the reaction is endothermic or exothermic<br />
<strong>and</strong> how the temperature of the theatre or of Lizzie Borden’s victims could affect the equilibrium. Make<br />
sure that you include an error analysis in your report. Remember your Lab Syllabus gives you a<br />
guideline for the Client Report. Your success on reporting the findings to this client will likely bring<br />
CSI more business <strong>and</strong> recognition for your starring role!