The exercise of judicial discretion in rent arrears cases - Sheffield ...
The exercise of judicial discretion in rent arrears cases - Sheffield ...
The exercise of judicial discretion in rent arrears cases - Sheffield ...

Create successful ePaper yourself
Turn your PDF publications into a flip-book with our unique Google optimized e-Paper software.
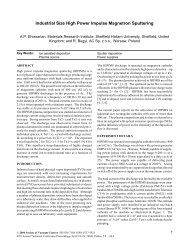
Chart 2: Requests and outcomes Chart 3: Requests and outcomes<br />
<strong>in</strong> London court (n=363) <strong>in</strong> West Country court (n=47)<br />
80%<br />
60%<br />
40%<br />
20%<br />
0%<br />
OPO SPO Adjourn Other<br />
Request<br />
outcome<br />
23<br />
50%<br />
40%<br />
30%<br />
20%<br />
10%<br />
0%<br />
OPO SPO Adjourn Other<br />
Chart 4: Requests and outcomes Chart 5: Requests and outcomes<br />
<strong>in</strong> Northern 1 court (n=61) <strong>in</strong> Northern 2 court (n=69)<br />
50%<br />
40%<br />
30%<br />
20%<br />
10%<br />
0%<br />
OPO SPO Adjourn Other<br />
request<br />
outcome<br />
60%<br />
50%<br />
40%<br />
30%<br />
20%<br />
10%<br />
0%<br />
OPO SPO Adjourn Other<br />
request<br />
outcome<br />
request<br />
outcome<br />
Although the numbers <strong>of</strong> recorded case outcomes are small, and care must therefore be<br />
taken <strong>in</strong> <strong>in</strong>terpret<strong>in</strong>g the data, there do appear to be differences between the courts <strong>in</strong> terms<br />
<strong>of</strong> response to requests made by the claimant landlords. Of the 162 <strong>in</strong>itial hear<strong>in</strong>gs at which<br />
the landlord requested a suspended possession order (SPO), the proportion <strong>of</strong> requests<br />
result<strong>in</strong>g <strong>in</strong> an SPO across all four courts was 69%. However, there was some variation<br />
around this average, as the comparison <strong>of</strong> the above charts makes clear. For example, the<br />
proportion <strong>of</strong> SPOs granted to SPOs requested was lower <strong>in</strong> West Country and London<br />
courts (59% and 60% respectively), whereas <strong>in</strong> Northern 1 and Northern 2 it was higher than<br />
the average (70% and 88%). Where the landlord requested an outright order, the Northern 1<br />
and Northern 2 courts always granted that order <strong>in</strong> our sample, whereas <strong>in</strong> West Country<br />
and London the proportions were lower (73% and 56% <strong>of</strong> requests granted, respectively).<br />
We now consider a number <strong>of</strong> factors, <strong>in</strong>clud<strong>in</strong>g those raised by the focus group participants,<br />
that might be lead<strong>in</strong>g to these differences, <strong>in</strong> both general outcomes and between requests<br />
and outcomes. <strong>The</strong> <strong>in</strong>formation from recorded <strong>cases</strong> is used here to exam<strong>in</strong>e whether these<br />
factors can beg<strong>in</strong> to account for any differences between the four courts. After <strong>in</strong>itial