Homicides, Firearm Offences and Intimate Violence 2007/08 ...
Homicides, Firearm Offences and Intimate Violence 2007/08 ...
Homicides, Firearm Offences and Intimate Violence 2007/08 ...

Create successful ePaper yourself
Turn your PDF publications into a flip-book with our unique Google optimized e-Paper software.
The Research, Development<br />
<strong>and</strong> Statistics Directorate exists<br />
to improve policy making,<br />
decision taking <strong>and</strong> practice<br />
in support of the Home Office<br />
purpose <strong>and</strong> aims, to provide<br />
the public <strong>and</strong> Parliament with<br />
information necessar y for<br />
informed debate <strong>and</strong> to<br />
publish information for future<br />
use.<br />
Statistical Bulletins are<br />
prepared by staff in Home<br />
Office Statistics under the<br />
National Statistics Code of<br />
Practice <strong>and</strong> can be<br />
downloaded from both the UK<br />
Statistics Authority website<br />
<strong>and</strong> the Home Office<br />
Research, Development <strong>and</strong><br />
Statistics website:<br />
www.statistics.gov.uk<br />
www.homeoffice.gov.uk/rds<br />
© Crown Copyright 2009<br />
ISSN 1358-510X<br />
Home Office Statistical Bulletin<br />
<strong>Homicides</strong>, <strong>Firearm</strong> <strong>Offences</strong> <strong>and</strong><br />
<strong>Intimate</strong> <strong>Violence</strong> <strong>2007</strong>/<strong>08</strong><br />
(Supplementary Volume 2 to Crime in Engl<strong>and</strong> <strong>and</strong><br />
Wales <strong>2007</strong>/<strong>08</strong>)<br />
Third Edition<br />
David Povey (Ed.), Kathryn Coleman, Peter Kaiza<br />
<strong>and</strong> Stephen Roe<br />
22 January 2009 02/09
Introduction<br />
This bulletin is one of a series of supplementary volumes that accompany the main <strong>2007</strong>/<strong>08</strong> crime<br />
volume, Crime in Engl<strong>and</strong> <strong>and</strong> Wales <strong>2007</strong>/<strong>08</strong>, which is available at:<br />
(http://www.homeoffice.gov.uk/rds/pdfs<strong>08</strong>/hosb07<strong>08</strong>.pdf )<br />
It contains chapters on homicides <strong>and</strong> firearm offences, which contain mostly statistics of crimes<br />
recorded by the police. Headline figures for both measures were published in the main <strong>2007</strong>/<strong>08</strong><br />
crime volume, but these chapters contain underlying detail that has not been published before.<br />
There is also a chapter on the extent of intimate violence from the <strong>2007</strong>/<strong>08</strong> British Crime Survey<br />
(BCS) self-completion module. BCS figures for overall violence <strong>and</strong> other crime types are reported<br />
in the main <strong>2007</strong>/<strong>08</strong> crime volume.<br />
Acknowledgements<br />
This bulletin has been prepared by staff in the Policing Statistics <strong>and</strong> Crime Surveys programmes<br />
within Home Office Statistics. The staff involved are members of the victimization surveys team <strong>and</strong><br />
Specialist Crime & Police Resources section.<br />
The chapter authors are grateful for the support <strong>and</strong> assistance of other Home Office colleagues<br />
including Alison Walker, Chris Kershaw, John Flatley, Jacqueline Hoare <strong>and</strong> Lucy Dodd.<br />
We would also like to thank colleagues in the Home Office’s Policing Data Collection Section <strong>and</strong><br />
the crime registrars <strong>and</strong> the statistical staff in the police forces of Engl<strong>and</strong> <strong>and</strong> Wales. Thanks also<br />
to all the staff involved in the work on the BCS at BMRB Social Research, the interviewers working<br />
on the BCS <strong>and</strong> the members of the public who kindly agreed to take part in the survey. Finally, we<br />
would also like to thank those colleagues in the Communicate Development Section (CDS) who<br />
assisted in preparing the report.<br />
This bulletin is designated as ‘National Statistics’, a subset of official statistics which have been<br />
granted accreditation by the UK Statistics Authority. National Statistics are produced to high<br />
professional st<strong>and</strong>ards set out in the Code of Practice <strong>and</strong> undergo regular quality assurance<br />
reviews to ensure that they meet customer needs. They are produced free from political<br />
interference.<br />
For further information about the British Crime Survey <strong>and</strong> police recorded crime statistics, please<br />
e-mail crimestats.rds@homeoffice.gsi.gov.uk or write to Home Office Statistics, 5 th Floor, Peel<br />
Building, Home Office, 2 Marsham Street, London, SW1P 4DF.<br />
2
Contents<br />
Contents………………………………………………………………………..........................................3<br />
List of figures <strong>and</strong> tables…………...………………………………………………………………………4<br />
Chapter 1 Homicide....................................................................................................... 9<br />
Kathryn Coleman<br />
Page<br />
1.1 <strong>Offences</strong> initially recorded as homicide................................................... 10<br />
1.2 Victims ................................................................................................. 11<br />
1.3 Suspects ............................................................................................. .14<br />
Chapter 2 Recorded crimes involving firearms ........................................................... 33<br />
Peter Kaiza<br />
2.1 <strong>Firearm</strong> crimes in <strong>2007</strong>/<strong>08</strong> ..................................................................... 34<br />
2.2 How firearms were used........................................................................ 35<br />
2.3 The type of weapon used ..................................................................... 36<br />
2.4 Injuries in crimes involving firearms ........................................................ 37<br />
2.5 The types of crimes where firearms are used.......................................... 39<br />
2.6 Geographical distribution of firearms offences.……………………………… 40<br />
2.7 Robberies……...………………………………………………………………… 41<br />
2.8 Age of victims ….…………………… ..…………………..……………………..42<br />
2.9 Misappropriated (stolen) firearms …........…………………………………….43<br />
Chapter 3 <strong>Intimate</strong> violence: <strong>2007</strong>/<strong>08</strong> British Crime Survey...... …….…………...............55<br />
Stephen Roe<br />
3.1 Introduction ……………………………………………………………… ......... 56<br />
3.2 Prevalence of intimate violence ………………………………………........... 57<br />
3.3 Multiple <strong>and</strong> repeat victimisation……………………………………………… 59<br />
3.4 Nature of sexual assault …………………………………………… .............. 60<br />
3.5 Unequal risk. ........................................................................................ 62<br />
Appendix 1 Glossary.......................................................................................... ……….87<br />
Appendix 2 Bibliography............................................................................................... 93<br />
3
List of figures <strong>and</strong> tables<br />
Chapter 1<br />
Figure 1.1 <strong>Offences</strong> recorded by the police in Engl<strong>and</strong> <strong>and</strong> Wales 1955 to <strong>2007</strong>/<strong>08</strong><br />
Figure 1.2 Percentage of offences currently recorded as homicide, by apparent method of killing<br />
<strong>and</strong> sex of victim, <strong>2007</strong>/<strong>08</strong><br />
Figure 1.3 All victims by relationship of victim to principal suspect, <strong>2007</strong>/<strong>08</strong><br />
Figure 1.4 Victims under 16 years of age, by relationship of victim to suspect, <strong>2007</strong>/<strong>08</strong><br />
Figure 1.5 <strong>Offences</strong> currently recorded as homicide per million population, by age of victim,<br />
<strong>2007</strong>/<strong>08</strong><br />
Figure 1.6 Suspects indicted for homicide by outcome of proceedings, 1997/98 to 20007/<strong>08</strong><br />
Table 1a Outcomes for all suspects, 2003/04 to <strong>2007</strong>/<strong>08</strong><br />
Table 1.01 <strong>Offences</strong> initially recorded by the police as homicide by current classification: Engl<strong>and</strong><br />
<strong>and</strong> Wales 1955 to <strong>2007</strong>/<strong>08</strong><br />
Table 1.02 <strong>Offences</strong> initially recorded as homicide by outcome: Engl<strong>and</strong> <strong>and</strong> Wales 1997/98 to<br />
<strong>2007</strong>/<strong>08</strong><br />
Table 1.03 <strong>Offences</strong> currently recorded as homicide by apparent method of killing <strong>and</strong> sex of<br />
victim: Engl<strong>and</strong> <strong>and</strong> Wales 1997/98 to <strong>2007</strong>/<strong>08</strong><br />
Table 1.04 <strong>Homicides</strong> currently recorded for victims aged under 16 by relationship of victim to<br />
principal suspect: Engl<strong>and</strong> <strong>and</strong> Wales 1997/98 to <strong>2007</strong>/<strong>08</strong><br />
Table 1.05 <strong>Homicides</strong> currently recorded for all victims by relationship of victim to principal<br />
suspect: Engl<strong>and</strong> <strong>and</strong> Wales 1997/98 to <strong>2007</strong>/<strong>08</strong><br />
Table 1.06 <strong>Offences</strong> currently recorded as homicide by apparent circumstances <strong>and</strong> relationship<br />
of victim to principal suspect: Engl<strong>and</strong> <strong>and</strong> Wales 1997/98 to <strong>2007</strong>/<strong>08</strong><br />
Table 1.07 <strong>Offences</strong> currently recorded as homicide by age <strong>and</strong> sex of victim: Engl<strong>and</strong> <strong>and</strong> Wales<br />
1997/98 to <strong>2007</strong>/<strong>08</strong><br />
Table 1.<strong>08</strong> Suspects convicted of homicide by type of homicide: Engl<strong>and</strong> <strong>and</strong> Wales 1969 to<br />
<strong>2007</strong>/<strong>08</strong><br />
Table 1.09 Suspects indicted for homicide by outcome of proceedings: Engl<strong>and</strong> <strong>and</strong> Wales<br />
1997/98 to <strong>2007</strong>/<strong>08</strong><br />
Table 1.10 Suspects convicted of homicide by type of homicide <strong>and</strong> sentence: Engl<strong>and</strong> <strong>and</strong><br />
Wales 1997/98 to <strong>2007</strong>/<strong>08</strong><br />
4
Table 1.11 Suspects convicted of homicide by previous homicide convictions: Engl<strong>and</strong> <strong>and</strong> Wales<br />
1997/98 to <strong>2007</strong>/<strong>08</strong><br />
Table 1.12 Suspects convicted of homicide who had previously been convicted of homicide by<br />
type of homicide: Engl<strong>and</strong> <strong>and</strong> Wales 1997/98 to <strong>2007</strong>/<strong>08</strong><br />
Table 1.13 Currently recorded homicides by region <strong>and</strong> police force area: Engl<strong>and</strong> <strong>and</strong> Wales<br />
2003/04 <strong>and</strong> <strong>2007</strong>/<strong>08</strong><br />
Chapter 2<br />
Figure 2.1 Crimes reported to the police in which a firearm has been used, 1999/00 to <strong>2007</strong>/<strong>08</strong><br />
Figure 2.2 How firearms were used, <strong>2007</strong>/<strong>08</strong><br />
Figure 2.3 Types of weapon used in non-air weapon firearm crimes: Engl<strong>and</strong> <strong>and</strong> Wales,<br />
<strong>2007</strong>/<strong>08</strong><br />
Figure 2.4 <strong>Firearm</strong> offences by type of principal weapon, 1999/00 to <strong>2007</strong>/<strong>08</strong><br />
Figure 2.5 Crimes in which firearms were reported to have been used by offence type, 1997/98 to<br />
<strong>2007</strong>/<strong>08</strong><br />
Figure 2.6 <strong>Firearm</strong> offences by crime type as a percentage of all firearm crime for air weapons<br />
<strong>and</strong> non-air weapons, <strong>2007</strong>/<strong>08</strong><br />
Figure 2.7 <strong>Firearm</strong> offences in police force areas, <strong>2007</strong>/<strong>08</strong><br />
Figure 2.8 The location of firearm robberies in 2006/07 <strong>and</strong> <strong>2007</strong>/<strong>08</strong>: number of offences<br />
Figure 2.9 <strong>Firearm</strong> offences (excluding air weapons) by age of victim, <strong>2007</strong>/<strong>08</strong><br />
Table 2a Crimes in which firearms were used, by type of firearm, whether fired, <strong>and</strong> degree of<br />
injury caused, <strong>2007</strong>/<strong>08</strong><br />
Table 2b Crimes recorded by the police in Engl<strong>and</strong> <strong>and</strong> Wales in which firearms were used by<br />
degree of injury, 1999/00 to <strong>2007</strong>/<strong>08</strong><br />
Table 2c Crimes recorded by the police in which a police officer on duty was injured by a<br />
firearm (excluding air weapons), 1997/98 to <strong>2007</strong>/<strong>08</strong><br />
Table 2.01 Crimes recorded by the police in Engl<strong>and</strong> <strong>and</strong> Wales in which firearms (including air<br />
weapons) were reported to have been used, by offence group, 1997/98 to <strong>2007</strong>/<strong>08</strong><br />
Table 2.02 Crimes recorded by the police in Engl<strong>and</strong> <strong>and</strong> Wales in which firearms (including air<br />
weapons) were reported to have been used, as a percentage of all notifiable offences<br />
in particular offence groups, 1997/98 to <strong>2007</strong>/<strong>08</strong><br />
Table 2.03 Crimes recorded by the police in Engl<strong>and</strong> <strong>and</strong> Wales in which firearms were reported<br />
to have been used by type of principal weapon, 1999/00 to <strong>2007</strong>/<strong>08</strong><br />
5
Table 2.04 Crimes recorded by the police in Engl<strong>and</strong> <strong>and</strong> Wales in which firearms were reported<br />
to have been used by offence group <strong>and</strong> principal weapon, <strong>2007</strong>/<strong>08</strong><br />
Table 2.05 Crimes recorded by the police in Engl<strong>and</strong> <strong>and</strong> Wales in which firearms were reported<br />
to have been used, by how involved, <strong>and</strong> principal weapon, <strong>2007</strong>/<strong>08</strong><br />
Table 2.06 Crimes recorded by the police in Engl<strong>and</strong> <strong>and</strong> Wales in which firearms were reported<br />
to have caused injury by type of principal weapon, 1997/98 to <strong>2007</strong>/<strong>08</strong><br />
Table 2.07 Crimes recorded by the police in Engl<strong>and</strong> <strong>and</strong> Wales in which firearms were reported<br />
to have caused injury, by degree of injury <strong>and</strong> type of principal weapon, <strong>2007</strong>/<strong>08</strong><br />
Table 2.<strong>08</strong> <strong>Offences</strong> of robbery recorded by the police in Engl<strong>and</strong> <strong>and</strong> Wales in which firearms<br />
were reported to have been used, by type of principal weapon, 1997/98 to <strong>2007</strong>/<strong>08</strong><br />
Table 2.09 <strong>Offences</strong> of robbery recorded by the police in Engl<strong>and</strong> <strong>and</strong> Wales in which firearms<br />
were reported to have been used, by location of offence, 1997/98 to <strong>2007</strong>/<strong>08</strong><br />
Table 2.10 <strong>Firearm</strong>s misappropriated in crimes recorded by the police in Engl<strong>and</strong> <strong>and</strong> Wales, by<br />
type of weapon, 1997/98 to <strong>2007</strong>/<strong>08</strong><br />
Table 2.11 <strong>Firearm</strong>s misappropriated in crimes recorded by the police in Engl<strong>and</strong> <strong>and</strong> Wales, by<br />
type of weapon <strong>and</strong> location, <strong>2007</strong>/<strong>08</strong><br />
Table 2.12 <strong>Firearm</strong> offences (excluding air weapons) by police force area, 2003/04 to <strong>2007</strong>/<strong>08</strong><br />
Chapter 3<br />
Figure 3.1 Prevalence of intimate violence since the age of 16, by sex, <strong>2007</strong>/<strong>08</strong> BCS<br />
Figure 3.2 Experiences of combinations of intimate violence among victims since age 16, by sex,<br />
<strong>2007</strong>/<strong>08</strong> BCS<br />
Figure 3.3 Victim-offender relationship for sexual assault incidents since the age of 16, by sex,<br />
<strong>2007</strong>/<strong>08</strong> BCS<br />
Figure 3.4 Adults most at risk of any domestic abuse in the past year, <strong>2007</strong>/<strong>08</strong> BCS<br />
Table 3a Factors independently associated with risk of intimate violence in the past year, by<br />
sex, <strong>2007</strong>/<strong>08</strong> BCS<br />
Table 3.01 Prevalence of intimate violence by category among adults aged 16 to 59, by sex<br />
Table 3.02 Detailed prevalence of intimate violence elements among adults aged 16 to 59, by sex<br />
Table 3.03 Estimates of numbers of victims of intimate violence since the age of 16 by category<br />
among adults aged 16 to 59, by sex<br />
Table 3.04 Estimates of numbers of victims of intimate violence in the last year by category<br />
among adults aged 16 to 59, by sex<br />
6
Table 3.05 Prevalence of intimate violence since the age of 16 among adults aged 16 to 59, by<br />
sex, 2004/05 to <strong>2007</strong>/<strong>08</strong> BCS<br />
Table 3.06 Prevalence of intimate violence in the last year among adults aged 16 to 59, by sex,<br />
2004/05 to <strong>2007</strong>/<strong>08</strong> BCS<br />
Table 3.07 Percentage of intimate violence victims experiencing one, two or all types since the<br />
age of 16, by sex<br />
Table 3.<strong>08</strong> Experiences of combinations of intimate violence among victims since the age of 16,<br />
by sex<br />
Table 3.09 Number of times victims of partner abuse had been abused by partner(s) in the last<br />
year, by sex<br />
Table 3.10 Number of times victims had experienced sexual assault in the last year<br />
Table 3.11 Victim-offender relationship for sexual assault incidents since the age of 16, by sex<br />
Table 3.12 Influence of drink or drugs in incidents of less serious sexual assault in the last year<br />
Table 3.13 Influence of drink or drugs in incidents of serious sexual assault since the age of 16,<br />
by sex<br />
Table 3.14 Who the victim had told personally about the serious sexual assault since the age of<br />
16, by sex<br />
Table 3.15 Percentage of adults aged from 16 to 59 victims of intimate violence by type in last<br />
year, by personal characteristics, by sex<br />
Table 3.16 Percentage of adults aged from 16 to 59 victims of intimate violence by type in last<br />
year, by household <strong>and</strong> area characteristics, by sex<br />
Table 3.17 Logistic regression model for experience of any domestic abuse in the last year<br />
among men<br />
Table 3.18 Logistic regression model for experience of any domestic abuse in the last year<br />
among women<br />
Table 3.19 Logistic regression model for experience of partner abuse (non-sexual) in the last year<br />
among men<br />
Table 3.20 Logistic regression model for experience of partner abuse (non-sexual) in the last year<br />
among women<br />
Table 3.21 Logistic regression model for experience of family abuse (non-sexual) in the last year<br />
among men<br />
Table 3.22 Logistic regression model for experience of family abuse (non-sexual) in the last year<br />
among women<br />
Table 3.23 Logistic regression model for experience of any sexual assault in the last year among<br />
women<br />
7
1 Homicide<br />
Kathryn Coleman<br />
The term ‘homicide’ covers the offences of murder, manslaughter <strong>and</strong> infanticide. Murder <strong>and</strong><br />
manslaughter are common law offences that have never been defined by statute, although they<br />
have been modified by statute. The offence of ‘infanticide’ was created by the Infanticide Act 1922<br />
<strong>and</strong> refined by the Infanticide Act 1938 (s1).<br />
In this chapter, homicide offences are shown according to the year in which the police initially<br />
recorded the offence as homicide. This is not necessarily the year in which the incident took<br />
place or the year in which any court decision was made. The data refer to the position as at 4<br />
November 20<strong>08</strong>, when recording closed down for the purpose of analysis, <strong>and</strong> will change as<br />
subsequent court hearings take place or other information is received. Because of differences in<br />
recording practice with respect to ‘no crimes’, data from the Homicide Index do not necessarily<br />
agree with the recorded crime data.<br />
SUMMARY<br />
There were 773 deaths initially recorded as homicide in Engl<strong>and</strong> <strong>and</strong> Wales based on cases<br />
recorded by the police in <strong>2007</strong>/<strong>08</strong>, an increase of two per cent (15 homicides) since 2006/07.<br />
• Almost three-quarters of homicide victims (73%) were male.<br />
• The most common method of killing, at 35 per cent, involved a sharp instrument. The number<br />
of sharp instrument homicides recorded during <strong>2007</strong>/<strong>08</strong>, at 270, is only one higher than was<br />
recorded the previous year, but is the highest number recorded during a financial year since<br />
the Homicide Index was introduced in 1977.<br />
• There were 53 shooting victims in <strong>2007</strong>/<strong>08</strong> compared to 59 in 2006/07.<br />
• Female victims were more likely to be killed by someone they knew: 73 per cent of female<br />
victims knew the main suspect compared to 48 per cent of male victims. Eighty per cent of<br />
victims aged under 16 knew the main suspect.<br />
• Overall, the risk of being a victim of homicide was 14.1 per million population. Children under<br />
one year old were the most at risk age group, at 36 per million population.<br />
9
1.1 OFFENCES RECORDED AS HOMICIDE<br />
In <strong>2007</strong>/<strong>08</strong>, 773 deaths were initially recorded as homicide, an increase of two per cent on the<br />
previous year. Where the police initially record an offence as homicide it remains classified<br />
unless the police or courts decide later that no offence or homicide took place. Of the 773<br />
offences first recorded in <strong>2007</strong>/<strong>08</strong>, ten were no longer recorded as homicides by 4 November<br />
20<strong>08</strong>. The 763 offences currently recorded as homicide in <strong>2007</strong>/<strong>08</strong> compared with 742 in<br />
2006/07, an increase of three per cent.<br />
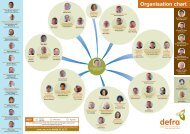
Figure 1.1 <strong>Offences</strong> recorded by the police in Engl<strong>and</strong> <strong>and</strong> Wales, 1955 to <strong>2007</strong>/<strong>08</strong><br />
Number of offences<br />
1,200<br />
1,000<br />
800<br />
600<br />
400<br />
200<br />
0<br />
1955<br />
1959<br />
1963<br />
Initially recorded Currently recorded<br />
1967<br />
1971<br />
1975<br />
1979<br />
1983<br />
Year<br />
1987<br />
1991<br />
1995<br />
1998/99<br />
2002/03<br />
1. Year 2005/06 includes 52 victims of the 7 July London bombings.<br />
2. Year 2003/04 includes 20 cockle pickers who drowned in Morecambe Bay.<br />
3. Year 2002/03 includes 172 victims of Dr Harold Shipman.<br />
4. Year 2000/01 includes 58 Chinese nationals who collectively suffocated in a lorry en route in the UK.<br />
Caution is needed when looking at homicide trend figures, primarily because they are based on<br />
the year in which offences are recorded by the police rather than the year in which the incidents<br />
took place. An example of this is 172 homicides attributed to Dr Harold Shipman as a result of<br />
Dame Janet Smith’s inquiry; the offences took place over a long period of time but were all<br />
recorded by the police during 2002/03. Also, for an incident where several people are killed (such<br />
as the cockle pickers drowning in Morecambe Bay <strong>and</strong> the 7 July London bombing victims), the<br />
number of homicides counted is the total number of persons killed rather than the number of<br />
incidents.<br />
Court proceedings had resulted in homicide convictions in respect of 241 victims <strong>and</strong><br />
proceedings were pending for a further 63. Suspects responsible for the deaths of 17 victims had<br />
committed suicide or died, <strong>and</strong> all suspects were acquitted in 28 cases. No suspects had been<br />
identified in connection with 401 cases (53% of victims) when data collection closed on 4<br />
November 20<strong>08</strong> for the purpose of analysis. In the remaining 13 cases the proceedings were<br />
either discontinued or not initiated (Table 1.02).<br />
10<br />
2006/07
1.2 VICTIMS<br />
Method of killing<br />
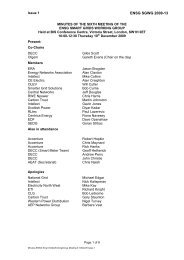
As in previous years, the most common method of killing was with a sharp instrument. Thirty-five<br />
per cent of all victims were killed by this method: 38 per cent of male victims <strong>and</strong> 28 per cent of<br />
female victims. The 270 sharp instrument homicides recorded, up by one on 2006/07, is the<br />
highest number since the Homicide Index was introduced. The second most common method<br />
used against men (25%) involved hitting or kicking whereas female victims were more likely to be<br />
strangled or asphyxiated (20%).<br />
Shooting accounted for seven per cent of homicides (53 victims) in <strong>2007</strong>/<strong>08</strong>: eight per cent of<br />
male victims (47 offences) <strong>and</strong> three per cent of female victims (six offences). This compares<br />
with 59 homicides by shooting in 2006/07, which accounted for eight per cent of all homicides<br />
(Table 1.03).<br />
Figure 1.2 Percentage of offences currently recorded as homicide, by apparent method of<br />
killing <strong>and</strong> sex of victim, <strong>2007</strong>/<strong>08</strong><br />
Percentage<br />
40<br />
35<br />
30<br />
25<br />
20<br />
15<br />
10<br />
5<br />
0<br />
38<br />
28<br />
Sharp<br />
instrument<br />
8<br />
Blunt<br />
instrument<br />
Male victims: 555 offences Female victims: 2<strong>08</strong> offences<br />
25<br />
11 11<br />
Hitting, kicking<br />
etc.<br />
3<br />
20<br />
8<br />
3<br />
0<br />
0<br />
6<br />
3 3<br />
Strangulation Shooting Explosion Burning Poison or<br />
Method<br />
drugs<br />
1. ‘Other’ includes all other apparent methods <strong>and</strong> where method unknown.<br />
Relationship between victims <strong>and</strong> suspect<br />
2<br />
12<br />
20<br />
Other (1)<br />
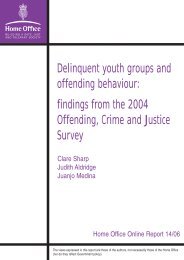
Seventy-three per cent of female victims knew the main or only suspect at the time of the<br />
offence. Of these female victims, 48 per cent were killed by their partner, ex-partner or lover. By<br />
comparison, 48 per cent of male victims knew the main or only suspect. Of these male victims,<br />
13 per cent were killed by their partner, ex-partner or lover.<br />
In <strong>2007</strong>/<strong>08</strong>, 199 men (36% of all male victims) <strong>and</strong> 28 women (13% of all female victims) were<br />
killed by strangers 1 . Over the last five years the proportion of female victims killed by a stranger<br />
was 21 per cent, compared to 41 per cent of male victims.<br />
1 Stranger category includes: business associate, police/prison officer killed in the course of duty, stranger (terrorist/<br />
contract killing <strong>and</strong> other) <strong>and</strong> where there is insufficient information about the suspect to determine relationship to victim.<br />
11
Figure 1.3 All victims by relationship of victim to principal suspect, <strong>2007</strong>/<strong>08</strong><br />
Stranger<br />
36%<br />
No suspect<br />
16%<br />
Partner/expartner<br />
6%<br />
Male victims 555 offences<br />
Victims under 16 years of age<br />
Other<br />
fam ily<br />
11%<br />
Other<br />
known<br />
31%<br />
Other<br />
know n<br />
16%<br />
Stranger<br />
13%<br />
Other f amily<br />
22%<br />
No suspect<br />
14%<br />
Female victims 2<strong>08</strong> offences<br />
In <strong>2007</strong>/<strong>08</strong> there were at least 69 victims under 16 years of age, no change from the previous<br />
year. Of all the offences currently recorded as homicide in <strong>2007</strong>/<strong>08</strong> (763 victims), nine per cent of<br />
the victims were under the age of 16, the same proportion as in the previous year.<br />
Both the number <strong>and</strong> proportion of victims aged under 16 who were acquainted with the main<br />
suspect were higher in <strong>2007</strong>/<strong>08</strong> compared to 2006/07. Forty-three of the victims (62%) were<br />
killed by their parents in <strong>2007</strong>/<strong>08</strong>, an increase from 35 (51%) in 2006/07. A further 12 (17%) knew<br />
the main suspect, compared to nine (13%) the year previously. Ten (14%) of the victims were<br />
known to have been killed by strangers <strong>and</strong>, as of 4 November 20<strong>08</strong>, there were no suspects for<br />
four (6%) of the victims. (Figure 1.4, Table 1.04).<br />
Figure 1.4 Victims under 16 years of age, by relationship of victim to suspect, <strong>2007</strong>/<strong>08</strong><br />
Other known<br />
17%<br />
Son/daughter<br />
62%<br />
69 offences<br />
12<br />
Stranger<br />
14%<br />
No suspect<br />
6%<br />
Partner/expartner<br />
35%
Circumstances of the homicides<br />
A quarrel, revenge or loss of temper reportedly accounted for 45 per cent of homicides (341<br />
offences) in <strong>2007</strong>/<strong>08</strong>: 51 per cent of all cases where the principal suspect was known to the<br />
victim <strong>and</strong> 37 per cent of all cases where the suspect was unknown to the victim. Six per cent of<br />
homicides (47 offences) occurred during robberies or burglaries <strong>and</strong> three per cent (23 offences)<br />
were attributed to irrational acts 2 . As at 4 November 20<strong>08</strong>, the apparent circumstances were not<br />
known for 24 per cent of the homicides (186 offences) recorded in <strong>2007</strong>/<strong>08</strong> (Table 1.06).<br />
Risks for different age groups<br />
Overall in <strong>2007</strong>/<strong>08</strong>, males (at 21 per million population) were more at risk of being homicide<br />
victims than females (eight per million population). As in previous years, <strong>and</strong> using the traditional<br />
age groupings employed in earlier homicide chapters, the age group most at risk of homicide<br />
were children under one year old, at 36 per million population (but see also further analysis<br />
below). However for this age group, <strong>and</strong> children generally, numbers are relatively small <strong>and</strong><br />
considerable year-on-year variation in the rate is to be expected. The second most at risk age<br />
group, consistent with previous years, are those persons aged between 16 <strong>and</strong> 29, at a rate of 24<br />
per million population. Males in this age group were the most vulnerable overall at a rate of 37<br />
per million population. By comparison, the risk for all persons over 70 years of age in <strong>2007</strong>/<strong>08</strong><br />
was seven per million population (Table 1.07).<br />
Further analysis was conducted on the 5-to-15 years <strong>and</strong> 16-to-29 years age groupings. Males in<br />
the 11-to-15 years age grouping were more at risk, at six per million population, than those in the<br />
5-to-10 years age grouping (three per million population). The risk per million population in<br />
<strong>2007</strong>/<strong>08</strong> was highest for males aged between 16 <strong>and</strong> 20 (inclusive) at a rate of 45 per million<br />
population, compared to females at 11 per million population (Figure 1.5).<br />
Figure 1.5 <strong>Offences</strong> currently recorded as homicide per million population by age of<br />
victim, <strong>2007</strong>/<strong>08</strong><br />
Number per million population<br />
50<br />
45<br />
40<br />
35<br />
30<br />
25<br />
20<br />
15<br />
10<br />
5<br />
0<br />
40<br />
30<br />
10<br />
6<br />
3<br />
1<br />
6<br />
4<br />
45<br />
2 These figures do not account for all homicides committed by mentally disturbed people, as offences with an apparent<br />
motive (e.g. during a quarrel, or a gang-related killing) are included under the respective circumstance. Higher overall<br />
totals for homicides committed by mentally disturbed people are quoted elsewhere, e.g. the National Confidential Inquiry<br />
into Suicide <strong>and</strong> Homicide by People with Mental Illness (Appleby, 2006).<br />
32<br />
30<br />
11 10 9<br />
14<br />
5<br />
5<br />
21<br />
8 8<br />
Under 1 1-4 5-10 11-15 16-20 21-29 30-49 50-69 70+ All ages<br />
Age range<br />
13<br />
Male victims<br />
Female victims
1.3 SUSPECTS<br />
Box 1.1 Definition of homicide suspect<br />
A suspect in a homicide case is defined as (i) a person who has been arrested in respect of an<br />
offence initially classified as homicide <strong>and</strong> has been charged with homicide or (ii) a person who is<br />
suspected by the police of having committed the offence but is known to have died or committed<br />
suicide prior to arrest. More than one suspect may be tried for one offence <strong>and</strong> sometimes no<br />
suspect is ever brought to trial. Hence the number of suspects is not the same as the number of<br />
offences.<br />
By 4 November 20<strong>08</strong>, at least one suspect had been identified in 335 (or 43%) of the currently<br />
recorded homicides (Table 1.02). In total there were 945 suspects (Table 1a). Court proceedings<br />
had concluded for 394 suspects: 384 of these were indicted for homicide offences (Table 1.09)<br />
<strong>and</strong> ten for lesser offences. Court proceedings were pending for 519 suspects (Table 1a). Of the<br />
remaining 32 suspects, 13 had either died or committed suicide before indictment <strong>and</strong> no<br />
proceedings had taken place for 19 suspects 3 (Tables 1.09 <strong>and</strong> 1a).<br />
Table 1a Outcomes for all suspects, 2003/04 to <strong>2007</strong>/<strong>08</strong><br />
Outcome 2003/04 2004/05 2005/06 2006/07 <strong>2007</strong>/<strong>08</strong><br />
Convicted of homicide<br />
Both indicted <strong>and</strong> not indicted for homicide<br />
627 653 537 470 305<br />
Convicted of lesser offence 30 39 31 43 24<br />
Unfit to plead or insane 7 1 2 4 6<br />
Acquitted/discontinued etc. 223 204 131 117 60<br />
Proceedings concluded other outcome 9 4 3 4 4<br />
Committed suicide or died 32 31 19 22 18 1<br />
No proceedings taken 3 4 7 6 9<br />
Proceedings pending 90 126 161 238 519<br />
Total<br />
1. Five of these suspects had been indicted, 13 had not.<br />
1,100 1,135 972 1,007 1,061<br />
For those suspects where proceedings had concluded, 346 were male <strong>and</strong> 48 female. Fifty per<br />
cent of males indicted of homicide were convicted of murder, 31 per cent were convicted of<br />
manslaughter <strong>and</strong> 14 per cent were acquitted. For females indicted, 28 per cent were convicted<br />
of murder, 41 per cent of manslaughter <strong>and</strong> 20 per cent were acquitted.<br />
More complete data from previous years are a better guide to the outcome of court proceedings<br />
<strong>and</strong> the above-mentioned percentages are likely to change as more information becomes<br />
available. Too much importance should not be placed on year <strong>2007</strong>/<strong>08</strong>’s data since just over half<br />
(55%) of the suspects had not been before the courts at the time of this analysis. This percentage<br />
will decrease as time elapses. Between 1997/98 <strong>and</strong> 2006/07, 74 per cent of suspects indicted<br />
for homicide were found guilty of homicide <strong>and</strong> 24 per cent were acquitted (Table 1.09 <strong>and</strong> Figure<br />
1.6).<br />
3 This figure is derived at by subtracting figures in table 1.09 [the number of suspects indicted <strong>and</strong>: found unfit to plead<br />
(2), not guilty by reason of insanity (1) or acquitted on all counts (55)] from ones in table 1a [the number indicted/not<br />
indicted <strong>and</strong>: found unfit to plead or insane (6), acquitted/discontinued (60) or no proceedings taken (9)].<br />
14
Figure 1.6 Suspects indicted for homicide by outcome of proceedings, 1997/98 to <strong>2007</strong>/<strong>08</strong><br />
Number of suspects<br />
1000<br />
900<br />
800<br />
700<br />
600<br />
500<br />
400<br />
300<br />
200<br />
100<br />
0<br />
1997/98<br />
1998/99<br />
Previous homicide convictions<br />
Convicted of homicide Convicted of lesser offence Acquitted Other<br />
1999/00<br />
2000/01<br />
2001/02<br />
Home Office Statistics was not notified by the police of any convictions for homicide recorded in<br />
<strong>2007</strong>/<strong>08</strong> where the suspect had been convicted of a homicide on a previous occasion. Among<br />
those who had been convicted of homicides recorded between 1997/98 <strong>and</strong> <strong>2007</strong>/<strong>08</strong>, 30 had<br />
previously been convicted of homicide, compared to the 21 suspects reported in the last<br />
homicide chapter relating to the period 1996 to 2006/07. This increase is due to revised<br />
information being supplied to Home Office Statistics by the police <strong>and</strong> other sources.<br />
Nine of the 30 subsequent convictions were for murder, where the original conviction was also<br />
murder. Over this period 1997/98 to <strong>2007</strong>/<strong>08</strong>, a total of three suspects had been serving a<br />
custodial sentence when they were convicted of their subsequent offence. The data include all<br />
previous homicide convictions (where known) wherever they took place but the second offence<br />
must have occurred in Engl<strong>and</strong> <strong>and</strong> Wales to be included in this analysis (Tables 1.11 <strong>and</strong> 1.12).<br />
15<br />
2002/03<br />
Year<br />
2003/04<br />
2004/05<br />
2005/06<br />
2006/07<br />
<strong>2007</strong>/<strong>08</strong>
Table 1.01 <strong>Offences</strong> 1 initially recorded by the police as homicide by current classification 2 :<br />
Engl<strong>and</strong> <strong>and</strong> Wales, 1955 to <strong>2007</strong>/<strong>08</strong><br />
Numbers <strong>and</strong> rates per million population Recorded crime<br />
Year<br />
Number of offences<br />
initially recorded as<br />
homicide<br />
Number of offences<br />
no longer recorded<br />
as homicide<br />
Number of offences<br />
currently recorded as<br />
homicide<br />
<strong>Offences</strong> currently<br />
recorded as homicide<br />
per million population<br />
1955 279 .. .. ..<br />
1956 315 .. .. ..<br />
1957 321 .. .. ..<br />
1958 261 .. .. ..<br />
1959 266 .. .. ..<br />
1960 282 .. .. ..<br />
1961 265 .. .. ..<br />
1962 299 .. .. ..<br />
1963 307 .. .. ..<br />
1964 296 .. .. ..<br />
1965 325 .. .. ..<br />
1966 364 .. .. ..<br />
1967 414 60 354 7.3<br />
1968 420 60 360 7.4<br />
1969 395 63 332 6.8<br />
1970 396 57 339 7.0<br />
1971 459 52 407 8.3<br />
1972 480 71 409 8.3<br />
1973 465 74 391 8.0<br />
1974 599 73 526 10.7<br />
1975 5<strong>08</strong> 65 443 9.0<br />
1976 565 77 488 9.9<br />
1977 484 66 418 8.5<br />
1978 535 64 471 9.6<br />
1979 629 83 546 11.1<br />
1980 621 72 549 11.1<br />
1981 556 57 499 10.1<br />
1982 618 61 557 11.2<br />
1983 552 70 482 9.7<br />
1984 619 82 537 10.8<br />
1985 625 89 536 10.7<br />
1986 660 97 563 11.2<br />
1987 686 87 599 11.9<br />
1988 645 98 547 10.9<br />
1989 622 101 521 10.3<br />
1990 661 106 555 10.9<br />
1991 725 102 623 12.3<br />
1992 681 100 581 11.4<br />
1993 673 1<strong>08</strong> 565 11.1<br />
1994 727 95 632 12.4<br />
1995 752 90 662 13.0<br />
1996 678 92 586 11.4<br />
1997 734 125 609 11.8<br />
1997/98 729 120 609 11.8<br />
1998/99 745 99 646 12.5<br />
1999/00 763 88 675 13.0<br />
2000/01 852 79 773 14.9<br />
2001/02 867 59 8<strong>08</strong> 15.4<br />
2002/03 1051 98 953 18.1<br />
2003/04 855 79 776 14.7<br />
2004/05 839 55 784 14.8<br />
2005/06 768 45 723 13.5<br />
2006/07 758 16 742 13.8<br />
<strong>2007</strong>/<strong>08</strong> 773 10 763 14.1<br />
1. A separate offence is recorded for each victim of homicide, so that in an incident in which several people are killed, the number of homicides<br />
counted is the total number of persons killed.<br />
2. As at 4 November 20<strong>08</strong>; figures are subject to revision as cases are dealt with by the police <strong>and</strong> by the courts, or as further information<br />
becomes available.<br />
16
Table 1.02 <strong>Offences</strong> initially recorded as homicide by outcome: Engl<strong>and</strong> <strong>and</strong> Wales, 1997/98 to <strong>2007</strong>/<strong>08</strong><br />
Numbers Recorded crime<br />
Outcome 1997/98 1998/99 1999/00 2000/01 2001/02 2002/03 2003/04 2004/05 2005/06 2006/07 <strong>2007</strong>/<strong>08</strong><br />
<strong>Offences</strong> initially recorded as homicide 729 745 763 852 867 1051 855 839 768 758 773<br />
<strong>Offences</strong> no longer recorded as homicide 1<br />
120 99 88 79 59 98 79 55 45 16 10<br />
<strong>Offences</strong> currently recorded as homicide 1<br />
Decided at court to be homicide:<br />
Murder 209 228 242 252 277 296 305 307 273 223 139<br />
Sec 2 Manslaughter 50 40 28 18 19 15 21 23 23 33 9<br />
Other Manslaughter 188 215 189 287 262 234 210 215 136 129 93<br />
Infanticide 4 7 1 5 1 - - 1 1 - -<br />
Total 451 490 460 562 559 545 536 546 433 385 241<br />
17<br />
Court decision pending 17 25 34 55 65 40 76 78 103 142 63<br />
Proceedings not initiated or concluded<br />
without conviction or acquittal:<br />
Suspect found by the court to be insane 4 3 2 1 - 1 3 1 1 - 1<br />
Suspect died 3 4 4 6 6 7 6 7 4 9 1<br />
Suspect committed suicide 30 36 34 33 25 31 31 25 64 20 16<br />
Proceedings discontinued or not initiated 15 15 41 11 4 180 7 2 3 5 12<br />
Total 52 58 81 51 35 219 47 35 72 34 30<br />
Currently no suspect:<br />
All suspects acquitted 39 26 48 45 27 24 34 52 30 46 28<br />
No suspects charged 50 47 52 60 122 125 83 73 85 135 401<br />
Total 89 73 100 105 149 149 117 125 115 181 429<br />
Total offences currently recorded as homicide 609 646 675 773 8<strong>08</strong> 953 776 784 723 742 763<br />
1. As at 4 November 20<strong>08</strong>; figures are subject to revision as cases are dealt with by the police <strong>and</strong> by the courts, or as further information becomes available.
Table 1.03 <strong>Offences</strong> currently 1 recorded as homicide by apparent method of killing <strong>and</strong> sex of victim: Engl<strong>and</strong> <strong>and</strong><br />
Wales, 1997/98 to <strong>2007</strong>/<strong>08</strong><br />
Numbers Recorded crime<br />
Apparent method 1997/98 1998/99 1999/00 2000/01 2001/02 2002/03 2003/04 2004/05 2005/06 2006/07 <strong>2007</strong>/<strong>08</strong><br />
Male victims<br />
Sharp instrument 137 151 153 156 194 183 183 188 162 190 212<br />
Blunt instrument 47 41 44 50 36 26 53 49 41 34 44<br />
Hitting, kicking, etc. 79 76 82 86 120 112 111 111 91 126 140<br />
Strangulation 2<br />
12 29 20 84 18 20 18 16 14 23 16<br />
Shooting 3<br />
45 42 52 63 91 55 61 60 39 53 47<br />
Explosion 4<br />
1 2 3 2 - 2 - 2 24 1 -<br />
Burning 15 13 9 9 15 7 19 17 15 14 14<br />
Drowning 5<br />
5 3 3 7 8 4 20 8 3 8 5<br />
Poison or drugs 6<br />
12 24 20 21 20 67 11 19 20 25 16<br />
Motor vehicle 7<br />
12 11 10 11 15 18 15 17 12 3 9<br />
Other 26 26 24 46 25 27 21 28 17 26 30<br />
Not known 9 12 29 9 17 20 42 39 41 44 22<br />
Total 400 430 449 544 559 541 554 554 479 547 555<br />
Female victims<br />
Sharp instrument 65 50 60 59 67 83 59 72 57 79 58<br />
Blunt instrument 21 24 26 27 24 22 20 17 19 11 22<br />
Hitting, kicking, etc. 24 13 13 16 25 38 26 16 20 15 23<br />
Strangulation 2<br />
50 49 36 63 60 47 49 48 43 31 41<br />
Shooting 3<br />
7 4 9 9 6 20 6 10 11 6 6<br />
Explosion 4<br />
- - 1 - 1 - - - 29 - -<br />
Burning 13 19 4 9 14 15 9 15 12 15 13<br />
Drowning 5<br />
1 3 3 2 4 3 4 4 1 1 1<br />
Poison or drugs 6<br />
5 23 33 12 15 135 9 10 11 1 4<br />
Motor vehicle 7<br />
1 3 1 5 4 3 7 5 2 3 3<br />
Other 12 17 16 22 15 21 15 13 8 15 22<br />
Not known 10 11 24 5 14 25 18 20 31 18 15<br />
Total 209 216 226 229 249 412 222 230 244 195 2<strong>08</strong><br />
Total victims<br />
Sharp instrument 202 201 213 215 261 266 242 260 219 269 270<br />
Blunt instrument 68 65 70 77 60 48 73 66 60 45 66<br />
Hitting, kicking, etc. 103 89 95 102 145 150 137 127 111 141 163<br />
Strangulation 2<br />
62 78 56 147 78 67 67 64 57 54 57<br />
Shooting 3<br />
52 46 61 72 97 75 67 70 50 59 53<br />
Explosion 4<br />
1 2 4 2 1 2 - 2 53 1 -<br />
Burning 28 32 13 18 29 22 28 32 27 29 27<br />
Drowning 5<br />
6 6 6 9 12 7 24 12 4 9 6<br />
Poison or drugs 6<br />
17 47 53 33 35 202 20 29 31 26 20<br />
Motor vehicle 7<br />
13 14 11 16 19 21 22 22 14 6 12<br />
Other 38 43 40 68 40 48 36 41 25 41 52<br />
Not known 19 23 53 14 31 45 60 59 72 62 37<br />
Total 609 646 675 773 8<strong>08</strong> 953 776 784 723 742 763<br />
1. As at 4 November 20<strong>08</strong>; figures are subject to revision as cases are dealt with by the police <strong>and</strong> by the courts, or as further information becomes available.<br />
2. Including asphyxiation. Year 2000/01 includes 58 Chinese nationals who collectively suffocated in a lorry en route into the UK.<br />
3. These figures may not agree with those in the firearms chapter because (a) figures include cases where the firearm was used as a blunt instrument <strong>and</strong> (b)<br />
homicide figures include shooting by crossbows <strong>and</strong> are compiled at a later date <strong>and</strong> take into account the results of police <strong>and</strong> court decisions.<br />
4. Year 2005/06 includes 52 victims of the 7 July London bombings.<br />
5. Year 2003/04 includes 20 cockle pickers who drowned in Morecambe Bay.<br />
6. Year 2002/03 includes 172 victims of Dr Shipman.<br />
7. Excluding death by careless/dangerous driving <strong>and</strong> aggravated vehicle taking.<br />
18
Table 1.04 <strong>Homicides</strong> currently 1 recorded for victims under 16 years by relationship of victim to principal suspect: Engl<strong>and</strong> <strong>and</strong> Wales, 1997/98 to<br />
<strong>2007</strong>/<strong>08</strong> 3<br />
Numbers Recorded crime<br />
1997/98 1998/99 1999/00 2000/01 3<br />
2001/02 2002/03 2003/04 2004/05 2005/06 2006/07 <strong>2007</strong>/<strong>08</strong><br />
Male victims<br />
Victim acquainted with suspect<br />
Son or daughter 27 30 29 44 30 26 18 11 15 20 28<br />
Other family/friend/acquaintance 8 7 3 5 6 2 10 7 8 7 5<br />
Total acquainted 35 37 32 49 36 28 28 18 23 27 33<br />
5 3 4 7 3 6 11 8 4 8 9<br />
Victim not acquainted with suspect<br />
Stranger 2<br />
No suspect 2 5 3 3 6 5 7 18 1 8 1<br />
Total not acquainted 7 8 7 10 9 11 18 26 5 16 10<br />
TOTAL 42 45 39 59 45 39 46 44 28 43 43<br />
Female victims<br />
Victim acquainted with suspect<br />
Son or daughter 17 24 19 34 10 25 16 19 10 15 15<br />
Other family/friend/acquaintance 7 9 1 2 3 9 2 4 2 2 7<br />
Total acquainted 24 33 20 36 13 34 18 23 12 17 22<br />
1 2 5 3 3 11 3 3 8 3 1<br />
Victim not acquainted with suspect<br />
Stranger 2<br />
19<br />
No suspect 4 1 1 - 1 9 6 4 4 6 3<br />
Total not acquainted 5 3 6 3 4 20 9 7 12 9 4<br />
TOTAL 29 36 26 39 17 54 27 30 24 26 26<br />
All victims<br />
Victim acquainted with suspect<br />
Son or daughter 44 54 48 78 40 51 34 30 25 35 43<br />
Other family/friend/acquaintance 15 16 4 7 9 11 12 11 10 9 12<br />
Total acquainted 59 70 52 85 49 62 46 41 35 44 55<br />
6 5 9 10 6 17 14 11 12 11 10<br />
Victim not acquainted with suspect<br />
Stranger 2<br />
No suspect 6 6 4 3 7 14 13 22 5 14 4<br />
Total not acquainted 12 11 13 13 13 31 27 33 17 25 14<br />
TOTAL 71 81 65 98 62 93 73 74 52 69 69<br />
1. As at 4 November 20<strong>08</strong>; figures are subject to revision as cases are dealt with by the police <strong>and</strong> by the courts, or as further information becomes available.<br />
2. Includes cases where relationship not known.<br />
3. 'Stranger' figures for 2000/01 were revised on 13 Feb 09, with 58 victims of unknown age removed.
Table 1.04 (continued)<br />
Percentages Recorded crime<br />
1997/98 1998/99 1999/00 2000/01 2001/02 2002/03 2003/04 2004/05 2005/06 2006/07 <strong>2007</strong>/<strong>08</strong><br />
Male victims<br />
Victim acquainted with suspect<br />
Son or daughter 64 67 74 75 67 67 39 25 54 47 65<br />
Other family/friend/acquaintance 19 16 8 8 13 5 22 16 29 16 12<br />
Total acquainted 83 82 82 83 80 72 61 41 82 63 77<br />
12 7 10 12 7 15 24 18 14 19 21<br />
Victim not acquainted with suspect<br />
Stranger 2<br />
No suspect 5 11 8 5 13 13 15 41 4 19 2<br />
Total not acquainted 17 18 18 17 20 28 39 59 18 37 23<br />
TOTAL 100 100 100 100 100 100 100 100 100 100 100<br />
Female victims<br />
Victim acquainted with suspect<br />
Son or daughter 59 67 73 87 59 46 59 63 42 58 58<br />
Other family/friend/acquaintance 24 25 4 5 18 17 7 13 8 8 27<br />
Total acquainted 83 92 77 92 76 63 67 77 50 65 85<br />
3 6 19 8 18 20 11 10 33 12 4<br />
Victim not acquainted with suspect<br />
Stranger 2<br />
20<br />
No suspect 14 3 4 0 6 17 22 13 17 23 12<br />
Total not acquainted 17 8 23 8 24 37 33 23 50 35 15<br />
TOTAL 100 100 100 100 100 100 100 100 100 100 100<br />
All victims<br />
Victim acquainted with suspect<br />
Son or daughter 62 67 74 80 65 55 47 41 48 51 62<br />
Other family/friend/acquaintance 21 20 6 7 15 12 16 15 19 13 17<br />
Total acquainted 83 86 80 87 79 67 63 55 67 64 80<br />
8 6 14 10 10 18 19 15 23 16 14<br />
Victim not acquainted with suspect<br />
Stranger 2<br />
No suspect 8 7 6 3 11 15 18 30 10 20 6<br />
Total not acquainted 17 14 20 13 21 33 37 45 33 36 20<br />
TOTAL 100 100 100 100 100 100 100 100 100 100 100<br />
1. As at 4 November 20<strong>08</strong>; figures are subject to revision as cases are dealt with by the police <strong>and</strong> by the courts, or as further information becomes available.<br />
2. Includes cases where relationship not known.<br />
3. 'Stranger' figures for 2000/01 were revised on 13 Feb 09, with 58 victims of unknown age removed.
Table 1.05 <strong>Homicides</strong> currently 1 recorded for all victims by relationship of victim to principal suspect: Engl<strong>and</strong> <strong>and</strong> Wales 1997/98 to <strong>2007</strong>/<strong>08</strong><br />
Numbers Recorded crime<br />
1997/98 1998/99 1999/00 2000/01 2001/02 2002/03 2003/04 2004/05 2005/06 2006/07 <strong>2007</strong>/<strong>08</strong><br />
Male victims<br />
Victim acquainted with suspect<br />
Son or daughter 29 31 31 46 31 27 19 13 16 22 35<br />
Parent 7 9 9 6 10 12 23 15 14 6 11<br />
Partner/ex-partner 31 27 24 26 29 30 26 38 22 29 34<br />
Other family 10 8 17 18 13 10 15 16 16 15 15<br />
Friend/acquaintance 142 168 139 142 148 132 172 171 131 177 174<br />
Total known 219 243 220 238 231 211 255 253 199 249 269<br />
119 133 153 222 222 239 232 241 222 214 199<br />
Victim not acquainted with suspect<br />
Stranger 2<br />
No suspect 62 54 76 84 106 91 67 60 58 84 87<br />
Total not known 181 187 229 306 328 330 299 301 280 298 286<br />
TOTAL 400 430 449 544 559 541 554 554 479 547 555<br />
Female victims<br />
Victim acquainted with suspect<br />
Son or daughter 18 26 19 38 12 27 18 21 14 16 19<br />
Parent 14 7 6 5 12 11 9 7 5 3 11<br />
Partner/ex-partner 100 76 88 101 117 106 96 105 89 87 72<br />
Other family 6 10 5 8 9 8 7 9 5 5 15<br />
Friend/acquaintance 28 38 25 24 31 40 26 31 28 25 34<br />
Total known 166 157 143 176 181 192 156 173 141 136 151<br />
21<br />
27 42 65 42 40 185 49 41 78 35 28<br />
Victim not acquainted with suspect<br />
Stranger 2<br />
No suspect 16 17 18 11 28 35 17 16 25 24 29<br />
Total not known 43 59 83 53 68 220 66 57 103 59 57<br />
TOTAL 209 216 226 229 249 412 222 230 244 195 2<strong>08</strong><br />
All victims<br />
Victim acquainted with suspect<br />
Son or daughter 47 57 50 84 43 54 37 34 30 38 54<br />
Parent 21 16 15 11 22 23 32 22 19 9 22<br />
Partner/ex-partner 131 103 112 127 146 136 122 143 111 116 106<br />
Other family 16 18 22 26 22 18 22 25 21 20 30<br />
Friend/acquaintance 170 206 164 166 179 172 198 202 159 202 2<strong>08</strong><br />
Total known 385 400 363 414 412 403 411 426 340 385 420<br />
146 175 218 264 262 424 281 282 300 249 227<br />
Victim not acquainted with suspect<br />
Stranger 2<br />
No suspect 78 71 94 95 134 126 84 76 83 1<strong>08</strong> 116<br />
Total not known 224 246 312 359 396 550 365 358 383 357 343<br />
TOTAL 609 646 675 773 8<strong>08</strong> 953 776 784 723 742 763<br />
1. As at 4 November 20<strong>08</strong>; figures are subject to revision as cases are dealt with by the police <strong>and</strong> by the courts, or as further information becomes available.<br />
2. Includes not known.
Table 1.05 (continued)<br />
Percentages Recorded crime<br />
1997/98 1998/99 1999/00 2000/01 2001/02 2002/03 2003/04 2004/05 2005/06 2006/07 <strong>2007</strong>/<strong>08</strong><br />
Male victims<br />
Victim acquainted with suspect<br />
Son or daughter 7 7 7 8 6 5 3 2 3 4 6<br />
Parent 2 2 2 1 2 2 4 3 3 1 2<br />
Partner/ex-partner 8 6 5 5 5 6 5 7 5 5 6<br />
Other family 3 2 4 3 2 2 3 3 3 3 3<br />
Friend/acquaintance 36 39 31 26 26 24 31 31 27 32 31<br />
Total known 55 57 49 44 41 39 46 46 42 46 48<br />
30 31 34 41 40 44 42 44 46 39 36<br />
Victim not acquainted with suspect<br />
Stranger 2<br />
No suspect 16 13 17 15 19 17 12 11 12 15 16<br />
Total not known 45 43 51 56 59 61 54 54 58 54 52<br />
TOTAL 100 100 100 100 100 100 100 100 100 100 100<br />
Female victims<br />
Victim acquainted with suspect<br />
Son or daughter 9 12 8 17 5 7 8 9 6 8 9<br />
Parent 7 3 3 2 5 3 4 3 2 2 5<br />
Partner/ex-partner 48 35 39 44 47 26 43 46 36 45 35<br />
Other family 3 5 2 3 4 2 3 4 2 3 7<br />
Friend/acquaintance 13 18 11 10 12 10 12 13 11 13 16<br />
Total known 79 73 63 77 73 47 70 75 58 70 73<br />
22<br />
13 19 29 18 16 45 22 18 32 18 13<br />
Victim not acquainted with suspect<br />
Stranger 2<br />
No suspect 8 8 8 5 11 8 8 7 10 12 14<br />
Total not known 21 27 37 23 27 53 30 25 42 30 27<br />
TOTAL 100 100 100 100 100 100 100 100 100 100 100<br />
All victims<br />
Victim acquainted with suspect<br />
Son or daughter 8 9 7 11 5 6 5 4 4 5 7<br />
Parent 3 2 2 1 3 2 4 3 3 1 3<br />
Partner/ex-partner 22 16 17 16 18 14 16 18 15 16 14<br />
Other family 3 3 3 3 3 2 3 3 3 3 4<br />
Friend/acquaintance 28 32 24 21 22 18 26 26 22 27 27<br />
Total known 63 62 54 54 51 42 53 54 47 52 55<br />
24 27 32 34 32 44 36 36 41 34 30<br />
Victim not acquainted with suspect<br />
Stranger 2<br />
No suspect 13 11 14 12 17 13 11 10 11 15 15<br />
Total not known 37 38 46 46 49 58 47 46 53 48 45<br />
TOTAL 100 100 100 100 100 100 100 100 100 100 100<br />
1. As at 4 November 20<strong>08</strong>; figures are subject to revision as cases are dealt with by the police <strong>and</strong> by the courts, or as further information becomes available.<br />
2. Includes not known.
Table 1.06 <strong>Offences</strong> currently 1 recorded as homicide by apparent circumstances <strong>and</strong> relationship of victim to principal<br />
suspect: Engl<strong>and</strong> <strong>and</strong> Wales 1997/98 to <strong>2007</strong>/<strong>08</strong><br />
Numbers Recorded crime<br />
Apparent circumstances 2<br />
1997/98 1998/99 1999/00 2000/01 2001/02 2002/03 2003/04 2004/05 2005/06 2006/07 <strong>2007</strong>/<strong>08</strong><br />
Acquaintance<br />
Quarrel, revenge or loss of temper 255 252 177 221 227 194 215 219 171 2<strong>08</strong> 213<br />
In furtherance of theft or gain 11 14 7 7 15 11 20 14 16 12 14<br />
Attributed to acts of terrorism 4<br />
- - - - - - - - - - -<br />
While attempting to restrain or arrest individual 5<br />
- - - - - - - - - - -<br />
The result of offences of arson 1 1 1 2 4 1 7 6 4 5 5<br />
Other circumstances 6<br />
37 32 43 61 59 55 35 53 35 58 81<br />
Irrational act 7<br />
30 18 16 12 19 26 23 26 10 13 18<br />
Not known 8<br />
51 83 119 111 88 116 111 1<strong>08</strong> 104 89 89<br />
Total 385 400 363 414 412 403 411 426 340 385 420<br />
Stranger 3<br />
Quarrel, revenge or loss of temper 73 73 73 89 115 98 103 96 75 106 128<br />
In furtherance of theft or gain 32 30 26 83 47 36 31 28 22 15 33<br />
Attributed to acts of terrorism 4<br />
- - 3 - - - - - 52 - -<br />
While attempting to restrain or arrest individual 5<br />
1 - 2 2 - 4 1 - 1 - 2<br />
The result of offences of arson 2 - 3 4 6 9 5 16 7 6 6<br />
Other circumstances 6<br />
31 48 51 51 63 234 78 57 51 52 72<br />
Irrational act 7<br />
3 3 1 - 4 5 4 8 4 11 5<br />
Not known 8<br />
82 92 153 130 161 164 143 153 171 167 97<br />
Total 224 246 312 359 396 550 365 358 383 357 343<br />
All relationships 3<br />
Quarrel, revenge or loss of temper 328 325 250 310 342 292 318 315 246 314 341<br />
In furtherance of theft or gain 43 44 33 90 62 47 51 42 38 27 47<br />
Attributed to acts of terrorism 4<br />
- - 3 - - - - - 52 - -<br />
While attempting to restrain or arrest individual 5<br />
1 - 2 2 - 4 1 - 1 - 2<br />
The result of offences of arson 3 1 4 6 10 10 12 22 11 11 11<br />
Other circumstances 6<br />
68 80 94 112 122 289 113 110 86 110 153<br />
Irrational act 7<br />
33 21 17 12 23 31 27 34 14 24 23<br />
Not known 8<br />
133 175 272 241 249 280 254 261 275 256 186<br />
Total 609 646 675 773 8<strong>08</strong> 953 776 784 723 742 763<br />
1. As at 4 November 20<strong>08</strong>; figures are subject to revision as cases are dealt with by the police <strong>and</strong> by the courts, or as further information becomes available.<br />
2. In some cases, the circumstances of a homicide could be classified in more than one row in the table <strong>and</strong> an assessment has been made of the principal circumstances,<br />
against which the offence is shown. New categories were introduced on the Homicide Index on 1 April <strong>2007</strong> <strong>and</strong> retrospective data have been incorporated into new categories.<br />
3. Including cases where there is no suspect.<br />
4. <strong>Offences</strong> 'attributed to acts of terrorism' include all bombings <strong>and</strong> political assassinations so attributed even where there is no individual suspect <strong>and</strong> also other homicides<br />
where there are strong grounds for believing that the killers were terrorists. All 52 homicides recorded in 2005/06 relate to the 7 July London bombings.<br />
5. <strong>Homicides</strong> 'while attempting to restrain or arrest individual' only include cases where a police officer or a person actively assisting a police officer was killed. Cases in which<br />
an innocent byst<strong>and</strong>er was killed during an arrest, or where it is thought that a member of the public may have been killed while attempting to apprehend the killer for some<br />
offence when no poice office was present, are included in 'other circumstances'.<br />
6. It is not possible to show separately offences committed in the course of furtherance of a sexual attack as there is often insufficient information available.<br />
7. The presented category 'irrational act' no longer includes cases where circumstances were considered to be 'motiveless'.<br />
8. Includes cases where no rational motive has been identified. Where no suspect has been found it is not always possible to establish the circumstances in which a homicide<br />
was committed or the reason for its commission.<br />
23
Table 1.07 <strong>Offences</strong> currently 1 recorded as homicide by age <strong>and</strong> sex of victim: Engl<strong>and</strong> <strong>and</strong> Wales, 1997/98 to<br />
<strong>2007</strong>/<strong>08</strong><br />
Numbers Recorded crime<br />
Age Sex 1997/98 1998/99 1999/00 2000/01 2 2001/02 2002/03 2003/04 2004/05 3 2005/06 4 2006/07 5 <strong>2007</strong>/<strong>08</strong><br />
Under 1 year Male 19 19 18 25 11 14 19 11 14 10 14<br />
Female 10 18 13 23 5 19 8 11 9 6 10<br />
Total 29 37 31 48 16 33 27 22 23 16 24<br />
1 <strong>and</strong> under 5 years Male 7 13 7 14 14 15 10 12 5 16 13<br />
Female 9 7 4 6 5 11 9 8 4 9 8<br />
Total 16 20 11 20 19 26 19 20 9 25 21<br />
5 <strong>and</strong> under 16 years Male 16 13 14 20 20 10 16 9 9 17 16<br />
Female 10 11 9 10 7 24 10 10 9 10 8<br />
Total 26 24 23 30 27 34 26 19 18 27 24<br />
16 <strong>and</strong> under 30 years Male 117 133 149 161 183 154 172 186 167 186 189<br />
Female 56 47 49 60 63 59 54 60 76 52 51<br />
Total 173 180 198 221 246 213 226 246 243 238 240<br />
30 <strong>and</strong> under 50 years Male 162 158 183 195 228 214 231 198 185 220 228<br />
Female 71 60 76 82 92 83 72 73 90 73 69<br />
Total 233 218 259 277 320 297 303 271 275 293 297<br />
50 <strong>and</strong> under 70 years Male 65 73 60 57 76 72 84 96 76 77 81<br />
Female 28 37 31 20 37 61 39 36 28 28 33<br />
Total 93 110 91 77 113 133 123 132 104 105 114<br />
70 years <strong>and</strong> over Male 14 21 18 18 27 62 21 30 23 21 14<br />
Female 25 36 44 24 40 155 30 31 26 16 29<br />
Total 39 57 62 42 67 217 51 61 49 37 43<br />
Total all ages Male 400 430 449 544 559 541 554 554 479 547 555<br />
% 66 67 67 70 69 57 71 71 66 74 73<br />
Female 209 216 226 229 249 412 222 230 244 195 2<strong>08</strong><br />
% 34 33 33 30 31 43 29 29 34 26 27<br />
TOTAL 609 646 675 773 2<br />
8<strong>08</strong> 953 776 784 3<br />
723 4<br />
742 5<br />
763<br />
Rates per million population<br />
Under 1 year Male 57 59 56 81 37 46 61 34 43 30 40<br />
Female 32 59 43 78 17 66 27 36 29 19 30<br />
Total 45 59 50 80 27 56 44 35 36 24 36<br />
1 <strong>and</strong> under 5 years Male 5 10 5 11 11 12 8 10 4 13 10<br />
Female 7 6 3 5 4 9 8 7 3 7 6<br />
Total 6 8 4 8 8 11 8 8 4 10 8<br />
5 <strong>and</strong> under 16 years Male 4 3 4 5 5 3 4 2 2 5 4<br />
Female 3 3 2 3 2 7 3 3 3 3 2<br />
Total 4 3 3 4 4 5 4 3 2 4 3<br />
16 <strong>and</strong> under 30 years Male 25 29 32 35 40 33 37 39 34 37 37<br />
Female 12 10 11 13 14 13 12 13 16 11 10<br />
Total 18 19 21 24 27 23 24 26 25 24 24<br />
30 <strong>and</strong> under 50 years Male 22 22 25 26 30 28 30 26 24 29 30<br />
Female 10 8 10 11 12 11 9 9 12 9 9<br />
Total 16 15 17 19 21 19 20 18 18 19 19<br />
50 <strong>and</strong> under 70 years Male 12 14 11 10 14 13 15 17 13 13 14<br />
Female 5 7 5 3 6 10 7 6 5 5 5<br />
Total 9 10 8 7 10 12 11 11 9 9 9<br />
70 years <strong>and</strong> over Male 6 9 8 8 11 25 9 12 9 8 5<br />
Female 7 10 12 7 11 43 8 9 7 4 8<br />
Total 7 10 10 7 11 36 8 10 8 6 7<br />
Total all ages Male 16 17 18 22 22 21 21 21 18 21 21<br />
Female 8 8 9 9 9 15 8 8 9 7 8<br />
TOTAL 12 13 13 15 15 18 15 15 14 14 14<br />
1. As at 4 November 20<strong>08</strong>; figures are subject to revision as cases are dealt with by the police <strong>and</strong> the courts, or as further information becomes available.<br />
2. For the year 2000/01 there were 58 victims (54 male <strong>and</strong> 4 female) age not known.<br />
3. For the year 2004/05 there were 13 victims of unknown age.<br />
4. For the year 2005/06 there were 2 victims of unknown age.<br />
5. For the year 2006/07 there was 1 victim of unknown age.<br />
24
Table 1.<strong>08</strong> Suspects convicted of homicide 1 by type of homicide: Engl<strong>and</strong> <strong>and</strong> Wales, 1969<br />
to <strong>2007</strong>/<strong>08</strong><br />
Numbers Recorded crime<br />
Year offence Total indicted Convicted of homicide<br />
initially for homicide Total Murder Section 2 Other Infanticide<br />
recorded manslaughter manslaughter<br />
1969 367 271 78 58 122 13<br />
1970 386 299 99 65 120 15<br />
1971 418 327 91 72 146 18<br />
1972 450 337 85 85 150 17<br />
1973 427 321 83 77 152 9<br />
1974 537 424 125 96 188 15<br />
1975 503 383 99 77 203 4<br />
1976 530 394 1<strong>08</strong> 92 188 6<br />
1977 457 362 116 94 146 6<br />
1978 529 424 137 90 189 8<br />
1979 595 475 169 109 190 7<br />
1980 537 423 140 88 186 9<br />
1981 543 448 167 87 187 7<br />
1982 525 441 161 102 172 6<br />
1983 523 417 153 80 174 10<br />
1984 579 451 171 77 201 2<br />
1985 595 457 166 76 207 8<br />
1986 662 506 2<strong>08</strong> 84 211 3<br />
1987 677 515 216 78 220 1<br />
1988 642 493 189 74 222 8<br />
1989 633 458 198 83 176 1<br />
1990 625 443 186 70 183 4<br />
1991 711 502 197 76 224 5<br />
1992 7<strong>08</strong> 504 215 78 205 6<br />
1993 681 501 224 62 210 5<br />
1994 652 495 230 71 191 3<br />
1995 748 558 278 53 224 3<br />
1996 727 534 261 50 219 4<br />
1997 709 509 250 47 209 3<br />
1997/98 707 520 235 49 232 4<br />
1998/99 748 528 254 41 226 7<br />
1999/00 774 530 278 27 224 1<br />
2000/01 793 574 288 18 263 5<br />
2001/02 819 648 321 19 307 1<br />
2002/03 829 603 331 13 259 -<br />
2003/04 863 627 353 21 253 -<br />
2004/05 859 653 384 21 247 1<br />
2005/06 670 537 346 25 165 1<br />
2006/07 625 470 280 32 158 -<br />
<strong>2007</strong>/<strong>08</strong> 2<br />
384 305 181 9 115 -<br />
1. As at 4 November 20<strong>08</strong>; figures are subject to revision as cases are dealt with by the police <strong>and</strong> the courts, or as further information becomes<br />
available.<br />
2. In addition there were 519 suspects in <strong>2007</strong>/<strong>08</strong> for whom court proceedings were not completed by 4 November 20<strong>08</strong>.<br />
25
Table 1.09 Suspects indicted for homicide by outcome of proceedings 1 : Engl<strong>and</strong> <strong>and</strong> Wales, 1997/98 to <strong>2007</strong>/<strong>08</strong><br />
Numbers Recorded crime<br />
Indictment <strong>and</strong> outcome 1997/98 1998/99 1999/00 2000/01 2001/02 2002/03 2003/04 2004/05 2005/06 2006/07 <strong>2007</strong>/<strong>08</strong><br />
Male suspects<br />
Indictment<br />
Murder 5<strong>08</strong> 548 600 573 640 630 650 646 522 467 294<br />
Manslaughter 113 102 106 127 1<strong>08</strong> 109 115 128 96 97 44<br />
Infanticide * * * * * * * * * * *<br />
Total<br />
Outcome:<br />
Not convicted of homicide<br />
621 650 706 700 748 739 765 774 618 564 338<br />
2<br />
Not tried - count to remain on file 3<br />
7 9 11 10 2 1 5 3 1 2 -<br />
Found unfit to plead 2 - 2 4 1 2 4 - - 1 2<br />
Found not guilty by reason of insanity 4 3 2 1 - 1 1 - 1 2 1<br />
Convicted of lesser offence 19 32 31 22 17 21 17 26 14 28 13<br />
Acquitted on all counts 130 128 170 150 131 164 166 144 99 100 46<br />
Committed suicide or died - 2 2 1 2 2 4 6 - 3 3<br />
Total<br />
Convicted of homicide:<br />
162 174 218 188 153 191 197 179 115 136 65<br />
Murder 224 238 266 270 307 311 329 359 334 263 168<br />
Sec. 2 manslaughter 38 35 21 15 15 12 19 20 25 30 8<br />
Other manslaughter 197 203 201 227 273 225 220 216 144 135 97<br />
Infanticide * * * * * * * * * * *<br />
Total 459 476 488 512 595 548 568 595 503 428 273<br />
Total<br />
621 650 706 700 748 739 765 774 618 564 338<br />
Female suspects<br />
Indictment<br />
Murder 57 78 58 65 55 67 75 56 31 42 35<br />
Manslaughter 28 16 10 24 14 22 23 28 18 18 11<br />
Infanticide 1 4 1 1 1 - 1 2 - -<br />
Total<br />
Outcome:<br />
Not convicted of homicide<br />
86 98 68 90 70 90 98 85 51 60 46<br />
2<br />
Not tried - count to remain on file 3<br />
1 3 1 3 1 2 4 1 1 1 -<br />
Found unfit to plead - 1 1 1 - 1 - - 1 -<br />
Found not guilty by reason of insanity - - - - - - 2 - - - -<br />
Convicted of lesser offence 4 9 3 2 2 3 1 3 4 3 3<br />
Acquitted on all counts 20 33 21 22 15 29 28 23 11 14 9<br />
Committed suicide or died - - - - - - 4 - - - 2<br />
Total<br />
Convicted of homicide:<br />
25 46 26 28 18 35 39 27 17 18 14<br />
Murder 11 16 12 18 14 20 24 25 12 17 13<br />
Sec. 2 manslaughter 11 6 6 3 4 1 2 1 - 2 1<br />
Other manslaughter 35 23 23 36 33 34 33 31 21 23 18<br />
Infanticide 4 7 1 5 1 - - 1 1 - -<br />
Total 61 52 42 62 52 55 59 58 34 42 32<br />
Total<br />
86 98 68 90 70 90 98 85 51 60 46<br />
26
Table 1.09 (continued)<br />
Numbers Recorded crime<br />
Indictment <strong>and</strong> outcome 1997/98 1998/99 1999/00 2000/01 2001/02 2002/03 2003/04 2004/05 2005/06 2006/07 <strong>2007</strong>/<strong>08</strong><br />
All suspects<br />
Indictment 4<br />
Murder 565 626 658 638 695 697 725 702 553 509 329<br />
Manslaughter 5<br />
141 118 116 154 123 131 138 156 115 116 55<br />
Infanticide 1 4 - 1 1 1 - 1 2 - -<br />
Total<br />
Outcome:<br />
Not convicted of homicide<br />
707 748 774 793 819 829 863 859 670 625 384<br />
2<br />
Not tried - count to remain on file 3<br />
8 12 12 13 3 3 9 4 2 3 -<br />
Found unfit to plead 2 1 3 5 1 3 4 - 1 1 2<br />
Found not guilty by reason of insanity 4 3 2 1 - 1 3 - 1 2 1<br />
Convicted of lesser offence 23 41 34 25 19 24 18 29 19 31 16<br />
Acquitted on all counts 150 161 191 174 146 193 194 167 110 115 55<br />
Committed suicide or died - 2 2 1 2 2 8 6 - 3 5<br />
Total<br />
Convicted of homicide:<br />
187 220 244 219 171 226 236 206 133 155 79<br />
Murder 235 254 278 288 321 331 353 384 346 280 181<br />
Sec. 2 manslaughter 49 41 27 18 19 13 21 21 25 32 9<br />
Other manslaughter 232 226 224 263 307 259 253 247 165 158 115<br />
Infanticide 4 7 1 5 1 - - 1 1 - -<br />
Total 520 528 530 574 648 603 627 653 537 470 305<br />
Total 707 748 774 793 819 829 863 859 670 625 384<br />
1. As at 4 November 20<strong>08</strong>; figures are subject to revision as cases are dealt with by the police <strong>and</strong> the courts, or as further information becomes available.<br />
2. The offences for which these persons were indicted may nevertheless remain currently recorded as homicide.<br />
3. This usually implies that the suspect has been dealt with for some less serious offence.<br />
4. In addition there were 519 suspects in <strong>2007</strong>/<strong>08</strong>, for whom court proceedings were not completed by 4 November 20<strong>08</strong>.<br />
5. Three corporate manslaughters were included in 2000/01, one in 2001/02 <strong>and</strong> one in 2005/06.<br />
27
Table 1.10 Suspects convicted of homicide by type of homicide <strong>and</strong> sentence 1 : Engl<strong>and</strong> <strong>and</strong> Wales, 1997/98 to<br />
<strong>2007</strong>/<strong>08</strong><br />
Numbers Recorded crime<br />
Sentence 2<br />
1997/98 1998/99 1999/00 2000/01 2001/02 2002/03 2003/04 2004/05 2005/06 2006/07 <strong>2007</strong>/<strong>08</strong><br />
Male suspects<br />
Murder<br />
Life imprisonment 3<br />
Section 2 manslaughter<br />
224 238 266 270 307 311 329 359 334 263 168<br />
4<br />
Immediate imprisonment 5<br />
Life 3<br />
2 6 3 - 1 1 2 2 2 5 -<br />
Over 10 years (excluding life) - - - - - 1 - - - - -<br />
Over 4 <strong>and</strong> up to 10 years 8 3 4 4 1 2 4 5 - 3 -<br />
4 years <strong>and</strong> under 2 - 2 1 2 2 5 2 7 3 1<br />
Fully suspended sentence - 1 - 2 - - - 1 - - 1<br />
Hospital/Restriction Order 24 22 7 5 6 1 4 6 11 15 4<br />
Hospital Order 1 1 3 2 5 5 3 3 4 4 2<br />
Probation/Supervision 1 2 2 1 - - 1 - - - -<br />
Other sentence - - - - - - - 1 - - -<br />
Total<br />
Other manslaughter<br />
Immediate imprisonment<br />
38 35 21 15 15 12 19 20 25 30 8<br />
5<br />
Life 3<br />
8 8 15 9 16 8 10 14 11 13 1<br />
Over 10 years (excluding life) 6 7 4 5 11 6 6 12 5 3 4<br />
Over 4 <strong>and</strong> up to 10 years 86 86 89 104 123 110 104 85 52 63 49<br />
4 years <strong>and</strong> under 81 85 77 93 86 70 77 86 74 50 39<br />
Fully suspended sentence 7 5 1 6 5 2 1 5 - - -<br />
Hospital/Restriction Order 1 5 6 3 7 11 11 10 1 2 2<br />
Hospital Order 2 1 2 5 12 13 10 4 1 4 1<br />
Probation/Supervision 5 4 7 2 9 5 1 - - -<br />
Other sentence 1 2 - - 4 - - - - - 1<br />
Total<br />
Infanticide<br />
Immediate imprisonment<br />
197 203 201 227 273 225 220 216 144 135 97<br />
5<br />
4 years <strong>and</strong> under * * * * * * * * * * *<br />
Hospital/Restriction Order * * * * * * * * * * *<br />
Hospital Order * * * * * * * * * * *<br />
Probation/Supervision * * * * * * * * * * *<br />
Other sentence * * * * * * * * * * *<br />
Total * * * * * * * * * * *<br />
Total 4<br />
459 476 488 512 595 548 568 595 503 428 273<br />
28
Table 1.10 (continued)<br />
Numbers Recorded crime<br />
Sentence 2<br />
1997/98 1998/99 1999/00 2000/01 2001/02 2002/03 2003/04 2004/05 2005/06 2006/07 <strong>2007</strong>/<strong>08</strong><br />
Female suspects<br />
Murder<br />
Life imprisonment 3<br />
Section 2 manslaughter<br />
Immediate imprisonment<br />
11 16 12 18 14 20 24 25 12 17 13<br />
5<br />
Life 3<br />
- 1 1 - 1 - 1 - - - -<br />
Over 10 years (excluding life) - - - - - - - - - - -<br />
Over 4 <strong>and</strong> up to 10 years 1 - - 1 - - - - - - -<br />
4 years <strong>and</strong> under - 1 1 1 2 - 1 - - 1 -<br />
Fully suspended sentence - - - - - - - 1 - - -<br />
Hospital/Restriction Order 6 2 - - - - - - - 1 1<br />
Hospital Order 1 - 1 1 - - - - - -<br />
Probation/Supervision 3 2 3 1 - 1 - - - - -<br />
Other sentence - - - - - - - - - - -<br />
Total<br />
Other manslaughter<br />
Immediate imprisonment<br />
11 6 6 3 4 1 2 1 - 2 1<br />
5<br />
Life 3<br />
1 1 2 - 1 1 - 1 1 2 -<br />
Over 10 years (excluding life) - - - 1 1 - 1 - 1 - 1<br />
Over 4 <strong>and</strong> up to 10 years 9 5 - 10 12 7 14 11 7 9 5<br />
4 years <strong>and</strong> under 14 7 12 16 10 17 11 10 10 9 11<br />
Fully suspended sentence 1 2 - 1 1 - 4 1 - - -<br />
Hospital/Restriction Order - 1 1 1 - 2 2 1 1 1 -<br />
Hospital Order - - - 3 3 2 - - 1 - 1<br />
Probation/Supervision 10 7 8 4 5 5 1 5 - - -<br />
Other sentence - - - - - - - 2 - 2 -<br />
Total<br />
Infanticide<br />
Immediate imprisonment<br />
35 23 23 36 33 34 33 31 21 23 18<br />
5<br />
4 years <strong>and</strong> under 2 - - 1 - - - - - - -<br />
Hospital/Restriction Order - - - - - - - - - - -<br />
Hospital Order - 2 - - - - - - - - -<br />
Probation/Supervision 2 5 1 4 1 - - 1 - - -<br />
Other sentence - - - - - - - - 1 - -<br />
Total 4 7 1 5 1 - - 1 1 - -<br />
Total 61 52 42 62 52 55 59 58 34 42 32<br />
29
Table 1.10 (continued)<br />
Numbers Recorded crime<br />
Sentence 2<br />
1997/98 1998/99 1999/00 2000/01 2001/02 2002/03 2003/04 2004/05 2005/06 2006/07 <strong>2007</strong>/<strong>08</strong><br />
All suspects<br />
Murder<br />
Life imprisonment 3<br />
Section 2 manslaughter<br />
235 254 278 288 321 331 353 384 346 280 181<br />
4<br />
Immediate imprisonment 5<br />
Life 3<br />
2 7 4 - 2 1 3 2 2 5 -<br />
Over 10 years (excluding life) - - - - - 1 - - - - -<br />
Over 4 <strong>and</strong> up to 10 years 9 3 4 5 1 2 4 5 - 3 -<br />
4 years <strong>and</strong> under 2 1 3 2 4 2 6 2 7 4 1<br />
Fully suspended sentence - 1 - 2 - - - 2 - - 1<br />
Hospital/Restriction Order 30 24 7 5 6 1 4 6 11 16 5<br />
Hospital Order 2 1 4 2 6 5 3 3 4 4 2<br />
Probation/Supervision 4 4 5 2 - 1 1 - - - -<br />
Other sentence - - - - - - - 1 - - -<br />
Total<br />
Other manslaughter<br />
Immediate imprisonment<br />
49 41 27 18 19 13 21 21 25 32 9<br />
5<br />
Life 3<br />
9 9 17 9 17 9 10 15 12 15 1<br />
Over 10 years (excluding life) 6 7 4 6 12 6 7 12 6 3 5<br />
Over 4 <strong>and</strong> up to 10 years 95 91 89 114 135 117 118 96 59 72 54<br />
4 years <strong>and</strong> under 95 92 89 109 96 87 88 96 84 59 50<br />
Fully suspended sentence 8 7 1 7 6 2 5 6 - - -<br />
Hospital/Restriction Order 1 6 7 4 7 13 13 11 2 3 2<br />
Hospital Order 2 1 2 8 15 15 10 4 2 4 2<br />
Probation/Supervision 15 11 15 6 14 10 2 5 - - -<br />
Other sentence 1 2 - - 5 - - 2 - 2 1<br />
Total<br />
Infanticide<br />
Immediate imprisonment<br />
232 226 224 263 307 259 253 247 165 158 115<br />
5<br />
4 years <strong>and</strong> under 2 - - 1 - - - - - - -<br />
Hospital/Restriction Order - - - - - - - - - - -<br />
Hospital Order - 2 - - - - - - - - -<br />
Probation/Supervision 2 5 1 4 1 - - 1 - - -<br />
Other sentence - - - - - - - - 1 - -<br />
Total 4 7 1 5 1 - - 1 1 - -<br />
Total 4<br />
520 528 530 574 648 603 627 653 537 470 305<br />
1. As at 4 November 20<strong>08</strong>; figures are subject to revision as cases are dealt with by the police <strong>and</strong> by the courts, or as further information becomes available.<br />
2. The results of appeals, apart from those occurring since the beginning of 1997, have been taken into account in compiling this table.<br />
3. Including detention during Her Majesty's Pleasure under s.53(1) Children <strong>and</strong> Young Persons Act 1933 <strong>and</strong> custody for life.<br />
4. In addition, one suspect was convicted of Sec2 manslaughter but died before sentencing for an offence recorded in 2005/06.<br />
5. Including detention under s.53(2) Children <strong>and</strong> Young Persons Act 1933, partly suspended sentences <strong>and</strong> young offender institution.<br />
30
Table 1.11 Suspects convicted of homicide by previous homicide convictions 1 : Engl<strong>and</strong> <strong>and</strong> Wales, 1997/98 to <strong>2007</strong>/<strong>08</strong><br />
Numbers Recorded crime<br />
Year offence initially<br />
recorded<br />
Total number convicted<br />
1997/98 1998/99 1999/00 2000/01 2001/02 2002/03 2003/04 2004/05 2005/06 2006/07 <strong>2007</strong>/<strong>08</strong><br />
of homicide<br />
Number previously<br />
520 528 530 574 648 603 627 653 537 470 305<br />
convicted of homicide: 1 2<br />
1 8 2<br />
1 3<br />
- 2 2<br />
3 4 8 2<br />
2 2<br />
While serving sentence<br />
for homicide<br />
After release or termination<br />
of sentence for previous<br />
- - 2 - - 1 - - - - -<br />
homicide conviction 1 1 6 1 - 1 3 4 8 2 -<br />
1. As at 4 November 20<strong>08</strong>; figures are subject to revision as cases are dealt with by the police <strong>and</strong> by the courts, or as further information becomes available.<br />
2. In addition, one suspect of an offence who committed suicide had previously been convicted of homicide.<br />
3. In addition, one suspect of an offence who died had previously been convicted of homicide.<br />
Table 1.12 Suspects convicted of homicide who had previously been convicted of homicide by type of<br />
homicide 1 : Engl<strong>and</strong> <strong>and</strong> Wales, 1997/98 to <strong>2007</strong>/<strong>08</strong><br />
Numbers Recorded crime<br />
Homicide offence of Total<br />
Homicide offence of previous conviction<br />
latest conviction Murder Section 2 Other<br />
Manslaughter Manslaughter<br />
Murder 24 9 3 12<br />
Section 2 manslaughter 2 1 1 -<br />
Other manslaughter 4 - - 4<br />
Total 30 10 2<br />
1. As at 4 November 20<strong>08</strong>; figures are subject to revision as cases are dealt with by the police <strong>and</strong> by the courts, or as further information<br />
becomes available.<br />
2. In addition, four suspects who committed suicide had previously been convicted for murder.<br />
3. In addition, one suspect who died had previously been convicted of Section 2 manslaughter.<br />
4. In addition, two suspects who committed suicide had previously been convicted for other manslaughter.<br />
31<br />
4 3<br />
16 4<br />
- 2
Table 1.13 Currently recorded homicides 1 by region <strong>and</strong> police force area: Engl<strong>and</strong> <strong>and</strong> Wales, 2003/04 to<br />
<strong>2007</strong>/<strong>08</strong><br />
Police force area 2003/04 2004/05 2005/06 2<br />
2006/07 <strong>2007</strong>/<strong>08</strong><br />
Recorded crime<br />
<strong>Offences</strong> per million<br />
population <strong>2007</strong>/<strong>08</strong><br />
North East Region<br />
Clevel<strong>and</strong> 6 6 5 4 8 14.3<br />
Durham 2 2 8 11 7 11.6<br />
Northumbria 22 15 16 25 29 20.7<br />
North West Region<br />
Cheshire 11 10 14 8 9 9.0<br />
Cumbria 4 7 2 - 3 6.0<br />
Gtr Manchester 53 56 52 56 49 19.1<br />
Lancashire 54 29 12 23 21 14.5<br />
Merseyside 30 42 25 24 31 23.0<br />
Yorkshire <strong>and</strong> the Humber<br />
Humberside 19 13 10 18 12 13.2<br />
North Yorkshire 7 12 4 2 4 5.1<br />
South Yorkshire 12 16 21 21 28 21.5<br />
West Yorkshire<br />
East Midl<strong>and</strong>s Region<br />
39 39 35 43 46 21.1<br />
Derbyshire 14 8 5 10 7 7.0<br />
Leicestershire 17 8 6 13 12 12.3<br />
Lincolnshire 4 2 4 6 11 15.9<br />
Northamptonshire 5 3 10 14 8 11.8<br />
Nottinghamshire 17 19 15 14 12 11.3<br />
West Midl<strong>and</strong>s Region<br />
Staffordshire 11 5 11 12 13 12.2<br />
Warwickshire 5 4 8 5 6 11.4<br />
West Mercia 16 11 6 16 11 9.3<br />
West Midl<strong>and</strong>s<br />
East of Engl<strong>and</strong> Region<br />
45 66 49 42 41 15.7<br />
Bedfordshire 7 7 9 9 10 16.8<br />
Cambridgeshire 8 13 10 7 7 9.2<br />
Essex 10 11 20 22 15 8.9<br />
Hertfordshire 10 11 9 10 8 7.5<br />
Norfolk 8 2 11 5 8 9.5<br />
Suffolk 9 5 5 10 7 9.9<br />
London Region<br />
South East Region<br />
187 178 171 166 162 21.4<br />
Hampshire 17 17 10 18 19 10.3<br />
Kent 13 13 15 16 17 10.3<br />
Surrey 6 10 10 2 9 8.2<br />
Sussex 15 20 14 12 11 7.2<br />
Thames Valley 20 25 21 23 17 7.8<br />
South West Region<br />
Avon <strong>and</strong> Somerset 16 15 9 11 16 10.1<br />
Devon <strong>and</strong> Cornwall 16 25 15 17 22 13.2<br />
Dorset 8 6 2 6 7 9.9<br />
Gloucestershire 6 8 2 3 4 6.9<br />
Wiltshire<br />
Wales<br />
3 6 7 4 8 12.5<br />
Dyfed-Powys - 4 3 2 10 19.7<br />
Gwent 5 10 5 7 11 19.6<br />
North Wales 3 12 6 6 8 11.8<br />
South Wales 15 13 9 16 16 13.0<br />
British Transport Police 3<br />
1 - 42 3 3 *<br />
ENGLAND AND WALES<br />
ENGLAND AND WALES<br />
776 784 723 742 763 14.1<br />
(excluding London Region) 589 606 552 576 601 12.9<br />
1. As at 4 November 20<strong>08</strong>; figures are subject to revision as cases are dealt with by the police <strong>and</strong> by the courts, or as further information becomes available.<br />
2. Year 2005/06 includes 52 victims of the 7 July London bombings: 39 recorded by British Transport Police, 13 by the Metropolitan Police Service (included in London total).<br />
3. BTP initially recorded 10 homicides for 2004/05; full details of which were unavailable as at 4 November 20<strong>08</strong>.<br />
32
2 Recorded crimes involving firearms<br />
Peter Kaiza<br />
SUMMARY<br />
This chapter deals with crimes recorded by the police that involve the use of a firearm. <strong>Firearm</strong>s<br />
are taken to be involved in a crime if they are fired, used as a blunt instrument against a person,<br />
or used as a threat. Types of firearm include air weapons, imitation weapons, rifles, shotguns <strong>and</strong><br />
h<strong>and</strong>guns, as well as CS gas <strong>and</strong> pepper sprays. Some headline figures, however, exclude air<br />
weapons.<br />
• <strong>Firearm</strong>s (including air weapons) were reported to have been used in 17,343 recorded crimes<br />
in <strong>2007</strong>/<strong>08</strong>. This is six per cent down on 2006/07, <strong>and</strong> the fourth consecutive annual fall.<br />
<strong>Firearm</strong> offences (excluding air weapons) were up by two per cent to 9,865, following a 13<br />
per cent fall in the previous year.<br />
• There were 2,562 offences in which the weapon was classified as an imitation in <strong>2007</strong>/<strong>08</strong>, a<br />
two per cent increase compared to 2006/07. There were 4,172 h<strong>and</strong>gun offences in <strong>2007</strong>/<strong>08</strong>,<br />
virtually unchanged from 2006/07.<br />
• Serious or fatal injury accounted for three per cent of all firearm crimes in <strong>2007</strong>/<strong>08</strong>. There<br />
were 541 such injuries (including 53 fatalities) resulting from crimes that involved a firearm<br />
(including air weapons), four per cent fewer than in 2006/07.<br />
• <strong>Firearm</strong> crimes involving any type of injury increased by two per cent in <strong>2007</strong>/<strong>08</strong>, from 4,065<br />
in 2006/07 to 4,164 in <strong>2007</strong>/<strong>08</strong>. There was an 11 per cent increase in the number of offences<br />
involving h<strong>and</strong>guns causing injury in <strong>2007</strong>/<strong>08</strong>, following a 23 per cent decrease in the<br />
previous year.<br />
• Weapons (excluding air weapons) were fired in 39 per cent of firearm crimes. H<strong>and</strong>guns were<br />
fired in ten per cent of the offences where they were involved, <strong>and</strong> shotguns in 38 per cent.<br />
• The number of firearm robberies increased by one per cent in <strong>2007</strong>/<strong>08</strong>, having fallen by three<br />
per cent in the previous year. Thirty-three per cent of these were committed in public<br />
highways, the number of which decreased by ten per cent from 1,457 in 2006/07 to 1,314 in<br />
<strong>2007</strong>/<strong>08</strong>.<br />
• Twenty-seven per cent of victims of firearm-related offences (excluding air weapons) in<br />
<strong>2007</strong>/<strong>08</strong> were aged between 30 <strong>and</strong> 49, followed by 21- to 29-year-olds who were victims in<br />
22 per cent of the crimes. Persons aged less than five <strong>and</strong> over 69 years were victims in 0.3<br />
<strong>and</strong> one per cent of the crimes respectively.<br />
• Fifty-six per cent of all firearm offences (excluding air weapons) in <strong>2007</strong>/<strong>08</strong> occurred in just<br />
three police force areas: Metropolitan, Greater Manchester <strong>and</strong> West Midl<strong>and</strong>s.<br />
• Overall, firearms (including air weapons) were used in 0.4 per cent of all recorded crimes, or<br />
one in every 250. This proportion is halved when air weapons are excluded.<br />
33
2.1 FIREARM CRIMES IN <strong>2007</strong>/<strong>08</strong><br />
<strong>Firearm</strong>s (including air weapons) were used in 17,343 recorded crimes in Engl<strong>and</strong> <strong>and</strong> Wales in<br />
<strong>2007</strong>/<strong>08</strong>, a fall of six per cent or 1,138 crimes compared to 2006/07. This is the fourth consecutive<br />
fall in firearm crimes; the 2006/07 fall was by 14 per cent (Table 2.03; Figure 2.1).<br />
Figure 2.1 Crimes reported to the police in which a firearm has been used, 1999/00 to<br />
<strong>2007</strong>/<strong>08</strong><br />
Numbers<br />
30,000<br />
25,000<br />
20,000<br />
15,000<br />
10,000<br />
5,000<br />
0<br />
Air weapons All firearms excluding air weapon All firearms<br />
1999/00 2000/01 2001/02 2002/03 2003/04 2004/05 2005/06 2006/07 <strong>2007</strong>/<strong>08</strong><br />
Year<br />
Forty-three per cent of firearm offences involved air weapons. Of these air weapon offences, 77<br />
per cent were crimes of criminal damage, i.e. crimes against property only (Table 2.04). Some of<br />
the increases in recorded air weapon offences over previous years can be partly attributed to<br />
changes in police recording practice, as described in the box below.<br />
There were 9,865 recorded crimes involving firearms other than air weapons. This is a two per<br />
cent increase over 2006/07. There were 7,478 crimes involving air weapons in <strong>2007</strong>/<strong>08</strong>, a 15 per<br />
cent fall over 2006/07 <strong>and</strong> the smallest total since the 1980s. This fall coincides with the recent<br />
tightening of legislation on the manufacture <strong>and</strong> sale of certain types of air weapon. (Figure 2.1;<br />
Table 2.03).<br />
Gun crime remains a relatively rare event. <strong>Firearm</strong>s (including air weapons) were used in 0.4 per<br />
cent of all recorded crime: that is nearly one in every 250 crimes. The proportion excluding air<br />
weapons was 0.2 per cent, or about one in every 500. Injury caused during a firearm offence is<br />
also rare. As will be shown later, only a fifth of firearm offences resulted in an injury <strong>and</strong> about<br />
three per cent resulted in a serious or fatal injury.<br />
Box 2.1 Impact Of Changes In Police Recording Practice<br />
The implementation of the National Crime Recording St<strong>and</strong>ard (NCRS) by police forces on 1 April 2002<br />
increased the number of crimes recorded in 2002/03 <strong>and</strong>, as a result of audits to further improve recording, in<br />
2003/04 <strong>and</strong> 2004/05 too. It has not been possible to assess accurately the effect of this change on recorded<br />
firearm crimes. This change inflated the overall number of violence against the person <strong>and</strong> criminal damage<br />
offences but had less effect on the number of robberies (see Simmons et al., 2003). Many firearm offences<br />
are amongst the categories that are most likely to have been affected by the NCRS.<br />
34
2.2 HOW FIREARMS WERE USED<br />
<strong>Firearm</strong>s can be used to threaten, or as a blunt instrument, as well as being fired. Air weapons<br />
were nearly always fired in the crimes in which they were involved (92% of crimes), but rarely<br />
caused serious injury. In contrast, other firearms were more often used as a threat or,<br />
occasionally, as a blunt instrument (Figure 2.2); non-air weapons were fired in 39 per cent of<br />
cases. Nearly half (48%) of non-air weapon firings involved imitation firearms that fire blanks,<br />
pellets <strong>and</strong> so on. These offences involving firing imitation firearms account for 73 per cent of all<br />
offences involving imitation weapons. In contrast, h<strong>and</strong>guns were fired in ten per cent of crimes in<br />
which they were involved while shotguns were fired in 38 per cent of cases (Table 2a; Table<br />
2.05).<br />
Figure 2.2 How firearms were used, <strong>2007</strong>/<strong>08</strong><br />
Per cent<br />
100<br />
90<br />
80<br />
70<br />
60<br />
50<br />
40<br />
30<br />
20<br />
10<br />
0<br />
Table 2a Crimes in which firearms were used, by type of firearm, whether fired, <strong>and</strong><br />
degree of injury caused, <strong>2007</strong>/<strong>08</strong><br />
Weapon type Number % fired<br />
Shotguns 602<br />
H<strong>and</strong>guns 4,172<br />
Imitation firearm<br />
Rifles/others<br />
2,562<br />
2<br />
2,529<br />
Air weapons 7,478<br />
% not fired 1<br />
Fatal or<br />
serious injury<br />
Non air weapons<br />
Air weapons<br />
Fired Threat Blunt instrument<br />
Of those fired<br />
% %<br />
1. Includes incidents in which firearms were used as a blunt instrument to cause injury (see Table 2.5).<br />
2. Starting guns, supposed/type unknown, prohibited firearms (including CS gas) <strong>and</strong> other firearms.<br />
Slight<br />
injury % No injury<br />
38 62 27 15 57<br />
10 90 36 21 43<br />
73 27 1 55 44<br />
53<br />
92<br />
47<br />
8<br />
11<br />
1<br />
57<br />
12<br />
32<br />
87<br />
35
2.3 TYPE OF WEAPON USED<br />
It is not always possible to categorise the type of weapon used in an offence. For example, one<br />
cannot always be certain if a crime involved a real firearm. Unless a weapon is either fired or<br />
recovered after a crime, there is no way of knowing if it was real or an imitation (or whether it was<br />
loaded or unloaded). The categorisation of firearms will often depend on descriptions by victims<br />
or witnesses. Some crimes involve ‘supposed’ firearms (i.e. something concealed which was<br />
presumed to be a firearm).<br />
Figure 2.3 Types of weapon used in non-air weapon firearm crimes, Engl<strong>and</strong> <strong>and</strong> Wales,<br />
<strong>2007</strong>/<strong>08</strong><br />
Unidentified firearm<br />
13%<br />
Imitation firearm<br />
26%<br />
Other firearm<br />
11%<br />
Long barrelled shotgun<br />
4%<br />
Sawn off shotgun<br />
2%<br />
As stated earlier, under half (43%) of all firearm offences involved an air weapon. Of those<br />
offences involving a firearm other than an air weapon, 42 per cent involved a h<strong>and</strong>gun (Figure<br />
2.3). These h<strong>and</strong>gun crimes remained almost unchanged (from 4,173 to 4,172) in <strong>2007</strong>/<strong>08</strong><br />
compared to 2006/07; this followed an 11 per cent decrease from the previous year. H<strong>and</strong>gun<br />
crimes reached a peak of 5,874 in 2001/02 but have fallen in five out of the six years since then,<br />
an overall fall of 29 per cent. Shotgun crimes were down by two per cent (from 612 to 602) from<br />
2006/07 to <strong>2007</strong>/<strong>08</strong> (Figure 2.4; Table 2.03).<br />
Imitation firearms were used in 26 per cent of non-air weapon offences. The number of crimes<br />
involving these weapons was up two per cent in <strong>2007</strong>/<strong>08</strong>, after a 23 per cent fall in the previous<br />
year. This follows a four-fold increase, from 787 in 2000/01 to a peak of 3,373 in 2004/05. The<br />
category of imitation firearms also includes BB guns/soft air weapons, deactivated firearms <strong>and</strong><br />
blank firers. BB guns/soft air weapons accounted for 83 per cent of all imitation weapons, with<br />
2,124 offences recorded in <strong>2007</strong>/<strong>08</strong>, up one per cent from the previous year. Imitation h<strong>and</strong>guns<br />
accounted for a further 13 per cent (322 offences). (Table 2.03).<br />
36<br />
Rifle<br />
1%<br />
H<strong>and</strong>gun<br />
42%
Figure 2.4 <strong>Firearm</strong> offences by type of principal weapon, 1999/00 to <strong>2007</strong>/<strong>08</strong><br />
Numbers<br />
7,000<br />
6,000<br />
5,000<br />
4,000<br />
3,000<br />
2,000<br />
1,000<br />
0<br />
Shotgun H<strong>and</strong>gun Other weapon Imitation firearm<br />
1999/00 2000/01 2001/02 2002/03 2003/04 2004/05 2005/06 2006/07 <strong>2007</strong>/<strong>08</strong><br />
Year<br />
2.4 INJURIES IN CRIMES INVOLVING FIREARMS<br />
In <strong>2007</strong>/<strong>08</strong>, 24 per cent of crimes involving firearms (including air weapons) caused injury, either<br />
because they were fired or used as a blunt instrument (4,164 offences) (Table 2.07). This<br />
compares with 22 per cent in 2006/07, <strong>and</strong> represents an increase of two per cent in the number<br />
of injuries resulting from firearm offences.<br />
Crimes involving h<strong>and</strong>guns, shotguns <strong>and</strong> other non-air weapons caused injury in 21 per cent, 26<br />
per cent <strong>and</strong> 43 per cent of incidents respectively (Table 2.03;Table 2.07). Most of the non-air<br />
weapons were imitation firearms, where over 98 per cent of the injuries were slight. Though air<br />
weapons were most likely to be fired, they caused injury in only 12 per cent of crimes, <strong>and</strong> in the<br />
vast majority of these cases (91%) the injury incurred was slight (Table 2.07).<br />
There were 53 fatal injuries involving firearms in <strong>2007</strong>/<strong>08</strong>, down ten per cent from 59 offences<br />
recorded in 2006/07, <strong>and</strong> the second lowest total since 1998/99. All but one of the fatalities<br />
involved a weapon being fired; a weapon was used as a blunt instrument in the other one.<br />
Seventy-four per cent of the fatalities involved the use of a h<strong>and</strong>gun. There were a further 488<br />
firearm crimes that resulted in serious injury, down four per cent from 507 in 2006/07. Overall,<br />
541 offences resulted in serious or fatal injury, down four per cent or 25 crimes on 2006/07.<br />
However, they account for only three per cent of all firearm crimes in <strong>2007</strong>/<strong>08</strong> (Table 2.07; Table<br />
2b).<br />
The harm caused by different types of firearm can be seen by the proportion of those that are<br />
fired that cause injury. Table 2a shows, by type of firearm, the percentage which were fired <strong>and</strong><br />
not fired, <strong>and</strong> the percentage of offences where injury was caused if they were fired (more<br />
detailed figures are in Table 2.05). H<strong>and</strong>guns were fired in only ten per cent of cases, but if they<br />
were fired, more than a third of cases resulted in a fatal or serious injury. The overall number of<br />
h<strong>and</strong>gun injuries increased by 11 per cent from 792 in 2006/07 to 881 in <strong>2007</strong>/<strong>08</strong>. Shotguns were<br />
37
fired in 38 per cent of cases <strong>and</strong>, if they were fired, more than a quarter of cases resulted in a<br />
fatal or serious injury. In contrast, air weapons, when fired, resulted in a fatal or serious injury in<br />
only one per cent of cases <strong>and</strong> resulted in no injury in 87 per cent of cases. The number of air<br />
weapon fatal or serious injuries decreased by 12 per cent from the previous year (Table 2b).<br />
Table 2b Crimes recorded by the police in Engl<strong>and</strong> <strong>and</strong> Wales in which firearms were<br />
used 1 resulting in injury, by degree of injury, 1999/00 to <strong>2007</strong>/<strong>08</strong><br />
Year Total Fatal injury Serious injury 2<br />
Non -air weapons Air weapons<br />
Slight injury Total Fatal injury Serious injury Slight injury<br />
Total<br />
injuries<br />
1999/00 1,195 62 200 933 1,977 -<br />
171 1,806 3,172<br />
2000/01 1,382 72 244 1,066 1,821 1 166 1,654 3,203<br />
2001/02 1,877 96 392 1,391 1,915 2 165 1,748 3,792<br />
2002/03 2,179 80 416 1,683 2,377 1 156 2,220 4,556<br />
2003/04 2,367 68 437 1,862 2,395 -<br />
157 2,238 4,762<br />
2004/05 3,900 76 412 3,412 1,498 1 144 1,353 5,398<br />
2005/06 3,822 49 476 3,297 1,182 1 119 1,062 5,004<br />
2006/07 3,011 56 412 2,543 1,054 3 95 956 4,065<br />
<strong>2007</strong>/<strong>08</strong> 3,241 53 402 2,786 923 -<br />
86 837 4,164<br />
1. By weapon being fired, used as a blunt instrument or in a threat.<br />
2. A serious injury is one which necessitated detention in hospital or involved fractures, concussion, severe general<br />
shock, penetration by a bullet or multiple shot wounds.<br />
3. More explicit guidelines for the classification of weapons, introduced on 1 April 2004, may have increased the recording<br />
of firearm offences , particularly those committed by imitation weapons.<br />
In <strong>2007</strong>/<strong>08</strong>, 4,164 firearm injuries were reported, two per cent higher than the previous year.<br />
<strong>Firearm</strong> crimes which resulted in injuries more than doubled in seven years to 2005/06 <strong>and</strong> the<br />
largest rise was seen in crimes involving non-air weapons. These injuries reached their peak in<br />
2004/05 at 5,398.<br />
Injuries to police officers<br />
One police officer was killed <strong>and</strong> three seriously injured by a firearm while on duty in <strong>2007</strong>/<strong>08</strong>. CS<br />
gas sprays accounted for 15 injuries or 63 per cent of the total. The overall total of 24 is the<br />
highest since figures first appeared in the Home Office’s gun crime statistics in 1988. However,<br />
the figures are still very small, <strong>and</strong> some variability from year to year is to be expected (Table 2c).<br />
Table 2c Crimes recorded by the police in which a police officer on duty was injured by a<br />
firearm (excluding air weapons), 1997/98 to <strong>2007</strong>/<strong>08</strong><br />
Fatal<br />
Serious<br />
Year Total injury<br />
injury 1<br />
Slight<br />
injury<br />
1997/98 6 - 3 3<br />
1998/99 11 - - 11<br />
1999/00 10 - - 10<br />
2000/01 7 - 5 2<br />
2001/02 10 - - 10<br />
2002/03 12 - 1 11<br />
2003/04 14 1 3 10<br />
2004/05 23 - 2 21<br />
2005/06 23 1 6 16<br />
2006/07 21 - 3 18<br />
<strong>2007</strong>/<strong>08</strong> 24 1 3 20<br />
1. A serious injury is one which necessitated detention in hospital or involved fractures,<br />
concussion, severe general shock, penetration by a bullet or multiple shot wounds.<br />
38
2.5 TYPES OF CRIMES WHERE FIREARMS ARE USED<br />
Although the crime types in firearm crimes are fairly evenly split between violence (including<br />
robbery) <strong>and</strong> non-violent property crime, the distribution varies markedly between non-air<br />
weapons (where violence predominates) <strong>and</strong> air weapons (which are mostly criminal damage<br />
offences).<br />
<strong>Violence</strong> against the person (VAP) <strong>and</strong> robbery offences accounted for over half (58%) of<br />
recorded crimes where firearms were used, with VAP contributing 35 per cent <strong>and</strong> robbery 23 per<br />
cent. The number of robberies involving firearms rose by nearly one per cent in <strong>2007</strong>/<strong>08</strong>, after a<br />
three per cent fall in 2006/07 (Figure 2.5).<br />
Criminal damage made up 38 per cent of overall firearm offences (Table 2.01), but this proportion<br />
ranges from eight per cent of non-air weapon offences to 77 per cent of air weapon offences<br />
(Table 2.04).<br />
Robberies accounted for 40 per cent of non-air weapon offences (as in 2006/07) <strong>and</strong> VAP<br />
offences accounted for 48 per cent (up from 46 per cent in 2006/07). VAP includes homicide,<br />
which made up 0.5 per cent of all non-air weapon crimes.<br />
The proportion of crimes where a firearm was used differs across crime types (Table 2.02).<br />
<strong>Firearm</strong>s were used in seven per cent of crimes recorded as homicide. The proportion of other<br />
serious offences of violence against the person involving a firearm stood at five per cent in<br />
<strong>2007</strong>/<strong>08</strong>. The corresponding proportion for robbery was five per cent; the proportion has<br />
remained at four or five per cent for the past ten years.<br />
Figure 2.5 Crimes in which firearms were reported to have been used by offence type,<br />
1997/98 to <strong>2007</strong>/<strong>08</strong><br />
Numbers<br />
12,000<br />
10,000<br />
8,000<br />
6,000<br />
4,000<br />
2,000<br />
0<br />
<strong>Violence</strong> against the person Robbery Burglary Criminal damage<br />
1997/98 1998/99 1999/00 2000/01 2001/02 2002/03 2003/04 2004/05 2005/06 2006/07 <strong>2007</strong>/<strong>08</strong><br />
Year<br />
39
Figure 2.6 <strong>Firearm</strong> offences by crime type as a percentage of all firearm crime for air<br />
weapons <strong>and</strong> non-air weapons, <strong>2007</strong>/<strong>08</strong><br />
Per cent<br />
90<br />
80<br />
70<br />
60<br />
50<br />
40<br />
30<br />
20<br />
10<br />
0<br />
2.6 GEOGRAPHICAL DISTRIBUTION OF FIREARM OFFENCES<br />
Fifty-six per cent of all non-air weapon firearm offences in Engl<strong>and</strong> <strong>and</strong> Wales in <strong>2007</strong>/<strong>08</strong><br />
occurred in just three police force areas – Metropolitan, Greater Manchester, <strong>and</strong> West Midl<strong>and</strong>s.<br />
The proportion is one percentage point higher than the 55 per cent recorded in 2006/07. Thirtyfour<br />
per cent of offences occurred in the Metropolitan Police area (Figure 2.7). The three forces<br />
also had a relatively higher rate of firearm offences per population than others, with both<br />
Metropolitan <strong>and</strong> Greater Manchester recording 45 offences per 100,000 population (Greater<br />
Manchester up six offences from 39 on the previous year) <strong>and</strong> West Midl<strong>and</strong>s recording 37<br />
offences (down from 38). The corresponding rate for Engl<strong>and</strong> <strong>and</strong> Wales was 18 per 100,000<br />
population (Table 2.12).<br />
Figure 2.7 <strong>Firearm</strong> offences in police force areas, <strong>2007</strong>/<strong>08</strong><br />
Rest of Engl<strong>and</strong> <strong>and</strong> Wales<br />
44%<br />
Air weapons (total 100%)<br />
Non air weapons (total 100%)<br />
Robbery <strong>Violence</strong> against<br />
the person<br />
Burglary Criminal damage Other<br />
Crime type<br />
West Midl<strong>and</strong>s<br />
10%<br />
40<br />
Greater Manchester<br />
12%<br />
Metropolitan Police<br />
34%
2.7 ROBBERIES<br />
As has been seen, 23 per cent of firearm crimes were robberies, but this rises to 40 per cent<br />
when excluding air weapons. The overall number of firearm robberies increased by one per cent<br />
in <strong>2007</strong>/<strong>08</strong> following a three per cent decrease in the previous year (Table 2.04; Table 2.09).<br />
The location of firearm robberies<br />
The highest number of firearm robberies, 1,314 offences or 33 per cent of the total, were<br />
committed on public highways, followed by robberies in shops (1,071 offences or 27%). The least<br />
number was recorded in building societies (14 robberies or 0.3%) followed by garage <strong>and</strong> service<br />
station robberies (65 offences or 2%) (Figure 2.8).<br />
The largest percentage falls in <strong>2007</strong>/<strong>08</strong> were in garages <strong>and</strong> service stations: down 40 per cent<br />
from 109 in 2006/07 to 65 in <strong>2007</strong>/<strong>08</strong>. This is a three-fold reduction from 188 recorded ten years<br />
ago in 1997/98. Post office robberies fell by 24 per cent while bank robberies increased by 62 per<br />
cent. ‘Other premises or open space’ robberies increased by 43 per cent in <strong>2007</strong>/<strong>08</strong>, after falling<br />
by four per cent in the previous year.<br />
The types of firearms involved in robberies<br />
<strong>Firearm</strong>s described as h<strong>and</strong>guns were used in 67 per cent of robberies involving firearms, <strong>and</strong><br />
sawn-off or long-barrelled shotguns in six per cent. Twelve per cent of incidents involved<br />
unidentified firearms (i.e. a firearm not actually seen, or not identified as to type), <strong>and</strong> another four<br />
per cent involved imitation firearms. Air weapons featured in only two per cent of firearm<br />
robberies in <strong>2007</strong>/<strong>08</strong> (Table 2.<strong>08</strong>).<br />
Figure 2.8 Location of firearm robberies in 2006/07 <strong>and</strong> <strong>2007</strong>/<strong>08</strong>, number of offences<br />
Numbers<br />
1600<br />
1400<br />
1200<br />
1000<br />
800<br />
600<br />
400<br />
200<br />
0<br />
Shop Bank,Building<br />
society<br />
2006/07<br />
<strong>2007</strong>/<strong>08</strong><br />
Garage/post<br />
office<br />
Location<br />
41<br />
Public highway Residential Other
2.8 AGE OF VICTIMS<br />
In <strong>2007</strong>/<strong>08</strong>, of the firearm offences (excluding air weapons) in which the ages of the victims were<br />
known, half (50%) of victims were aged under 30 years. Twenty-seven per cent of all victims were<br />
aged between 30 <strong>and</strong> 49 years (i.e. 30 <strong>and</strong> under 50). A further 22 per cent were aged between<br />
21 <strong>and</strong> 29 years followed by 16-to 20-year-olds at 15 per cent. Victim numbers declined in post-<br />
50 age groups: from eight per cent within 50-to 69-year-olds to one per cent for those aged 70<br />
years <strong>and</strong> over (Figure 2.9).<br />
Looking at weapon types, the largest proportion of h<strong>and</strong>gun victims were in the 30-to-49 age<br />
group, at 31 per cent, followed by 21-to 29-year-olds (29%). In contrast, the largest proportion of<br />
imitation firearm victims were aged between 11 to 15 years (22%) followed by 30-to 49-year olds<br />
(20%).<br />
Looking at offence categories, the largest proportion of firearm robbery victims, at 30 per cent,<br />
were in the 30-to-49 age group, followed by 21-29-year olds at 27 per cent. The 30-to-49 age<br />
group also accounted for the most firearm homicides (16 homicides or 30%), followed by the 16to-20<br />
<strong>and</strong> 21-to-29 age groups both with 28 per cent. On the other h<strong>and</strong>, 21-to-29 year olds were<br />
victims of the most attempted murders involving a firearm, at 44 per cent, followed by 30-to 49year-olds<br />
with 23 per cent.<br />
Figure 2.9 <strong>Firearm</strong> offences (excluding air weapons) by age of victim, <strong>2007</strong>/<strong>08</strong><br />
50 <strong>and</strong> under 70 years,<br />
813 , 8%<br />
unknown/not available,<br />
1,272 , 13%<br />
70 years <strong>and</strong> over, 1<strong>08</strong> ,<br />
1%<br />
30 <strong>and</strong> less than 50 years,<br />
2,704 , 27%<br />
Under 5 years, 32 , 0%<br />
42<br />
5 <strong>and</strong> under 11 years,<br />
319 , 3%<br />
11 <strong>and</strong> under 16 years,<br />
927 , 9%<br />
16 <strong>and</strong> under 21 years,<br />
1,504 , 15%<br />
21 <strong>and</strong> under 30 years,<br />
2,186 , 22%
2.9 MISAPPROPRIATED (STOLEN) FIREARMS<br />
Because of their potential for subsequent use in crime, there is concern about the number of<br />
firearms that are misappropriated. (‘Misappropriated firearms’ are defined as those stolen,<br />
obtained by fraud or forgery etc., or h<strong>and</strong>led dishonestly. For simplicity, they are referred to as<br />
‘stolen’ hereafter.) During <strong>2007</strong>/<strong>08</strong>, 2,031 firearms were recorded by the police as being stolen, a<br />
fall of eight per cent over the previous year (Table 2.10). Air weapons accounted for 53 per cent<br />
of the thefts.<br />
Compared with 2006/07, there was a small decrease in the number of stolen h<strong>and</strong>guns in<br />
<strong>2007</strong>/<strong>08</strong> (by 2% to 80). Stolen imitation firearms were down by 25 per cent to 267. ‘Other’ stolen<br />
weapons which includes ‘unknown’ <strong>and</strong> ‘prohibited’ firearms decreased by 37 per cent to 104 in<br />
<strong>2007</strong>/<strong>08</strong> with prohibited firearms (CS gas sprays, stun guns etc.) contributing 18 per cent of the<br />
total. There was a decrease in the number of rifles stolen, down five per cent to 199 in <strong>2007</strong>/<strong>08</strong>.<br />
Stolen shotguns rose by two per cent to 289 in <strong>2007</strong>/<strong>08</strong>, while air weapons decreased slightly by<br />
0.5 per cent to 1,075 over the previous year. (Table 2.10).<br />
43
Table 2.01 Crimes recorded by the police in Engl<strong>and</strong> <strong>and</strong> Wales in which firearms (including air weapons) were reported to<br />
have been used, by offence group, 1997/98 to <strong>2007</strong>/<strong>08</strong><br />
Number of offences Recorded crime<br />
Homicide Attempted<br />
murder <strong>and</strong><br />
other most<br />
serious<br />
violence 1<br />
Other 2<br />
Year All offences All offences <strong>Violence</strong> against the person Robbery Burglary Other Criminal<br />
excluding<br />
criminal<br />
damage<br />
offences<br />
excluding<br />
criminal<br />
damage<br />
damage<br />
1997/98 12,805 6,6<strong>08</strong> 54 696 2,250 2,938 333 337 6,197<br />
1998/99 3<br />
13,874 7,4<strong>08</strong> 49 724 2,910 2,973 319 433 6,466<br />
1999/00 16,946 9,481 62 759 3,881 3,922 329 528 7,465<br />
2000/01 17,698 9,775 73 831 3,869 4,128 390 484 7,923<br />
2001/02 4<br />
22,401 12,424 97 1,110 4,637 5,486 483 611 9,977<br />
2002/03 5<br />
24,070 13,114 81 1,285 5,767 4,776 494 711 10,956<br />
2003/04 24,094 13,146 68 1,350 6,434 4,117 533 644 10,948<br />
2004/05 22,894 12,856 77 1,384 6,485 3,744 341 825 10,038<br />
2005/06 6<br />
21,527 12,548 50 893 6,359 4,121 298 827 8,979<br />
2006/07 18,481 10,790 59 759 5,184 3,977 206 605 7,691<br />
<strong>2007</strong>/<strong>08</strong> 17,343 10,837 53 869 5,163 4,014 172 566 6,506<br />
1. Including more serious wounding.<br />
2. Including less serious wounding <strong>and</strong> assault without injury.<br />
3.There was a change in the counting rules for recorded crime on 1 April 1998.<br />
4. Figures for some crime categories may have been inflated by some police forces implementing the principles of the National Crime Recording St<strong>and</strong>ard before 1 April<br />
2002.<br />
5. The National Crime Recording St<strong>and</strong>ard was introduced on 1 April 2002. Figures for some crime categories may have been inflated by this.<br />
6. From 2005/06, 'threat or conspiracy to murder' offences are included within the 'other violence against the person' category.<br />
44
Table 2.02 Crimes recorded by the police in Engl<strong>and</strong> <strong>and</strong> Wales in which firearms (including air weapons)<br />
were reported to have been used, as a percentage of all notifiable offences in particular offence groups,<br />
1997/98 to <strong>2007</strong>/<strong>08</strong><br />
Percentages Recorded crime<br />
Year All offences<br />
<strong>Violence</strong> against the person<br />
Criminal<br />
Homicide Attempted<br />
murder <strong>and</strong><br />
other most<br />
serious violence<br />
1<br />
Other<br />
damage<br />
2<br />
Robbery<br />
1997/98 0.3 7.2 3.0 1.0 4.7 0.8<br />
1998/99 3<br />
0.3 6.5 2.8 0.6 4.4 0.7<br />
1999/00 0.3 8.1 2.6 0.7 4.7 0.8<br />
2000/01 0.3 8.6 2.7 0.7 4.3 0.8<br />
2001/02 4<br />
2002/03 5<br />
0.4 10.9 3.5 0.8 4.5 0.9<br />
0.4 7.7 3.5 0.7 4.4 1.0<br />
2003/04 0.4 8.0 3.1 0.7 4.1 0.9<br />
2004/05 0.4 9.0 3.1 0.6 4.1 0.8<br />
2005/06 6<br />
0.4 6.5 4.3 0.6 4.2 0.8<br />
2006/07 0.3 7.8 4.0 0.5 3.9 0.6<br />
<strong>2007</strong>/<strong>08</strong> 0.4 6.8 5.1 0.5 4.7 0.6<br />
1. Including more serious wounding.<br />
2. Including less serious wounding <strong>and</strong> assault without injury.<br />
3. There was a change in the counting rules for recorded crime on 1 April 1998.<br />
4. Numbers of some recorded crimes may have been inflated by some police forces implementing the principles of the National Crime Recording<br />
St<strong>and</strong>ard before 1 April 2002.<br />
5. The National Crime Recording St<strong>and</strong>ard was introduced on 1 April 2002. Figures for some crime categories may have been inflated by this.<br />
6. From 2005/06, 'threat or conspiracy to murder' offences are included within the 'other violence against the person' category.<br />
45
Table 2.03 Crimes recorded by the police in Engl<strong>and</strong> <strong>and</strong> Wales in which firearms were reported to have been used by type of principal weapon, 1998/99 to<br />
<strong>2007</strong>/<strong>08</strong><br />
Number of offences Recorded crime<br />
Principal weapon<br />
1998/99 1<br />
1999/00 2000/01 2001/02 2<br />
2002/03 3<br />
2003/04 2004/05 4<br />
2005/06 2006/07 <strong>2007</strong>/<strong>08</strong><br />
Long-barrelled shotgun 322 353 303 380 361 424 306 375 360 365<br />
Sawn-off shotgun 320 340 305 332 311 294 291 267 252 237<br />
H<strong>and</strong>gun 5<br />
Converted imitation .. .. .. .. .. .. 20 7 12 7<br />
Reactivated .. .. .. .. .. .. 2 2 2 1<br />
Converted air pistol .. .. .. .. .. .. 14 12 13 11<br />
Other .. .. .. .. .. .. 866 1,022 9<strong>08</strong> 895<br />
Type unknown .. .. .. .. .. .. 3,458 3,629 3,238 3,258<br />
H<strong>and</strong>gun total 2,687 3,685 4,110 5,874 5,549 5,144 4,360 4,672 4,173 4,172<br />
Rifle 43 67 36 64 52 48 54 71 69 71<br />
Imitation firearm 5<br />
Imitation h<strong>and</strong>gun .. .. .. .. .. .. 355 368 299 322<br />
BB gun/soft air weapon .. .. .. .. .. .. 2,863 2,755 2,094 2,124<br />
Deactivated firearm .. .. .. .. .. .. 1 4 2 2<br />
Blank firer .. .. .. .. .. .. 27 17 21 21<br />
Other imitation .. .. .. .. .. .. 127 133 100 93<br />
Imitation firearm total 566 823 787 1,246 1,814 2,146 3,373 3,277 2,516 2,562<br />
Unidentified firearm 665 762 950 1,176 1,431 1,356 1,500 1,362 1,276 1,325<br />
Other firearm 5<br />
Unconverted starting gun .. .. .. .. .. .. 9 9 3 6<br />
CS gas .. .. .. .. .. .. 516 461 436 552<br />
Pepper spray .. .. .. .. .. .. 141 154 179 228<br />
Machine gun .. .. .. .. .. .. 25 34 39 18<br />
Stun gun .. .. .. .. .. .. 143 133 1<strong>08</strong> 118<br />
Other converted imitation weapon .. .. .. .. .. .. 1 2 - 4<br />
Other reactivated weapon .. .. .. .. .. .. - 2 1 2<br />
Disguised firearm .. .. .. .. .. .. 14 19 57 87<br />
Other firearm (specified) .. .. .. .. .. .. 336 250 176 118<br />
Other firearm total 606 813 980 952 730 926 1,185 1,064 999 1,133<br />
All firearms excluding air weapons 5,209 6,843 7,471 10,024 10,248 10,338 11,069 11,<strong>08</strong>8 9,645 9,865<br />
Air weapon 8,665 10,103 10,227 12,377 13,822 13,756 11,825 10,439 8,836 7,478<br />
All firearms 13,874 16,946 17,698 22,401 24,070 24,094 22,894 21,527 18,481 17,343<br />
1. There was a change in the counting rules for recorded crime on 1 April 1998.<br />
2. Figures may have been inflated by some police forces implementing the principles of the National Crime Recording St<strong>and</strong>ard before 1 April 2002.<br />
3. The National Crime Recording St<strong>and</strong>ard was introduced on 1 April 2002. Figures for some crime categories may have been inflated by this.<br />
4. More explicit guidelines for the classification of weapons introduced on 1 April 2004 may have increased the recording of firearm offences, particulary those committed by imitation weapons.<br />
5. Further weapon breakdowns were available for the first time on 1 April 2004.<br />
46
Table 2.04 Crimes recorded by the police in Engl<strong>and</strong> <strong>and</strong> Wales in which firearms were reported to have been used by offence group <strong>and</strong><br />
principal weapon, <strong>2007</strong>/<strong>08</strong><br />
Number of offences Recorded crime<br />
Homicide 1 Attempted<br />
murder <strong>and</strong><br />
other most<br />
serious<br />
violence 2<br />
Other 3<br />
Principal weapon All offences All offences <strong>Violence</strong> against the person<br />
Robbery Burglary Other Criminal<br />
excluding<br />
offences damage<br />
criminal<br />
excluding<br />
damage<br />
criminal<br />
damage<br />
Long-barrelled shotgun 365 313 1 95 92 107 7 11 52<br />
Sawn-off shotgun 237 233 2 32 49 142 5 3 4<br />
H<strong>and</strong>gun 4,172 4,154 39 325 877 2,706 96 111 18<br />
Rifle 71 65 2 10 36 14 - 3 6<br />
Imitation firearm 2,562 2,094 - 31 1,829 169 14 51 468<br />
Unidentified firearm 1,325 1,152 9 223 365 479 24 52 173<br />
47<br />
Other firearm 1,133 1,104 - 49 648 322 18 67 29<br />
All firearms excluding air<br />
weapons 9,865 9,115 53 765 3,896 3,939 164 298 750<br />
-<br />
104 1,267 75 8 268 5,756<br />
Air weapon 7,478 1,722<br />
Total 17,343 10,837 53 869 5,163 4,014 172 566 6,506<br />
1. These figures may not agree with those in the homicide chapter because (a) in this table, cases are included where the firearm was used as a blunt instrument <strong>and</strong> (b) the homicide figures<br />
are compiled at a later date <strong>and</strong> take into account the results of police <strong>and</strong> court decisions.<br />
2. Including more serious wounding.<br />
3. Including less serious wounding <strong>and</strong> assault without injury.
Table 2.05 Crimes recorded by the police in Engl<strong>and</strong> <strong>and</strong> Wales in which firearms were reported to have been used, by how involved, <strong>and</strong> principal<br />
weapon, <strong>2007</strong>/<strong>08</strong><br />
Recorded crime<br />
Number of offences 1<br />
Not fired<br />
Fired<br />
Principal weapon Total<br />
Total not<br />
fired<br />
Used as a<br />
threat<br />
Used as<br />
blunt<br />
instrument<br />
Total<br />
fired<br />
No injury or<br />
property<br />
damage<br />
Causing<br />
property<br />
damage<br />
only<br />
Slight<br />
injury<br />
Serious<br />
injury 2<br />
Fatal<br />
injury<br />
Long-barrelled shotgun 365 1 46 30 72 31 180 27 158 185<br />
Sawn-off shotgun 237 2 13 5 18 8 46 33 158 191<br />
H<strong>and</strong>gun 4,172 39 113 91 54 127 424 638 3,110 3,748<br />
Rifle 71 2 4 11 4 13 34 4 33 37<br />
48<br />
2,562 - 18 1,028 455 374 1,875 56 631 687<br />
Imitation firearm 3<br />
1,325 8 111 111 183 99 512 86 727 813<br />
Unidentified firearm 4<br />
Other firearm 1,133 - 27 642 29 97 795 95 243 338<br />
All firearms excluding air<br />
weapons 9,865 52 332 1,918 815 749 3,866 939 5,060 5,999<br />
Air weapon 7,478 - 84 817 5,562 383 6,846 22 610 632<br />
Total 17,343 52 416 2,735 6,377 1,132 10,712 961 5,670 6,631<br />
1. Figures may have been inflated by police forces implementing the National Crime Recording St<strong>and</strong>ard on 1 April 2002.<br />
2. A serious injury is one which necessitated detention in hospital or involved fractures, concussion, severe general shock, penetration by a bullet or multiple shot wounds.<br />
3. Imitation weapons include blank firers, ball-bearing guns <strong>and</strong> soft air weapons.<br />
4. Includes one fatal injury in which the weapon was not fired, i.e used as a blunt instrument.
Table 2.06 Crimes recorded by the police in Engl<strong>and</strong> <strong>and</strong> Wales in which firearms were reported to<br />
have caused injury 1 by type of principal weapon, 1997/98 to <strong>2007</strong>/<strong>08</strong><br />
Number of offences<br />
Year All firearms All firearms<br />
excluding air<br />
weapons<br />
Recorded crime<br />
Shotgun H<strong>and</strong>gun Other<br />
firearms<br />
excluding air<br />
weapons<br />
Air weapon<br />
1997/98 2,074 804 74 317 413 1,270<br />
1998/99 2<br />
2,378 864 73 239 552 1,514<br />
1999/00 3,172 1,195 100 352 743 1,977<br />
2000/01 3,203 1,382 73 400 909 1,821<br />
2001/02 3<br />
3,794 1,879 111 648 1,120 1,915<br />
2002/03 4<br />
4,556 2,179 107 640 1,432 2,377<br />
2003/04 4,762 2,367 104 590 1,673 2,395<br />
2004/05 5,402 3,904 135 780 2,989 1,498<br />
2005/06 5,004 3,822 154 1,024 2,644 1,182<br />
2006/07 4,064 3,011 128 792 2,091 1,053<br />
<strong>2007</strong>/<strong>08</strong> 4,164 3,241 157 881 2,203 923<br />
1. By the weapon being fired, used as a blunt instrument or in a threat.<br />
2. There was a change in the counting rules for recorded crime on 1 April 1998.<br />
3. Figures may have been inflated by some police forces implementing the principles of the National Crime Recording St<strong>and</strong>ard before 1 April 2002.<br />
4. The National Crime Recording St<strong>and</strong>ard was introduced on 1 April 2002. Figures for some crime categories may have been inflated by this.<br />
49
Table 2.07 Crimes recorded by the police in Engl<strong>and</strong> <strong>and</strong> Wales in which firearms were reported to have<br />
caused injury 1 , by degree of injury <strong>and</strong> type of principal weapon, <strong>2007</strong>/<strong>08</strong><br />
Number of offences Recorded crime<br />
Type of weapon Total Fatal injury Serious injury 2 Slight injury<br />
Shotgun 157 3 65 89<br />
H<strong>and</strong>gun 881 39 159 683<br />
Other firearm excluding air weapon 2,203 11 178 2,014<br />
All firearms excluding air weapons 3,241 53 402 2,786<br />
Air weapon 923 - 86 837<br />
All firearms 4,164 53 488 3,623<br />
1. By the weapon being fired, used as a blunt instrument or in a threat. These figures differ from those in Table 2.05, whose breakdown by<br />
severity of injury is for weapon being fired only.<br />
2. A serious injury is one which necessitated detention in hospital or involved fractures, concussion, severe general shock, penetration by a<br />
bullet or multiple shot wounds.<br />
50
Table 2.<strong>08</strong> <strong>Offences</strong> of robbery recorded by the police in Engl<strong>and</strong> <strong>and</strong> Wales in which firearms were reported to have been used, by type of principal<br />
weapon, 1997/98 to <strong>2007</strong>/<strong>08</strong><br />
Number of robberies Recorded crime<br />
Air weapon<br />
Year All firearms All firearms<br />
excluding<br />
air weapons<br />
Longbarrelled<br />
shotgun<br />
Sawn-off<br />
shotgun<br />
1997/98 2,939 2,836 98 168 1,811<br />
1998/99 2,973 2,890 138 193 1,814<br />
1999/00 3,922 3,831 138 217 2,561<br />
2000/01 4,128 4,012 97 202 2,758<br />
2001/02 1<br />
2002/03 2<br />
5,486 5,325 143 201 3,841<br />
4,776 4,630 101 174 3,332<br />
2003/04 4,117 4,032 98 148 2,799<br />
2004/05 3,744 3,676 71 157 2,502<br />
2005/06 4,121 4,054 89 132 2,888<br />
2006/07 3,979 3,905 115 136 2,684<br />
<strong>2007</strong>/<strong>08</strong> 4,014 3,939 107 142 2,706<br />
Year Total Shop,<br />
stall<br />
etc.<br />
Garage,<br />
service<br />
station<br />
H<strong>and</strong>gun Rifle Imitation<br />
firearm<br />
Post office Bank Building<br />
society<br />
Unidentified<br />
firearm<br />
1. Figures may have been inflated by some police forces implementing the principles of the National Crime Recording St<strong>and</strong>ard before 1 April 2002.<br />
2. The National Crime Recording St<strong>and</strong>ard was introduced on 1 April 2002. Figures for some crime categories may have been inflated by this.<br />
Other<br />
firearm<br />
9 190 447 113 103<br />
4 163 419 159 83<br />
12 228 432 243 91<br />
13 227 482 233 116<br />
16 279 549 296 161<br />
7 267 579 170 146<br />
11 230 531 215 85<br />
10 211 511 214 68<br />
9 189 504 243 67<br />
7 194 472 297 74<br />
14 169 479 322 75<br />
Table 2.09 <strong>Offences</strong> of robbery recorded by the police in Engl<strong>and</strong> <strong>and</strong> Wales in which firearms were reported to have been used, by location<br />
of offence, 1997/98 to <strong>2007</strong>/<strong>08</strong><br />
Number of robberies Recorded crime<br />
Residential 3 Public<br />
highway<br />
Other<br />
premises or<br />
open space<br />
1997/98 2,939 928 188 276 123 91 119 800 414<br />
1998/99 2,973 998 198 282 129 95 109 741 421<br />
1999/00 3,922 1,425 213 315 113 81 152 1,120 503<br />
2000/01 4,128 1,356 218 257 128 86 161 1,359 563<br />
2001/02 1<br />
5,486 1,683 262 310 168 82 289 1,973 719<br />
2002/03 2<br />
4,776 1,348 205 287 126 51 280 1,899 580<br />
2003/04 4,117 1,138 140 198 64 25 345 1,674 533<br />
2004/05 3,744 903 113 114 89 18 450 1,316 741<br />
2005/06 4,121 1,037 137 1<strong>08</strong> 59 24 645 1,439 672<br />
2006/07 3,979 1,003 109 93 45 14 613 1,457 645<br />
<strong>2007</strong>/<strong>08</strong> 4,014 1,071 65 71 73 14 481 1,314 925<br />
1. Figures may have been inflated by some police forces implementing the principles of the National Crime Recording St<strong>and</strong>ard before 1 April 2002.<br />
2. The National Crime Recording St<strong>and</strong>ard was introduced on 1 April 2002. Figures for some crime categories may have been inflated by this.<br />
3. These crimes are classified as robberies but are mostly break-ins where firearms have been used immediately before or at the time of stealing items from a residential<br />
property, <strong>and</strong> in order to steal these items. If firearms are used instead in the getaway, the crime is classified as a burglary.<br />
51
Table 2.10 <strong>Firearm</strong>s misappropriated 1 in crimes recorded by the police in Engl<strong>and</strong> <strong>and</strong> Wales, by type of weapon, 1997/98<br />
to <strong>2007</strong>/<strong>08</strong><br />
Number of firearms Recorded crime<br />
Other<br />
Year Total Air<br />
weapon<br />
Shotgun H<strong>and</strong>gun Rifle Starting<br />
gun<br />
Imitation<br />
firearm<br />
1997/98 2,885 1,453 524 270 155 55 346 82<br />
1998/99 2,711 1,520 395 242 179 48 228 99<br />
1999/00 3,002 1,677 447 219 200 62 312 85<br />
2000/01 2,585 1,471 431 167 172 50 192 102<br />
2001/02 2,917 1,689 423 79 139 45 471 71<br />
2002/03 2,844 1,683 462 85 129 45 387 53<br />
2003/04 2,594 1,515 397 96 130 32 332 92<br />
2004/05 2,377 1,283 403 81 140 31 322 117<br />
2005/06 2,068 1,067 243 110 147 21 355 125<br />
2006/07 2,219 1,<strong>08</strong>1 282 103 210 24 355 164<br />
<strong>2007</strong>/<strong>08</strong> 2,031 1,075 289 80 199 17 267 104<br />
1. Misappropriated is defined as stolen, obtained by fraud or forgery etc., or h<strong>and</strong>led dishonestly.<br />
Table 2.11 <strong>Firearm</strong>s misappropriated 1 in crimes recorded by the police in Engl<strong>and</strong> <strong>and</strong> Wales, by type of weapon <strong>and</strong><br />
location, <strong>2007</strong>/<strong>08</strong><br />
Number of firearms<br />
Location Total Air<br />
weapon<br />
Shotgun H<strong>and</strong>gun Rifle Starting<br />
gun<br />
Recorded crime<br />
Imitation Other<br />
firearm<br />
Residential 1,231 589 230 46 129 5 184 48<br />
Office 18 13 - 2 2 - - 1<br />
Factory 21 14 - 2 3 - 2 -<br />
Store 175 105 8 1 24 - 31 6<br />
Goods vehicle 10 8 - - - - 2 -<br />
Private car 121 53 31 15 7 3 7 5<br />
School 9 - - 1 - 2 5 1<br />
Military establishment - - - - - - - -<br />
Gun club 33 28 - 3 2 - - -<br />
Other premises 413 265 20 10 32 7 36 43<br />
Total 2,031 1,075 289 80 199 17 267 104<br />
1. Misappropriated is defined as stolen, obtained by fraud or forgery etc., or h<strong>and</strong>led dishonestly.<br />
52
Table 2.12 <strong>Firearm</strong> offences (excluding air weapons) by police force area, 2003/04 to <strong>2007</strong>/<strong>08</strong><br />
Police force area<br />
Total number of offences<br />
Recorded crime<br />
<strong>Offences</strong> per<br />
100,000 population<br />
2003/04 2004/05 2005/06 2006/07 <strong>2007</strong>/<strong>08</strong> <strong>2007</strong>/<strong>08</strong><br />
North East Region<br />
Clevel<strong>and</strong> 45 37 41 19 15 3<br />
Durham 15 21 18 14 45 7<br />
Northumbria 169 182 137 111 78 6<br />
North West Region<br />
Cheshire 44 61 71 41 59 6<br />
Cumbria 11 26 18 21 18 4<br />
Greater Manchester 1,275 1,268 1,200 993 1,160 45<br />
Lancashire 58 259 372 364 349 24<br />
Merseyside 483 491 485 410 398 29<br />
Yorkshire <strong>and</strong> the Humber Region<br />
Humberside 68 174 1<strong>08</strong> 117 58 6<br />
North Yorkshire 23 13 15 14 17 2<br />
South Yorkshire 127 185 301 211 202 16<br />
West Yorkshire 269 318 355 319 332 15<br />
East Midl<strong>and</strong>s Region<br />
Derbyshire 75 149 109 83 70 7<br />
Leicestershire 141 123 89 109 134 14<br />
Lincolnshire 26 90 72 45 41 6<br />
Northamptonshire 123 113 128 159 164 24<br />
Nottinghamshire 233 303 277 196 240 23<br />
West Midl<strong>and</strong>s Region<br />
Staffordshire 1<strong>08</strong> 144 128 94 123 12<br />
Warwickshire 102 73 80 90 107 20<br />
West Mercia 62 151 115 58 124 10<br />
West Midl<strong>and</strong>s 1,138 959 946 979 974 37<br />
East of Engl<strong>and</strong> Region<br />
Bedfordshire 89 94 103 86 83 14<br />
Cambridgeshire 34 50 34 24 30 4<br />
Essex 145 193 280 255 260 15<br />
Hertfordshire 138 139 114 89 112 11<br />
Norfolk 33 23 29 34 43 5<br />
Suffolk 45 59 58 42 38 5<br />
London Region 3,891 3,697 3,884 3,331 3,399 45<br />
South East Region<br />
Hampshire 130 148 85 122 100 5<br />
Kent 65 100 142 92 82 5<br />
Surrey 88 63 87 60 70 6<br />
Sussex 82 67 85 84 69 4<br />
Thames Valley 421 437 401 332 322 15<br />
South West Region<br />
Avon & Somerset 123 196 167 138 116 7<br />
Devon & Cornwall 84 189 174 132 111 7<br />
Dorset 45 49 27 28 21 3<br />
Gloucestershire 1<strong>08</strong> 87 77 65 43 7<br />
Wiltshire 53 49 43 69 49 8<br />
Wales<br />
Dyfed-Powys 37 40 21 17 25 5<br />
Gwent 74 85 53 33 47 8<br />
North Wales 11 60 88 98 53 8<br />
South Wales 47 104 71 67 84 7<br />
ENGLAND AND WALES 10,338 11,069 11,<strong>08</strong>8 9,645 9,865 18<br />
ENGLAND AND WALES 6,447 7,372 7,204 6,314 6,466 14<br />
(excluding London Region)<br />
53
3 <strong>Intimate</strong> violence: <strong>2007</strong>/<strong>08</strong> BCS<br />
Stephen Roe<br />
SUMMARY<br />
This chapter presents findings from the <strong>2007</strong>/<strong>08</strong> British Crime Survey (BCS) self-completion<br />
module on partner abuse, family abuse <strong>and</strong> sexual assault, collectively referred to as ‘intimate<br />
violence’.<br />
According to the <strong>2007</strong>/<strong>08</strong> BCS, women remained at higher risk of intimate violence<br />
victimisation than men.<br />
• Overall, three in ten (30%) women <strong>and</strong> two in ten (20%) men had experienced any<br />
domestic abuse since the age of 16. These figures are equivalent to an estimated 4.8<br />
million female victims of any domestic abuse since the age of 16 <strong>and</strong> 3.2 million male<br />
victims.<br />
Following several years of little change, prevalence of (non-sexual) partner <strong>and</strong> family abuse<br />
has decreased between 2006/07 <strong>and</strong> <strong>2007</strong>/<strong>08</strong>. Prevalence of sexual assault has remained<br />
stable.<br />
• Between 2006/07 <strong>and</strong> <strong>2007</strong>/<strong>08</strong> BCS interviews, there was a significant decrease in<br />
the prevalence of women experiencing (non-sexual) partner abuse in the last year<br />
(from 6% to 5%).<br />
• The prevalence of both men <strong>and</strong> women experiencing (non-sexual) family abuse in<br />
the last year decreased between 2006/07 <strong>and</strong> <strong>2007</strong>/<strong>08</strong> BCS interviews (from 2% to<br />
1% for men <strong>and</strong> from 3% to 2% for women).<br />
A significant minority of men <strong>and</strong> women who had experienced intimate violence since the<br />
age of 16 had experienced more than one type of intimate violence (any combination of nonsexual<br />
family abuse, non-sexual partner abuse or sexual assault).<br />
• Over a quarter (27%) of female victims of intimate violence had experienced two<br />
types of intimate violence while six per cent had experienced all three types of<br />
intimate violence.<br />
• About a fifth (21%) of men who had experienced intimate violence since the age of 16<br />
had experienced two types <strong>and</strong> a further two per cent had experienced all three<br />
types.<br />
The risk of intimate violence victimisation varied by a range of personal <strong>and</strong> household<br />
characteristics.<br />
• The pattern of declining risk of intimate violence with increasing age was generally<br />
consistent across all types of intimate violence for both men <strong>and</strong> women.<br />
• Married men <strong>and</strong> women were consistently at lower risk of intimate violence than<br />
single men <strong>and</strong> women.<br />
55
3.1 INTRODUCTION<br />
Domestic violence <strong>and</strong> sexual assault are serious public health <strong>and</strong> criminal justice problems.<br />
Over the past decade the Government has implemented a number of policy interventions,<br />
both nationally <strong>and</strong> locally, aimed at tackling domestic <strong>and</strong> sexual violence (see Box 3.1 for<br />
further information).<br />
Box 3.1 Government action on domestic <strong>and</strong> sexual violence<br />
Reducing the most serious violence (including tackling serious sexual offences <strong>and</strong><br />
domestic violence) has been stated as Priority Action 1 within Public Service Agreement<br />
23 published by the Home Office (October <strong>2007</strong>) <strong>and</strong> there is a greater focus on more<br />
serious crime within the Home Office’s 20<strong>08</strong>/2011 crime strategy (July <strong>2007</strong>).<br />
The Government has developed plans for action in relation to domestic <strong>and</strong> sexual<br />
violence:<br />
• The National Domestic <strong>Violence</strong> Delivery Plan (first published in 2005 <strong>and</strong> then<br />
updated annually) set out proposals to reduce prevalence of domestic violence <strong>and</strong><br />
related homicides, to increase the rate of reporting <strong>and</strong> the rate of offences brought to<br />
justice, <strong>and</strong> to improve support <strong>and</strong> protection for victims. For more information see:<br />
http://www.crimereduction.homeoffice.gov.uk/dv/dv017.htm<br />
• The first cross-government Action Plan on Sexual <strong>Violence</strong> (published in <strong>2007</strong>)<br />
included a range of measures aimed at improving the criminal justice response to<br />
sexual violence. For more information see:<br />
http://www.crimereduction.homeoffice.gov.uk/sexualoffences/sexual03.htm<br />
• In 20<strong>08</strong>, a cross-government Action Plan for Tackling <strong>Violence</strong> was published, which<br />
included addressing domestic <strong>and</strong> sexual violence as key objectives. For more<br />
information see:<br />
http://www.homeoffice.gov.uk/documents/violent-crime-action-plan-<strong>08</strong>/<br />
The British Crime Survey (BCS) is a large, nationally representative victimisation survey of<br />
approximately 47,000 adults living in private households in Engl<strong>and</strong> <strong>and</strong> Wales. 1 This chapter<br />
presents key findings from the self-completion module in the <strong>2007</strong>/<strong>08</strong> BCS which relates to<br />
experiences of intimate violence (the collective term used to describe domestic violence <strong>and</strong><br />
sexual assaults) among men <strong>and</strong> women aged 16 to 59. These figures from the BCS are not<br />
affected by levels of reporting to the police, which is particularly important for these crime<br />
types.<br />
<strong>Violence</strong> figures are routinely published (Kershaw et al., 20<strong>08</strong>) but the issue of willingness to<br />
disclose incidents is important for figures about intimate violence. Prevalence rates for<br />
domestic violence from the self-completion module are around five times higher than rates<br />
obtained from face-to-face interviews on the BCS (see Walby <strong>and</strong> Allen, 2001), thus the<br />
figures published here provide a more complete measure of intimate violence victimisation.<br />
1 For more information about the BCS see http://www.homeoffice.gov.uk/rds/bcs1.html.<br />
56
This chapter updates headline findings on the extent <strong>and</strong> trends of intimate violence based on<br />
the <strong>2007</strong>/<strong>08</strong> BCS. The findings on intimate violence relate to experiences since the age of 16<br />
or in the last 12 months for men <strong>and</strong> women aged 16 to 59. Detailed findings from previous<br />
BCS self-completion modules on the extent <strong>and</strong> trends of intimate violence are reported in<br />
Finney (2006), Coleman et al. (<strong>2007</strong>) <strong>and</strong> Povey et al. (20<strong>08</strong>). In addition, this chapter<br />
includes information on multiple <strong>and</strong> repeat victimisation <strong>and</strong> factors associated with higher<br />
risk of intimate violence victimisation. The chapter also focuses on the nature of sexual<br />
assault, including information about the context of victimisation <strong>and</strong> reporting of incidents to<br />
the police or others.<br />
3.2 PREVALENCE OF INTIMATE VIOLENCE<br />
<strong>Intimate</strong> violence is the collective term used for partner abuse, family abuse, <strong>and</strong> sexual<br />
assault, reflecting either the intimate nature of the victim-offender relationship or of the<br />
violence or abuse (see Box 3.2).<br />
Box 3.2 Definition of types of intimate violence 2<br />
Any domestic abuse: non-sexual emotional or financial abuse, threats, physical force or<br />
sexual assault carried out by a current or former partner or other family member.<br />
Partner abuse (non-sexual): non-sexual emotional or financial abuse, threats or physical<br />
force by a current or former partner.<br />
Family abuse (non-sexual): non-sexual emotional or financial abuse, threats or physical<br />
force by a family member other than a partner (father/mother, step-father/mother or other<br />
relative).<br />
Sexual assault: indecent exposure, sexual threats <strong>and</strong> unwanted touching (‘less serious’),<br />
rape or assault by penetration including attempts (‘serious’), by any person including a partner<br />
or family member.<br />
Extent<br />
Women were more likely than men to have experienced intimate violence across all types of<br />
abuse (partner abuse, family abuse <strong>and</strong> sexual assault) since the age of 16. In contrast,<br />
young men are at greatest risk of experiencing any violent crime (Kershaw et al., 20<strong>08</strong>).<br />
• Overall, three in ten (30%) women <strong>and</strong> two in ten (20%) men had experienced any<br />
domestic abuse since the age of 16 (Figure 3.1, Table 3.01). These figures are equivalent<br />
to an estimated 4.8 million female victims of any domestic abuse since the age of 16 <strong>and</strong><br />
3.2 million male victims (Table 3.03).<br />
• Partner abuse (non-sexual) was the most common type of intimate violence experienced<br />
since the age of 16 among both women <strong>and</strong> men. Twenty-seven per cent of women <strong>and</strong><br />
17 per cent of men reported having experienced such abuse (Figure 3.1, Table 3.01).<br />
2 Questions on stalking were not included in the <strong>2007</strong>/<strong>08</strong> BCS. The definition of intimate violence based on the<br />
<strong>2007</strong>/<strong>08</strong> BCS therefore differed from previous definitions that have included stalking. Figures for any domestic,<br />
partner <strong>and</strong> family abuse for previous years have been revised to enable trend analysis.<br />
57
Figure 3.1 Prevalence of intimate violence since the age of 16, by sex, <strong>2007</strong>/<strong>08</strong> BCS<br />
Percentage<br />
The differences between men <strong>and</strong> women were less marked in relation to experiences in the<br />
last year but again showed that women were more likely to have experienced intimate<br />
violence across all three types of abuse.<br />
• Partner abuse (non-sexual) was also the most commonly experienced type of intimate<br />
violence in the last year, with five per cent of women <strong>and</strong> four per cent of men reporting<br />
having experienced it (Table 3.01). These figures represent an estimated 780,000 female<br />
victims of (non-sexual) partner abuse in the last year <strong>and</strong> 663,000 male victims (Table<br />
3.04).<br />
• Approximately three per cent of women <strong>and</strong> less than one per cent of men had<br />
experienced a sexual assault (including attempts) in the last year. The majority of this is<br />
accounted for by less serious sexual assault. Less than one per cent of women <strong>and</strong> men<br />
reported having experienced a serious sexual assault (Table 3.01).<br />
Trends<br />
35<br />
30<br />
25<br />
20<br />
15<br />
10<br />
5<br />
0<br />
17<br />
27<br />
22<br />
Partner abuse<br />
(non-sexual)<br />
8<br />
10<br />
9<br />
Family abuse<br />
(non-sexual)<br />
3<br />
23<br />
In general, prevalence rates of intimate violence showed few changes between 2004/05 <strong>and</strong><br />
2006/07. However, between 2006/07 <strong>and</strong> <strong>2007</strong>/<strong>08</strong> BCS interviews prevalence of (non-sexual)<br />
partner <strong>and</strong> family abuse has declined while overall rates of sexual assault have remained<br />
stable (Table 3.06). The trend showing a decrease between 2006/07 <strong>and</strong> <strong>2007</strong>/<strong>08</strong> after<br />
several years of stability is similar to that for all BCS violence (Kershaw et al., 20<strong>08</strong>).<br />
• Between 2006/07 <strong>and</strong> <strong>2007</strong>/<strong>08</strong> BCS interviews, there was a significant decrease in the<br />
prevalence of women experiencing (non-sexual) partner abuse in the last year (from 6%<br />
to 5%) (Table 3.06).<br />
• The prevalence of both men <strong>and</strong> women experiencing (non-sexual) family abuse in the<br />
last year decreased between 2006/07 <strong>and</strong> <strong>2007</strong>/<strong>08</strong> BCS interviews (from 2% to 1% for<br />
men <strong>and</strong> from 3% to 2% for women) (Table 3.06).<br />
13<br />
Any sexual<br />
assault<br />
(including<br />
attempts)<br />
58<br />
20<br />
30<br />
25<br />
Any domestic<br />
abuse<br />
Men<br />
Women<br />
All
3.3 MULTIPLE AND REPEAT VICTIMISATION<br />
Multiple victimisation is defined here as the experience of more than one type of intimate<br />
violence, while repeat victimisation refers to being a victim of a specific type of intimate<br />
violence more than once.<br />
Multiple victimisation<br />
Most victims of intimate violence since the age of 16 reported having experienced one type of<br />
intimate violence only. However, women were more likely than men to have experienced<br />
more than one type of intimate violence since the age of 16.<br />
• Among female victims of intimate violence since the age of 16, around two-thirds (66%)<br />
had experienced one type of abuse only. Over a quarter (27%) of female victims had<br />
experienced two types of intimate violence while six per cent had experienced all three<br />
types of intimate violence (Table 3.07).<br />
• Around three-quarters (76%) of male victims of intimate violence had experienced one<br />
type of abuse only. About a fifth (21%) of male victims had experienced two types of<br />
intimate violence since the age of 16 <strong>and</strong> a further two per cent had experienced all three<br />
types (Table 3.07).<br />
The most common combinations of types of intimate violence experienced since the age of 16<br />
differed between male <strong>and</strong> female victims.<br />
• For female victims, the most prevalent combination of types of intimate violence was<br />
(non-sexual) partner abuse <strong>and</strong> sexual assault (18%) (Figure 3.2, Table 3.<strong>08</strong>).<br />
• Among male victims, the most prevalent combination of types of intimate violence was<br />
(non-sexual) partner abuse <strong>and</strong> (non-sexual) family abuse (17%) (Figure 3.2, Table 3.<strong>08</strong>).<br />
Figure 3.2 Experiences of combinations of intimate violence among victims since age<br />
16, by sex, <strong>2007</strong>/<strong>08</strong> BCS<br />
Non-sexual<br />
partner abuse<br />
<strong>and</strong> sexual<br />
assault<br />
3%<br />
Non-sex ual<br />
partner abuse<br />
<strong>and</strong> nonsexual<br />
family<br />
abuse<br />
17%<br />
Sexual assault<br />
only<br />
6%<br />
Non-sexual<br />
family abuse<br />
only<br />
15%<br />
Men<br />
Non-sexual<br />
family abuse<br />
<strong>and</strong> sexual<br />
assault<br />
1%<br />
All types<br />
2%<br />
Non-s exual<br />
partner abuse<br />
only<br />
55%<br />
59<br />
<strong>and</strong> sexual<br />
assault<br />
3%<br />
Non-sexual<br />
partner abuse<br />
<strong>and</strong> s exual<br />
assault<br />
18%<br />
Non-sexual<br />
partner abuse<br />
<strong>and</strong> nonsexual<br />
family<br />
abuse<br />
7%<br />
Non-sexual<br />
family abuse<br />
Women<br />
All types<br />
6%<br />
Sexual assault<br />
only<br />
28%<br />
Non-s exual<br />
partner abuse<br />
only<br />
32%<br />
Non-sexual<br />
family abuse<br />
only<br />
6%
Repeat victimisation<br />
Victims of partner abuse <strong>and</strong> sexual assault in the past year were asked how many times they<br />
had experienced the abuse in the past 12 months. 3<br />
Levels of repeat victimisation for partner abuse <strong>and</strong> sexual assault were similar.<br />
• Over two-fifths (45%) of victims of sexual assault in the past year were confirmed repeat<br />
victims (i.e. were victimised more than once in the past 12 months) <strong>and</strong> about two-fifths<br />
(39%) of victims of partner abuse in the past year were confirmed repeat victims (Tables<br />
3.09 <strong>and</strong> 3.10).<br />
Women were more likely than men to be repeat victims of partner abuse <strong>and</strong> to experience<br />
more frequent levels of abuse.<br />
• Over four in ten (44%) women who had experienced any partner abuse in the past year<br />
were confirmed repeat victims (i.e. were victimised more than once in the past 12<br />
months), while over three in ten (32%) men who had experienced any partner abuse in<br />
the previous 12 months were confirmed repeat victims (Table 3.09).<br />
• Eighteen per cent of female victims of any partner abuse reported experiencing six or<br />
more instances of abuse in the past 12 months compared with 11 per cent of male victims<br />
(Table 3.09).<br />
Levels of repeat victimisation for less serious <strong>and</strong> serious sexual assault were similar.<br />
• Nearly four in ten (37%) victims of serious sexual assault in the previous year were repeat<br />
victims, while over four in ten (43%) of those who had experienced less serious sexual<br />
assault were repeat victims (Table 3.10).<br />
3.4 NATURE OF SEXUAL ASSAULT<br />
Further questions were asked in the <strong>2007</strong>/<strong>08</strong> BCS to provide more detail on the<br />
circumstances of sexual assault experienced by respondents either since the age of 16 or in<br />
the past year.<br />
Victim-offender relationship<br />
The victim-offender relationship profiles varied considerably between different types of sexual<br />
assault, <strong>and</strong> also between female <strong>and</strong> male victims.<br />
• For female victims, less serious sexual assault experienced since the age of 16 was most<br />
likely to be committed by a stranger (61%) (Figure 3.3, Table 3.11).<br />
3 A single question was asked of victims of any partner abuse in the last year regarding how many times in the last 12<br />
months they had been abused in any way. A question was asked of victims of each specific form of sexual assault<br />
regarding how may times they had experienced the specific form of sexual assault in the last 12 months. The<br />
possible response categories also differed between the partner abuse <strong>and</strong> sexual assault questions. A significant<br />
minority of respondents to these questions on repeat victimisation responded “don’t know” or “don’t want to answer”.<br />
60
• Among male victims since the age of 16, less serious sexual assault was most likely to be<br />
committed by a stranger (44%) or someone known but neither a partner nor a family<br />
member (e.g. date, friend, acquaintance or colleague; 47%) (Figure 3.3, Table 3.11).<br />
• For female victims of serious sexual assault since the age of 16, the most common<br />
perpetrator was a partner 4 (53%) (Figure 3.3, Table 3.11).<br />
• For male victims of serious sexual assault since the age of 16, the most common<br />
perpetrator was someone else known (e.g. date, friend, acquaintance or colleague; 58%)<br />
(Figure 3.3, Table 3.11).<br />
Figure 3.3 Victim-offender relationship for sexual assault incidents since the age of 16,<br />
by sex, <strong>2007</strong>/<strong>08</strong> BCS<br />
Percentage<br />
70<br />
60<br />
50<br />
40<br />
30<br />
20<br />
10<br />
0<br />
16<br />
Influence of drink <strong>and</strong> drugs<br />
2<br />
47<br />
44<br />
19<br />
5<br />
34<br />
61<br />
Men Women Men Women<br />
Less serious sexual assault Serious sexual assault<br />
Victims of less serious sexual assault in the last year <strong>and</strong> victims of serious sexual assault<br />
since the age of 16 were asked whether they thought the offender (or offenders) was under<br />
the influence of drink or drugs <strong>and</strong> whether they (the victim) were under the influence of drink<br />
at the time of the incident. 5 For those who had experienced more than one incident, only the<br />
most recent incident was asked about.<br />
Victims were more likely to report that offenders were under the influence of drink rather than<br />
drugs in the most recent incident of sexual assault that they had experienced.<br />
4 Includes both current <strong>and</strong> former partner.<br />
5 The questions on influence of drink or drugs were asked of victims of serious sexual assault since age 16 because<br />
the number of victims of serious sexual assault in the last year was low. A significant minority of respondents to these<br />
questions on the influence of drink or drugs responded “don’t know”, “don’t want to answer” or “can’t remember”.<br />
61<br />
32<br />
7<br />
58<br />
9<br />
53<br />
5<br />
41<br />
12<br />
Partner<br />
Family member<br />
Other know n<br />
Stranger
• Nearly half (46%) of victims of less serious sexual assault in the past year thought the<br />
offender was under the influence of drink <strong>and</strong> ten per cent thought the offender was under<br />
the influence of drugs (Table 3.12).<br />
• Nearly two-fifths (38%) of those who had experienced serious sexual assault since the<br />
age of 16 thought the offender had been under the influence of drink <strong>and</strong> 11 per cent<br />
thought the offender was under the influence of drugs (Table 3.13).<br />
A significant minority of victims reported that they were under the influence of drink in the<br />
most recent incident of sexual assault that they had experienced.<br />
• Nearly three in ten (29%) victims reported that they were under the influence of drink at<br />
the time of the most recent incident of less serious sexual assault (Table 3.12).<br />
• Similarly, close to three in ten (28%) victims reported that they were under the influence<br />
of drink at the time of the most recent incident of serious sexual assault (Table 3.13).<br />
Reporting of serious sexual assault<br />
A significant minority of victims of serious sexual assault since the age of 16 had not told<br />
anyone about their most recent experience, <strong>and</strong> only a small minority had told the police.<br />
• Two-fifths (40%) of victims of serious sexual assault since the age of 16 told no-one<br />
about their experience (Table 3.14).<br />
• For those that did tell someone about their experience, the main group that victims<br />
confided in was friends, relatives or neighbours (44%) (Table 3.14).<br />
• Eleven per cent of victims told the police about their most recent experience of serious<br />
sexual assault (Table 3.14). This level of reporting to the police is the same as the<br />
previously published figure based on 2005/06 BCS interviews (Povey et al., 20<strong>08</strong>).<br />
Men <strong>and</strong> women were equally likely to report their experience of serious sexual assault but<br />
there were differences in the likelihood of men <strong>and</strong> women telling particular groups.<br />
• Men were more likely to tell someone at work about their experience (19% compared with<br />
4% for women) while women were more likely to tell a friend, relative or neighbour (46%<br />
compared with 21% for men) (Table 3.14).<br />
3.5 UNEQUAL RISK<br />
The risk of intimate violence victimisation varies by personal, household <strong>and</strong> area<br />
characteristics. This section focuses on prevalence rates for the last year because the<br />
circumstances of any victim may change considerably since the age of 16 <strong>and</strong> therefore their<br />
lifetime victimisation may not be strongly related to their current situation. 6 Detailed<br />
6 Even when using last year prevalence rates, one cannot be certain that the respondent’s characteristics at the time<br />
of the BCS interview were the same at the time of victimisation. For example, there is a high prevalence of any<br />
domestic abuse amongst respondents who are separated but respondents may have separated from their partners<br />
after the abuse had taken place.<br />
62
eakdowns can be found in Tables 3.15 <strong>and</strong> 3.16, <strong>and</strong> key patterns based on risk for any<br />
domestic abuse are highlighted below.<br />
• Younger men <strong>and</strong> women (in the 16 to 19 or 20 to 24 age range) reported higher levels of<br />
victimisation for any domestic abuse than those in older age groups (Figure 3.4 <strong>and</strong> Table<br />
3.15). This finding is consistent with results for all BCS violent crime (Kershaw et al.,<br />
20<strong>08</strong>).<br />
• Men <strong>and</strong> women who were married had a lower risk of any domestic abuse than men <strong>and</strong><br />
women who were single, cohabiting, separated or divorced. Women who were separated<br />
reported particularly high levels of risk for any domestic abuse (18%) (Figure 3.4 <strong>and</strong><br />
Table 3.15).<br />
• Men <strong>and</strong> women in households with a single adult <strong>and</strong> child (or children) also had<br />
amongst the highest levels of risk for any domestic abuse (16% <strong>and</strong> 18% respectively)<br />
(Figure 3.4 <strong>and</strong> Table 3.16).<br />
• The likelihood of being a victim of any domestic abuse tended to increase with decreasing<br />
household income. Women living in households with an income of less than £10,000<br />
were at particularly high risk of any domestic abuse (13%) (Figure 3.4 <strong>and</strong> Table 3.16).<br />
• Men <strong>and</strong> women living in areas where physical disorder was assessed as high 7 <strong>and</strong> in<br />
rented accommodation were more likely to be victims of any domestic abuse in the past<br />
year (Table 3.16).<br />
• There was little variation in risk of any domestic abuse by ethnic group (between White<br />
<strong>and</strong> Non-White groups) or area type (between urban <strong>and</strong> rural areas) (Tables 3.15 <strong>and</strong><br />
3.16).<br />
Figure 3.4 Adults most at risk of any domestic abuse in the past year, <strong>2007</strong>/<strong>08</strong> BCS<br />
Female, separated<br />
Female in single adult <strong>and</strong> child(ren) household<br />
Male in single adult <strong>and</strong> child(ren) household<br />
Female in household w ith income less than £10,000<br />
Female, divorced<br />
Female aged 16-19<br />
Female student<br />
Female living in social-rented sector<br />
7 Interviewer assessment, see the Glossary for more information.<br />
0 2 4 6 8 10 12 14 16 18 20<br />
63<br />
11<br />
11<br />
11<br />
11<br />
13<br />
% victims once or more<br />
16<br />
18<br />
18
The patterns identified above for variation of risk on the overall measure of any domestic<br />
abuse in the past year were generally similar across the different types of intimate violence<br />
(non-sexual family abuse, non-sexual partner abuse <strong>and</strong> sexual assault).<br />
• The pattern of declining risk of intimate violence with increasing age was generally<br />
consistent across all types of intimate violence for both men <strong>and</strong> women (Table 3.15).<br />
• Single men <strong>and</strong> women were consistently at higher risk of intimate violence than<br />
married men <strong>and</strong> women (Table 3.15).<br />
• Men <strong>and</strong> women living in owner-occupied accommodation were less likely to be<br />
victims of each type of intimate violence compared with those living in private or<br />
social-rented accommodation (Table 3.16).<br />
• There were no differences between White <strong>and</strong> Non-White groups for risk of any type<br />
of intimate violence (Table 3.15).<br />
The effect of some risk factors varied depending upon the type of intimate violence,<br />
particularly when comparing sexual assault with other forms of intimate violence.<br />
• Women away from home for more than seven hours a week were more likely to be<br />
victims of sexual assault than those who were away from home for less than three<br />
hours (3% compared with 2%). However, women who were away from home for less<br />
than three hours were more likely to be victims of (non-sexual) partner abuse than<br />
those who were away from home for more than seven hours (6% compared with 4%)<br />
(Table 3.15).<br />
Several of the risk factors mentioned above, such as age <strong>and</strong> marital status, may overlap with<br />
each other. Multivariate analysis was carried out to examine which characteristics were<br />
associated with risk of intimate violence in the past year independently of other factors. This<br />
analysis was carried out separately for men <strong>and</strong> women <strong>and</strong> for each type of intimate violence<br />
(apart from sexual assault for men where there were too few cases for reliable analysis). The<br />
main results of the multivariate analysis are summarised in Table 3a <strong>and</strong> outlined below.<br />
• Marital status was a strong predictor of risk for all types of intimate violence in the last<br />
year for both men <strong>and</strong> women. Married men <strong>and</strong> women had lower odds of (non-sexual)<br />
partner abuse compared with men <strong>and</strong> women who were cohabiting, single, separated or<br />
divorced (Table 3a <strong>and</strong> Tables 3.17 to 3.23).<br />
• Household type was strongly associated with any domestic abuse, (non-sexual) partner<br />
abuse <strong>and</strong> (non-sexual) family abuse in the past year for women but not for men. For<br />
(non-sexual) partner abuse, both women living in households as a single adult with a<br />
child (or children) <strong>and</strong> women living in households with another adult <strong>and</strong> a child (or<br />
children) had higher odds of victimisation than those living in households with no children.<br />
For (non-sexual) family abuse, only women living in households with another adult <strong>and</strong> a<br />
child (or children) had higher odds of victimisation than those living in households with no<br />
children (Table 3a <strong>and</strong> Tables 3.17 to 3.22).<br />
64
• Having a limiting disability or illness was strongly associated with (non-sexual) family<br />
abuse for women, but not for men (Table 3a <strong>and</strong> Tables 3.21 to 3.22). The association<br />
between having a limiting disability or illness <strong>and</strong> experiencing intimate violence is<br />
consistent with previous findings from the BCS (see Finney, 2006 <strong>and</strong> Coleman et al.,<br />
<strong>2007</strong>). Particular factors such as social <strong>and</strong> physical isolation, dependence on carers <strong>and</strong><br />
communication difficulties may place people with disabilities at greater risk of domestic<br />
abuse (BMA, <strong>2007</strong>).<br />
• The lifestyle factor of frequency of pub visits was strongly associated only with risk of<br />
sexual assault in the past year. Women who had visited a pub or wine bar more than<br />
once a week during the past month had higher odds of experiencing a sexual assault in<br />
the past year than those who had not visited a pub or wine bar at all in the past month<br />
(Table 3a <strong>and</strong> Table 3.23). The link between frequency of pub visits <strong>and</strong> experience of<br />
sexual assault is likely to be complex but it emphasises the influence of alcohol as a<br />
factor in sexual violence, as indicated in the previous section of this chapter <strong>and</strong> in other<br />
research (see Finney, 2004).<br />
Table 3a Factors independently associated with risk of intimate violence in the past<br />
year, by sex, <strong>2007</strong>/<strong>08</strong> BCS<br />
Any domestic abuse Partner abuse<br />
(non-sexual)<br />
Family abuse<br />
(non-sexual)<br />
Sexual<br />
assault<br />
Men Women Men Women Men Women Women<br />
Marital status <br />
Household type <br />
Long-st<strong>and</strong>ing illness or disability <br />
Respondent's age <br />
Tenure <br />
Number of visits to pub/wine bar in<br />
the evening during last month<br />
<br />
Ethnic group <br />
ACORN category <br />
Highest qualification <br />
Respondent's employment status <br />
denotes factor strongly independently associated with risk of victimisation (contributing at least 1% improvement in the model);<br />
denotes factor independently associated with risk of victimisation (contributing less).<br />
65
Table 3.01 Prevalence of intimate violence by category among adults aged 16 to 59, by sex<br />
Percentages <strong>2007</strong>/<strong>08</strong> BCS<br />
Since the age of 16 In the last year<br />
Men Women All Men Women All<br />
% victims once or more<br />
Any domestic abuse (partner or family nonphysical<br />
abuse, threats, force or sexual<br />
assault) 1<br />
Any partner abuse (non-physical abuse,<br />
threats, force or sexual assault) 2<br />
Any family abuse (non-physical abuse, threats,<br />
force or sexual assault) 2<br />
20.0 30.2 25.2 4.5 6.0 5.3<br />
16.8 26.5 21.7 4.0 4.8 4.4<br />
7.5 10.0 8.7 1.2 2.0 1.6<br />
Partner abuse (non-physical abuse, threats or<br />
force) - non-sexual 2<br />
17.1 26.7 22.0 4.1 4.9 4.5<br />
Non-physical abuse (emotional, financial) 11.2 18.8 15.1 2.6 3.4 3.0<br />
Threats 3 or force 10.3 19.7 15.1 2.1 2.7 2.4<br />
Threats 3<br />
1.3 10.1 5.8 0.2 1.4 0.9<br />
Force 10.0 17.9 14.0 2.0 2.2 2.1<br />
- Minor 4.6 14.0 9.4 1.0 1.6 1.3<br />
- Severe 8.1 12.9 10.5 1.4 1.5 1.4<br />
Family abuse (non-physical abuse, threats or<br />
force) - non-sexual 2<br />
7.7 9.6 8.7 1.4 2.1 1.8<br />
Non-physical abuse (emotional, financial) 4.4 5.9 5.2 0.9 1.2 1.0<br />
Threats 3 or force 4.4 6.0 5.2 0.6 1.2 0.9<br />
Threats 3<br />
1.1 2.3 1.7 0.1 0.4 0.3<br />
Force 3.8 5.1 4.5 0.5 1.0 0.8<br />
- Minor 1.7 3.3 2.5 0.2 0.6 0.4<br />
- Severe 2.9 3.5 3.2 0.4 0.6 0.5<br />
Any sexual assault (including attempts) 3.0 23.3 13.3 0.4 3.0 1.7<br />
Serious sexual assault including attempts 0.6 5.3 3.0 0.1 0.6 0.4<br />
Serious sexual assault excluding attempts 0.4 4.2 2.3 0.1 0.4 0.2<br />
- Rape including attempts 4<br />
0.5 4.6 2.6 0.1 0.5 0.3<br />
- Rape excluding attempts<br />
4<br />
0.3 3.7 2.0 0.1 0.3 0.2<br />
- Assault by penetration including attempts<br />
5<br />
0.2 1.8 1.0 0.0 0.3 0.1<br />
5<br />
- Assault by penetration excluding attempts 0.1 1.3 0.7 0.0 0.2 0.1<br />
Less serious sexual assault 2.7 22.2 12.6 0.3 2.7 1.6<br />
Unweighted base 11,021 12,634 23,655 10,940 12,486 23,426<br />
1. Domestic abuse refers to non-physical abuse, threats, force or sexual assault carried out by a current or former partner or other family<br />
member.<br />
2. Partner abuse refers to abuse carried out by a current or former partner; family abuse is mutually exclusive, referring to abuse carried<br />
out by a family member other than a partner (father/mother, step-father/mother, or other relative). The apparent anomalies between<br />
prevalence rates of non-sexual abuse <strong>and</strong> any abuse are due to the exclusion of 'don't know' responses <strong>and</strong> refusals from the analysis (only<br />
valid responses are included) which affects base sizes <strong>and</strong> thus prevalence rates.<br />
3. Threats are classified as an affirmative response to the statement 'frightened you by threatening to hurt you/someone close'.<br />
4. Rape is the legal category of rape introduced in legislation in 2003. It is the penetration of the vagina or anus without consent <strong>and</strong><br />
penetration of the mouth by a penis without consent.<br />
5. Assault by penetration is a legal offence introduced in 2003. It is the penetration of the vagina or anus with an object or other body part<br />
without consent.<br />
6. For prevalence risks of elements making up these categories see Table 3.02.<br />
7. The bases given are for any partner abuse; the bases for the other measures presented will be similar.<br />
66
Table 3.02 Detailed prevalence of intimate violence elements among adults aged 16 to 59, by sex<br />
Percentages <strong>2007</strong>/<strong>08</strong> BCS<br />
Since the age of 16 In the last year<br />
Men Women All Men Women All<br />
% victims once or more<br />
Partner abuse (non-physical abuse, threats or force) - non-sexual 1<br />
Non-physical abuse (emotional, financial) 11.2 18.8 15.1 2.6 3.4 3.0<br />
Prevented you from having your fair share of household money 2.4 6.2 4.3 0.5 0.9 0.7<br />
Stopped you from seeing friends <strong>and</strong> relatives 7.8 10.2 9.1 1.8 1.7 1.7<br />
Repeatedly belittled you so that you felt worthless 4.1 12.7 8.5 0.8 2.0 1.4<br />
Threats 2<br />
1.3 10.1 5.8 0.2 1.4 0.9<br />
Force 10.0 17.9 14.0 2.0 2.2 2.1<br />
- Minor 3<br />
4.6 14.0 9.4 1.0 1.6 1.3<br />
- Severe 8.1 12.9 10.5 1.4 1.5 1.4<br />
Kicked, bit or hit you, or threw something at you 6.9 9.3 8.1 1.1 1.0 1.0<br />
Choked or tried to strangle you 0.5 4.8 2.7 0.1 0.5 0.3<br />
Threatened you with a weapon (e.g. a stick or knife) 1.5 2.7 2.1 0.1 0.3 0.2<br />
Threatened to kill you 0.6 3.4 2.1 0.1 0.4 0.3<br />
Used a weapon against you, for example a stick or knife 0.8 1.5 1.2 0.1 0.1 0.1<br />
Used some other kind of force against you 1.6 5.0 3.3 0.2 0.5 0.4<br />
Family abuse (non-physical abuse, threats or force) - non-sexual 1<br />
Non-physical abuse (emotional, financial) 4.4 5.9 5.2 0.9 1.2 1.0<br />
Prevented you from having your fair share of household money 0.9 1.2 1.0 0.1 0.2 0.2<br />
Stopped you from seeing friends <strong>and</strong> relatives 2.6 3.1 2.8 0.5 0.5 0.5<br />
Repeatedly belittled you so that you felt worthless 1.6 3.4 2.5 0.3 0.7 0.5<br />
Threats 2<br />
1.1 2.3 1.7 0.1 0.4 0.3<br />
Force 3.8 5.1 4.5 0.5 1.0 0.8<br />
- Minor 3<br />
1.7 3.3 2.5 0.2 0.6 0.4<br />
- Severe 2.9 3.5 3.2 0.4 0.6 0.5<br />
Kicked, bit or hit you, or threw something at you 2.1 2.4 2.3 0.3 0.5 0.4<br />
Choked or tried to strangle you 0.3 0.7 0.5 0.0 0.1 0.0<br />
Threatened you with a weapon (e.g. a stick or knife) 0.5 0.6 0.5 0.0 0.1 0.0<br />
Threatened to kill you 0.3 0.5 0.4 0.1 0.0 0.1<br />
Used a weapon against you, for example a stick or knife 0.3 0.4 0.3 0.0 0.0 0.0<br />
Used some other kind of force against you 0.7 1.0 0.9 0.1 0.1 0.1<br />
Any sexual assault (including attempts)<br />
Serious sexual assault including attempts 0.6 5.3 3.0 0.1 0.6 0.4<br />
Penetrated your vagina/anus with their penis 0.2 3.5 1.9 0.0 0.2 0.1<br />
Penetrated your vagina/anus with an object 0.1 1.3 0.7 0.0 0.2 0.1<br />
Penetrated your mouth with their penis 0.1 0.7 0.4 0.0 0.1 0.1<br />
Attempted to penetrate your vagina/anus with their penis 0.2 1.2 0.7 0.0 0.2 0.1<br />
Attempted to penetrate your vagina/anus with an object 0.1 0.6 0.3 0.0 0.1 0.0<br />
Attempted to penetrate your mouth with their penis 0.1 0.2 0.1 0.0 0.0 0.0<br />
Less serious sexual assault 2.7 22.2 12.6 0.3 2.7 1.6<br />
Indecently exposed themselves to you 1.0 11.2 6.2 0.1 0.6 0.4<br />
Touched you sexually when you did not want it 1.5 12.3 7.0 0.2 1.9 1.1<br />
Sexually threatened you 0.5 5.6 3.1 0.1 0.5 0.3<br />
Unweighted base 11,192 13,117 24,309 11,104 12,991 24,095<br />
1. Partner abuse refers to abuse carried out by a current or former partner; family abuse is mutually exclusive, referring to abuse carried out by a family member<br />
other than a partner (father/mother, step-father/mother, or other relative).<br />
2. Threats are classified as an affirmative response to the statement 'frightened you by threatening to hurt you/someone close'.<br />
3. Minor force is classified as an affirmative response to the statement 'pushed you, held you down or slapped you'.<br />
4. The bases given are for partner abuse; the bases for the other measures presented will be similar.<br />
67
Table 3.03 Estimates of numbers of victims of intimate violence since the age of 16 by category among adults aged 16 to 59, by sex<br />
Numbers (000s) <strong>2007</strong>/<strong>08</strong> BCS<br />
Any domestic abuse (partner or family non-physical abuse,<br />
threats, force or sexual assault) 1<br />
Any partner abuse (non-physical abuse, threats, force or<br />
sexual assault) 2<br />
Any family abuse (non-physical abuse, threats, force or<br />
sexual assault) 2<br />
Partner abuse (non-physical abuse, threats or force) - nonsexual<br />
2<br />
Family abuse (non-physical abuse, threats or force) - nonsexual<br />
2<br />
Best<br />
estimate<br />
Higher<br />
estimate<br />
Lower<br />
estimate<br />
Men 3,209 3,354 3,065<br />
Women 4,839 4,993 4,684<br />
All 8,069 8,283 7,855<br />
Men 2,693 2,827 2,559<br />
Women 4,252 4,400 4,104<br />
All 6,963 7,165 6,761<br />
Men 1,196 1,291 1,101<br />
Women 1,605 1,706 1,504<br />
All 2,806 2,945 2,667<br />
Men 2,736 2,871 2,602<br />
Women 4,286 4,431 4,140<br />
All 7,054 7,254 6,853<br />
Men 1,243 1,339 1,147<br />
Women 1,543 1,641 1,446<br />
All 2,792 2,929 2,655<br />
Any sexual assault (including attempts) Men 476 537 416<br />
Women 3,733 3,874 3,592<br />
All 4,258 4,423 4,093<br />
1. Domestic abuse refers to non-physical abuse, threats, force or sexual assault carried out by a current or former partner or<br />
other family member.<br />
2. Partner abuse refers to abuse carried out by a current or former partner; family abuse is mutually exclusive, referring to<br />
abuse carried out by a family member other than a partner (father/mother, step-father/mother, or other relative). The apparent<br />
anomalies between prevalence rates of non-sexual abuse <strong>and</strong> any abuse are due to the exclusion of 'don't know' responses <strong>and</strong><br />
refusals from the analysis (only valid responses are included) which affects base sizes <strong>and</strong> thus prevalence rates.<br />
3. Numbers are derived by mutliplying the prevalence rate by the <strong>2007</strong> population aged 16 to 59 in Engl<strong>and</strong> <strong>and</strong> Wales (based on<br />
mid-2006 estimates from the Office for National Statistics). Lower <strong>and</strong> higher estimates are derived using the 95 per cent<br />
confidence interval.<br />
68
Table 3.04 Estimates of numbers of victims of intimate violence in the last year by category among adults aged 16 to 59, by sex<br />
Numbers (000s) <strong>2007</strong>/<strong>08</strong> BCS<br />
Any domestic abuse (partner or family non-physical abuse,<br />
threats, force or sexual assault) 1<br />
Any partner abuse (non-physical abuse, threats, force or<br />
sexual assault) 2<br />
Any family abuse (non-physical abuse, threats, force or<br />
sexual assault) 2<br />
Partner abuse (non-physical abuse, threats or force) - nonsexual<br />
2<br />
Family abuse (non-physical abuse, threats or force) - nonsexual<br />
2<br />
Best<br />
estimate<br />
Higher<br />
estimate<br />
Lower<br />
estimate<br />
Men 727 802 651<br />
Women 958 1,039 878<br />
All 1,688 1,799 1,577<br />
Men 641 711 570<br />
Women 770 842 697<br />
All 1,412 1,513 1,311<br />
Men 198 238 158<br />
Women 325 372 277<br />
All 524 587 462<br />
Men 663 735 592<br />
Women 780 851 709<br />
All 1,446 1,546 1,345<br />
Men 218 259 176<br />
Women 341 389 293<br />
All 561 626 497<br />
Any sexual assault (including attempts) Men 61 83 39<br />
Women 478 535 421<br />
All 543 606 480<br />
1. Domestic abuse refers to non-physical abuse, threats, force or sexual assault carried out by a current or former partner or other family<br />
member.<br />
2. Partner abuse refers to abuse carried out by a current or former partner; family abuse is mutually exclusive, referring to abuse carried<br />
out by a family member other than a partner (father/mother, step-father/mother, or other relative). The apparent anomalies between<br />
prevalence rates of non-sexual abuse <strong>and</strong> any abuse are due to the exclusion of 'don't know' responses <strong>and</strong> refusals from the analysis<br />
(only valid responses are included) which affects base sizes <strong>and</strong> thus prevalence rates.<br />
3. Numbers are derived by mutliplying the prevalence rate by the <strong>2007</strong> population aged 16 to 59 in Engl<strong>and</strong> <strong>and</strong> Wales (based on mid-2006<br />
estimates from the Office for National Statistics). Lower <strong>and</strong> higher estimates are derived using the 95 per cent confidence interval.<br />
69
Table 3.05 Prevalence of intimate violence since the age of 16 among adults aged 16 to 59, by sex, 2004/05 to <strong>2007</strong>/<strong>08</strong> BCS<br />
Percentages BCS<br />
Men<br />
Women<br />
All<br />
2004/05 2005/06 2006/07 <strong>2007</strong>/<strong>08</strong> 2004/05 2005/06 2006/07 <strong>2007</strong>/<strong>08</strong> 2004/05 2005/06 2006/07 <strong>2007</strong>/<strong>08</strong><br />
% victims once or more<br />
% victims once or more<br />
% victims once or more<br />
17.5 17.2 17.8 16.8 27.4 28.0 27.8 26.5 22.5 22.7 22.8 * 21.7<br />
Any partner abuse (non-physical abuse, threats,<br />
force, sexual assault) 1<br />
8.9 8.4 8.7 * 7.5 12.2 11.7 11.6 * 10.0 10.6 10.0 10.2 * 8.7<br />
Any family abuse (non-physical abuse, threats,<br />
force, sexual assault) 1<br />
Partner abuse (non-physical abuse, threats or<br />
force) - non-sexual 1<br />
17.8 17.5 18.0 17.1 27.9 28.1 28.0 26.7 23.0 22.9 23.1 * 22.0<br />
Non-physical abuse (emotional, financial) 10.9 10.8 11.3 11.2 19.4 19.1 19.0 18.8 15.2 15.1 15.2 15.1<br />
Threats 2 or force 10.9 10.7 11.2 10.3 20.5 20.8 21.1 * 19.7 15.8 15.9 16.3 * 15.1<br />
Threats 2<br />
1.5 1.4 1.3 1.3 10.4 10.4 10.5 10.1 6.0 6.0 6.0 5.8<br />
Force 10.6 10.4 10.9 10.0 18.9 19.1 19.2 * 17.9 14.9 14.8 15.1 * 14.0<br />
- Minor 4.8 4.4 4.5 4.6 14.7 15.2 14.6 14.0 9.9 9.9 9.6 9.4<br />
- Severe 8.8 8.7 9.3 * 8.1 13.9 13.7 14.0 * 12.9 11.4 11.2 11.7 * 10.5<br />
Family abuse (non-physical abuse, threats or<br />
force) - non-sexual 1<br />
9.2 8.6 9.0 * 7.7 11.9 11.5 11.6 * 9.6 10.6 10.1 10.3 * 8.7<br />
Non-physical abuse (emotional, financial) 5.1 4.9 5.2 * 4.4 7.2 7.2 7.2 * 5.9 6.2 6.1 6.2 * 5.2<br />
Threats 2 or force 5.4 5.1 5.4 * 4.4 7.5 7.4 7.4 * 6.0 6.5 6.3 6.4 * 5.2<br />
Threats 2<br />
1.2 1.2 1.5 * 1.1 3.0 2.9 3.0 * 2.3 2.1 2.1 2.3 * 1.7<br />
Force 5.0 4.5 4.7 * 3.8 6.5 6.4 6.3 * 5.1 5.8 5.5 5.5 * 4.5<br />
- Minor 2.2 2.2 2.2 * 1.7 4.2 4.0 4.3 * 3.3 3.2 3.2 3.3 * 2.5<br />
- Severe 3.8 3.3 3.6 * 2.9 4.3 4.5 4.3 * 3.5 4.0 3.9 3.9 * 3.2<br />
70<br />
Sexual assault (any assault including attempts) 3.4 3.6 3.7 * 3.0 23.5 23.9 23.9 23.3 13.5 13.9 14.0 13.3<br />
Serious sexual assault including attempts 0.6 0.6 0.6 0.6 5.6 5.7 5.5 5.3 3.1 3.2 3.1 3.0<br />
Serious sexual assault excluding attempts 0.4 0.4 0.4 0.4 4.4 4.4 4.3 4.2 2.4 2.4 2.4 2.3<br />
- Rape including attempts 3<br />
0.4 0.5 0.5 0.5 5.0 5.0 4.8 4.6 2.7 2.8 2.7 2.6<br />
- Rape excluding attempts 3<br />
0.3 0.3 0.3 0.3 3.8 3.8 3.8 3.7 2.1 2.1 2.0 2.0<br />
- Assault by penetration including attempts 4<br />
0.2 0.1 0.2 0.2 2.0 2.0 2.0 1.8 1.1 1.1 1.1 1.0<br />
- Assault by penetration excluding attempts 4<br />
0.1 0.1 0.2 0.1 1.6 1.6 1.5 1.3 0.9 0.9 0.9 0.7<br />
Less serious sexual assault 3.1 3.4 3.4 * 2.7 22.3 22.8 22.9 22.2 12.8 13.3 13.3 * 12.6<br />
Unweighted base 10,547 11,394 11,297 11,021 12,737 13,610 13,030 12,634 23,284 25,004 24,327 23,655<br />
1. Partner abuse refers to abuse carried out by a current or former partner; family abuse is mutually exclusive, referring to abuse carried out by a family member other than a partner (father/mother, stepfather/mother,<br />
or other relative). The apparent anomalies between prevalence rates of non-sexual abuse <strong>and</strong> any abuse are due to the exclusion of 'don't know' responses <strong>and</strong> refusals from the analysis (only<br />
valid responses are included) which affects base sizes <strong>and</strong> thus prevalence rates. Figures for any partner <strong>and</strong> family abuse for previous years have been revised to exclude stalking in order to create a<br />
comparable measure with figures from the <strong>2007</strong>/<strong>08</strong> BCS (in which questions on stalking were not included).<br />
2. Threats are classified as an affirmative response to the statement 'frightened you by threatening to hurt you/someone close'.<br />
3. Rape is the legal category of rape introduced in legislation in 2003. It is the penetration of the vagina or anus without consent <strong>and</strong> penetration of the mouth by a penis without consent.<br />
4. Assault by penetration is a legal offence introduced in 2003. It is the penetration of the vagina or anus with an object or other body part without consent.<br />
5. The bases given are for any partner abuse; the bases for the other measures presented will be similar.<br />
6. * Indicates a statistically significant change at the five per cent level; the asterisk appears between the years being compared.
Table 3.06 Prevalence of intimate violence in the last year among adults aged 16 to 59, by sex, 2004/05 to <strong>2007</strong>/<strong>08</strong> BCS<br />
Percentages BCS<br />
Men<br />
Women<br />
All<br />
2004/05 2005/06 2006/07 <strong>2007</strong>/<strong>08</strong> 2004/05 2005/06 2006/07 <strong>2007</strong>/<strong>08</strong> 2004/05 2005/06 2006/07 <strong>2007</strong>/<strong>08</strong><br />
% victims once or more<br />
% victims once or more<br />
% victims once or more<br />
4.1 4.0 4.2 4.0 5.4 5.6 5.3 4.8 4.7 4.8 4.8 4.4<br />
Any partner abuse (non-physical abuse, threats,<br />
force, sexual assault) 1<br />
2.0 1.8 1.9 * 1.2 3.1 2.9 2.9 * 2.0 2.5 2.4 2.4 * 1.6<br />
Any family abuse (non-physical abuse, threats,<br />
force, sexual assault) 1<br />
Partner abuse (non-physical abuse, threats or<br />
force) - non-sexual 1<br />
4.1 4.0 4.3 4.1 5.6 5.7 5.6 * 4.9 4.9 4.9 5.0 * 4.5<br />
Non-physical abuse (emotional, financial) 2.6 2.6 2.8 2.6 3.7 3.6 3.5 3.4 3.2 3.1 3.1 3.0<br />
Threats 2 or force 2.1 1.9 2.2 2.1 3.3 3.5 3.4 * 2.7 2.7 2.7 2.8 * 2.4<br />
Threats 2<br />
0.3 0.2 0.2 0.2 1.5 1.7 1.7 1.4 0.9 1.0 0.9 0.9<br />
Force 2.0 1.8 2.2 2.0 2.7 3.0 2.7 * 2.2 2.4 2.4 2.4 2.1<br />
- Minor 1.0 0.8 0.9 1.0 1.9 * 2.4 * 1.9 1.6 1.4 1.6 1.4 1.3<br />
- Severe 1.6 1.3 * 1.7 1.4 1.8 1.8 1.8 1.5 1.7 1.5 1.7 * 1.4<br />
Family abuse (non-physical abuse, threats or<br />
force) - non-sexual 1<br />
2.0 1.9 2.1 * 1.4 3.1 3.1 3.2 * 2.1 2.6 2.5 2.6 * 1.8<br />
Non-physical abuse (emotional, financial) 1.2 1.1 1.2 * 0.9 1.7 1.8 1.8 * 1.2 1.5 1.4 1.5 * 1.0<br />
Threats 2 or force 1.0 1.0 0.9 * 0.6 1.7 1.9 1.9 * 1.2 1.4 1.5 1.4 * 0.9<br />
Threats 2<br />
0.2 0.2 0.1 0.1 0.6 0.7 0.7 * 0.4 0.4 0.5 0.4 * 0.3<br />
Force 0.9 0.9 0.9 * 0.5 1.4 1.5 1.5 * 1.0 1.1 1.2 1.2 * 0.8<br />
- Minor 0.2 0.4 0.4 0.2 0.8 0.8 0.9 0.6 0.5 0.6 0.6 * 0.4<br />
- Severe 0.7 0.6 0.6 * 0.4 0.9 1.0 0.9 * 0.6 0.8 0.8 0.8 * 0.5<br />
71<br />
Sexual assault (any assault including attempts) 0.6 0.6 0.6 0.4 2.8 3.3 3.1 3.0 1.7 1.9 1.8 1.7<br />
Serious sexual assault including attempts 0.1 0.1 0.1 0.1 0.5 0.7 0.6 0.6 0.3 0.4 0.3 0.4<br />
Serious sexual assault excluding attempts 0.1 0.1 0.0 0.1 0.3 0.5 0.4 0.4 0.2 0.3 0.2 0.2<br />
- Rape including attempts 3<br />
0.1 0.1 0.0 0.1 0.4 0.5 0.5 0.5 0.2 0.3 0.3 0.3<br />
- Rape excluding attempts 3<br />
0.1 0.1 0.0 0.1 0.2 0.4 0.4 0.3 0.2 0.2 0.2 0.2<br />
- Assault by penetration including attempts 4<br />
0.1 * 0.0 0.0 0.0 0.2 0.3 0.2 0.3 0.1 0.1 0.1 0.1<br />
- Assault by penetration excluding attempts 4<br />
0.0 0.0 0.0 0.0 0.2 0.2 0.2 0.2 0.1 0.1 0.1 0.1<br />
Less serious sexual assault 0.5 0.5 0.5 0.3 2.6 2.9 2.9 2.7 1.6 1.7 1.7 1.6<br />
Unweighted base 10,478 11,296 11,216 10,940 12,599 13,464 12,896 12,486 23,077 24,760 24,112 23,426<br />
1. Partner abuse refers to abuse carried out by a current or former partner; family abuse is mutually exclusive, referring to abuse carried out by a family member other than a partner (father/mother, stepfather/mother,<br />
or other relative). The apparent anomalies between prevalence rates of non-sexual abuse <strong>and</strong> any abuse are due to the exclusion of 'don't know' responses <strong>and</strong> refusals from the analysis (only<br />
valid responses are included) which affects base sizes <strong>and</strong> thus prevalence rates. Figures for any partner <strong>and</strong> family abuse for previous years have been revised to exclude stalking in order to create a<br />
comparable measure with figures from the <strong>2007</strong>/<strong>08</strong> BCS (in which questions on stalking were not included).<br />
2. Threats are classified as an affirmative response to the statement 'frightened you by threatening to hurt you/someone close'.<br />
3. Rape is the legal category of rape introduced in legislation in 2003. It is the penetration of the vagina or anus without consent <strong>and</strong> penetration of the mouth by a penis without consent.<br />
4. Assault by penetration is a legal offence introduced in 2003. It is the penetration of the vagina or anus with an object or other body part without consent.<br />
5. The bases given are for any partner abuse; the bases for the other measures presented will be similar.<br />
6. * Indicates a statistically significant change at the five per cent level; the asterisk appears between the years being compared.
Table 3.07 Percentage of intimate violence victims experiencing one, two or all types since the age of 16, by sex<br />
Percentages <strong>2007</strong>/<strong>08</strong> BCS<br />
Men Women All<br />
One type 76 66 69<br />
Two types 21 27 25<br />
All three types 2 6 5<br />
Unweighted base 2,683 6,004 8,687<br />
Table 3.<strong>08</strong> Experiences of combinations of intimate violence among victims since the age of 16, by sex<br />
Percentages <strong>2007</strong>/<strong>08</strong> BCS<br />
Men Women All<br />
Non-sexual partner abuse only 55 32 40<br />
Non-sexual family abuse only 15 6 9<br />
Sexual assault only 6 28 21<br />
Non-sexual partner abuse <strong>and</strong> non-sexual family abuse 17 7 10<br />
Non-sexual partner abuse <strong>and</strong> sexual assault 3 18 13<br />
Non-sexual family abuse <strong>and</strong> sexual assault 1 3 2<br />
All types 2 6 5<br />
Unweighted base 2,683 6,004 8,687<br />
72
Table 3.09 Number of times victims of partner abuse had been abused by partner(s) in the last year, by sex<br />
Percentages <strong>2007</strong>/<strong>08</strong> BCS<br />
Men Women All<br />
Once 32 24 27<br />
More than once 32 44 39<br />
Twice 11 10 11<br />
Three to five times 10 16 13<br />
Between six <strong>and</strong> 20 times 8 11 9<br />
Between 21 <strong>and</strong> 49 times 1 3 2<br />
More than 50 times/too many times to count 2 5 4<br />
Don't know 17 12 14<br />
Don't want to answer 20 20 20<br />
Unweighted base 490 747 1,237<br />
1. Partner abuse includes non-physical abuse, threats, force <strong>and</strong> sexual assault.<br />
73
Table 3.10 Number of times victims had experienced sexual assault in the last year<br />
Percentages <strong>2007</strong>/<strong>08</strong> BCS<br />
Less serious sexual assault Serious sexual assault All sexual assault<br />
Women All Women All Women All<br />
Once 51 50 49 48 48 46<br />
More than once 43 43 36 37 44 45<br />
Twice 19 18 14 15 20 18<br />
Three times or more 24 25 22 22 24 27<br />
Don't know/Don't want to answer 6 7 15 15 8 9<br />
Unweighted base 294 331 78 91 324 367<br />
1. Sample size for male victims is too low to provide robust estimates.<br />
74
Table 3.11 Victim-offender relationship for sexual assault incidents since the age of 16, by sex<br />
Percentages <strong>2007</strong>/<strong>08</strong> BCS<br />
Less serious Serious<br />
sexual assault sexual<br />
assault 2<br />
Men<br />
Women All<br />
Less serious Serious Less serious Serious<br />
sexual sexual assault sexual assault sexual<br />
assault<br />
assault<br />
Partner 16 32 19 53 19 50<br />
Husb<strong>and</strong>/wife 2 7 6 14 5 14<br />
Partner/boyfriend/girlfriend 8 14 8 23 8 22<br />
Ex-husb<strong>and</strong>/wife 0 2 2 7 2 6<br />
Previous partner/boyfriend/girlfriend 8 11 6 16 6 16<br />
Family member 2 7 5 5 5 5<br />
Father/mother 0 2 1 2 1 2<br />
Step-father/mother 0 0 1 0 1 0<br />
Another relative 2 5 3 3 3 3<br />
Other known 47 58 34 41 35 42<br />
Date 2 7 5 11 5 11<br />
Friend 17 20 7 10 8 11<br />
Neighbour 2 6 2 2 2 2<br />
Acquaintance 12 15 11 15 11 15<br />
Someone known at work/school/college/university 16 14 11 5 12 6<br />
Person in a position of trust or authority 3 4 3 2 3 2<br />
Stranger 44 9 61 12 59 12<br />
75<br />
779 3,293 845<br />
66 2,982<br />
Unweighted base 311<br />
1. Percentages will sum to more than 100 due to victimisation from more than one offender.<br />
2. Base is small, therefore sampling error will be large.
Table 3.12 Influence of drink or drugs in incidents of less serious sexual assault in the last year<br />
Percentages <strong>2007</strong>/<strong>08</strong> BCS<br />
Less serious sexual assault<br />
Women All<br />
Offender under influence of drink 45 46<br />
Offender not under influence of drink 36 37<br />
Don't know/Can't remember/Don't want to answer 18 17<br />
Offender under influence of drugs 9 10<br />
Offender not under influence of dugs 60 60<br />
Don't know/Can't remember/Don't want to answer 31 30<br />
Victim under influence of drink 27 29<br />
Victim not under influence of drink 70 68<br />
Don't know/Can't remember/Don't want to answer 4 4<br />
Unweighted base 294 331<br />
1. Sample size for male victims is too low to provide robust estimates.<br />
2. If the victim had experienced more than one less serious sexual assault, question was asked of the most recent incident.<br />
Table 3.13 Influence of drink or drugs in incidents of serious sexual assault since the age of 16, by sex<br />
Percentages <strong>2007</strong>/<strong>08</strong> BCS<br />
Serious sexual assault<br />
Men Women All<br />
Offender under influence of drink 32 39 38<br />
Offender not under influence of drink 52 48 49<br />
Don't know/Can't remember/Don't want to answer 16 13 13<br />
Offender under influence of drugs 18 10 11<br />
Offender not under influence of dugs 64 73 72<br />
Don't know/Can't remember/Don't want to answer 18 17 17<br />
Victim under influence of drink 30 27 28<br />
Victim not under influence of drink 50 68 66<br />
Don't know/Can't remember/Don't want to answer 20 5 7<br />
Unweighted base 67 740 807<br />
1. If the victim had experienced more than one serious sexual assault, question was asked of the most recent incident.<br />
76
Table 3.14 Who the victim had told personally about the serious sexual assault since the age of 16, by sex<br />
Percentages <strong>2007</strong>/<strong>08</strong> BCS<br />
Men Women All<br />
Victim told someone 59 60 60<br />
Friends, relatives or neighbours 21 46 44<br />
Police 6 12 11<br />
Health professional (e.g. doctor or nurse) 11 8 8<br />
Counsellor/ therapist 1 10 9<br />
Someone at work 19 4 5<br />
Women's refuge/group/centre 2 3 3<br />
Legal professional 1 3 3<br />
Victim support 0 2 2<br />
Rape crisis helpline 3 3 3<br />
Housing department 0 0 0<br />
Benefit agency 0 0 0<br />
Social services 0 0 0<br />
National domestic violence helpline 0 0 0<br />
Any other helpline 1 1 1<br />
Someone else 0 2 2<br />
Victim told no one 41 40 40<br />
Unweighted base 64 775 839<br />
1. If the victim had experienced more than one serious sexual assault, question was asked of the most recent incident.<br />
77
Table 3.15 Percentage of adults aged from 16 to 59 victims of intimate violence by type in last year, by personal characteristics, by sex<br />
Percentages <strong>2007</strong>/<strong>08</strong> BCS<br />
Unweighted bases 1<br />
Any domestic abuse Partner abuse Family abuse Sexual assault<br />
(non-sexual)<br />
(non-sexual)<br />
Men Women Men Women Men Women Men Women Men Women<br />
Age group<br />
16-19 5.9 10.9 5.5 7.8 2.8 5.7 1.2 8.9 646 702<br />
20-24 7.7 6.8 6.4 5.4 1.7 2.2 0.5 5.8 829 997<br />
25-34 5.7 6.4 5.5 5.8 1.7 1.8 0.5 3.2 2,328 2,835<br />
35-44 4.1 6.6 3.8 5.4 0.9 2.0 0.2 1.9 3,161 3,593<br />
45-54 3.1 3.9 2.8 2.9 0.9 1.5 0.2 0.9 2,586 2,812<br />
55-59 1.3 2.1 0.9 2.0 0.6 0.8 0.0 0.9 1,216 1,370<br />
Ethnic group<br />
White 4.6 6.0 4.2 4.9 1.3 2.1 0.4 3.0 10,022 11,410<br />
Non-White 4.4 5.3 3.8 4.8 2.3 2.4 0.4 2.5 742 897<br />
Marital status<br />
Married 2.5 3.1 2.3 2.2 0.7 1.2 0.2 1.0 5,176 5,634<br />
Cohabiting 6.2 4.6 5.8 4.1 1.5 1.8 0.2 2.8 1,463 1,547<br />
Single 6.4 9.7 5.7 7.6 2.2 3.7 0.7 6.4 3,187 3,269<br />
Separated 9.7 18.0 8.4 18.8 1.7 2.7 0.2 4.2 262 488<br />
Divorced 7.3 11.0 7.0 9.5 1.1 3.0 0.6 2.4 615 1,169<br />
Widowed 2.1 3.7 2.1 3.1 0.0 0.4 0.0 0.5 63 197<br />
Respondent's employment status<br />
Employed 4.4 5.0 4.1 4.1 1.2 1.7 0.2 2.6 9,313 9,180<br />
Unemployed 4.1 9.0 6.2 7.3 0.5 5.1 0.6 4.8 299 250<br />
Inactive 5.5 8.4 4.0 6.8 2.7 3.2 1.2 4.1 1,138 2,856<br />
Student 2<br />
5.7 10.7 3.3 7.7 3.4 4.7 1.7 7.9 396 492<br />
Looking after family/home 3.8 8.2 3.7 7.3 1.3 2.5 1.3 2.3 65 1,506<br />
Long-term/temporarily sick/ill 6.7 9.9 6.4 8.0 2.6 4.5 1.0 4.2 381 472<br />
Retired 0.3 0.6 0.3 0.4 0.3 0.2 0.0 1.2 173 238<br />
Other inactive 8.2 5.4 6.4 3.2 2.2 2.6 0.9 3.2 123 148<br />
Respondent's occupation<br />
Managerial <strong>and</strong> professional occupations 3.9 4.4 3.5 3.6 0.7 1.3 0.2 2.5 4,507 4,579<br />
Intermediate occupations 3.9 5.2 3.6 4.1 1.2 1.8 0.2 2.4 1,889 2,723<br />
Routine <strong>and</strong> manual occupations 5.5 7.1 5.2 6.2 1.8 2.4 0.4 2.1 3,590 3,848<br />
Never worked <strong>and</strong> long-term unemployed 1.7 7.2 7.4 6.5 1.7 3.3 2.1 3.9 87 302<br />
Full-time students 2<br />
5.3 9.2 3.8 6.3 2.6 4.5 1.1 7.8 673 836<br />
Highest qualification<br />
Degree or diploma 4.1 4.7 3.6 3.9 0.9 1.5 0.4 2.9 4,332 4,640<br />
Apprenticeship or A/AS level 4.6 6.3 3.9 5.1 1.5 2.4 0.5 3.9 2,659 2,<strong>08</strong>7<br />
O level/GCSE 5.0 7.4 4.3 5.7 1.9 2.7 0.3 2.8 2,331 3,722<br />
Other 5.5 4.6 4.7 4.2 1.8 1.4 0.0 3.1 310 337<br />
No qualifications 5.0 6.2 6.1 5.6 1.6 2.5 0.4 2.0 1,125 1,515<br />
Long-st<strong>and</strong>ing illness or disability<br />
Long-st<strong>and</strong>ing illness or disability 5.2 8.4 4.5 6.3 1.7 3.7 0.5 3.5 1,754 2,101<br />
Limits activities 6.6 9.6 5.2 7.2 2.6 4.3 0.6 4.0 745 814<br />
Does not limit activities 3.6 6.6 3.7 4.9 0.5 2.9 0.2 2.9 1,0<strong>08</strong> 1,285<br />
No long-st<strong>and</strong>ing illness or disability 4.4 5.5 4.1 4.6 1.3 1.8 0.4 2.9 9,009 10,204<br />
Hours out of home on an average weekday<br />
Less than 3 hours 5.2 6.9 4.7 5.7 1.7 2.7 0.9 1.9 881 2,1<strong>08</strong><br />
3 hours less than 7 hours 4.0 6.3 4.0 5.4 2.2 2.0 0.8 2.8 1,385 3,893<br />
7 hours or longer 4.6 5.5 4.1 4.3 1.2 2.0 0.3 3.4 8,480 6,285<br />
Number of visits to pub/wine bar in the evening<br />
during last month<br />
None 3.6 5.4 3.4 4.6 1.4 2.3 0.3 1.8 3,165 4,891<br />
Less than once a week 4.7 5.9 4.2 4.6 1.3 2.0 0.3 2.4 3,513 4,446<br />
Once a week or more often 5.1 6.9 4.7 5.7 1.4 2.0 0.5 5.7 4,<strong>08</strong>8 2,971<br />
ALL ADULTS 4.5 6.0 4.1 4.9 1.4 2.1 0.4 3.0 10,766 12,309<br />
1. The bases given are correct for any domestic abuse. The bases for the other measures presented will be similar though not identical to these due to different rates of 'don't<br />
know' responses <strong>and</strong> refusals to the relevant questions.<br />
2. Bases for the student categories differ as they are based on different classifications. Economically inactive students exclude those who are in employment, or in other ways<br />
economically active, but full-time students are recognised as such within the occupational coding. For more information see the Glossary (NS-SEC <strong>and</strong> Employment status).<br />
3. See the Glossary for definitions of personal characteristics.<br />
78
Table 3.16 Percentage of adults aged from 16 to 59 victims of intimate violence by type in last year, by household <strong>and</strong> area characteristics, by sex<br />
Percentages <strong>2007</strong>/<strong>08</strong> BCS<br />
Unweighted bases<br />
Women Men Women Men Women Men Women<br />
1<br />
Any domestic abuse Partner abuse<br />
Family abuse Sexual assault<br />
(non-sexual)<br />
(non-sexual)<br />
Men Women Men<br />
Household type<br />
No children 4.6 4.8 4.2 3.9 1.4 1.7 0.4 3.4 6,826 6,631<br />
Adults <strong>and</strong> child(ren) 4.2 5.8 3.9 4.2 1.3 2.5 0.4 2.2 3,8<strong>08</strong> 4,150<br />
Single adult <strong>and</strong> child(ren) 15.7 17.7 14.6 17.6 6.1 3.2 1.3 4.4 132 1,528<br />
Household income<br />
Less than £10,000 7.5 13.2 6.8 12.3 2.6 3.8 0.7 4.5 640 1,347<br />
£10,000 less than £20,000 4.8 7.9 4.1 7.2 1.6 2.4 0.3 3.1 1,177 1,870<br />
£20,000 less than £30,000 5.3 6.0 4.9 4.2 1.7 2.6 0.4 3.1 1,737 2,001<br />
£30,000 less than £40,000 4.6 4.7 4.6 3.1 0.8 1.9 0.4 2.2 1,787 1,696<br />
£40,000 less than £50,000 4.1 2.9 3.5 2.7 1.3 0.7 0.3 2.1 1,389 1,266<br />
£50,000 or more 3.7 3.8 3.2 2.6 1.0 1.3 0.3 2.4 2,384 2,045<br />
Tenure<br />
Owner occupiers 3.7 4.4 3.3 3.2 1.1 1.6 0.2 1.9 7,723 8,531<br />
Social renters 6.3 10.7 6.4 10.0 2.4 3.6 1.2 4.1 1,093 1,845<br />
Private renters 6.6 8.7 5.9 7.5 1.7 3.2 0.5 6.4 1,920 1,914<br />
ACORN category<br />
Wealthy Achievers 3.4 4.2 2.9 3.1 1.0 1.3 0.4 2.0 2,948 3,357<br />
Urban Prosperity 4.8 5.2 4.1 4.6 1.3 1.5 0.4 5.3 1,078 986<br />
Comfortably Off 4.6 5.5 4.3 4.2 1.1 2.2 0.2 2.5 3,461 3,776<br />
Moderate Means 4.1 7.9 3.8 6.3 1.8 2.7 0.1 3.2 1,496 1,823<br />
Hard Pressed 6.3 8.2 6.0 7.3 2.2 3.0 0.7 3.7 1,749 2,339<br />
Area type<br />
Urban 4.7 6.2 4.3 5.1 1.5 2.2 0.4 3.2 8,172 9,295<br />
Rural 3.8 5.1 3.4 4.0 0.9 1.9 0.3 2.2 2,594 3,014<br />
Level of physical disorder (interviewer-rated)<br />
Not high 4.4 5.8 4.0 4.7 1.3 2.0 0.3 2.9 9,598 10,936<br />
High 7.2 10.1 6.9 8.1 1.8 4.1 1.0 4.2 567 704<br />
Region <strong>and</strong> Wales<br />
North East 5.2 6.6 3.9 5.8 2.5 2.3 0.8 4.8 756 860<br />
North West 3.9 6.1 3.5 4.8 1.3 1.9 0.4 2.1 1,170 1,369<br />
Yorkshire <strong>and</strong> the Humber 4.3 6.1 4.2 5.0 0.8 2.8 0.2 4.0 965 1,121<br />
East Midl<strong>and</strong>s 6.4 6.3 5.8 5.8 1.5 2.3 0.4 2.9 1,272 1,313<br />
West Midl<strong>and</strong>s 6.1 6.7 5.4 4.9 1.7 2.7 0.4 2.8 1,049 1,231<br />
East of Engl<strong>and</strong> 4.3 5.1 4.0 4.0 1.3 2.1 0.6 1.6 1,527 1,733<br />
London 3.9 4.7 3.9 4.8 1.3 1.6 0.2 4.2 851 959<br />
South East 3.9 6.5 4.0 4.6 1.3 2.4 0.6 3.3 1,166 1,368<br />
South West 4.2 6.6 3.6 5.1 1.3 1.4 0.2 2.2 1,191 1,343<br />
Wales 4.2 5.4 3.1 4.7 1.4 2.0 0.2 2.1 819 1,012<br />
ALL ADULTS 4.5 6.0 4.1 4.9 1.4 2.1 0.4 3.0 10,766 12,309<br />
1. The bases given are correct for any domestic abuse. The bases for the other measures presented will be similar though not identical to these due to different rates of 'don't know'<br />
responses <strong>and</strong> refusals to the relevant questions.<br />
2. See the Glossary for definitions of household <strong>and</strong> area characteristics.<br />
79
Table 3.17 Logistic regression 1 model for experience of any domestic abuse in the last year among men<br />
Characteristic Significance Odds ratio 2<br />
<strong>2007</strong>/<strong>08</strong> BCS<br />
Confidence interval<br />
Upper Lower<br />
Marital status Married 1.00<br />
Cohabiting ** 2.28 1.66 3.13<br />
Single ** 2.10 1.50 2.92<br />
Separated ** 3.81 2.03 7.14<br />
Divorced ** 3.04 1.78 5.21<br />
Widowed ns 0.81 0.05 12.58<br />
Age 16 to 24 ** 2.01 1.37 2.97<br />
24 to 44 ** 1.72 1.28 2.33<br />
45 to 59 1.00<br />
Illness/disability No disability 1.00<br />
Non-limiting disability ns 0.96 0.62 1.49<br />
Limiting disability ** 1.70 1.22 2.36<br />
Household type No children 1.00<br />
Adults <strong>and</strong> child(ren) ns 1.16 0.91 1.48<br />
Single adult <strong>and</strong> child(ren) ** 2.58 1.12 5.95<br />
ACORN category Wealthy Achievers 1.00<br />
Urban Prosperity ns 1.14 0.80 1.63<br />
Comfortably Off ns 1.27 0.96 1.70<br />
Moderate Means ns 0.95 0.66 1.38<br />
Hard Pressed ** 1.50 1.10 2.05<br />
Unweighted base 10,674<br />
Nagelkerke R square 3<br />
0.05<br />
1. Forward stepwise logistic regression.<br />
2. Odds ratios of greater than one indicate relatively higher odds compared with the reference category in that variable, when holding all factors constant; less than one<br />
indicates relatively lower odds.<br />
3. This model explains around five per cent of the variation in experience of any domestic abuse in the last year based only on the factors shown in the table. Additional<br />
variables which were included in the analysis but which were not shown in the model to be significantly associated with experience of any domestic abuse in the last year<br />
are: ethnic group, respondent's employment status, highest qualification, number of visits to pub/wine bar in the evening during the last month, tenure <strong>and</strong> area type.<br />
4. Factors highlighted in bold are those that are considered strong predictors (contributing at least one per cent improvement in the model <strong>and</strong> accounting for three per<br />
cent of the variance). Categories highlighted in italics were used as reference categories.<br />
'**' Indicates that change is statistically significant at the five per cent level; 'ns' indicates that the change is not statistically significant at this level.<br />
80
Table 3.18 Logistic regression 1 model for experience of any domestic abuse in the last year among women<br />
Characteristic Significance Odds ratio 2<br />
<strong>2007</strong>/<strong>08</strong> BCS<br />
Confidence interval<br />
Upper Lower<br />
Marital status Married 1.00<br />
Cohabiting ns 1.29 0.93 1.80<br />
Single ** 2.58 1.92 3.46<br />
Separated ** 5.23 3.42 7.99<br />
Divorced ** 3.05 2.13 4.38<br />
Widowed ns 1.29 0.43 3.93<br />
Household type No children 1.00<br />
Adults <strong>and</strong> child(ren) ** 1.45 1.17 1.80<br />
Single adult <strong>and</strong> child(ren) ** 1.96 1.46 2.64<br />
Illness/disability No disability 1.00<br />
Non-limiting disability ns 1.36 0.95 1.95<br />
Limiting disability ** 1.93 1.48 2.51<br />
Age 16 to 24 ** 1.67 1.18 2.36<br />
24 to 44 ** 1.61 1.23 2.12<br />
45 to 59 1.00<br />
Tenure Owner occupiers 1.00<br />
Social renters ns 1.39 1.06 1.83<br />
Private renters ** 1.41 1.12 1.78<br />
Ethnic group White 1.00<br />
Non-White ** 0.72 0.53 0.98<br />
ACORN category Wealthy Achievers 1.00<br />
Urban Prosperity ns 0.89 0.61 1.28<br />
Comfortably Off ns 1.14 0.88 1.49<br />
Moderate Means ** 1.43 1.07 1.91<br />
Hard Pressed ns 1.17 0.86 1.59<br />
Unweighted base 12,218<br />
Nagelkerke R square 3<br />
0.09<br />
1. Forward stepwise logistic regression.<br />
2. Odds ratios of greater than one indicate relatively higher odds compared with the reference category in that variable, when holding all factors constant; less than one indicates<br />
relatively lower odds.<br />
3. This model explains around nine per cent of the variation in experience of any domestic abuse in the last year based only on the factors shown in the table. Additional variables<br />
which were included in the analysis but which were not shown in the model to be significantly associated with experience of any domestic abuse in the last year are: respondent's<br />
employment status, highest qualification, number of visits to pub/wine bar in the evening during the last month <strong>and</strong> area type.<br />
4. Factors highlighted in bold are those that are considered strong predictors (contributing at least one per cent improvement in the model <strong>and</strong> accounting for seven per cent of the<br />
variance). Categories highlighted in italics were used as reference categories.<br />
'**' Indicates that change is statistically significant at the five per cent level; 'ns' indicates that the change is not statistically significant at this level.<br />
81
Table 3.19 Logistic regression 1 model for experience of partner abuse (non-sexual) in the last year among men<br />
Characteristic Significance Odds ratio 2<br />
<strong>2007</strong>/<strong>08</strong> BCS<br />
Confidence interval<br />
Upper Lower<br />
Marital status Married 1.00<br />
Cohabiting ** 2.33 1.69 3.22<br />
Single ** 2.18 1.55 3.07<br />
Separated ** 3.50 1.81 6.77<br />
Divorced ** 3.42 2.00 5.86<br />
Widowed ns 0.94 0.06 14.65<br />
Age 16 to 24 ** 1.98 1.33 2.96<br />
24 to 44 ** 1.85 1.36 2.53<br />
45 to 59 1.00<br />
Highest Qualification Degree or diploma 1.00<br />
Apprenticeship or A/AS level ns 0.93 0.70 1.23<br />
O level/GCSE ns 0.94 0.70 1.26<br />
Other ns 1.21 0.66 2.23<br />
No qualifications ** 1.57 1.12 2.19<br />
ACORN category Wealthy Achievers 1.00<br />
Urban Prosperity ns 1.10 0.75 1.60<br />
Comfortably Off ** 1.36 1.01 1.85<br />
Moderate Means ns 1.04 0.71 1.52<br />
Hard Pressed ** 1.60 1.15 2.22<br />
Household type No children 1.00<br />
Adults <strong>and</strong> child(ren) ns 1.17 0.91 1.50<br />
Single adult <strong>and</strong> child(ren) ** 2.48 1.07 5.75<br />
Unweighted base 11,011<br />
Nagelkerke R square 3<br />
0.05<br />
1. Forward stepwise logistic regression.<br />
2. Odds ratios of greater than one indicate relatively higher odds compared with the reference category in that variable, when holding all factors constant; less than one indicates<br />
relatively lower odds.<br />
3. This model explains around five per cent of the variation in experience of (non-sexual) partner abuse in the last year based only on the factors shown in the table. Additional<br />
variables which were included in the analysis but which were not shown in the model to be significantly associated with experience of (non-sexual) partner abuse in the last year<br />
are: ethnic group, respondent's employment status, long-st<strong>and</strong>ing illness or disability, number of visits to pub/wine bar in the evening during the last month, tenure <strong>and</strong> area type.<br />
4. Factors highlighted in bold are those that are considered strong predictors (contributing at least one per cent improvement in the model <strong>and</strong> accounting for three per cent of the<br />
variance). Categories highlighted in italics were used as reference categories.<br />
'**' Indicates that change is statistically significant at the five per cent level; 'ns' indicates that the change is not statistically significant at this level.<br />
82
Table 3.20 Logistic regression 1 model for experience of partner abuse (non-sexual) in the last year among women<br />
Characteristic Significance Odds ratio 2<br />
BCS <strong>2007</strong>/<strong>08</strong><br />
Confidence interval<br />
Upper Lower<br />
Household type No children 1.00<br />
Adults <strong>and</strong> child(ren) ** 1.28 1.01 1.63<br />
Single adult <strong>and</strong> child(ren) ** 2.36 1.75 3.18<br />
Marital status Married 1.00<br />
Cohabiting ** 1.59 1.12 2.26<br />
Single ** 2.37 1.72 3.27<br />
Separated ** 6.16 4.03 9.42<br />
Divorced ** 3.15 2.14 4.62<br />
Widowed ns 1.35 0.42 4.39<br />
Tenure Owner occupiers 1.00<br />
Social renters ** 1.81 1.41 2.33<br />
Private renters ** 1.63 1.28 2.07<br />
Illness/disability No disability 1.00<br />
Non-limiting disability ns 1.22 0.81 1.82<br />
Limiting disability ** 1.67 1.25 2.23<br />
Age 16 to 24 ** 1.61 1.11 2.34<br />
24 to 44 ** 1.62 1.20 2.17<br />
45 to 59 1.00<br />
Unweighted base 12,891<br />
Nagelkerke R square 3<br />
0.10<br />
1. Forward stepwise logistic regression.<br />
2. Odds ratios of greater than one indicate relatively higher odds compared with the reference category in that variable, when holding all factors constant; less than one indicates<br />
relatively lower odds.<br />
3. This model explains around ten per cent of the variation in experience of (non-sexual) partner abuse in the last year based only on the factors shown in the table. Additional<br />
variables which were included in the analysis but which were not shown in the model to be significantly associated with experience of (non-sexual) partner abuse in the last year<br />
are: ethnic group, respondent's employment status, highest qualification, number of visits to pub/wine bar in the evening during the last month, ACORN category <strong>and</strong> area type.<br />
4. Factors highlighted in bold are those that are considered strong predictors (contributing at least one per cent improvement in the model <strong>and</strong> accounting for ten per cent of the<br />
variance). Categories highlighted in italics were used as reference categories.<br />
'**' Indicates that change is statistically significant at the five per cent level; 'ns' indicates that the change is not statistically significant at this level.<br />
83
Table 3.21 Logistic regression 1 model for experience of family abuse (non-sexual) in the last year among men<br />
Characteristic Significance Odds ratio<br />
BCS <strong>2007</strong>/<strong>08</strong><br />
2<br />
Confidence interval<br />
Upper Lower<br />
Marital status Married 1.00<br />
Cohabiting ** 2.19 1.23 3.88<br />
Single ** 3.03 1.93 4.75<br />
Separated ns 1.76 0.45 6.90<br />
Divorced ns 1.12 0.31 4.02<br />
Illness/disability No disability 1.00<br />
Non-limiting disability ns 0.48 0.17 1.40<br />
Limiting disability ** 2.10 1.27 3.50<br />
Ethnic group White 1.00<br />
Non-White ** 1.84 1.14 2.97<br />
Household type No children 1.00<br />
Adults <strong>and</strong> child(ren) ns 1.22 0.81 1.85<br />
Single adult <strong>and</strong> child(ren) ** 5.39 1.50 19.39<br />
Unweighted base 10,901<br />
Nagelkerke R square 3<br />
0.04<br />
1. Forward stepwise logistic regression.<br />
2. Odds ratios of greater than one indicate relatively higher odds compared with the reference category in that variable, when holding all factors constant; less than one indicates<br />
relatively lower odds.<br />
3. This model explains around four per cent of the variation in experience of (non-sexual) family abuse in the last year based only on the factors shown in the table. Additional<br />
variables which were included in the analysis but which were not shown in the model to be significantly associated with experience of (non-sexual) family abuse in the last year are:<br />
age group, respondent's employment status, highest qualification, number of visits to pub/wine bar in the evening during the last month, tenure, ACORN category <strong>and</strong> area type.<br />
4. Factors highlighted in bold are those that are considered strong predictors (contributing at least one per cent improvement in the model <strong>and</strong> accounting for two per cent of the<br />
variance). Categories highlighted in italics were used as reference categories.<br />
'**' Indicates that change is statistically significant at the five per cent level; 'ns' indicates that the change is not statistically significant at this level.<br />
84
Table 3.22 Logistic regression 1 model for experience of family abuse (non-sexual) in the last year among women<br />
Characteristic Significance Odds ratio<br />
BCS <strong>2007</strong>/<strong>08</strong><br />
2<br />
Confidence interval<br />
Upper Lower<br />
Marital status Married 1.00<br />
Cohabiting ** 1.73 1.06 2.82<br />
Single ** 3.75 2.64 5.31<br />
Separated ** 2.69 1.15 6.32<br />
Divorced ** 2.81 1.57 5.01<br />
Widowed ns 0.34 0.01 8.99<br />
Illness/disability No disability 1.00<br />
Non-limiting disability ** 1.86 1.11 3.12<br />
Limiting disability ** 2.48 1.70 3.61<br />
Household type No children 1.00<br />
Adults <strong>and</strong> child(ren) ** 1.97 1.45 2.67<br />
Single adult <strong>and</strong> child(ren) ns 1.13 0.68 1.88<br />
Respondent's employment status Employed 1.00<br />
Unemployed ** 2.12 1.<strong>08</strong> 4.13<br />
Inactive ** 1.40 1.03 1.91<br />
Unweighted base 12,757<br />
Nagelkerke R square 3<br />
0.06<br />
1. Forward stepwise logistic regression.<br />
2. Odds ratios of greater than one indicate relatively higher odds compared with the reference category in that variable, when holding all factors constant; less than one<br />
indicates relatively lower odds.<br />
3. This model explains around 6% of the variation in experience of (non-sexual) family abuse in the last year based only on the factors shown in the table. Additional<br />
variables which were included in the analysis but which were not shown in the model to be significantly associated with experience of (non-sexual) family abuse in the last<br />
year are: age group, ethnic group, highest qualification, number of visits to pub/wine bar in the evening during the last month, tenure, ACORN category <strong>and</strong> area type.<br />
4. Factors highlighted in bold are those that are considered strong predictors (contributing at least one per cent improvement in the model <strong>and</strong> accounting for six per cent<br />
of the variance). Categories highlighted in italics were used as reference categories.<br />
'**' Indicates that change is statistically significant at the five per cent level; 'ns' indicates that the change is not statistically significant at this level.<br />
85
Table 3.23 Logistic regression 1 model for experience of any sexual assault in the last year among women<br />
Characteristic Significance Odds ratio<br />
<strong>2007</strong>/<strong>08</strong> BCS<br />
2<br />
Confidence interval<br />
Upper Lower<br />
Age 16 to 24 ** 3.74 2.23 6.27<br />
24 to 44 ** 2.24 1.42 3.52<br />
45 to 59 1.00<br />
Marital status Married 1.00<br />
Cohabiting ns 1.57 0.99 2.49<br />
Single ** 2.50 1.67 3.74<br />
Separated ** 3.33 1.65 6.73<br />
Divorced ** 2.12 1.13 3.98<br />
Widowed ns 0.56 0.03 10.84<br />
Number of visits to pub/wine bar in the evening None 1.00<br />
during last month Less than once a week ns 1.31 0.95 1.82<br />
Once a week or more often ** 2.38 1.75 3.24<br />
Tenure Owner occupiers 1.00<br />
Social renters ** 1.62 1.14 2.30<br />
Private renters ** 1.88 1.42 2.49<br />
Illness/disability No disability 1.00<br />
Non-limiting disability ns 1.30 0.77 2.18<br />
Limiting disability ** 2.00 1.37 2.93<br />
Unweighted base 12,607<br />
Nagelkerke R square 3<br />
0.12<br />
1. Forward stepwise logistic regression.<br />
2. Odds ratios of greater than one indicate relatively higher odds compared with the reference category in that variable, when holding all factors constant; less than<br />
one indicates relatively lower odds.<br />
3. This model explains around twelve per cent of the variation in experience of (non-sexual) family abuse in the last year based only on the factors shown in the<br />
table. Additional variables which were included in the analysis but which were not shown in the model to be significantly associated with experience of (non-sexual)<br />
family abuse in the last year are: ethnic group, household structure, respondent's employment status, highest qualification, ACORN category <strong>and</strong> area type.<br />
4. Factors highlighted in bold are those that are considered strong predictors (contributing at least one per cent improvement in the model <strong>and</strong> accounting for eleven<br />
per cent of the variance). Categories highlighted in italics were used as reference categories.<br />
'**' Indicates that change is statistically significant at the five per cent level; 'ns' indicates that the change is not statistically significant at this level.<br />
86
Appendix 1 Glossary<br />
<strong>2007</strong>/<strong>08</strong> Interview sample – This is the sample on which latest BCS results are based.<br />
It consists of all respondents interviewed by the BCS during the <strong>2007</strong>/<strong>08</strong> financial year.<br />
ACORN – ‘A Classification of Residential Neighbourhoods’, developed by CACI Ltd., which<br />
classifies households into one of 56 ACORN types according to demographic, employment<br />
<strong>and</strong> housing characteristics of the surrounding neighbourhood. ACORN is useful in<br />
determining the social environment in which households are located. The 2001 ACORN<br />
classification has been used in this report. The main five-group breakdowns have been used<br />
in this report <strong>and</strong> are characterised as follows:<br />
- Wealthy Achievers – wealthy executives, affluent older people <strong>and</strong> well-off families.<br />
- Urban Prosperity – prosperous professionals, young urban professionals <strong>and</strong> students<br />
living in town <strong>and</strong> city areas.<br />
- Comfortably Off – young couples, secure families, older couples living in the suburbs<br />
<strong>and</strong> pensioners.<br />
- Moderate Means – Asian communities, post-industrial families <strong>and</strong> skilled manual<br />
workers.<br />
- Hard Pressed – low-income families, residents in council areas, people living in highrise,<br />
<strong>and</strong> inner-city estates.<br />
Further information about ACORN is available from CACI Ltd., CACI House, Kensington<br />
Village, Avonmore Road, London W14 8TS (http://www.caci.co.uk/acorn/).<br />
BB gun – An imitation firearm that discharges plastic pellets typically by way of a spring<br />
action or compressed air.<br />
Burglary – An offence of burglary is recorded by the police if a person enters any building<br />
as a trespasser <strong>and</strong> with intent to commit an offence of theft, grievous bodily harm or unlawful<br />
damage.<br />
Calibration weighting – The weighting is designed to make adjustments for known<br />
differentials in response rates between different age by sex subgroups <strong>and</strong> households with<br />
different age <strong>and</strong> sex composition. For example, a household containing a 24-year-old male<br />
living alone may be less likely to respond to the survey than a household containing a 24year-old<br />
male living with a young partner <strong>and</strong> a child. The procedure therefore gives different<br />
weights to different household types based on their age/sex composition in such a way that<br />
the weighted distribution of individuals in the responding households matches the known<br />
distribution in the population as a whole. The weights are generated using an algorithm that<br />
minimises the differences between the weights implied by sampling <strong>and</strong> the final weights<br />
subject to the weighted data meeting the population controls. They are based on calibrating<br />
on population figures provided by the Labour Force Survey (LFS) from ONS.<br />
Charge/summons – An offence is deemed to be detected if a person has been charged<br />
or summonsed for the crime (irrespective of any subsequent acquittal at Court).<br />
Computer Assisted Personal Interview (CAPI) – BCS interviewers record<br />
responses to the questionnaire on laptop computers (CAPI). The questionnaire is a computer<br />
program that specifies the questions, range <strong>and</strong> structure of permissible answers <strong>and</strong><br />
instructions for navigating through the questionnaire. Plausibility <strong>and</strong> consistency checks are<br />
incorporated to improve data quality. The self-completion modules on the BCS are conducted<br />
using Computer Assisted Self-Interviewing (CASI) where the interviewer gives the laptop to<br />
the respondent. CASI allows respondents to report behaviours or attitudes to more sensitive<br />
87
<strong>Homicides</strong>, <strong>Firearm</strong> <strong>Offences</strong> <strong>and</strong> <strong>Intimate</strong> <strong>Violence</strong> <strong>2007</strong>/<strong>08</strong><br />
questions in private. The mode of interview changed in the 1994 BCS from a paper-based<br />
questionnaire to CAPI.<br />
Confidence interval – The range of values between which the population parameter is<br />
estimated to lie (also referred to as margin of error). Surveys produce statistics that are<br />
estimates of the real figure for the population under study. These estimates are always<br />
surrounded by a margin of error of plus or minus a given range. At the 95 per cent confidence<br />
level, over many repeats of a survey under the same conditions, one would expect that these<br />
confidence intervals would contain the true population value in 95 times out of 100. When<br />
assessing the results of a single survey it is assumed that there is a one in 20 chance that the<br />
true population value will fall outside the 95 per cent confidence interval calculated for the<br />
survey estimate.<br />
Confidence intervals can also be constructed for changes in estimates between years of the<br />
BCS <strong>and</strong> for differences between population subgroups. If a difference is outside a range set<br />
by a 95 per cent confidence interval then one judges the difference to be ‘statistically<br />
significant at the five per cent level’. In this publication a five per cent significance level has<br />
been applied. See also the definition of statistical significance.<br />
Counting rules – Instructions issued to the police by the Home Office on how the police<br />
should count <strong>and</strong> classify crime. Recorded crime figures in this publication are based on the<br />
counting rules that came into force on 1 April 1998. These rules were updated following the<br />
introduction on 1 April 2002 of the Association of Chief Police Officers (ACPO) National<br />
Crime Recording St<strong>and</strong>ard devised by ACPO in collaboration with Home Office statisticians.<br />
A copy of the latest counting rules is available on the Home Office website at<br />
www.homeoffice.gov.uk/rds/countrules.html.<br />
Criminal damage – Criminal damage results from any person who without lawful excuse<br />
destroys or damages any property belonging to another, intending to destroy or damage any<br />
such property or being reckless as to whether any such property would be destroyed or<br />
damaged. Separate recorded crime figures exist for criminal damage to a dwelling, to a<br />
building other than a dwelling, to a vehicle <strong>and</strong> other criminal damage. Combined figures are<br />
also published for racially or religiously aggravated criminal damage. In the BCS, criminal<br />
damage is referred to as v<strong>and</strong>alism; that is any intentional damage done to property<br />
belonging to the respondent, or to their home or vehicle. As in the case of burglary, the BCS<br />
only includes v<strong>and</strong>alism relating to households.<br />
Ethnic group – Respondents are asked to make a choice from a card to identify their<br />
ethnic background using the st<strong>and</strong>ard 2001 Census classification. Due to small sample sizes,<br />
it is necessary to collapse this classification into either a five-fold classification, i.e. White,<br />
Black, Asian, Mixed <strong>and</strong> Chinese or Other or to a simpler two-fold White <strong>and</strong> Non-White<br />
classification, based on the National Statistics harmonised classification.<br />
Employment status – The BCS uses the following categories for employment status<br />
which are based on the National Statistics harmonised classification but include further<br />
breakdowns for those in the ‘Economically inactive’ category.<br />
- In employment – includes people doing paid work in the last week; working on a<br />
government-supported training scheme; or doing unpaid work for own/family business.<br />
- Unemployed – actively seeking work, or waiting to take up work.<br />
- Economically inactive – those who are retired; going to school or college full-time;<br />
looking after home/family; are temporarily or permanently sick; or doing something<br />
else.<br />
Base sizes for the student categories differ in the economic categories from those in the<br />
occupational classification (see NS-SEC) as economically inactive students exclude those<br />
who are in employment, or in other ways economically active, but full-time students are<br />
recognised as such within the occupational coding of NS-SEC.<br />
88
Glossary<br />
Government Office Region (GOR) – Government Offices for the Regions were<br />
established across Engl<strong>and</strong> in 1994. The Government Office Regions are the primary<br />
classification for the presentation of regional statistics. There are nine GORs in Engl<strong>and</strong>:<br />
North East; North West; Yorkshire <strong>and</strong> the Humber; East Midl<strong>and</strong>s; West Midl<strong>and</strong>s; East of<br />
Engl<strong>and</strong>; London; South East; South West. In this report analysis by region also includes<br />
separate analysis for Wales.<br />
Harmonised classifications – National Statistics have developed a set of st<strong>and</strong>ard<br />
classifications that allow greater comparability of different surveys <strong>and</strong> other data collection<br />
systems. A number of these classifications have been adopted by the BCS. For more<br />
information on the harmonised classifications see:<br />
http://www.statistics.gov.uk/about/data/harmonisation/default.asp.<br />
Homicide – Comprises the recorded crimes of murder, manslaughter <strong>and</strong> infanticide. The<br />
published police recorded figures do not separately identify between these categories since at<br />
the time an offence is recorded by the police the circumstances surrounding the offence may<br />
not necessarily be known. Whether an offence is murder or manslaughter may be decided<br />
once an offender has been apprehended <strong>and</strong> appeared in court. The Homicide Index<br />
collection can make this distinction, as it covers suspect <strong>and</strong> court outcome data as well as<br />
recorded crime data. The BCS, by its nature (i.e. being reliant on victim interviews), cannot<br />
include homicide.<br />
Household reference person (HRP) – For some topics it is necessary to select one<br />
person in the household to indicate the characteristics of the household more generally.<br />
Following the National Statistics’ harmonised classifications, the BCS replaced head of<br />
household with household reference person (HRP) in 2001/02. The HRP is the member of the<br />
household in whose name the accommodation is owned or rented, or is otherwise responsible<br />
for the accommodation. Where this responsibility is joint within the household, the HRP is the<br />
person with the highest income. If incomes are equal, then the oldest person is the HRP.<br />
Household structure – The classification of households in the BCS is on the basis of<br />
number of adults <strong>and</strong> number of children. Households are divided into the following<br />
categories:<br />
- one adult, <strong>and</strong> one or more children (aged under 16). Note this does not necessarily<br />
denote a lone parent family, as the adult may be a sibling or gr<strong>and</strong>parent of the child;<br />
- more than one adult with one or more children (under 16);<br />
- one or more adults with no children (under 16).<br />
Imitation Weapons – Weapons designed to look like a real gun, but not capable of firing<br />
bulleted ammunition. Some fire other ammunition instead (e.g. BB guns can fire plastic<br />
pellets). This category also includes deactivated firearms <strong>and</strong> blank firers.<br />
Living arrangements – The BCS uses the following definitions for living arrangements,<br />
based on the National Statistics harmonised classification:<br />
- persons living in a couple: married, cohabiting (includes same-sex couples);<br />
- persons not living in a couple: single, separated, divorced or widowed.<br />
Logistic regression – A multivariate statistical technique that predicts the outcome of a<br />
dependent variable (e.g. risk of crime), which has only two possible outcomes, from a set of<br />
independent variables. Multivariate techniques allow the assessment of which of the<br />
independent variables are statistically related to the dependent variable when the influence of<br />
all other variables under consideration is taken into account. Both continuous <strong>and</strong> categorical<br />
variables can be used to predict the dependent variable. The logistic regression method used<br />
in this report was the forward stepwise selection.<br />
89
<strong>Homicides</strong>, <strong>Firearm</strong> <strong>Offences</strong> <strong>and</strong> <strong>Intimate</strong> <strong>Violence</strong> <strong>2007</strong>/<strong>08</strong><br />
National Crime Recording St<strong>and</strong>ard (NCRS) – Instigated by the Association of<br />
Chief Police Officers (ACPO), with the collaboration of Home Office statisticians, it aims to<br />
promote greater consistency between police forces in the recording of crime <strong>and</strong> to take a<br />
more victim-orientated approach to crime recording. Under the NCRS, where a member of the<br />
public reports a crime the police must record it providing “there is no credible evidence to the<br />
contrary”. Although some forces adopted the St<strong>and</strong>ard early, it was officially introduced<br />
across Engl<strong>and</strong> <strong>and</strong> Wales on 1 April 2002, though audits indicated that in some forces it took<br />
two to three years to be implemented. Counting rules are available on the Home Office<br />
website, see: http://www.homeoffice.gov.uk/rds/countrules.html.<br />
No Crime – A crime that has already been recorded by the police can subsequently be ‘no<br />
crimed’ if new information comes to light, before a suspect is charged, that shows that a crime<br />
did not occur. Further details, <strong>and</strong> several other circumstances that allow for ‘no criming’,<br />
appear in the Home Office counting rules.<br />
NS-SEC – The National Statistics Socio-economic Classification (NS-SEC) is an<br />
occupationally based classification, but provides coverage of the whole adult population. The<br />
NS-SEC aims to differentiate positions within labour markets <strong>and</strong> production units in terms of<br />
their typical 'employment relations'.<br />
More information about NS-SEC can be found on the National Statistics website, see:<br />
http://www.statistics.gov.uk/methods_quality/ns_sec/default.asp.<br />
BCS analysis is based on the three analytic classes provided within NS-SEC<br />
(http://www.statistics.gov.uk/methods_quality/ns_sec/downloads/NS-SEC_User.pdf) but also<br />
describes full-time students in a separate category (usually included within the ‘Not classified’<br />
category). Base sizes for the student categories differ in NS-SEC from those in the economic<br />
classification (see Employment status) as economically inactive students exclude those who<br />
are in employment, or in other ways economically active, but full-time students are recognised<br />
as such within the occupational coding of NS-SEC.<br />
Physical disorder – This term is used to describe a measure based on the interviewer’s<br />
assessment of the level of (a) v<strong>and</strong>alism, graffiti <strong>and</strong> deliberate damage to property, (b)<br />
rubbish <strong>and</strong> litter, <strong>and</strong> (c) homes in poor condition in the area. Using guidance, the interviewer<br />
has to make an assessment as to whether each of these problems is very common, fairly<br />
common, not very common or not at all common. For each, very <strong>and</strong> fairly common is scored<br />
as 1 <strong>and</strong> not very <strong>and</strong> not at all as 0. A scale is then constructed by summing the scores for<br />
each case. The scale ranges from 0 to 3, with high disorder areas being those with a score of<br />
2 or 3.<br />
Population figures – The BCS uses population figures in the calibration weighting.<br />
Following the 2001 Census, the Office for National Statistics (ONS) issued revised estimates<br />
of population involving the total numbers of people <strong>and</strong> the distribution by age <strong>and</strong> sex.<br />
Calibration weighting for the <strong>2007</strong>/<strong>08</strong> BCS <strong>and</strong> previous years has been calculated using<br />
population distributions, which have not fully incorporated the census revisions.<br />
Postcode Address File (PAF) – The small users’ Postcode Address File has been<br />
used as the sampling frame for the BCS since 1992. It is a listing of all postal delivery points<br />
in the country, with almost all households having one delivery point or letterbox. BCS<br />
sampling methods take account of the fact that a delivery point may correspond to more than<br />
one household such as a house with one front door converted into flats.<br />
Prevalence rates – Prevalence rates show the percentage of the BCS sample who were<br />
victims of an offence once or more during the year. Prevalence rates only take account of<br />
whether a household or person was a victim of a specific crime once or more in the reference<br />
period, but not the number of times victimised. Prevalence rates are taken as equivalent to<br />
risk of crime.<br />
90
Glossary<br />
Pub visits – Respondents are asked, “In the last month, how many times did you visit a<br />
pub or bar in the evening?” (for more details see the BCS questionnaire: http://www.dataarchive.ac.uk/findingData/bcrsTitles.asp).<br />
Responses are combined to provide the categories<br />
used to analyse the relationship between intimate violence <strong>and</strong> frequency of pub visits (see<br />
Chapter 3).<br />
Robbery – An incident or offence in which force or the threat of force is used either during<br />
or immediately prior to a theft or attempted theft. Recorded crime offences distinguish<br />
between robbery of personal property <strong>and</strong> business property. Robbery of business property is<br />
a recorded crime classification where goods stolen belong to a business or other corporate<br />
body (such as a bank or a shop), regardless of the location of the robbery<br />
Rural areas – The National Statistics rural <strong>and</strong> urban area classification 2004 has been<br />
used in this report. Rural areas are those classified as ‘small town <strong>and</strong> fringe – sparse’,<br />
‘village – sparse’, ‘hamlet <strong>and</strong> isolated dwelling – sparse’, ‘small town <strong>and</strong> fringe – less<br />
sparse’, ‘village – less sparse’ <strong>and</strong> ‘hamlet <strong>and</strong> isolated dwellings – less sparse’.<br />
More information is available on the National Statistics website, see:<br />
http://www.statistics.gov.uk/geography/nrudp.asp<br />
Sampling error – A sample, as used in the BCS, is a small-scale representation of the<br />
population from which it is drawn. As such, the sample may produce estimates that differ from<br />
the figures that would have been obtained if the whole population had been interviewed. The<br />
size of the error depends on the sample size, the size <strong>and</strong> variability of the estimate, <strong>and</strong> the<br />
design of the survey. It can be computed <strong>and</strong> used to construct confidence intervals.<br />
Sampling error is also taken into account in tests of statistical significance.<br />
Sample size – In the <strong>2007</strong>/<strong>08</strong> BCS the overall achieved core sample size was 46,983 <strong>and</strong><br />
the response rate was 76 per cent. The survey was designed to achieve a minimum of around<br />
1,000 core sample interviews in each police force area (PFA). For more information on BCS<br />
methodology see Bolling et al., (20<strong>08</strong>).<br />
Sexual offences – Prior to May 2004 there were 15 separate offences included in the<br />
recorded crime sexual offences group including the offences of rape <strong>and</strong> indecent assault.<br />
The Sexual <strong>Offences</strong> Act 2003, which came into force in May 2004, introduced several new<br />
offences <strong>and</strong> repealed some of those which were previously in the series. Full details are<br />
provided in Appendix 2 (Kershaw et al, 20<strong>08</strong>).<br />
Statistical significance – Because the BCS estimates are subject to sampling error,<br />
differences between estimates from successive years of the survey or between population<br />
subgroups may occur by chance. Tests of statistical significance are used to identify which<br />
differences are unlikely to have occurred by chance. In this publication tests at the five per<br />
cent significance level have been applied (the level at which there is a one in 20 chance of an<br />
observed difference being solely due to chance).<br />
Stratification – One of the BCS requirements is a design that achieves a minimum of<br />
around 1,000 core sample interviews per police force area (PFA). The survey was designed<br />
to over-sample in the smaller PFAs to achieve the minimum number of interviews. One result<br />
of this is that the data have to be weighted to remove the effect of differences in the<br />
probability of selection of addresses within different PFAs. As well as stratifying<br />
disproportionately by PFA, the sample was stratified by other socio-demographic variables in<br />
order to maximise the precision of estimates. The stratifiers used in <strong>2007</strong>/<strong>08</strong> were the same<br />
as in previous surveys, namely population density <strong>and</strong> the proportion of household reference<br />
Tenure – The following definition of tenure is used by the BCS based on the National<br />
Statistics harmonised classification:<br />
91
<strong>Homicides</strong>, <strong>Firearm</strong> <strong>Offences</strong> <strong>and</strong> <strong>Intimate</strong> <strong>Violence</strong> <strong>2007</strong>/<strong>08</strong><br />
- Owner occupiers: households who own their homes outright, or are buying with a<br />
mortgage (includes shared owners, who own part of the equity <strong>and</strong> pay part of the<br />
mortgage/rent).<br />
- Social renters: households renting from a council, housing association or other socialrented<br />
sector.<br />
- Private renters: households privately renting unfurnished or furnished property. This<br />
includes tenants whose accommodation comes with their job, even if their l<strong>and</strong>lord is a<br />
housing association or local authority.<br />
Urban areas – The National Statistics rural <strong>and</strong> urban area classification 2004 has been<br />
used in this report. Urban areas are those classified as ‘urban – sparse’ <strong>and</strong> ‘urban – less<br />
sparse’. More information is available on the National Statistics website at:<br />
(http://www.statistics.gov.uk/geography/nrudp.asp).<br />
<strong>Violence</strong> against the person – A group of recorded crime offence classifications which<br />
is split into ‘Most serious violence against the person’ <strong>and</strong> ‘Other violence against the person’<br />
offences. The ‘most serious’ subgroup comprises violent offences where the injury inflicted or<br />
intended is life threatening, <strong>and</strong> offences resulting in death, regardless of intent. ‘Other<br />
violence against the person’ includes offences involving less serious injury. It also includes<br />
certain offences that involve no physical injury, <strong>and</strong> some involving serious intent. The offence<br />
classes where no injury is sustained are as follows:<br />
- Endangering railway passengers;<br />
- Endangering life at sea;<br />
- Other possession of weapons;<br />
- Harassment;<br />
- Racially or religiously aggravated harassment;<br />
- Cruelty to <strong>and</strong> neglect of children;<br />
- Ab<strong>and</strong>oning a child under the age of two years;<br />
- Child abduction;<br />
- Assault without injury on a constable;<br />
- Assault without injury;<br />
- Racially or religiously aggravated assault without injury.<br />
Weighted data – Two types of weighting are used to ensure the representativeness of the<br />
BCS sample. First, the raw data are weighted to compensate for unequal probabilities of<br />
selection. These include: the individual's chance of participation being inversely proportional<br />
to the number of adults living in the household; the over-sampling of smaller police force<br />
areas; <strong>and</strong> the selection of multi-household addresses. Second, calibration weighting is<br />
used to adjust for differential non-response.<br />
Wounding – There are two types of wounding classifications used for recorded crime. The<br />
more serious are those offences committed with intent to do grievous bodily harm <strong>and</strong> are<br />
classified as ‘wounding or other act endangering life’. Those of assault occasioning actual<br />
bodily harm are classified in the ‘other wounding’ category.<br />
92
Appendix 2 Bibliography<br />
Appleby L. (Director of Inquiry) (2006) Avoidable Deaths: Five year Report of the National<br />
Confidential Inquiry into Suicide <strong>and</strong> Homicide by People with Mental Illness. Manchester:<br />
University of Manchester.<br />
http://www.medicine.manchester.ac.uk/suicideprevention/nci/Useful/avoidable_deaths_full_re<br />
port.pdf<br />
Bolling, K., Grant, C. <strong>and</strong> Donovan, J-L. (20<strong>08</strong>) <strong>2007</strong>/<strong>08</strong> British Crime Survey (Engl<strong>and</strong> &<br />
Wales) Technical Report Volume I. London: BMRB.<br />
http://www.homeoffice.gov.uk/rds/pdfs<strong>08</strong>/bcs07<strong>08</strong>tech1.pdf<br />
Britsh Medical Association (<strong>2007</strong>) Domestic Abuse. London: BMA.<br />
http://www.bma.org.uk/images/PDFDomesticAbuse_tcm41-147013.pdf<br />
Coleman, K., Jansson, K., Kaiza, P. <strong>and</strong> Reed, E. (<strong>2007</strong>) <strong>Homicides</strong>, <strong>Firearm</strong> <strong>Offences</strong> <strong>and</strong><br />
<strong>Intimate</strong> <strong>Violence</strong> 2006/07 (Supplementary volume 2 to Crime in Engl<strong>and</strong> <strong>and</strong> Wales<br />
2006/07). Home Office Statistical Bulletin 03/<strong>08</strong>.<br />
http://www.homeoffice.gov.uk/rds/pdfs07/hosb0207.pdf<br />
Finney, A. (2004) Alcohol <strong>and</strong> sexual violence: key findings from the research. Home Office<br />
Findings 215. London: Home Office.<br />
http://rds.homeoffice.gov.uk/rds/pdfs04/r215.pdf<br />
Finney, A. (2006) Domestic violence, sexual assault <strong>and</strong> stalking: findings from the 2004/05<br />
British Crime Survey. Home Office Online Report 12/06. London: Home Office.<br />
http://www.homeoffice.gov.uk/rds/pdfs06/rdsolr1206.pdf<br />
Kershaw, C., Nicholas, S., <strong>and</strong> Walker, A. (Eds.) (20<strong>08</strong>). Crime in Engl<strong>and</strong> <strong>and</strong> Wales<br />
<strong>2007</strong>/<strong>08</strong>. Home Office Statistical Bulletin 07/<strong>08</strong>. London: Home Office.<br />
http://www.homeoffice.gov.uk/rds/pdfs<strong>08</strong>/hosb07<strong>08</strong>.pdf<br />
Povey, D. (Ed.), Coleman, K., Kaiza, P., Hoare, J. <strong>and</strong> Jansson, K. (20<strong>08</strong>) <strong>Homicides</strong>,<br />
<strong>Firearm</strong> <strong>Offences</strong> <strong>and</strong> <strong>Intimate</strong> <strong>Violence</strong> 2006/07 (Supplementary Volume 2 to Crime in<br />
Engl<strong>and</strong> <strong>and</strong> Wales 2006/07). Home Office Statistical Bulletin 03/<strong>08</strong>.<br />
http://www.homeoffice.gov.uk/rds/pdfs<strong>08</strong>/hosb03<strong>08</strong>.pdf<br />
Simmons, J., Legg, C. <strong>and</strong> Hosking, R. (2003) National Crime Recording St<strong>and</strong>ard (NCRS):<br />
an Analysis of the Impact on Recorded Crime. Companion Volume to Crime in Engl<strong>and</strong> <strong>and</strong><br />
Wales 2002/2003. Home Office Online Report 31/03. London: Home Office.<br />
http://www.homeoffice.gov.uk/rds/pdfs2/rdsolr3103.pdf<br />
Walby, S. <strong>and</strong> Allen, J. (2004) Domestic violence, sexual assault <strong>and</strong> stalking: Findings from<br />
the British Crime Survey. Home Office Reseach Study 276. London: Home Office.<br />
http://www.homeoffice.gov.uk/rds/pdfs04/hors276.pdf<br />
Copies of Home Office statistical bulletins are available from the Home Office web site:<br />
http://www.homeoffice.gov.uk/rds/.<br />
93
RESEARCH DEVELOPMENT AND STATISTICS (RDS)<br />
MISSION STATEMENT<br />
RDS staff are part of the Home Office. They work closely with front-line staff <strong>and</strong> policy<br />
makers. The HO Chief Scientific Advisor, who is also Director of RDS, oversees professional<br />
development for RDS teams, quality assurance <strong>and</strong> strategic R & D issues.<br />
The Home Office’s purpose is to work together to protect the public. This is the guiding<br />
principle for Home Office policies to counter terrorism, cut crime, provide effective policing,<br />
secure our borders <strong>and</strong> protect personal identity.<br />
Part of the remit of RDS staff is to provide Home offcie National Statistics. These statistics<br />
inform Parliament <strong>and</strong> the members of the public about the state of the nation <strong>and</strong> provide a<br />
window on the work <strong>and</strong> performance of government, allowing the impact of government<br />
policies <strong>and</strong> actions to be assessed.<br />
Therefore -<br />
Research Development <strong>and</strong> Statistics in the Home Office improves policy making, decision<br />
taking <strong>and</strong> practice in support of the Home Office purpose <strong>and</strong> aims, to provide the public <strong>and</strong><br />
Parliament with information necessary for informed debate <strong>and</strong> to publish information for<br />
future use.<br />
ISBN: 978 1 84726 875 4<br />
94
Errata<br />
Table 1.02 (p.17) - 'All suspects acquitted’ <strong>and</strong> ‘No suspects charged’ figures for all years<br />
were revised on 13 Mar 2009 to reflect only those cases currently recorded as homicide.<br />
Table 1.04 (pp.19 & 20) - 'Stranger' figures for 2000/01 were revised on 13 Feb 2009, with<br />
58 victims (54 males <strong>and</strong> 4 females) of unknown age removed.<br />
Table 2.05 (p.48) – Totals for 'Used as a blunt instrument', ‘Used as a threat’ <strong>and</strong> ‘Total<br />
not fired’ were revised on 30 Nov 2009, with 961, 5,670 <strong>and</strong> 6,631 respectively.