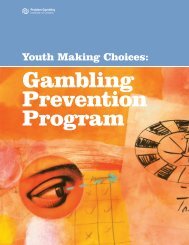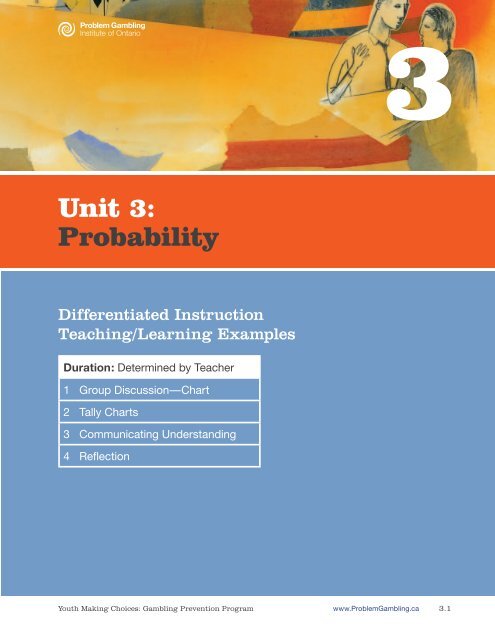
Unit 3: Probability - ProblemGambling.ca
Unit 3: Probability - ProblemGambling.ca
Unit 3: Probability - ProblemGambling.ca

You also want an ePaper? Increase the reach of your titles
YUMPU automatically turns print PDFs into web optimized ePapers that Google loves.
<strong>Unit</strong> 3:<br />
<strong>Probability</strong><br />
Differentiated Instruction<br />
Teaching/Learning Examples<br />
Duration: Determined by Teacher<br />
1 Group Discussion—Chart<br />
2 Tally Charts<br />
3 Communi<strong>ca</strong>ting Understanding<br />
4 Reflection<br />
Youth Making Choices: Gambling Prevention Program www.<strong>ProblemGambling</strong>.<strong>ca</strong><br />
3<br />
3.1
<strong>Unit</strong> 3: <strong>Probability</strong><br />
Differentiated Instruction Details<br />
KnowLEDgE of STuDEnTS<br />
Differentiation based on student:<br />
Readiness<br />
Interests<br />
Preferences: Styles Intelligences Other (e.g., environment, gender, culture)<br />
nEED To Know<br />
• Students’ preferred way of learning in order to support the in-class sessions and their RAFT choices<br />
How To fInD ouT<br />
• Self-assessment based on the multiple intelligences<br />
DIffErEnTIaTED InSTrucTIon rESponSE<br />
Learning materials (content)<br />
Ways of learning (process)<br />
Ways of demonstrating learning (product)<br />
Learning environment<br />
assessment and Evaluation<br />
aSSESSmEnT/SuccESS crITErIa<br />
Thinking<br />
• Demonstrates reasoning and proving based on data given<br />
• Demonstrates an understanding of skills to extract and interpret graph and<br />
table information<br />
• Demonstrates an understanding of a variety of graphs and charts<br />
Communi<strong>ca</strong>tion<br />
• Communi<strong>ca</strong>tes in descriptive terms the meaning of the data and the<br />
relevance to the subject<br />
Appli<strong>ca</strong>tion<br />
• Makes connections to real world situations that use data for evidence<br />
• Uses appropriate graphic organizer or visual to present findings<br />
prior Learning<br />
Prior to this lesson, students will have:<br />
• Awareness of graphs and some probability techniques<br />
• Awareness of collaborative processes<br />
• Awareness of the inquiry process<br />
• Awareness of forms of gambling<br />
Assessment Tools<br />
> Rubric<br />
> Checklists<br />
Youth Making Choices: Gambling Prevention Program www.<strong>ProblemGambling</strong>.<strong>ca</strong><br />
3.2
<strong>Unit</strong> 3: <strong>Probability</strong><br />
materials and resources<br />
maTErIaLS<br />
Appendix A<br />
• Student Resource 1: Lottery Scenario<br />
• Student Resource 2: Tally Sheets<br />
• Student Resource 3: Randomness<br />
• Student Resource 4: Coins, Dice and Cards<br />
• Student Resource 5: Recognition of Patterns<br />
• Student Resource 6: Coin Flip<br />
• Student Resource 7: The 3 Rs of Reflection<br />
Appendix B<br />
• Teacher Resource 1: Properties of <strong>Probability</strong><br />
• Teacher Resource 2: Randomness<br />
• Teacher Resource 3: Coins, Dice and Cards<br />
InTErnET rESourcES<br />
Ontario Lottery and Gaming Corporation (OLG)<br />
Know your limit. Play within it.<br />
www.knowyourlimit.<strong>ca</strong>/<br />
KnowYourLimit.<strong>ca</strong> is a web-based resource that provides information about how gambling works in<br />
Ontario, myths and facts, game odds and helpful tips to keep gambling fun. The link above is for a video<br />
<strong>ca</strong>lled The Slot Machine: What Every Player Needs to Know that explains the concepts of odds and<br />
randomness in a visual way.<br />
Addictions Foundation of Manitoba<br />
Cost of Play Calculator<br />
http://getgamblingfacts.<strong>ca</strong>/cop/english/cop.html<br />
This interactive website provides facts about gambling to help readers make more informed choices. The<br />
link is for the Cost of Play Calculator, an interactive tool that helps individuals learn more about how to<br />
reduce the cost of play.<br />
rESourcES<br />
Dice and Cards<br />
Youth Making Choices: Gambling Prevention Program www.<strong>ProblemGambling</strong>.<strong>ca</strong><br />
3.3
<strong>Unit</strong> 3: <strong>Probability</strong><br />
Lesson plan<br />
minds on<br />
> Establishing a positive learning environment<br />
> Connecting to prior learning and/or experiences<br />
> Setting the context for learning<br />
SmaLL groupS<br />
• Students are provided with a chart having three sections: “I see,”<br />
“I think,” “And so.” Brainstorm a list of “I see” statements to a picture<br />
of a gambling scene.<br />
• Students then answer the statement “I think,” completing that chart<br />
section (What do you think is happening in the story? What does the<br />
evidence tell you?).<br />
• Students then complete the “And so” section of the chart (I conclude…,<br />
I think that…).<br />
wHoLE cLaSS DEbrIEf<br />
• Teacher directs the discussion to review inferences and pros and cons of<br />
statements made in the activity.<br />
Connections<br />
L: Literacy<br />
ML: Mathemati<strong>ca</strong>l<br />
Literacy<br />
AfL, AoL: Assessment<br />
for/of Learning<br />
SC: Skill Continua<br />
AfL: Chart<br />
AfL: Anecdotal<br />
Comments<br />
action<br />
> Introducing new learning or extending/reinforcing prior learning<br />
> Providing opportunities for practice and appli<strong>ca</strong>tion of learning (guided > independent)<br />
InDIvIDuaL<br />
• Working independently, students complete the activity in Student<br />
Resource 1: Lottery Scenario, which talks about a specific lottery situation.<br />
wHoLE cLaSS DEbrIEf<br />
• Teacher directs discussion to ensure that after this exercise students<br />
understand probability, average and guarantee.<br />
Additional information to help in the discussion:<br />
– Question 3: It is possible that a person could win every week for a<br />
year. The chances are (1/4) to the power of 52 = 1 chance in 20,282,<br />
409,603,651,700,000,000,000,000,000. It is so incredibly unlikely that<br />
it is virtually impossible. Nonetheless, although extremely unlikely it<br />
is possible.<br />
– Question 4: It is possible that person could lose every single draw for<br />
a year. The chances of losing are (3/4) to the power of 52 = 1 chance in<br />
3,139,166. This means that losing every single draw is also very unlikely;<br />
but much less unlikely that winning every draw.<br />
It is important to understand the difference between something that is<br />
impossible, something virtually impossible (e.g., winning every bet for a<br />
year) and something that is very unlikely (e.g., losing every bet for a year).<br />
AfL: Schematic<br />
Presentations or Charts,<br />
Reflections<br />
AfL: Anecdotal<br />
Comments<br />
Youth Making Choices: Gambling Prevention Program www.<strong>ProblemGambling</strong>.<strong>ca</strong><br />
3.4
<strong>Unit</strong> 3: <strong>Probability</strong><br />
A person who experiences a large win gambling may think that their<br />
success is so unlikely that it could not have been chance and may attribute<br />
their win to the concept of luck, prayer, a betting system, or skill. Unusual<br />
wins and unusual losses <strong>ca</strong>n lead people to distorted beliefs about their<br />
ability to win.<br />
SmaLL groupS<br />
• There are three small group activities to select. Depending on the amount<br />
of time the teacher has available, one or all of the activities may be<br />
selected. The lesson activities are:<br />
1. Properties of <strong>Probability</strong><br />
The Properties of <strong>Probability</strong> involves a variety of tally chart activities.<br />
The more variety in the activities, the greater the increase in student<br />
understanding of the concept of probability and house edge. Students<br />
must work through each activity for the recommended number of<br />
times to see long-term outcomes. This activity illustrates several<br />
properties of probability and house edge. Teacher Resource 1 provides<br />
the instructions and Student Resource 2 provides the tally sheet and<br />
worksheet for the students to complete the activities. The activities<br />
are divided into eight separate sections that must be completed in the<br />
order presented. Sections 1 and 2 look at probability and sections 3 to<br />
8 look at house edge.<br />
2. Randomness<br />
The Randomness activity takes a closer look at what randomness is<br />
and how it may impact beliefs about chances of winning when involved<br />
in some gambling activities. Teacher Resource 2 and Student Resource<br />
3 provide the instructions and handouts.<br />
3. Coins, Dice and Cards<br />
Coins, Dice and Cards are activities with coins, dice and <strong>ca</strong>rds that<br />
teach about probability. Teacher Resource 3, and Students resources<br />
4, 5 and 6 are used for this activity.<br />
wHoLE cLaSS DEbrIEf<br />
• Students reflect on the results and should demonstrate an understanding<br />
of sample size, properties of probability, range or spread of outcomes,<br />
uncertainty, feelings about winning or losing in controlled circumstances,<br />
randomness, chance of winning and random events.<br />
consolidation and connection<br />
> Helping students demonstrate what they have learned<br />
> Providing opportunities for consolidation and reflection<br />
InDIvIDuaL rafT<br />
• The RAFT assignments are differentiated based on student intelligence<br />
preferences. RAFT assignments <strong>ca</strong>n be done independently, or in<br />
pairs or groups in class or out of class. In all <strong>ca</strong>ses students require an<br />
understanding of the aspects of a RAFT topic, and rubrics need to be<br />
supplied for all topic possibilities.<br />
Connections<br />
AfL: Anecdotal<br />
Comments<br />
Youth Making Choices: Gambling Prevention Program www.<strong>ProblemGambling</strong>.<strong>ca</strong><br />
3.5
<strong>Unit</strong> 3: <strong>Probability</strong><br />
DIffErEnTIaTED InSTrucTIon TEacHIng/LEarnIng ExampLES<br />
Role Audience Format Topic<br />
1 Teacher Young<br />
children<br />
2 Health<br />
edu<strong>ca</strong>tor<br />
Adult Game<br />
evaluation<br />
3 Teacher Students Terminology<br />
fact sheet<br />
4 Friend Youth Personal<br />
e-mail<br />
5 Group<br />
counsellor<br />
Adults Business<br />
letter<br />
Graphs, etc. Plan a series of probability experiments<br />
for students in grades 3 to 5 to teach<br />
them what you have learned in this<br />
session.<br />
Evaluate a number of child and youth<br />
games to determine the amount of<br />
gambling that is part of the game.<br />
Present your material in a report you<br />
will give to the parent council of a<br />
senior public school.<br />
Prepare a fact sheet with terminology<br />
from this session and multiple<br />
examples to explain each term.<br />
Write an e-mail to a friend whom you<br />
now suspect, after what you have<br />
learned in this unit, is much deeper into<br />
gambling activities than you thought.<br />
Express your concern and the reasons<br />
for that concern.<br />
Watching and listening to your afterschool<br />
group play and converse with<br />
each other, you are concerned about<br />
their talk about evening computer<br />
activities: pool, hearts, euchre,<br />
blackjack, etc., which involve a level<br />
of gambling. Prepare a proposal to do<br />
further research into this matter.<br />
6 Self Adult Survey You have listened to a presentation on<br />
gambling and you suspect that your<br />
activities include a number of gambling<br />
activities. Keep a record for a week of<br />
the games you play and record your<br />
result with summation in an appropriate<br />
manner.<br />
7 Teacher,<br />
student<br />
helper<br />
Adult Conversation You are a student helper for a teacher.<br />
You admire the professionalism of the<br />
teacher but you are concerned that<br />
this person may be seriously involved<br />
in <strong>ca</strong>sino activities. You are fearful of<br />
serious consequences for this teacher.<br />
Write the conversation that you will<br />
have with this individual to try to see<br />
if your thoughts are correct, and also<br />
to judge the teacher’s willingness to<br />
seek help.<br />
Connections<br />
Youth Making Choices: Gambling Prevention Program www.<strong>ProblemGambling</strong>.<strong>ca</strong><br />
3.6
<strong>Unit</strong> 3: <strong>Probability</strong><br />
Role Audience Format Topic<br />
8 Researcher Adult Television<br />
program<br />
assessment<br />
Select a program on television that you<br />
suspect is a form of gambling. Watch<br />
the program three times. Record<br />
incidents of “gambling.” Indi<strong>ca</strong>te when<br />
it happens, what the result is and<br />
whether it could lead to a problem for<br />
the contestants and audience.<br />
InDIvIDuaL mETacognITIon<br />
• The 3 Rs of Reflection: Students use The 3 Rs of Reflection (Retell, Relate,<br />
Reflect) as a way for them to reflect on their learning prior to the next class.<br />
Connections<br />
Youth Making Choices: Gambling Prevention Program www.<strong>ProblemGambling</strong>.<strong>ca</strong><br />
3.7
<strong>Unit</strong> 3: <strong>Probability</strong> Appendix A<br />
Student resource 1<br />
Lottery Scenario<br />
ScEnarIo<br />
Imagine that there is a lottery where one winner is picked once a week for one<br />
year. There are only four tickets in the lottery and you purchase one for yourself<br />
every week of the entire year (52 weeks). What is your probability of winning<br />
expressed as a per cent?<br />
procEDurE<br />
1. Create a T-chart in your notes to tally the results of your investigation. The T-chart will have 52<br />
weeks listed in the left-hand column and your answers in the right hand column.<br />
2. Create four tickets, each numbered with a different number.<br />
3. Place the tickets in a container, and without looking pull one ticket for each week of the year. As<br />
you pull the tickets, record the number of the ticket beside the week it represents.<br />
4. Calculate the number of times that each ticket won.<br />
5. Change this number into a per cent.<br />
6. Answer the following questions.<br />
DIScuSSIonS<br />
1. In the first week what is your probability of winning?<br />
2. Is it possible to create a formula that represents your chance of winning each week?<br />
3. Is it true that you could win every week all year?<br />
4. Is it true that you might not win in any week?<br />
5. Why is there no guarantee that you might win?<br />
Youth Making Choices: Gambling Prevention Program www.<strong>ProblemGambling</strong>.<strong>ca</strong><br />
3.8
<strong>Unit</strong> 3: <strong>Probability</strong> Appendix A<br />
Student resource 2<br />
Tally Sheet<br />
SEcTIon onE<br />
Individual Tally Sheets<br />
1<br />
2<br />
3<br />
4<br />
5<br />
6<br />
7<br />
8<br />
9<br />
10<br />
11<br />
12<br />
13<br />
14<br />
15<br />
16<br />
17<br />
18<br />
19<br />
20<br />
21<br />
22<br />
23<br />
24<br />
25<br />
Your Choice Actual Throw Win Lose<br />
Totals<br />
Youth Making Choices: Gambling Prevention Program www.<strong>ProblemGambling</strong>.<strong>ca</strong><br />
p. 1<br />
3.9
<strong>Unit</strong> 3: <strong>Probability</strong> Appendix A<br />
Student resource 2<br />
SEcTIon Two<br />
Group Tally Sheet<br />
Person 1<br />
Person 2<br />
Person 3<br />
Person 4<br />
Person 5<br />
Totals<br />
SEcTIon THrEE<br />
Individual Results<br />
Win Lose<br />
Per cent of wins after 20 throws (for a group of 5 people)<br />
<strong>Probability</strong> = wins ÷ 20 x 100 =<br />
<strong>Probability</strong> = ÷ 20 x 100 = %<br />
Per cent wins after 25 throws (for a group of 4 people)<br />
<strong>Probability</strong> = wins ÷ 25 x 100 =<br />
<strong>Probability</strong> = ÷ 25 x 100 = %<br />
SEcTIon four<br />
Group results (assuming 100 rolls of the dice in total)<br />
<strong>Probability</strong> = wins ÷ 100 x 100 =<br />
<strong>Probability</strong> = ÷ 100 x 100 = %<br />
SEcTIon fIvE<br />
No house edge (prize = 6)<br />
Individual per cent win from Section Three =<br />
House edge = 100 – (percent win) x 6<br />
House edge = 100 – ( ) x 6 =<br />
Youth Making Choices: Gambling Prevention Program www.<strong>ProblemGambling</strong>.<strong>ca</strong><br />
p. 2<br />
3.10
<strong>Unit</strong> 3: <strong>Probability</strong> Appendix A<br />
Student resource 2<br />
Group per cent win from Section Four =<br />
House edge = 100 – (percent win) x 6<br />
House edge = 100 – ( ) x 6 =<br />
SEcTIon SIx<br />
Moderate house edge (prize = 5)<br />
Individual per cent win from Section Three =<br />
House edge = 100 – (percent win) x 5<br />
House edge = 100 – ( ) x 5 =<br />
Group per cent win from Section Four =<br />
House edge = 100 – (percent win) x 5<br />
House edge = 100 – ( ) x 5 =<br />
SEcTIon SEvEn<br />
Huge house edge (prize = 4)<br />
Individual percent win from Section Three =<br />
House edge = 100 – (percent win) x 4<br />
House edge = 100 – ( ) x 4 =<br />
Group per cent win from Section Four =<br />
House edge = 100 – (percent win) x 4<br />
House edge = 100 – ( ) x 4 =<br />
SEcTIon EIgHT<br />
Negative house edge (prize = 7)<br />
Individual percent win from Section Three =<br />
House edge = 100 – (percent win) x 7<br />
House edge = 100 – ( ) x 7 =<br />
Group percent win from Section Four =<br />
House edge = 100 – (percent win) x 7<br />
House edge = 100 – ( ) x 7 =<br />
Youth Making Choices: Gambling Prevention Program www.<strong>ProblemGambling</strong>.<strong>ca</strong><br />
p. 3<br />
3.11
<strong>Unit</strong> 3: <strong>Probability</strong> Appendix A<br />
Student resource 3<br />
randomness<br />
fIgurE 1: This is what people think random chance is like.<br />
The Conveyor Belt Myth: The Dream<br />
Play begins. The win is a long way off.<br />
$0<br />
After a few hours, the big win is a little closer.<br />
$0<br />
As time goes by, the win gets closer and closer.<br />
$0<br />
$0<br />
$1<br />
$1<br />
$1<br />
$0<br />
$0<br />
$0<br />
$0<br />
$0<br />
$1<br />
$0<br />
$1000<br />
$0<br />
$1<br />
$0<br />
$0<br />
$0<br />
$0<br />
$0<br />
$0<br />
$0<br />
$1<br />
$1000<br />
$1<br />
$0<br />
$0<br />
$0<br />
$0<br />
$0<br />
$1<br />
$1000<br />
$0<br />
$1<br />
Youth Making Choices: Gambling Prevention Program www.<strong>ProblemGambling</strong>.<strong>ca</strong><br />
$0<br />
$1<br />
$0<br />
p. 1<br />
3.12
<strong>Unit</strong> 3: <strong>Probability</strong> Appendix A<br />
Student resource 3<br />
The Conveyor Belt Myth: The Reality<br />
Play begins. The win is a long way off.<br />
$0<br />
There is no conveyor belt. The odds do not improve over time.<br />
$0<br />
You never know if you are going to win or lose.<br />
?<br />
$0<br />
$1<br />
?<br />
$1<br />
$0<br />
?<br />
$0<br />
$0<br />
?<br />
$1<br />
$0<br />
?<br />
$0<br />
$1<br />
?<br />
$0<br />
$0<br />
?<br />
$0<br />
$0<br />
?<br />
The only thing you know for sure is that you are unlikely to win a large prize.<br />
$1<br />
$1<br />
?<br />
$0<br />
$1<br />
?<br />
$0<br />
$0<br />
?<br />
$1000<br />
$1000<br />
?<br />
Youth Making Choices: Gambling Prevention Program www.<strong>ProblemGambling</strong>.<strong>ca</strong><br />
$0<br />
$1<br />
?<br />
p. 2<br />
3.13
<strong>Unit</strong> 3: <strong>Probability</strong> Appendix A<br />
Student resource 4<br />
coins, Dice and <strong>ca</strong>rds<br />
QuESTIon 1<br />
Flip a coin 20 times. Record your results in the table below.<br />
a) How many heads are there?<br />
b) How many tails are there?<br />
c) Can you use this information to predict how many heads and tails will occur in the next 20<br />
coin flips? Explain your thinking.<br />
d) Flip the coin 20 more times. Record your results in the table below.<br />
e) Was the number of heads and tails the same as your first result? Does this support or refute<br />
your answer to question “c” above? Explain your thinking.<br />
Youth Making Choices: Gambling Prevention Program www.<strong>ProblemGambling</strong>.<strong>ca</strong><br />
p. 1<br />
3.14
<strong>Unit</strong> 3: <strong>Probability</strong> Appendix A<br />
Student resource 4<br />
QuESTIon 2<br />
a) Now, suppose that the coin has already been flipped 14 times and the results are as follows:<br />
12 heads and 2 tails. What will happen next? Flip a coin 36 more times until you have a total<br />
of 50 flips. Does the number of heads and tails even up?<br />
Heads 12 + =<br />
Tails 2 + =<br />
Did the number of tails <strong>ca</strong>tch up to the number of heads? Yes No<br />
What percentage of tosses is heads?<br />
What percentage of tosses is tails?<br />
Would you expect the number of tails <strong>ca</strong>tch up to the number of heads eventually?<br />
Why or why not?<br />
Youth Making Choices: Gambling Prevention Program www.<strong>ProblemGambling</strong>.<strong>ca</strong><br />
p. 2<br />
3.15
<strong>Unit</strong> 3: <strong>Probability</strong> Appendix A<br />
Student resource 4<br />
b) Now, suppose that the coin has already been flipped 414 times and the results are as follows:<br />
212 heads and 202 tails. What will happen next? Flip a coin 36 more times until you have a<br />
total of 450 flips. Does the number of heads and tails even up?<br />
Heads 212 + =<br />
Tails 202 + =<br />
Did the number of tails <strong>ca</strong>tch up to the number of heads? Yes No<br />
What percentage of tosses is heads?<br />
What percentage of tosses is tails?<br />
Would you expect the number of tails <strong>ca</strong>tch up to the number of heads eventually?<br />
Why or why not?<br />
QuESTIon 3<br />
Compare your conclusions from questions 2a with those from 2b. Compare the actual number of<br />
heads and tails in each experiment. Now compare the percentage of heads and tails in each.<br />
Youth Making Choices: Gambling Prevention Program www.<strong>ProblemGambling</strong>.<strong>ca</strong><br />
p. 3<br />
3.16
<strong>Unit</strong> 3: <strong>Probability</strong> Appendix A<br />
Student resource 5<br />
recognition of patterns<br />
What do you see?<br />
What do you see?<br />
What do you see?<br />
Youth Making Choices: Gambling Prevention Program www.<strong>ProblemGambling</strong>.<strong>ca</strong><br />
p. 1<br />
3.17
<strong>Unit</strong> 3: <strong>Probability</strong> Appendix A<br />
Student resource 5<br />
Although there are no actual triangles that appear on your eyes’ retinas, your<br />
brain will somehow interpret the following image as two overlapping triangles. Is<br />
this imagination? Are you losing your mind? No. The notched circles and angled<br />
lines merely suggest gaps in which objects should be. The brain does the rest by<br />
triggering a sort of pattern recognition phenomenon.<br />
Youth Making Choices: Gambling Prevention Program www.<strong>ProblemGambling</strong>.<strong>ca</strong><br />
p. 2<br />
3.18
<strong>Unit</strong> 3: <strong>Probability</strong> Appendix A<br />
Student resource 6<br />
coin flip<br />
After 14 flips you have 12 heads and 2 tails<br />
After 414 flips you have 212 heads and 202 tails<br />
Youth Making Choices: Gambling Prevention Program www.<strong>ProblemGambling</strong>.<strong>ca</strong><br />
3.19
<strong>Unit</strong> 3: <strong>Probability</strong> Appendix A<br />
Student resource 7<br />
The 3 rs of reflection<br />
non-nEgoTIabLE<br />
Use the 3 Rs (Retell, Relate, Reflect) to explain your learning.<br />
nEgoTIabLE<br />
1. Topics<br />
Select one of the topics below for your reflection:<br />
a) Skills and knowledge that I acquired<br />
b) The importance of following through the entire process of an experiment<br />
c) My comfort level in working in small groups or with a partner<br />
d) I <strong>ca</strong>n apply the following information to my life<br />
2. Formats<br />
Select one of the following presentation formats for your reflection:<br />
a) Written reflection—point form or paragraph<br />
b) Recorded oral reflection (mini recorder)<br />
c) Presentation software—slides with images and graphics<br />
d) Blog<br />
opTIonaL<br />
A. Make a two-minute presentation of reflective learning during a class.<br />
B. Act as a guest speaker in the class.<br />
Youth Making Choices: Gambling Prevention Program www.<strong>ProblemGambling</strong>.<strong>ca</strong><br />
3.20
<strong>Unit</strong> 3: <strong>Probability</strong> Appendix B<br />
Teacher resource 1<br />
properties of probability<br />
InTroDucTIon To SEcTIonS onE THrougH four (see below)<br />
This activity illustrates several properties of probability:<br />
1. <strong>Probability</strong> is completely uncertain on any specific roll—you never know what will<br />
happen next.<br />
2. As the sample size increases, the spread of outcomes comes closer to the long-term<br />
expected probability.<br />
3. However, even large samples have some uncertainty.<br />
4. You may find traces of odd occurrences or patterns, e.g., two, three or four wins in a row,<br />
sequences in the outcomes (1, 2, 3, 4), repeated numbers (4, 4, 4) and patterns (3, 6, 3, 6).<br />
procEDurE for SEcTIonS onE anD Two<br />
Have the students work in groups of four or five. Each student is given a die and selects a<br />
number from 1 to 6 to bet on. Students <strong>ca</strong>n bet on the same number if they wish, but encourage<br />
them to select different numbers. They then roll the dice and record the number of each roll<br />
of each die on the Tally Sheet. If they are in a group of four, each student should roll his or her<br />
die 25 times. If they are a group of five, each student should roll his or her die 20 times so the<br />
combined total of dice throws is 100. Tally the wins of the group in Section Two.<br />
procEDurE for SEcTIonS THrEE anD four<br />
Next, students need to determine how often they win. After 20 or 25 throws (depending on<br />
number of students in group) of the dice, divide the total number of times their number <strong>ca</strong>me<br />
up by the total number of throws. For example: probability = wins ÷ throws. The formula for the<br />
group is probability = wins ÷ 100 x 100. The “÷ 100 x 100” is unnecessary if you have exactly 100<br />
throws, but is put here to show that the formula is the same for 20, 25 or 100 throws.<br />
DIScuSSIon<br />
1. How close is the number to 16.6%? Write down on the board the students numbers,<br />
arranging them from lowest to highest percentage. The theoreti<strong>ca</strong>l long-term outcome is<br />
16.6%. Which is closer to 16.6%, the individual results or the group results?<br />
2. Find out which student won the most often. Ask how winning most often made the student<br />
feel. Does it make you feel really good to win?<br />
3. Find out which student won the least often. Ask how not winning made the student feel.<br />
4. Go over the tally sheets and look for odd occurrences, e.g., two, three or four wins in a row,<br />
sequences in the outcomes (1, 2, 3, 4), repeated numbers (4, 4, 4) and patterns (3, 6, 3, 6).<br />
These things will not occur very often, but they will occur and illustrate that weird events<br />
do happen.<br />
Youth Making Choices: Gambling Prevention Program www.<strong>ProblemGambling</strong>.<strong>ca</strong><br />
p. 1<br />
3.21
<strong>Unit</strong> 3: <strong>Probability</strong> Appendix B<br />
Teacher resource 1<br />
5. Most people believe that after you win you are less likely to win again. Be<strong>ca</strong>use of this,<br />
people sometimes switch numbers, or switch machines after a big win. As students to look<br />
at the first number they rolled. Ask how many of them rolled the same number again on the<br />
2nd roll, how many rolled the first number on the 3rd roll and so on. Make a graph of how<br />
students repeated the first number on the 2nd, 3rd, 4th, 5th, 6th and 7th rolls of the dice. On<br />
average the number should have been repeated on the 2nd, 3rd, 4th, 5th, 6th and 7th rolls<br />
of the dice approximately 16.7% of the time. The results should illustrate that after a number<br />
has come up it is neither more likely nor less likely to come up again. Ask them how many<br />
rolled the same number more than once in the next 6 rolls. About 26% of the class should<br />
report getting the same number more than once. Ask did not repeat the same number in the<br />
next 6 rolls. About 33% of the class should report that they did not repeat the same number.<br />
This belief that a number is less likely to come up again <strong>ca</strong>n lead some people to believe they<br />
<strong>ca</strong>n beat the house edge of the game by avoiding numbers that have come up recently or by<br />
looking for numbers that are due to come up. This exercise will demonstrate that the odds of<br />
a number do not change after a number has come up.<br />
6. Finally, combine the results from all students to see if the total of all the students is closer<br />
to 16.6%.<br />
InTroDucTIon To SEcTIonS fIvE THrougH EIgHT<br />
Next, the students are introduced to the concept of house edge. House edge is the profit the<br />
<strong>ca</strong>sino makes from people who gamble. In sections Five through Eight, students see how<br />
<strong>ca</strong>sinos make their money by not paying back enough money to the players to make up for<br />
the money the player has lost. Sections Five through Eight demonstrate how the <strong>ca</strong>sino <strong>ca</strong>n<br />
guarantee a profit by varying the amount paid back to the player. The students <strong>ca</strong>n work this out<br />
with both their individual tally sheets results (wins and losses) and with the group results. The<br />
group results will be closer to the true long-term percentages. In Section Five, there is no house<br />
edge so the <strong>ca</strong>sino would not make any profit.<br />
procEDurE<br />
• Using the results from the tally sheets, place the results in sections Five through Eight.<br />
Starting in Section Five, students assume a bet size of 1 penny for every roll of the dice and<br />
a prize value of 6 pennies for every win. Compute the house edge assuming a prize of 6<br />
pennies per win. This <strong>ca</strong>n be computed for both individual and group data.<br />
• As a group, discuss the outcome and house edge. On average there should be a zero house<br />
edge be<strong>ca</strong>use the prize of 6 pennies is large enough to make up for the chances of losing.<br />
• Now repeat this using a win amount of only 5 pennies for a win. A prize of only 5 pennies<br />
should result in an outcome of a net loss of 15 pennies and a house edge of 16.7%.<br />
• Now repeat this with a win amount of only 4 pennies for a win. A prize of only 4 pennies<br />
should result in an outcome of a net loss of 30 pennies and a house edge of 33.3%.<br />
• Now repeat this with a win amount of 7 pennies for a win. A prize of 7 pennies should result<br />
in an outcome of a net win of 15 pennies and a house edge of –16.7% (or a player advantage<br />
of 16.7%).<br />
• Which of these games is the most realistic for a commercial <strong>ca</strong>sino: a prize of 6, 5, 4 or 7<br />
pennies for a 1-penny bet? The answer is 5. With 6 or 7 the <strong>ca</strong>sino would lose money, and<br />
with 4 the player would lose too much, bet bored and go home.<br />
Youth Making Choices: Gambling Prevention Program www.<strong>ProblemGambling</strong>.<strong>ca</strong><br />
p. 2<br />
3.22
<strong>Unit</strong> 3: <strong>Probability</strong> Appendix B<br />
Teacher resource 1<br />
DIScuSSIon<br />
The house edge in Section Five is 0%, the house edge in Section Six is 16.6%, the house edge<br />
in Section Seven is 33.3%, the house edge in Section Eight is -16.7%.<br />
1. Which was closer to the true values, the individual outcomes or the combined group data?<br />
2. Which house edge would you never see in a real <strong>ca</strong>sino?<br />
3. Which house edge would you most likely see in a real <strong>ca</strong>sino?<br />
anSwEr<br />
1. The group data will, in general, be closer than the individual results to the true values.<br />
2. You would never see the house edge in Section Eight (prize = 7), and would most likely see<br />
the house edge shown in Section Six (prize = 5).<br />
3. The moderate house edge guarantees a profit, but does not take the players’ money away<br />
too fast. In fact an even more realistic payout would be 5.5 for a house edge 8.4%. A smaller<br />
house edge would encourage the player to play longer.<br />
TEacHEr noTE<br />
House edge is the profit the <strong>ca</strong>sino makes from people who gamble. Stores such as Walmart<br />
make money by charging the customer more money for a product than it cost them. For<br />
example, it might cost them $10 to buy a shoe from a warehouse, $1 to transport it across the<br />
country, and $3 for the labour cost of putting it on the shelf, for a total cost of $14. They sell the<br />
shoe for $24, ensuring a profit for the company of $10. Commercial gambling is just another big<br />
business. To ensure a profit, commercial games of chance always have a house edge. That is,<br />
the company running the business sets up the game in a way to ensure that it will make money<br />
in the long run. This is done by paying out less money for a win than the chance against winning.<br />
In Section Five, there is no house edge, so the <strong>ca</strong>sino would not make any profit<br />
Youth Making Choices: Gambling Prevention Program www.<strong>ProblemGambling</strong>.<strong>ca</strong><br />
p. 3<br />
3.23
<strong>Unit</strong> 3: <strong>Probability</strong> Appendix B<br />
Teacher resource 2<br />
randomness<br />
InTroDucTIon<br />
Students review the Conveyer Belt found in Student Resource 3, and discuss the concept of<br />
randomness. The teacher <strong>ca</strong>n also use the video The Slot Machine: What Every Player Needs to<br />
Know, available at www.knowyourlimit.<strong>ca</strong>. This video describes the concept of randomness.<br />
cLaSS DIScuSSIon<br />
The Conveyor Belt Figure 1 illustrates what people often believe random chance is like. They<br />
seem to believe that the prizes are on a conveyor belt that is moving forward. With each spin,<br />
the possible win moves closer. Figure 2 illustrates a more realistic depiction in which the chance<br />
of winning the big prize does not change no matter how often the person has played. A person<br />
never knows if he or she is about to win. This is true regardless of the type of gambling, be it<br />
slots, dice, <strong>ca</strong>rds, horse race bets or sports bets—the simple truth is that no matter what has<br />
occurred, a person’s chances of winning are exactly the same from bet to bet. Someone could<br />
win on the first spin, or not win for hour after hour.<br />
TEacHEr noTES<br />
What does “random” mean?<br />
• Games of chance use random-numbers generators such as dice, shuffling of <strong>ca</strong>rds, flipping<br />
of coins or computer programs to generate random experiences for the players.<br />
• Random does not mean that something has no <strong>ca</strong>use. Random events are the results of<br />
forces such as gravity, wind, rain and temperature, but these forces are combined in a way<br />
that makes it impossible to predict what will happen.<br />
• Random events are the result of complexity, which means too many forces are at work to keep<br />
track of. For example, think of all the different forces at work when you roll dice (what size the<br />
dice are, how hard you throw them, whether you shake them, how level the table is, where they<br />
land). Flipping a coin is too simple to serve as a good example of random chance be<strong>ca</strong>use it<br />
is too easy to manipulate. A good magician <strong>ca</strong>n learn the skill to time a coin flip to land on the<br />
side he wants. A pair of dice is much better be<strong>ca</strong>use the movement and bounce of the dice is<br />
more complex and much harder to manipulate.<br />
• You <strong>ca</strong>n compute your chances of winning, but you <strong>ca</strong>nnot tell if or when you will win.<br />
For example, if you play a lottery, you might hear the phrase “1 in 10 chance of winning.”<br />
However, this does not mean that if you play 10 times, you will definitely win once.<br />
ranDom EvEnTS arE InDEpEnDEnT<br />
• Independence means that one event <strong>ca</strong>nnot affect any other.<br />
• The fact that heads have come up 10 times in a row tells you nothing about what will come<br />
up next. The chances of a head coming up are the same regardless of what has come up<br />
already. Coins and dice have no memory. Even if your coin <strong>ca</strong>me up heads 20 times in a row,<br />
that would still not tell you which side will come up next.<br />
• You could win all the time, some of the time or not at all, be<strong>ca</strong>use random events are<br />
independent of each other.<br />
Youth Making Choices: Gambling Prevention Program www.<strong>ProblemGambling</strong>.<strong>ca</strong><br />
p. 1<br />
3.24
<strong>Unit</strong> 3: <strong>Probability</strong> Appendix B<br />
Teacher resource 2<br />
• Some people believe that if they have lost a lot they are “due for a win.” When mixed up with<br />
emotions and “feeling lucky,” this misunderstanding <strong>ca</strong>n get people into a lot of trouble. You<br />
are never “due for a win.”<br />
Youth Making Choices: Gambling Prevention Program www.<strong>ProblemGambling</strong>.<strong>ca</strong><br />
p. 2<br />
3.25
<strong>Unit</strong> 3: <strong>Probability</strong> Appendix B<br />
Teacher resource 3<br />
coins, Dice and <strong>ca</strong>rds<br />
InTroDucTIon<br />
Provide the students with copies of the Student Resource 4: Coins, Dice and Cards. Ask them to<br />
answer questions 1 and 2. Coins and dice should be available for students to use.<br />
Question 1a to e gives students first-hand experience with coins and random chance. It is<br />
designed to show students that they <strong>ca</strong>nnot predict what will happen next. If they get more<br />
heads than tail during the first 20 flips, they may not necessarily get more tail then heads<br />
during the next 20 flips.<br />
Question 2a, the students are told that the coin has already been flipped 14 times and they are<br />
asked to flip the coin an additional 36 times to equal 50 flips in total. Question 2a is designed to<br />
illustrate the fact that the number of heads and tails may not even up.<br />
Question 2b, the students are told that the coin has already been flipped 414 times and they are<br />
asked to flip the coin an addition 36 times to equal 450 flips in total. Question 2b is designed to<br />
illustrate the fact that even though the actual number of flips may not even up, the percentage<br />
of heads and tails will be much close to 50% than in question 2a. The fact that the percentage<br />
converges towards 50% creates and illusion that random chance corrects itself. The reality is<br />
that the difference of 10 more heads than tails becomes proportionally smaller as the sample<br />
size increases, but the number of heads and tails does not actually even up.<br />
Question 3 asks the students to compare the results of question 2a with those from 2b. They<br />
will typi<strong>ca</strong>lly find that the actual number of heads and tails in each question does not converge<br />
toward the same number but will on average preserve the difference of 10, but the percentage<br />
of heads and tails will converge towards 50%. So for question 2a, the results might be 30 heads<br />
and 20 tails and the percentages would be 60% heads and 40% tails. For question 2b the<br />
results might be 230 heads and 220 tails which would be 51.1% and 48.8%. This illustrates that<br />
the percentage of heads and tails gets closer to 50%, but the actual number of heads and tails<br />
does not. Therefore betting on tails neither helps or hurts ones chance of winning.<br />
The key concepts here are:<br />
1. that random chance is not self correcting<br />
2. a difference in heads and tail is not corrected, but becomes less noticeable (washed out)<br />
by subsequent flips<br />
3. any betting strategy that depends on the idea that random chance will even things up will<br />
not work.<br />
The idea that differences get less noticeable as you increase the sample is also illustrated<br />
in Student Resource 6: Coin Flips. After 14 flips, a difference of 10 more heads than tails<br />
looks really large, but after 414 flips a difference of 10 heads is hard to see at all. The fact that<br />
the difference gets less and less noticeable leads to the incorrect belief that random chance<br />
corrects itself.<br />
Youth Making Choices: Gambling Prevention Program www.<strong>ProblemGambling</strong>.<strong>ca</strong><br />
p. 1<br />
3.26
<strong>Unit</strong> 3: <strong>Probability</strong> Appendix B<br />
Teacher resource 3<br />
DIScuSSIon<br />
Engage the students in a discussion about the unpredictability of the outcomes of coin and<br />
dice experiments. The concept of “independence” (in other words, coins and dice do not have<br />
memories) from one trial to the next is a criti<strong>ca</strong>l learning.<br />
During the discussion teachers may wish to use an overhead of Student Resource 5:<br />
Recognition of Patterns, to emphasize that human beings naturally seek patterns where none are<br />
intended. (Reveal “V V V” and the students will likely say that these are 3 Vs. Reveal the two Vs<br />
in close proximity and they might <strong>ca</strong>ll this a W. Reveal the three rotated Vs and they will likely <strong>ca</strong>ll<br />
this a triangle. Students will likely see pattern where none is intended.)<br />
Another illusion is shown on the next page where the illusion of a triangle is so strong that it<br />
actually look brighter than white space on the rest of the page. These images illustrate how<br />
good humans are at finding patterns. This pattern recognition skill however <strong>ca</strong>n be a problem<br />
when we see patterns in random chance. Pattern recognition is a skill. The problem is that our<br />
brains are set up to find patterns; not to determine if they are real or not. If we saw a pattern of<br />
black and yellow stripes in a forest, are brain might conclude that it is a tiger. There is a survival<br />
value to assuming it’s a tiger and seeking safety. There is no survival value in deciding testing<br />
the pattern to determine if it is a real tiger or just some random stripes pattern. In addition,<br />
pure random chance is quite rare outside of a <strong>ca</strong>sino. The weather for example, is hard to<br />
predict, but there are predictable aspects of weather (e.g., dark clouds mean rain; a bright<br />
sun means warmth). Therefore our brain is biased to assume that any pattern is real. This bias<br />
help us survive, but <strong>ca</strong>n also lead to the belief in superstitions, astrology, conspiracy theories,<br />
unconfirmed anecdotal reports, urban legends, and folk wisdom. When a person is gambling<br />
and experiencing randomly generated patterns, this same tendency in our brains, may lead us<br />
into thinking that the game <strong>ca</strong>n be beaten.<br />
Youth Making Choices: Gambling Prevention Program www.<strong>ProblemGambling</strong>.<strong>ca</strong><br />
p. 21<br />
3.27