rticle template - Journal of Chromatographic Science
rticle template - Journal of Chromatographic Science
rticle template - Journal of Chromatographic Science

Create successful ePaper yourself
Turn your PDF publications into a flip-book with our unique Google optimized e-Paper software.
<strong>Journal</strong> <strong>of</strong> <strong>Chromatographic</strong> <strong>Science</strong>, Vol. 45, July 2007<br />
Validated, Stability-Indicated Quantitative Purity<br />
Test for Triethylenetetramine Tetrachlorhydrate by<br />
Automated Multiple Development<br />
C. Dauphin*, D. Poirier, and D. Pradeau<br />
AGEPS, 7 Rue du Fer à Moulin, 75221 Paris Cedex 05, France<br />
Abstract<br />
There is a monography <strong>of</strong> Triethylenetetramine dichlorhydrate<br />
(Trientine) in the United States Pharmacopeia. But neither the base<br />
nor the salts di- or tetra-chlorhydrate are in the European<br />
Pharmacopeia. Triethylène tetramine tetrachlorhydrate, used by<br />
AGEPS now as matural, is more soluble then triethylene tetramine<br />
dichlorhydrate. It is administred to patients with Wilson’s disease,<br />
which results from a congenital lack <strong>of</strong> the copper metabolism.<br />
A quantitative purity test <strong>of</strong> this drug by automated multiple<br />
development high-performance thin-layer chromatography is<br />
developed and validated. The validation parameters tested are<br />
specifically characterized by retention factor, linearity, limits <strong>of</strong><br />
detection and quantitation <strong>of</strong> several nanograms, reliability, and<br />
accuracy. To determine impurities, the monography <strong>of</strong><br />
triethylenetetramine dichlorhydrate in the American Pharmacopeia<br />
is tested. This method in classic developing tank requires two<br />
mobile phases and is not quantitative. Assays in high-performance<br />
liquid chromatography with a different column and mobile phase<br />
did not give good results for the separation <strong>of</strong> impurities. Thus, it is<br />
not possible to perform comparative validation <strong>of</strong> the separation <strong>of</strong><br />
the impurities. Only the assay <strong>of</strong> triethylenetetramine with<br />
potentiometer detection has been validated.<br />
Introduction<br />
Capsules containing 150 mg <strong>of</strong> triethylenetetramine (TETA)<br />
tetrachlorhydrate (4 HCL) are part <strong>of</strong> the orphan drugs arsenal.<br />
The currently admitted criteria for this class <strong>of</strong> drugs are a prevalence<br />
<strong>of</strong> less than or equal to 0.05%, the absence <strong>of</strong> an alternative<br />
therapy, or a life-threatening situation (1).<br />
This drug is used as second intent in Wilson’s disease (after a<br />
failure <strong>of</strong> or intolerance to D-penicillamine). The disorder is<br />
characterized by defective copper elimination, resulting in the<br />
accumulation <strong>of</strong> the metal, first in the liver and then in many<br />
organs (brain, eye, etc.). If the disease is not treated in time, its<br />
* Author to whom correspondence should be addressed: email Chantal.dauphin@eps.aphp.fr.<br />
course is systematically fatal. This chronic disease requires treatment<br />
for the patient’s entire life.<br />
The aim <strong>of</strong> the present work was to guarantee the quality and<br />
safety <strong>of</strong> a starting material intended to be used as a medicine<br />
preparation after its pharmaceutical preparation.<br />
The impurities to be detected in the starting material are<br />
described in the United States Pharmacopoeia (2). An automated<br />
multiple development (AMD) method is used for this detection.<br />
Experimental<br />
To determine impurities, the monography <strong>of</strong> TETA dichlorhydrate<br />
in the American Pharmacopeia was tested. This method in<br />
classic developing tank requires two mobile phases and is not<br />
quantitative.<br />
Assays in high-performance liquid chromatography (HPLC)<br />
with differents columns and mobile phases did not give good<br />
results for the separation <strong>of</strong> impurities; thus, it was not possible<br />
to perform comparative validation <strong>of</strong> the separation <strong>of</strong> the impurities.<br />
Therefore, an AMD method was used for separation <strong>of</strong><br />
these impurities.<br />
Only the assay <strong>of</strong> TETA 4 HCl by complexometry with copper<br />
in the presence <strong>of</strong> sodium hydrogenocarbonate with potentiometric<br />
detection, has been validated.<br />
Reagents<br />
All reagents used were analytical grade. Methanol and acetonitrile<br />
were from Carlo Erba (Milan, Italy). Ammonia (25%) used<br />
to prepare the mobile phase was obtained were from Merck<br />
(Darmstadt, Germany). Ninhydrin to prepare the dilute solution<br />
R1 according to the European Pharmacopoeia (3) was obtained<br />
by Fluka (Buchs, Switzerland). TETA 4 HCL references were<br />
obtained from Seratech (Gottingen, Germany) and Aldrich<br />
(Milwaukee, WI) as were impurity references: diethylenetriamine<br />
(impurity B), 1-(2-aminoethyl) piperazine (impurity C),<br />
tris (2-aminoethyl) amine (impurity D), and non-fluorescent (10<br />
× 20-cm) silica gel 60 high-performance thin-layer chromatography<br />
(HPTLC) plates were from Merck.<br />
Reproduction (photocopying) <strong>of</strong> editorial content <strong>of</strong> this journal is prohibited without publisher’s permission.<br />
315
Equipment<br />
The automatic sample applicator (TLC applicator AS 30), the<br />
densitometer for quantitative analysis (CD60 Densitometer), and<br />
the videodensitometry system were all purchased from DESAGA<br />
GmbH (Heidelberg, Germany). The visualization reagent<br />
spraying system was provided by Merck. The AMD chamber and<br />
the hot plate were from Camag (Muttenz, Switzerland)<br />
Method<br />
Preparation <strong>of</strong> impurities solutions<br />
Standard A was prepared by dissolving an accurately weighed<br />
quantity <strong>of</strong> TETA 4 HCL in methanol to obtain a solution containing<br />
15 mg/mL.<br />
Standard B was prepared by dissolving an accurately weighed<br />
quantity <strong>of</strong> diethylenetriamine in methanol to obtain a solution<br />
containing 1.0 mg per mL. Then 10 mL <strong>of</strong> this solution was<br />
transferred to a 100-mL volumetric flask, diluted with methanol<br />
to volume, and mixed.<br />
Standard C was prepared by dissolving an accurately weighed<br />
quantity <strong>of</strong> 1-(2-amino ethyl) piperazine in methanol to obtain a<br />
solution containing 1.0 mg/mL. Then 10 mL <strong>of</strong> this solution was<br />
transferred to a 100-mL volumetric flask, diluted with methanol,<br />
and mixed.<br />
Standard D was prepared by dissolving an accurately weighed<br />
quantity <strong>of</strong> tris(2-amino ethyl) amine in methanol to obtain a<br />
solution containing 1.0 mg per mL. Then 10 mL <strong>of</strong> this solution<br />
was transferred to a 100-mL volumetric flask, diluted with<br />
methanol, and mixed.<br />
Sample application<br />
Bands were 5 mm wide, separated by a 10 mm space. The<br />
spraying rate was 5 µL/min for a volume <strong>of</strong> 3 µL per deposit. If<br />
several deposits were superimposed, there was a 10 s wait<br />
between each application.<br />
Development<br />
The AMD chamber is used to carry out automatic migration.<br />
In comparison to a conventional closed chamber, it avoids the<br />
need to visually monitor during development. All parameters can<br />
be programmed (4), such as: preparation, the chamber is saturated<br />
with 25% ammonia; development distance, 18-step isocratic<br />
development with a 3 mm increment; and predetermined<br />
drying time, after each step, drying time was 3 min for the first<br />
Table I. AMD-Step Gradient<br />
316<br />
Step Time(mn) Step Time(mn)<br />
1 0.2 10 3.1<br />
2 0.5 11 3.5<br />
3 0.8 12 4.0<br />
4 1.0 13 4.5<br />
5 1.3 14 5.0<br />
6 1.6 15 5.7<br />
7 1.9 16 6.5<br />
8 2.3 17 7.2<br />
9 2.7 18 8.0<br />
<strong>Journal</strong> <strong>of</strong> <strong>Chromatographic</strong> <strong>Science</strong>, Vol. 45, July 2007<br />
four steps and 4 min for the rest.<br />
After the completion <strong>of</strong> development, the plate was dried and<br />
protected in the chamber until it removed (Table I).<br />
Mobile phase<br />
The mobile phase was a freshly prepared mixture <strong>of</strong> methanol–ultrapure<br />
water–acetonitrile (5:1:4, v/v/v) (5).<br />
Visualization<br />
After development, the plate was removed from the chamber<br />
and dried in an oven at approximately 100°C for 15 min. This<br />
parameter is important for the maximal elimination <strong>of</strong> the<br />
mobile phase from the stationary phase. Visualization was performed<br />
by spraying with dilute ninhydrin R1 in a ventilated<br />
hood. After spraying, the plate was placed on a 105°C hot plate<br />
for 5 min. Spots <strong>of</strong> the different impurities and <strong>of</strong> the TETA 4<br />
HCL were violet on a white to slightly yellow background.<br />
Results<br />
Quantitation by densitometry<br />
Scanning photodensitometry was then used to measure the<br />
intensities <strong>of</strong> spots at 510 nm using plate background as a reference<br />
(4,5). Peak area was calculated with the CD 60 s<strong>of</strong>tware<br />
included in the quantitation system. The s<strong>of</strong>tware calculates a<br />
linear regression coefficient that does not pass through the<br />
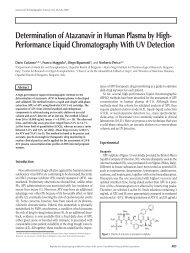
Figure 1. TETA chromatogram and impurities.
<strong>Journal</strong> <strong>of</strong> <strong>Chromatographic</strong> <strong>Science</strong>, Vol. 45, July 2007<br />
origin (particularly <strong>of</strong> planar chromatography). The quantity <strong>of</strong><br />
impurities deposited is determined versus the measured peak<br />
area.<br />
Validation <strong>of</strong> the method<br />
Validation <strong>of</strong> the assay method by HPLC described in the literature<br />
(6,7) was used. Validation was based on verifying several<br />
criteria: specificity, sensitivity (limits <strong>of</strong> detection and quantitation),<br />
linearity, reliability, and accuracy. For reasons <strong>of</strong> simplification,<br />
the impurities are called B, C, and D (as described in the<br />
Reagents section)<br />
Specificity<br />
The TLC method developed enabled the separation <strong>of</strong> TETA, 4<br />
HCL, and three impurities resulting from the synthesis process<br />
(Figure 1).<br />
The following retention factor (R f) values are obtained: TETA<br />
(4 HCL), R f = 0.61 (CV = 0.68%); impurity B, R f = 0.74 (CV =<br />
0.52%); impurity C, R f = 0.90 (CV = 0.37%); and impurity D, R f<br />
= 0.09 (CV = 3.63%)<br />
Sensitivity<br />
The limits <strong>of</strong> detection were 27.5 ng for impurity B, 7.5 ng for<br />
impurity C and 3.5 ng for impurity D.<br />
The limits <strong>of</strong> quantitation was 90.75 ng for impurity B, 24.75<br />
ng for impurity C, and 11.55 ng for impurity D.<br />
Table II. Linearity Parameters<br />
Table IV. Accuracy<br />
Impurity B Impurity C Impurity D<br />
Correlation coefficients<br />
Day 1 0.986 0.997 0.996<br />
Day 2 0.983 0.999 0.991<br />
Day 3 0.986 0.995 0.996<br />
Linearity intervals<br />
96 à 192 ng 24 à 120 ng 12 à 96 ng<br />
Regression linears<br />
y = 4.9x – 285 y = 2.37x + 18.44 y = 4.63x + 74.97<br />
Table III. Reliability Parameters<br />
Variation coefficient Variation coefficient<br />
<strong>of</strong> repeatability (%) <strong>of</strong> intermediate reliability (%)<br />
Impurity B 4.94 5.63<br />
Impurity C 4.44 5.31<br />
Impurity D 4.56 6.44<br />
Mean recovery (%) Confidence intervals (%)<br />
Impurity B 102.16 97.57 à 104.75<br />
Impurity C 103.31 100.87 à 105.75<br />
Impurity D 106.55 103.6 à 109.5<br />
Linearity<br />
Linearity was determined using a 5-point range prepared just<br />
before use. The test was run over 3 days at one series per day<br />
(Table II). The correlation coefficients, the linearity intervals, and<br />
the linear regression were determined for each impurity.<br />
Reliability<br />
Reliability expresses the degree <strong>of</strong> consistency between a series<br />
<strong>of</strong> determinations made on several aliquots <strong>of</strong> the same homogeneous<br />
sample in defined conditions.<br />
Determining reliability is the same as determining the<br />
repetability <strong>of</strong> the method, established by seven assays <strong>of</strong> the<br />
mid-point <strong>of</strong> the range and intermediate reliability with the same<br />
range point over three days.<br />
After verifying the homogeneity <strong>of</strong> variances between the different<br />
days, the coefficients <strong>of</strong> variation <strong>of</strong> repetability were calculated<br />
for each <strong>of</strong> the three impurities (Table III).<br />
Accuracy<br />
Accuracy was conducted with linear regression data (i.e., it<br />
was determined by carrying out three series <strong>of</strong> seven applications<br />
<strong>of</strong> a reference solution <strong>of</strong> each <strong>of</strong> the impurities in the mid-point<br />
range). Mean recovery and confidence intervals determined for<br />
each <strong>of</strong> the impurities are listed in Table IV.<br />
Discussion<br />
The choice <strong>of</strong> planar chromatography was a good one because<br />
this technique easily gets around the detection problem related<br />
to the lack <strong>of</strong> absorbance <strong>of</strong> TETA 4 HCL and <strong>of</strong> the three impurities<br />
in the UV by use <strong>of</strong> a visualization reagent (ninhydrin solution<br />
R1).<br />
Statistical parameters determined during validation were<br />
entirely acceptable for the detection and quantitation <strong>of</strong> the<br />
three impurities resulting from the synthesis process. Linearity<br />
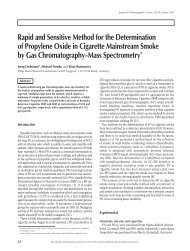
Figure 2. Study <strong>of</strong> TETA chromatogram batch after and before purification.<br />
317
was good, in particular for impurities C and D (correlation factor<br />
> 0.99) and somewhat less for impurity B (correlation factor ><br />
0.98). This results from the greater diffusion <strong>of</strong> the spot that<br />
reduces its sharpness and, thus, leads to a relatively high limit <strong>of</strong><br />
detection (approximately 27 ng), while those <strong>of</strong> impurities C and<br />
D were 7.5 and 3.5 ng. Reliability and accuracy were acceptable,<br />
even though the technique tended to slightly overestimate the<br />
quantities <strong>of</strong> impurities applied to the plate. The regression lines<br />
calculated on days 1, 2, and 3 differed by their slopes and Y-intercepts.<br />
The observed differences show that the method is not very<br />
rugged and is entirely predictable in planar chromatography.<br />
Even so, this drawback can be addressed if a calibration range is<br />
run with each HPTLC assay plate.<br />
The method was used to detect the synthesis <strong>of</strong> impurities in a<br />
batch <strong>of</strong> TETA 4 HCL destined to manufacture the medicinal<br />
preparation; none <strong>of</strong> the three impurities could be detected.<br />
When the same starting material was analyzed before purification,<br />
however, impurities were detected, in particular, 1-(2aminoethyl)piperazine.<br />
Its level was high, exceeding the high<br />
point <strong>of</strong> the calibration range (> 0.8% <strong>of</strong> the unpurified starting<br />
material). Traces <strong>of</strong> diethylenetriamine were detected, but could<br />
not be quantitated (Figure 2).<br />
Conclusion<br />
The method developed was valid for purity testing, a stability<br />
indicating assay. Validation <strong>of</strong> this method showed that it is specific,<br />
linear, reliable, and accurate (although slightly overestimated),<br />
but the sensitivity was moderate for one <strong>of</strong> the three<br />
impurities sought (diethylenetriamine). This methodology is<br />
318<br />
well suited for monitoring the purification <strong>of</strong> manufactured<br />
batches in order to comply with ICH recommendations concerning<br />
levels <strong>of</strong> impurities (8).<br />
Reference<br />
<strong>Journal</strong> <strong>of</strong> <strong>Chromatographic</strong> <strong>Science</strong>, Vol. 45, July 2007<br />
1. V. Acar, F. Tacco, B. Sarrut, A. Tibi, C. Broissand, and D. Pradeau.<br />
Les mesures réglementaires en faveur des médicaments orphelins<br />
aux Etats-Unis et au Japon:une source d’inspiration pour l’Europe.<br />
Le Pharmacien Hospitalier 34(136): 31–36 (1999).<br />
2. The United States Pharmacopeia. The United States Pharmacopeia,<br />
28rd Edition. The United States Pharmacopeia, Rockville, MD,<br />
2005. 1973–74.<br />
3. Pharmacopée Européenne. Pharmacopée Européenne. Vème édition,<br />
Strasbourg, Germany, 2005.<br />
4. D. Pradeau, J. Rabiant, C. Bernard, P.A. Compagnon, C. Dauphin,<br />
D.E.R. Richter, R. Hocquemiller, J.J. Minet, D. Reisdorf, and<br />
C. Sarbach. Nouvelles perspectives en chromatographie planaire :<br />
méthodes générales. Rapport d’une commission SFSTP. STP Pharma<br />
Pratiques 8(6): 451–64 (1998).<br />
5. S. Nyierdy, K. Dallenbach-Tolke, O. Sticher. The “prisma” optimization<br />
system in planare chromatography. J. Planar Chromatogr. 1:<br />
336–42 (1988).<br />
6. J. Caporal-Gautier, J.M. Nivet, P. Algranti, M. Guilloteau, M. Histe,<br />
M. Lallier, J.J. N’Guyen-Huu, and R. Russoto. Guide de validation<br />
analytique. Rapport d’une commission SFSTP. I. Méthodologie. STP<br />
Pharma Pratiques 2(4): 205–26 (1992).<br />
7. J. Caporal-Gautier, J.M. Nivet, P. Algranti, M. Guilloteau, M. Histe,<br />
M. Lallier, J.J. N’Guyen-Huu, and R. Russoto. Guide de validation<br />
analytique. Rapport d’une commission SFSTP. II. Exemples d’application.<br />
STP Pharma Pratiques 2(4): 227–39 (1992).<br />
8. Guideline ICH Impurities in New Drug Substances.<br />
CPMP/ICH/282/95, Décembre 1995.<br />
Manuscript received April 12, 2006;<br />
revision received November 30, 2006.