Neural Models of Bayesian Belief Propagation Rajesh ... - Washington
Neural Models of Bayesian Belief Propagation Rajesh ... - Washington
Neural Models of Bayesian Belief Propagation Rajesh ... - Washington

You also want an ePaper? Increase the reach of your titles
YUMPU automatically turns print PDFs into web optimized ePapers that Google loves.
11.5 Discussion 261<br />
50%<br />
100%<br />
D<br />
0.05<br />
0.05<br />
0<br />
E<br />
A<br />
0<br />
<strong>Neural</strong><br />
Activity<br />
0.1<br />
0<br />
−0.1<br />
0.1<br />
0<br />
−0.1<br />
65% (Leftward)<br />
0.05<br />
0<br />
d L<br />
d<br />
R<br />
0.1<br />
0<br />
−0.1<br />
300<br />
50 100 150<br />
200 250 300<br />
Time (no. <strong>of</strong> time steps) Time (no. <strong>of</strong> time steps)<br />
50 100 150 200 250 300<br />
0 150<br />
0<br />
B<br />
0 100 200<br />
Time from stimulus (ms)<br />
F<br />
<strong>Neural</strong><br />
Activity<br />
75% (Rightward)<br />
0.05<br />
0<br />
d<br />
R<br />
30%<br />
−0.05<br />
(Leftward)<br />
−0.05<br />
50 100 150 200<br />
0 150<br />
−0.05<br />
250 300<br />
300 0<br />
50<br />
60%<br />
−0.05<br />
100 150 200 250 300<br />
150 300 0<br />
50<br />
90%<br />
100 150 200 250 300<br />
150 300<br />
Time (no. <strong>of</strong> time steps)<br />
70 51.2% 25.6%<br />
c<br />
50<br />
30<br />
d L<br />
C<br />
0 400 800<br />
Time from<br />
motion onset (ms)<br />
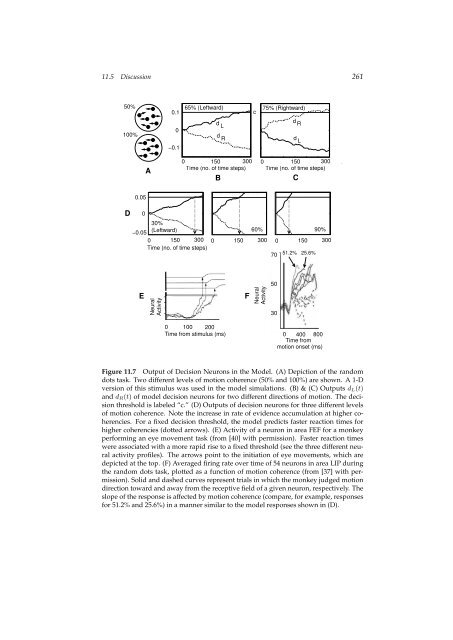
Figure 11.7 Output <strong>of</strong> Decision Neurons in the Model. (A) Depiction <strong>of</strong> the random<br />
dots task. Two different levels <strong>of</strong> motion coherence (50% and 100%) are shown. A 1-D<br />
version <strong>of</strong> this stimulus was used in the model simulations. (B) & (C) Outputs dL(t)<br />
and dR(t) <strong>of</strong> model decision neurons for two different directions <strong>of</strong> motion. The decision<br />
threshold is labeled “c.” (D) Outputs <strong>of</strong> decision neurons for three different levels<br />
<strong>of</strong> motion coherence. Note the increase in rate <strong>of</strong> evidence accumulation at higher coherencies.<br />
For a fixed decision threshold, the model predicts faster reaction times for<br />
higher coherencies (dotted arrows). (E) Activity <strong>of</strong> a neuron in area FEF for a monkey<br />
performing an eye movement task (from [40] with permission). Faster reaction times<br />
were associated with a more rapid rise to a fixed threshold (see the three different neural<br />
activity pr<strong>of</strong>iles). The arrows point to the initiation <strong>of</strong> eye movements, which are<br />
depicted at the top. (F) Averaged firing rate over time <strong>of</strong> 54 neurons in area LIP during<br />
the random dots task, plotted as a function <strong>of</strong> motion coherence (from [37] with permission).<br />
Solid and dashed curves represent trials in which the monkey judged motion<br />
direction toward and away from the receptive field <strong>of</strong> a given neuron, respectively. The<br />
slope <strong>of</strong> the response is affected by motion coherence (compare, for example, responses<br />
for 51.2% and 25.6%) in a manner similar to the model responses shown in (D).