Student response to Mangahigh - PDST
Student response to Mangahigh - PDST
Student response to Mangahigh - PDST
You also want an ePaper? Increase the reach of your titles
YUMPU automatically turns print PDFs into web optimized ePapers that Google loves.
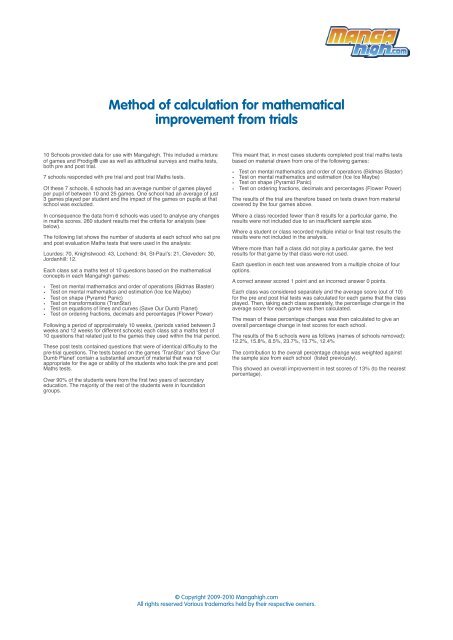
Method of calculation for mathematical<br />
improvement from trials<br />
10 Schools provided data for use with <strong>Mangahigh</strong>. This included a mixture<br />
of games and Prodigi® use as well as attitudinal surveys and maths tests,<br />
both pre and post trial.<br />
7 schools responded with pre trial and post trial Maths tests.<br />
Of these 7 schools, 6 schools had an average number of games played<br />
per pupil of between 10 and 25 games. One school had an average of just<br />
3 games played per student and the impact of the games on pupils at that<br />
school was excluded.<br />
In consequence the data from 6 schools was used <strong>to</strong> analyse any changes<br />
in maths scores. 260 student results met the criteria for analysis (see<br />
below).<br />
The following list shows the number of students at each school who sat pre<br />
and post evaluation Maths tests that were used in the analysis:<br />
Lourdes: 70, Knighstwood: 43, Lochend: 84, St-Paulʼs: 21, Cleveden: 30,<br />
Jordanhill: 12.<br />
Each class sat a maths test of 10 questions based on the mathematical<br />
concepts in each <strong>Mangahigh</strong> games:<br />
• Test on mental mathematics and order of operations (Bidmas Blaster)<br />
• Test on mental mathematics and estimation (Ice Ice Maybe)<br />
• Test on shape (Pyramid Panic)<br />
• Test on transformations (TranStar)<br />
• Test on equations of lines and curves (Save Our Dumb Planet)<br />
• Test on ordering fractions, decimals and percentages (Flower Power)<br />
Following a period of approximately 10 weeks, (periods varied between 3<br />
weeks and 12 weeks for different schools) each class sat a maths test of<br />
10 questions that related just <strong>to</strong> the games they used within the trial period.<br />
These post tests contained questions that were of identical difficulty <strong>to</strong> the<br />
pre-trial questions. The tests based on the games ʻTranStarʼ and ʻSave Our<br />
Dumb Planetʼ contain a substantial amount of material that was not<br />
appropriate for the age or ability of the students who <strong>to</strong>ok the pre and post<br />
Maths tests.<br />
Over 90% of the students were from the first two years of secondary<br />
education. The majority of the rest of the students were in foundation<br />
groups.<br />
This meant that, in most cases students completed post trial maths tests<br />
based on material drawn from one of the following games:<br />
• Test on mental mathematics and order of operations (Bidmas Blaster)<br />
• Test on mental mathematics and estimation (Ice Ice Maybe)<br />
• Test on shape (Pyramid Panic)<br />
• Test on ordering fractions, decimals and percentages (Flower Power)<br />
The results of the trial are therefore based on tests drawn from material<br />
covered by the four games above.<br />
Where a class recorded fewer than 8 results for a particular game, the<br />
results were not included due <strong>to</strong> an insufficient sample size.<br />
Where a student or class recorded multiple initial or final test results the<br />
results were not included in the analysis.<br />
Where more than half a class did not play a particular game, the test<br />
results for that game by that class were not used.<br />
Each question in each test was answered from a multiple choice of four<br />
options.<br />
A correct answer scored 1 point and an incorrect answer 0 points.<br />
Each class was considered separately and the average score (out of 10)<br />
for the pre and post trial tests was calculated for each game that the class<br />
played. Then, taking each class separately, the percentage change in the<br />
average score for each game was then calculated.<br />
The mean of these percentage changes was then calculated <strong>to</strong> give an<br />
overall percentage change in test scores for each school.<br />
The results of the 6 schools were as follows (names of schools removed):<br />
12.2%, 15.8%, 8.5%, 23.7%, 13.7%, 12.4%<br />
The contribution <strong>to</strong> the overall percentage change was weighted against<br />
the sample size from each school (listed previously).<br />
© Copyright 2009-2010 <strong>Mangahigh</strong>.com<br />
All rights reserved Various trademarks held by their respective owners.<br />
This showed an overall improvement in test scores of 13% (<strong>to</strong> the nearest<br />
percentage).


