2. Urbanization and Economic Development
2. Urbanization and Economic Development
2. Urbanization and Economic Development

Create successful ePaper yourself
Turn your PDF publications into a flip-book with our unique Google optimized e-Paper software.
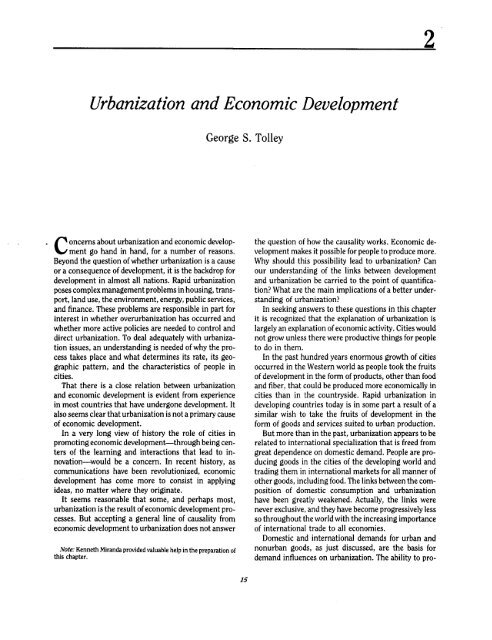
<strong>Urbanization</strong> <strong>and</strong> <strong>Economic</strong> <strong>Development</strong><br />
George S. Tolley<br />
oncerns about urbanization <strong>and</strong> economic develop- the question of how the causality works. <strong>Economic</strong> de-<br />
_ ment go h<strong>and</strong> in h<strong>and</strong>, for a number of reasons. velopment makes it possible for people to produce more.<br />
Beyond the question of whether urbanization is a cause Why should this possibility lead to urbanization? Can<br />
or a consequence of development, it is the backdrop for our underst<strong>and</strong>ing of the links between development<br />
development in almost all nations. Rapid urbanization <strong>and</strong> urbanization be carried to the point of quantificaposes<br />
complex management problems in housing, trans- tion? What are the main implications of a better underport,<br />
l<strong>and</strong> use, the environment, energy, public services, st<strong>and</strong>ing of urbanization?<br />
<strong>and</strong> finance. These problems are responsible in part for In seeking answers to these questions in this chapter<br />
interest in whether overurbanization has occurred <strong>and</strong> it is recognized that the explanation of urbanization is<br />
whether more active policies are needed to control <strong>and</strong> largely an explanation of economic activity. Cities would<br />
direct urbanization. To deal adequately with urbaniza- not grow unless there were productive things for people<br />
tion issues, an underst<strong>and</strong>ing is needed of why the pro- to do in them.<br />
cess takes place <strong>and</strong> what determines its rate, its geo- In the past hundred years enormous growth of cities<br />
graphic pattern, <strong>and</strong> the characteristics of people in occurred in the Western world as people took the fruits<br />
cities. of development in the form of products, other than food<br />
That there is a close relation between urbanization <strong>and</strong> fiber, that could be produced more economically in<br />
<strong>and</strong> economic development is evident from experience cities than in the countryside. Rapid urbanization in<br />
in most countries that have undergone development. It developing countries today is in some part a result of a<br />
also seems clear that urbanization is not a primary cause similar wish to take the fruits of development in the<br />
of economic development. form of goods <strong>and</strong> services suited to urban production.<br />
In a very long view of history the role of cities in But more than in the past, urbanization appears to be<br />
promoting economic development-through being cen- related to international specialization that is freed from<br />
ters of the learning <strong>and</strong> interactions that lead to in- great dependence on domestic dem<strong>and</strong>. People are pronovation-would<br />
be a concern. In recent history, as ducing goods in the cities of the developing world <strong>and</strong><br />
communications have been revolutionized, economic trading them in international markets for all manner of<br />
development has come more to consist in applying other goods, including food. The links between the comideas,<br />
no matter where they originate. position of domestic consumption <strong>and</strong> urbanization<br />
It seems reasonable that some, <strong>and</strong> perhaps most, have been greatly weakened. Actually, the links were<br />
urbanization is the result of economic development pro- never exclusive, <strong>and</strong> they have become progressively less<br />
cesses. But accepting a general line of causality from so throughout the world with the increasing importance<br />
economic development to urbanization does not answer of international trade to all economies.<br />
Domestic <strong>and</strong> international dem<strong>and</strong>s for urban <strong>and</strong><br />
Note: Kenneth Mir<strong>and</strong>a provided valuable help in the preparation of<br />
this chapter.<br />
nonurban goods, as just discussed, are the basis for<br />
dem<strong>and</strong> influences on urbanization. The ability to pro-<br />
15<br />
2
16 George S. Tolley<br />
duce more urban <strong>and</strong> nonurban goods acts to increase income <strong>and</strong> the relative prices of the two types of goods.<br />
abundance <strong>and</strong> is a supply consideration. Population These factors are in turn influenced by supply condigrowth<br />
results in growth of human inputs <strong>and</strong> is like- tions. The total resources of an economy are devoted to<br />
wise a supply consideration. Many of the puzzles of either urban or nonurban activities. The amounts of<br />
urbanization can be understood by analyzing how these output of the two types of activities depend on how the<br />
dem<strong>and</strong> <strong>and</strong> supply influences interact. The dem<strong>and</strong> <strong>and</strong> available resources are split between them <strong>and</strong> on prosupply<br />
influences provide headings under which urban- duction considerations that determine how much of<br />
ization is analyzed in this chapter. each type of output can be obtained from a given amount<br />
A traditional model of urbanization, appropriate to of resources.<br />
closed economies, is considered first. Relations between Over time the total number of persons working in the<br />
urban <strong>and</strong> nonurban productivity, income elasticities of economy may grow, <strong>and</strong> for both urban <strong>and</strong> nonurban<br />
dem<strong>and</strong>, <strong>and</strong> population growth as determinants of activities the amount of output that can be obtained for a<br />
urbanization are analyzed. Then urbanization is con- given amount of inputs may increase. Given the insidered<br />
in a more general setting, with international creases in the number of persons, in the total stock of<br />
trade. Attempts are made to distinguish between first- capital in the economy, <strong>and</strong> in productivities, the reorder<br />
<strong>and</strong> second-order effects for countries that are sponses to the dem<strong>and</strong> <strong>and</strong> supply changes that occur<br />
price takers in world markets. One of the conclusions during economic growth will determine changes in the<br />
from the resulting model, which is applicable to most allocation of resources between urban <strong>and</strong> nonurban<br />
countries, is that greater urban productivity leads to activities.<br />
more urbanization rather than (as in the traditional The view that urbanization accompanies economic<br />
model) less. Symmetrically, <strong>and</strong> again contrary to the development implies that the dem<strong>and</strong> <strong>and</strong> supply<br />
traditional model, greater nonurban productivity leads changes are such that increasing urbanization in fact<br />
to less urbanization. results. Why is this, <strong>and</strong> is it necessarily to be expected?<br />
The model is applied to sixty-six developing econo- The explanation of urbanization has been best explored<br />
mies, leading to explanations of the degree of urbaniza- for the high-income Western countries which have extion<br />
in each economy in terms of growth in urban perienced dramatic declines in the proportion of people<br />
productivity, nonurban productivity, <strong>and</strong> population. working in agriculture <strong>and</strong> in this sense have become<br />
The use of the framework developed in this chapter to the most fully urbanized. The received explanation of<br />
further deepen underst<strong>and</strong>ing of urbanization in indi- this result centers on one element on the dem<strong>and</strong> side<br />
vidual countries is discussed, <strong>and</strong> some important policy<br />
implications are noted.<br />
<strong>and</strong> one on the supply side.<br />
Income Elasticities of Dem<strong>and</strong><br />
Dem<strong>and</strong> <strong>and</strong> Supply Factors The element on the dem<strong>and</strong> side is income elasticity<br />
of dem<strong>and</strong>. Because of the low income elasticity of de-<br />
A first step toward an underst<strong>and</strong>ing of urbanization m<strong>and</strong> for agricultural products-say, 0.10 to 0.20is<br />
to consider the underlying dem<strong>and</strong> <strong>and</strong> supply condi- people are viewed as choosing to spend an increasing<br />
tions that determine how the resources of an economy proportion of income on urban products as per capita<br />
are divided between urban <strong>and</strong> nonurban activities. A income rises. The low income elasticity of dem<strong>and</strong> for<br />
first approximation is to associate nonurban activities agricultural products has thus been cited as one of the<br />
with agriculture <strong>and</strong> urban activities with industry <strong>and</strong> principal reasons why a society devotes more <strong>and</strong> more<br />
other nonagricultural pursuits. The distinction ignores of its resources to nonagricultural pursuits <strong>and</strong> thus<br />
nonagricultural production by farm households <strong>and</strong> in- becomes more highly urbanized. Since people must<br />
dustry in rural areas, <strong>and</strong> it begs the question of exactly spend all their income on either urban or nonurban<br />
how urban is defined-that is, whether small towns are commodities (where commodities are comprehensively<br />
urban or rural <strong>and</strong> where the dividing line between defined to include both consumption goods <strong>and</strong> the<br />
urban <strong>and</strong> nonurban phenomena lies. Although the dis- capital goods on which savings are spent), the income<br />
tinction is not perfect, the discussion here proceeds on elasticity of dem<strong>and</strong> for agricultural (nonurban) comthe<br />
assumption that some degree of approximation is modities can be translated into an income elasticity for<br />
inevitable <strong>and</strong> that nonurban situations in most parts of urban commodities. If all income elasticities are unity, a<br />
the world are overwhelmingly agricultural. 1 percent increase in income leads to a 1 percent in-<br />
Dem<strong>and</strong> conditions determine how people split their crease in expenditures on every commodity. If the inincome<br />
between urban <strong>and</strong> nonurban products. Impor- come elasticity for some commodities is less than unity,<br />
tant factors in the allocation of income are the level of expenditures on them will rise by less than 1 percent <strong>and</strong>
<strong>Urbanization</strong> <strong>and</strong> <strong>Economic</strong> <strong>Development</strong> 17<br />
the income left over will enable expenditures on other commodities rises or falls during development depends<br />
commodities to rise by more than 1 percent. Thus, if the on which effect predominates.<br />
income elasticity for nonurban products is less than It is conceivable that the income elasticity for urban<br />
unity, the income elasticity for urban products will be commodities is low during the early stages of developgreater<br />
than unity. ment, rises to a peak during a middle period, <strong>and</strong> falls at<br />
The balance of income elasticities above <strong>and</strong> below the later stages. If so, there will be a tendency for the rate<br />
unity depends on the relative amounts of expenditure on of urbanization to start out low, rise to a peak, <strong>and</strong> fall to<br />
each kind of commodity. A well-known condition is that a low rate. The first column of table 2-1 shows various<br />
the expenditure-weighted sum of income elasticities values of the income elasticity of nonurban commodities<br />
over all commodities is equal to unity. For example, if 20 <strong>and</strong> the second column shows accompanying percentpercent<br />
of expenditures are for nonurban commodities ages of expenditures on those commodities that might<br />
<strong>and</strong> 80 percent for urban commodities, <strong>and</strong> if the in- be observed. The third column shows the income elascome<br />
elasticity of dem<strong>and</strong> for agricultural products is ticity of dem<strong>and</strong> for urban commodities that results<br />
0.10, then the income elasticity for urban products is from these combinations, as derived from the formula<br />
1.225, implying a 1.225 percent increase in expenditures for -9, above. The entries in the table progress from the<br />
on urban products for every 1 percent increase in in- top row, which corresponds to conditions that might be<br />
come. To obtain this result, note that the weighted encountered in the initial stages of development, to<br />
income elasticity condition is w11 11 + WaT-a = 1, where intermediate situations (the middle of the table), to<br />
the ws are the urban <strong>and</strong> nonurban expenditure weights advanced development (the last row).<br />
<strong>and</strong> %1 <strong>and</strong> q, are the income elasticities. The solu- In the first row the income elasticity of dem<strong>and</strong> for<br />
tion of the income elasticity for urban products, %, is agricultural products is at its high value, unity. The<br />
(1 - waTja)IWu, or, with the numbers in the example, income elasticity of dem<strong>and</strong> for urban products is then<br />
(1 - 0.2 * 0.1)/0.8, or 1.225. also unity, no matter what the expenditure fractions are.<br />
The example is for a high-income country; a different The income elasticity effect would not lead to any relaresult<br />
may be obtained for a low-income country. It is tive urbanization, for it would leave the urban proporgenerally<br />
thought that the income elasticity dem<strong>and</strong> for tion of the population unchanged. In the second set of<br />
agricultural products goes down as income rises. Thus, entries the income elasticity of dem<strong>and</strong> for agricultural<br />
for lower-income countries a higher agricultural in- commodities has fallen to 0.8. Some possible values of<br />
come elasticity implies a lower income elasticity for the expenditure share accompanying this elasticity are<br />
urban commodities <strong>and</strong> hence, other things being equal, shown. If the share of expenditure on agricultural coma<br />
lower rate of urbanization. A country could still experi- modities remains high (80 percent), the income elasticence<br />
urbanization, but the lower income elasticity for ity for urban commodities rises to 1.8; it does not rise as<br />
urban commodities might contribute to a lower rate of much if the expenditure shares are less. In the next set of<br />
urbanization in the early stages of development. entries the income elasticity for agricultural products is<br />
In addition to differences in income elasticities (the 0.5. If the expenditure share has fallen by this time to 50<br />
-qs), another difference between high-income <strong>and</strong> low- percent, the income elasticity of dem<strong>and</strong> for urban comincome<br />
countries-<strong>and</strong> one that operates in the oppo- modities will be 1.5, with higher <strong>and</strong> lower values for<br />
site direction-is the fraction of expenditure devoted to<br />
urban <strong>and</strong> nonurban commodities (the ws). If the fraction<br />
spent on nonurban commodities is high, the weight<br />
different expenditure shares. The last row corresponds<br />
on the income elasticity for nonurban commodities will<br />
also be high. At an early stage of development, when per<br />
Table 2-1. Determinants of Income Elasticity<br />
of Dem<strong>and</strong> for Urban Commodities<br />
capita income is low, a large fraction of income is likely<br />
to be spent on agricultural commodities. The income<br />
elasticity of dem<strong>and</strong> for agricultural commodities will<br />
not be as far below unity as in a high-income country<br />
Income elasticity of<br />
dem<strong>and</strong>, nonurban<br />
commodities<br />
Income spent<br />
on nonurban<br />
commodities<br />
(percent)<br />
Income elasticity of<br />
dem<strong>and</strong> for urban<br />
commodities<br />
<strong>and</strong>, because its weight is greater, it will tend to make 1.0 0-100 1.0<br />
the income elasticity for urban commodities only slight- 0.8 80 1.8<br />
ly above unity. 0.8 50 1.2<br />
As development proceeds, the gradual decline in the 0.8 20 1.05<br />
income elasticity for agricultural commodities will act 0.5 50 1.5<br />
to increase the income elasticity for urban commodities,<br />
while the decline in the agricultural weight will act to<br />
0.5 20 1.125<br />
decrease it. Whether the income elasticity for urban 01 20 1.225
18 George S. Tolley<br />
to the example originally given for a high-income coun- accompanied by increasing specialization of production.<br />
try, with an income elasticity for urban commodities of Indeed, the very possibility of economic development<br />
1.225. has often been based on such specialization. Increasing<br />
Table 2-1 suggests that the income elasticity for urban international specialization is part of a wider process of<br />
commodities will first rise <strong>and</strong> then fall during develop- specialization <strong>and</strong> provides a reason for increasing urment.<br />
If the share of expenditure on agricultural com- banization that is related to economic development.<br />
modities falls only slowly, the income elasticity for Increasing specialization can occur in agricultural as<br />
urban commodities rises longer <strong>and</strong> further than if the well as in urban production. It is conceivable that some<br />
share of expenditures on agriculture falls rapidly. countries could become less rather than more urbanized<br />
In addition to dem<strong>and</strong> conditions within the country, during development, although no prominent example<br />
the proportion of the population which is urbanized will comes to mind. A large part of the internationally traded<br />
be affected by changes in the degree of international portion of agricultural production comes from highspecialization<br />
that occur during development. A country income countries, which are already highly urbanized.<br />
may develop primarily by increasing its output of manu- Growth of domestic dem<strong>and</strong> <strong>and</strong> comparative advantage<br />
factured goods for export to the rest of the world. If in nonagricultural production are more important in<br />
agricultural output does not increase enough to meet explaining urbanization than is specialization in interdomestic<br />
dem<strong>and</strong>, the exports of manufactured goods<br />
will be used in part to pay for increasing imports of<br />
national agricultural trade.<br />
agricultural commodities. As a result, the increase in Su<br />
production of urban commodities will be larger than if pply Factors<br />
there were no changes in the degree of international When attention turns from the dem<strong>and</strong> to the supply<br />
specialization, <strong>and</strong> a smaller fraction of the increased side, concern shifts from changes in output to changes<br />
dem<strong>and</strong> for agricultural commodities will be met from in the numbers of people used to produce the output. If<br />
production inside the economy. The income elasticity human inputs were equally substitutable for physical<br />
for agricultural commodities must be redefined to per- capital in urban <strong>and</strong> in nonurban production activities,<br />
tain only to the percentage increase in domestic agri- <strong>and</strong> if the rates of growth of factor productivity in the<br />
cultural production associated with a 1 percent rise in two types of activities were the same, changes in output<br />
income, <strong>and</strong> increases in output of urban commodities <strong>and</strong> changes in numbers of people would go together<br />
will be larger than implied by domestic elasticities. exactly, <strong>and</strong> the dem<strong>and</strong> considerations already dis-<br />
Changes in the degree of international specialization cussed would suffice to explain the rate of urbanization<br />
may thus accelerate the rate of urbanization during during development. But this is not the case. Conditions<br />
development. vary widely, <strong>and</strong> output per person in production of<br />
Changes in international specialization appear to be urban commodities may rise more or less rapidly than<br />
the rule <strong>and</strong> not the exception during development. for nonurban commodities.<br />
They have been particularly pronounced in such dramat- Traditional explanations have emphasized rapid techic<br />
growth experiences as the "Pacific growth miracles" nological change in agriculture, which leads to more<br />
in which Hong Kong, Japan, Korea, <strong>and</strong> Taiwan all rapid growth of output per agricultural worker as the<br />
experienced rapid development simultaneously with in- major supply consideration that acts in conjunction<br />
creases in output of nonagricultural goods for export. In with low income elasticity of dem<strong>and</strong> to eject resources<br />
these economies <strong>and</strong> in others with similar, although from agriculture. Several considerations other than<br />
less extreme, growth patterns, concern has arisen over technological change, however, affect output per<br />
the loss of agricultural self-sufficiency as imports of worker, as will now be discussed.<br />
agricultural products rise along with the rising output of L<strong>and</strong> scarcity is overrated as a factor that could dethe<br />
economy. A more positive way of looking at the crease output per worker in agriculture. If output did go<br />
decline in agricultural self-sufficiency is to view it as a down, the rate of urbanization would be retarded as<br />
manifestation of gains from international specialization. more workers were kept in agriculture to produce a<br />
It is more economical to produce manufactured goods given agricultural output. This outcome could occur if<br />
<strong>and</strong> exchange them for agricultural products than to growing population pressed seriously against scarce<br />
forgo the additional manufactured output <strong>and</strong> try to l<strong>and</strong> supplies, but the evidence even for the prime examproduce<br />
agricultural products that can be produced ple of a country that might be in these straits-Chinamore<br />
efficiently elsewhere. is unclear. New l<strong>and</strong> has been coming into production in<br />
Although generalizations are hazardous, historically some parts of the world, notably in Latin America. Imeconomic<br />
development has been almost universally provement of the quality of l<strong>and</strong> through investment
<strong>Urbanization</strong> <strong>and</strong> <strong>Economic</strong> <strong>Development</strong> 19<br />
retards declines in output per worker. International be eliminated in nonurban than in urban areas. Here,<br />
specialization has worked against agriculture in many again, countries are not alike. Family <strong>and</strong> home<br />
countries <strong>and</strong> has eased pressure on l<strong>and</strong> supply. businesses abound in many cities, as do small unviable<br />
Agricultural research has effects opposite to those of farming operations in many parts of the world. (Much<br />
scarce l<strong>and</strong> supply. An increase in output per worker in campesino agriculture is of this type.) The important<br />
agriculture permits a given dem<strong>and</strong> to be met with fewer characteristic of traditional production for the purposes<br />
agricultural workers, releases people for urban pursuits, of this discussion is that, in spite of all of its adjustments<br />
<strong>and</strong> increases the rate of urbanization. Even if the in- to relative prices <strong>and</strong> other changes during developcrease<br />
in productivity as a result of agricultural research ment, it is outcompeted by other forms of production.<br />
leads to income growth, workers will be released to During economic development people are released from<br />
urban areas if the income elasticity of dem<strong>and</strong> for the the declining traditional forms of production to other<br />
products whose output is increased is less than unity, as activities. If they are released from traditional employseems<br />
likely. It is also true that the Green Revolution ment in urban areas <strong>and</strong> go into other employment in<br />
<strong>and</strong> other innovations resulting from agricultural re- urban areas, there is no effect on urbanization, but if<br />
search have sometimes been more saving of l<strong>and</strong> <strong>and</strong> they are released from traditional employment in agrirelated<br />
physical inputs than of workers. The effect of cultural areas where there are no exp<strong>and</strong>ing employthese<br />
innovations has in any case been extremely varied ment opportunities, they will seek employment in urban<br />
among <strong>and</strong> within countries, so that it is more than areas, <strong>and</strong> urbanization will increase.<br />
usually difficult to generalize about it. Because of the low amount produced per person in<br />
As development proceeds there is a tendency for more traditional production, a reduction in traditional emof<br />
the inputs used in agriculture to be produced in urban ployment leads to increased output per person. Whether<br />
areas. This phenomenon is part of the increasing spe- output per person rises more in urban or in nonurban<br />
cialization that has already been mentioned <strong>and</strong> appears areas depends on the rate of reduction in traditional<br />
to be speeded up by innovations resulting from agri- production in the two types of areas <strong>and</strong> on its relative<br />
cultural research. Gasoline, feed concentrates, <strong>and</strong> fer- importance in the areas.<br />
tilizers <strong>and</strong> other nutrients are among the inputs pro- Changes in the quality of human inputs through<br />
duced in urban areas that replace inputs formerly education <strong>and</strong> other forms of human capital formation<br />
produced on farms. In addition, home garden plots <strong>and</strong> deserve mention in relation to urbanization. Urbanizahome<br />
food processing decline. tion <strong>and</strong> human capital formation both appear to be<br />
Successful economic development is characterized by responses to factors that lead to economic development,<br />
rising returns to human inputs, resulting in part from rather than urbanization being a primary cause of husubstitution<br />
of capital for labor. These changes may man capital formation or vice versa. Like physical capital<br />
affect urban <strong>and</strong> nonurban production differently. Ur- formation, human capital formation results in increases<br />
banization will be favored if the substitution of capital in output per person <strong>and</strong> allows a given dem<strong>and</strong> to be<br />
for labor is higher in nonurban than in urban produc- fulfilled by fewer people. Given the dem<strong>and</strong>s for urban<br />
tion-another of the circumstances that may differ from <strong>and</strong> for nonurban commodities, a higher rate of increase<br />
one country to another. A large source of the substitu- in human capital per person in nonurban than in urban<br />
tions is replacement of labor-intensive human or animal production will be conducive to a high rate of urbanizasources<br />
of power by machine power, <strong>and</strong> possibilities for tion, since the dem<strong>and</strong> for nonurban commodities can<br />
substitutions abound in nonurban as well as urban pro- be fulfilled by fewer people. The increase in educational<br />
duction. (The mechanization of cotton growing in the levels <strong>and</strong> the growth of skilled <strong>and</strong> professional catego-<br />
United States had wholesale effects on rural-to-urban ries of employment in cities are sometimes thought to<br />
migration <strong>and</strong> profoundly affected American cities.) be necessary conditions for development. Yet farmers<br />
Urban production, which uses readily transferable tech- also become better educated. Nonurban production may<br />
niques from other countries, may offer greater possibili- use a lower amount of human capital per person at the<br />
ties for substitutions, at least in manufacturing indus- early stages of development, <strong>and</strong> the level may remain<br />
tries. But urban production is more intensive than lower through a great part of the development process<br />
nonurban production in services, where capital appears even though human capital per person in nonurban<br />
to be less substitutable for labor. production is continually rising <strong>and</strong> may indeed be ris-<br />
One of the effects of economic development is the ing at a faster rate than in urban production. The faster<br />
gradual elimination of so-called traditional production rise in human capital per person in nonurban than in<br />
in both urban <strong>and</strong> nonurban areas. <strong>Urbanization</strong> will be urban production leads to the hypothesis that increases<br />
speeded if there is more of this traditional production to in nonurban human capital could contribute to a high
20 George S. Tolley<br />
rate of urbanization. This effect, however, may be sec- Considerations that affect output per person are<br />
ondary to the consideration that both urbanization <strong>and</strong> brought in by noting that the percentage increase in<br />
human capital formation are basically results rather output per capita for any commodity is equal to the<br />
than causes of economic development. percentage change in output per person engaged in<br />
production of the commodity plus the percentage<br />
Population change in the proportion of people in the nation engaged<br />
in that production. The second <strong>and</strong> third conditions are<br />
The dem<strong>and</strong> <strong>and</strong> supply considerations discussed so thus ,u = Tu, + hu for urban commodities <strong>and</strong>y 0 = T0<br />
far pertain to the relative rate of urbanization, or urban- + h, for nonurban commodities, where T is percentage<br />
ization per capita, <strong>and</strong> would be sufficient to explain change in output per person engaged in production <strong>and</strong><br />
urban growth in a country with stable population. Grow- n is percentage change in the proportion of people ening<br />
total population provides a kicker to both urban <strong>and</strong> gaged in production. The second <strong>and</strong> third conditions<br />
nonurban population growth. The rapid population follow from differentiation of the identity that output<br />
growth rates in some parts of the world mean that much equals number of workers times output per worker. The<br />
urbanization comes simply from the fact that there are fourth condition is that any change in the urban promore<br />
people in the country. portion of the population must be accompanied by<br />
an equal <strong>and</strong> opposite change in the nonurban propor-<br />
The Traditional Model of <strong>Urbanization</strong> tion. In percentage terms the fourth condition is k1<br />
The discussion has considered the role of the income<br />
= - (Na IN,1 )ia, where N0 <strong>and</strong> N11 are the numbers of<br />
persons in nonurban <strong>and</strong> urban areas. The four conelasticities<br />
of dem<strong>and</strong> in determining urbanization, the<br />
factors that affect output per person in each sector, <strong>and</strong><br />
the role of total population growth. The following forditions<br />
that have been given determine the four vari-<br />
ables j11, Ya, nu, <strong>and</strong>ha 0 .The first term on the right-h<strong>and</strong><br />
side of the above expression for the rate of growth of<br />
mula brings those factors together into an expression for urban population is the solution of the set of four condiunderst<strong>and</strong>ing<br />
their combined influence on the rate of tions for izh, the percentage change in the proportion of<br />
urbanization. the population which is urban.<br />
(2-1) ( / ) r1TT - )V + N.<br />
N11(lu"laN 1/N0) + 1<br />
As can be seen from equation 2-1, the numerator of<br />
the term giving the percentage change in the proportion<br />
urban is equal to the negative of the rate of growth of<br />
Since the urban population N,, equals the proportion output per person in production of urban commodities<br />
urban n,, times total population N (or, N,, = n 1N), the (that is, an increase in urban productivity, acting alone,<br />
percentage change in the urban population N,, is the leads to a decrease in urban population because the<br />
percentage change in proportion urban h41plus the per- dem<strong>and</strong> for urban commodities can be met by fewer<br />
centage change in total populationN(or,&N = flu + N), people) plus the ratio of urban to nonurban income<br />
which is the basis of equation 2-1. The variable on the elasticities multiplied by the rate of growth of nonurban<br />
left-h<strong>and</strong> side, N 1 , is the annual percentage rate of output per person (growth in nonurban output per pergrowth<br />
of the urban population. The first term on the son releases persons for urban activities, <strong>and</strong> the magniright-h<strong>and</strong><br />
side is the percentage rate of change in the tude of the effect depends on the income elasticities).<br />
proportion of the population which is urban. It includes The denominator-one plus the product of the ratio of<br />
all the considerations discussed earlier except the effect income elasticities <strong>and</strong> the ratio of the numbers of peoof<br />
total population growth of the country, which is given ple in urban <strong>and</strong> in nonurban areas-arises because of<br />
by the second term on the right-h<strong>and</strong> side, N. the interactions of the various effects.<br />
Note that the ratio of the percentage increases in The second term in equation 2-1 isN, the percentage<br />
output per capita of urban <strong>and</strong> nonurban commodities rate of growth of total population of the country. Its<br />
will be in the ratio of their income elasticities. (Recall presence indicates that when changes in the proportion<br />
that the income elasticities are redefined to take account of the population that is urban are taken into account,<br />
of international trade effects.) This first condition can be<br />
writteny,/ya = iu/ %, where j11 is the percentage rate<br />
of growth of urban output per capita (4u = Y11/N, or<br />
urban output divided by the country's total population)<br />
the urban population varies in direct proportion to the<br />
number of people in the country.<br />
From the formula it is clear that rates of urbanization<br />
may differ with conditions in particular countries. As an<br />
<strong>and</strong> r, is the trade-adjusted income elasticity of dem<strong>and</strong><br />
for urban commodities. Similar definitions apply to Ya<br />
example consider a country, still at an early stage of<br />
development, in which per capita income is rising some<strong>and</strong><br />
9, where the subscript a st<strong>and</strong>s for nonurban what rapidly. If the growth is oriented toward growth of<br />
commodities. manufacturing products that are exported to world mar-
<strong>Urbanization</strong> <strong>and</strong> <strong>Economic</strong> <strong>Development</strong> 21<br />
kets. the ratio of the increase in urban <strong>and</strong> in nonurban that developing countries are increasingly getting out of<br />
output, % I' , will be rather high-say, 4. Suppose that the agricultural business <strong>and</strong> into urban-based producone-third<br />
of the population is in urban areas <strong>and</strong> two- tion.<br />
thirds is in rural areas, so that the value forNu/N, is 0.5. Although the model of the preceding section allows<br />
Output per worker in urban areas is assumed to be rising for the effects of trade in the specification of income<br />
at2 percent ayear (Tu = 0.02).As a result of progress in elasticities, it is not fully consistent with the general<br />
a commercialized part of agriculture <strong>and</strong> the decline of reasons for rising urban population connected with spesubsistence<br />
agriculture, output per worker in agricul- cialization in production noted above. In equation 2-1 a<br />
ture is also assumed to rise at the rate of 2 percent a year rise in agricultural productivity will increase urbaniza-<br />
(Ta = 0.02). It is assumed that the total population of tion because a given dem<strong>and</strong> for agricultural products<br />
the country is growing at 1.5 percentayear(N = 0.015). can be satisfied by fewer people <strong>and</strong> the excess people<br />
The values are substituted into the formula for the yearly move to the cities. In like fashion, a rise in urban propercentage<br />
growth in the urban population. ductivity acts to decr:ase urbanization, since fewer peo-<br />
4 0.02 - 0.02<br />
(2-2) N = 4 0.5 + I + 0.015 0.035.<br />
ple are needed to satisfy the dem<strong>and</strong> for urban products.<br />
The amounts of labor required for production in both<br />
sectors change according to a life of their own, <strong>and</strong><br />
That is, the annual growth rate for the urban population amounts of output are not affected by productivity<br />
is 3.5 percent. changes.<br />
Examples of much more rapid or of slower urbaniza- Yet one might think that if a sector became more<br />
tion can be constructed by varying the values. The pur- efficient, it would increase its production, not decrease<br />
pose of this section, however, has not been to explain the it. An increase in efficiency lowers the price at which a<br />
rate of urbanization for any one country but to begin to given quantity can be produced. If the price elasticity of<br />
suggest the nature of the underlying changes in dem<strong>and</strong> dem<strong>and</strong> is greater than zero, a lowering of the price will<br />
<strong>and</strong> supply that determine urbanization. increase the amount that can be sold. A production<br />
response is to be expected.<br />
Indeed, if the responses to changes in production take<br />
A More General Explanation the form of adjustments in foreign exports <strong>and</strong> imports,<br />
prices are effectively set in world markets where de--<br />
The discussion points to generalizations about why m<strong>and</strong>s are highly elastic <strong>and</strong> where in many cases prices<br />
worldwide urbanization is occurring. One reason is that can be taken as given. Even within an economy, a more<br />
incomes are rising in many places, albeit in varying adequate view of the differences between urban <strong>and</strong><br />
degrees. The higher income elasticity of dem<strong>and</strong> for rural production will recognize that there is not a strict<br />
urban than for nonurban commodities is a fundamental dichotomy in the types of goods produced. Aside from<br />
reason why urbanization can be expected to accompany local or nontraded goods in each sector, there are goods<br />
economic development throughout the world. that may be produced in either sector <strong>and</strong> that can be<br />
Another reason for world urbanization is more closely traded between the two sectors. There may be little farmn<br />
related to the nature of the economic development that output in urban areas (although chickens <strong>and</strong> garden<br />
is occurring. For much of the world economic develop- plots can be significant in cities), but factory production<br />
ment entails a transfer of techniques of production, <strong>and</strong> <strong>and</strong> home production of urban-type goods abound in<br />
by <strong>and</strong> large the techniques are more transferable for rural areas, <strong>and</strong> trade between sectors in processed foods<br />
urban than for agricultural commodities. Techniques of <strong>and</strong> other commodities is commonplace. For most of the<br />
agricultural production are much more tied to local l<strong>and</strong> world it may be that most consumption in either rural or<br />
<strong>and</strong> climate conditions. Efforts are being made to de- urban areas is of goods produced within each area <strong>and</strong><br />
velop <strong>and</strong> adapt agricultural techniques to suit the that trade in marketed surpluses of rural <strong>and</strong> urban<br />
unique conditions of each area of each country, but the goods is confined to a small part of output, much of<br />
pace, at best, is slow. Moreover, agriculture, as an inher- which can actually be produced in either sector.<br />
ent user of location-specific resources, is subject to These considerations of the way trade occurs suggest<br />
intrinisic comparative advantages. Increasing spe- that it may be more reasonable to take prices facing rural<br />
cialization of agricultural production among major re- <strong>and</strong> urban areas as given rather than to take relative<br />
gions of the world may be in store. quantity growth as given, as in the model presented<br />
Urban production, on the other h<strong>and</strong>, is not nearly as above. If, as a first approximation, prices are taken as<br />
location-bound. Factories, machines, <strong>and</strong> electronics given, productivity changes will have the opposite effect<br />
parts tend to be physically similar the world over in their from that implied by the model. A rise in productivity in<br />
requirements for productive inputs. It is not surprising urban areas enhances cities' ability to compete in inter-
22 George S. Tolley<br />
national markets <strong>and</strong> to compete with production in degree of mobility that leads to rough equalization of<br />
rural areas <strong>and</strong> thus leads to an increase in urban pro- opportunities for real earnings between sectors, the latduction,<br />
not a decrease. An analogous result is obtained ter appears far more defensible. One is likely to find that,<br />
in nonurban areas, with the implication that rising historically, real eamings of comparable labor in urban<br />
nonurban productivity will retard urbanization. The re- <strong>and</strong> rural areas have changed by about the same amount,<br />
sults are consistent with the hypothesis that urbaniza- <strong>and</strong> the degree of net <strong>and</strong> gross migration observed<br />
tion results from changing advantages in production. between urban <strong>and</strong> rural areas is so great as to belie the<br />
Given that a rise in productivity leads to an expansion notion that responses do not occur. The single most<br />
rather than a contraction of sector output, the question important distinguishing feature in the relations bebecomes<br />
how great the expansion will be. Since relative tween the urban <strong>and</strong> rural parts of an economy may be<br />
quantities of output change are endogenous rather than that they are connected by migration. If one is not to<br />
exogenous, a careful distinction is needed between base an explanation of urbanization on a growing disparchanges<br />
in average labor productivity <strong>and</strong> changes in ity between real eamings of comparable labor in urban<br />
marginal labor productivity as affected by diminishing <strong>and</strong> in rural areas, it is reasonable to suppose that there<br />
returns to employment in a sector. If there were no is sufficient labor mobility to roughly equalize the urban<br />
diminishing returns as employment increased in a sec- <strong>and</strong> rural changes in marginal productivity that occur<br />
tor, the assumption of given output prices (suggested during economic development. The implications of<br />
here as a first approximation) would imply that, except lesser degrees of mobility could be considered, but this<br />
by accident, one sector would have a higher marginal can be done more easily <strong>and</strong> with more insight after the<br />
productivity of labor than the other. Migration would first approximation is explored.<br />
then lead to all the employment being in one sector or In distinction to the variable T that was used above to<br />
the other-one sector would go to zero <strong>and</strong> the other refer to average labor productivity, let A denote the<br />
would have all the employment. influence of nonlabor inputs on the amount of output<br />
To avoid this unrealistic solution the assumption of (taken to be synonymous with income produced). For<br />
given prices might be dropped, leading to a solution nonurban production, the availability of l<strong>and</strong> may partly<br />
governed by changing prices of urban goods in relation determineA. Port facilities <strong>and</strong> other natural limitations<br />
to those of nonurban goods. But the idea that urbaniza- could play a similar role in urban production. For both<br />
tion is primarily explained by massive changes in prices urban <strong>and</strong> nonurban production, private capital <strong>and</strong> the<br />
of urban goods in relation to those of nonurban goods- amounts of various types of infrastructure influence A.<br />
in particular, by increases in relative prices of urban With labor N measured in terms of numbers of people or<br />
goods-is not appealing. This type of change does not hours, A is influenced by the productive quality per<br />
appear to be a pervasive world phenomenon. Endoge- person, which in turn is determined in part by human<br />
nous relative prices can be introduced, but it would be capital investment. For both urban <strong>and</strong> nonurban probest<br />
to do so only after a situation of given relative prices duction, perhaps the greatest influence onA is technical<br />
has been more fully explored. knowledge used in production, which depends on en-<br />
Another way to avoid the unrealistic solution of hav- couragement of or impediments to international transing<br />
all employment end up in one sector or the other fer of technology, entrepreneurship, incentive strucwould<br />
be to base a solution on impediments to labor tures, <strong>and</strong> other policy <strong>and</strong> institutional considerations.<br />
migration. Then a rise in, say, urban compared with To obtain a formulation consistent with growth<br />
nonurban labor productivity would increase the attrac- source analysis, take time derivatives of the production<br />
tiveness of urban employment. Imperfect labor mobility relation Y = AN6 <strong>and</strong> express as yearly percentage<br />
would lead to a rising gap in real incomes between urban<br />
<strong>and</strong> rural sectors that might be reduced only gradually<br />
over time. One problem with this solution is that it does<br />
changes. Then growth in output will equal the percent-<br />
age growth in nonlabor influences, A, plus the product<br />
of elasticity of output with respect to labor, e, <strong>and</strong> the<br />
not avoid the outcome that all employment ends up in<br />
one sector; it only delays that outcome. Eventually, over<br />
percentage change in labor. For urban production,<br />
(2-3) y + e<br />
generations, if not earlier, people all migrate to the cities aU<br />
in response to relative differences in earnings opportunities.<br />
The only reason for not doing so would be nonpe<strong>and</strong><br />
for nonurban production,<br />
(2-4) A, + N.<br />
cuniary attachments to rural life. Basing an explanation<br />
of urbanization on permanent. nonpecuniary attach- The elasticity of output, e, is almost certainly between<br />
ments to a way of life is at least as unappealing as basing zero <strong>and</strong> one <strong>and</strong> is closer to one than to zero. If it were<br />
it on changing relative output prices of the sectors. one or greater, the implication would be that-other<br />
If one has to choose between no labor mobility <strong>and</strong> a inputs being held constant-output could be increased
<strong>Urbanization</strong> <strong>and</strong> <strong>Economic</strong> <strong>Development</strong> 23<br />
in equal or greater proportion to increases in labor. above, E = wnIpy, can be rearranged as an expression<br />
Under the assumption of fixed proportions the elasticity for the wage in a sector, w = epyIn. With the use of<br />
would be zero. That assumption, however, ignores the<br />
myriad of possibilities for drawing on a given amount of<br />
rates of change for the two sectors,<br />
nonlabor inputs to produce varying physical quantities (2-5) Wu = Pu + Yu -<br />
<strong>and</strong> qualities of outputs in modern factory production,<br />
office work, retailing, personal services, <strong>and</strong> traditional<br />
<strong>and</strong><br />
production as the amount of labor is varied. The relation (2-6) Wa = Pa + Ya - Na<br />
between average labor productivity T in the preceding assuming that e is a stable parameter (e = 0). The Ps in<br />
section <strong>and</strong> the influence of nonlabor inputs A in this these conditions refer to prices of output produced; the<br />
section can be seen by combining the conditions T = relevant deflator that determines labor supply response<br />
YIL <strong>and</strong> Y = AL' to obtain T = ALE- 1. If e is close to one is an index of prices of goods consumed. The level of<br />
<strong>and</strong> if nonlabor influences A are more predominant as prices may differ greatly between urban <strong>and</strong> rural areas.<br />
causes of change in average labor productivity than the If prices move proportionately over time <strong>and</strong> relative<br />
elasticity effect of changes in labor inputs LE -1, then T real earnings in urban <strong>and</strong> rural areas remain roughly<br />
<strong>and</strong> A will move in a similar fashion. the same, the rate of growth of wages in the two sectors<br />
To proceed to the rest of the model in this section, will be similar, which yields the condition Wu, = Wa.<br />
suppose that labor is paid a wage w that is equal to its The right-h<strong>and</strong> sides of equations 2-5 <strong>and</strong> 2-6 can then<br />
marginal product m multiplied by price output p (or, m be set equal to each other.<br />
= wlp). The elasticity of output (the marginal product If the approximation is retained that changes in prices<br />
m multiplied by the amount of labor n divided by output of urban-produced goods relative to those of rural goods<br />
y) is seen to be equal to wage payments wn divided by the will not in the first instance be used as an explanation of<br />
value of output py. This implies that e in equations 2-3 the rate of urbanization, 1% = Pa. Then the condition<br />
<strong>and</strong> 2-4 equals the share of product paid to labor, wn Ipy. obtained from setting the right-h<strong>and</strong> sides of equations<br />
The order of magnitude of e as labor's share can in 2-5 <strong>and</strong> 2-6 equal to each other is<br />
principle be observed rather readily. Although the elas- -<br />
ticity of output may be different in urban <strong>and</strong> in nonur- (2-7) Nu = - Na.<br />
ban production, in this example it is taken to be the This condition has the strong empirical implication thatsame.<br />
Not to do so would imply that major reliance is the excess of the rate of income growth over the rate of<br />
placed on differences in factor shares in explaining ur- employment growth will be the same in urban <strong>and</strong> in<br />
banization. nonurban areas. Put another way, average labor produc-<br />
The rate of urbanization may indeed be affected by tivity will change by the same proportion in both securban-rural<br />
differences in elasticity of output as well as tors.<br />
by changes in elasticities in particular countries. There Income produced in the two sectors may change by<br />
are no compelling studies that indicate systematic differ- greatly different amounts-that is, Yu, <strong>and</strong> Ya, may be<br />
ences <strong>and</strong> changes in factor shares, <strong>and</strong> the shares do very different. The differential changes in income proseem<br />
in fact to be fairly stable. The formula for elasticity duced are a result of differences in growth of nonlabor<br />
of output followed here therefore seems appropriate for sources of income, which lead to corresponding differan<br />
overview of major factors that explain rate of urban- ences in growth of dem<strong>and</strong> for labor. For example, if<br />
ization. nonlabor sources of income growth increase more rap-<br />
Given observed values of e, equations 2-3 <strong>and</strong> 2-4 can<br />
be used in connection with measurements of income<br />
idly in urban than in rural areas, the dem<strong>and</strong> for labor<br />
will increase more in urban than in rural areas. The<br />
growth Y<strong>and</strong> population growthNto obtain estimates of increase in nonlabor sources of income <strong>and</strong> the associthe<br />
growth of nonlabor influences, A. When either equa- ated increase in labor inputs will raise income by 1, <strong>and</strong><br />
tion 2-3 or equation 2-4 is solved forA,A is found to be Y employment by some lesser amount, N . Meanwhile,<br />
minus eN. The estimate of growth of nonlabor sources because of the slower growth of nonlabor income<br />
of income in a sector is the observed income growth less sources in rural production, Yk will be smaller than Yk<br />
that part of income growth attributable to labor, which <strong>and</strong> NQ will be correspondingly smaller than N& (owing<br />
in turn is equal to labor's elasticity of output multiplied to a lesser growth in dem<strong>and</strong> for labor in rural areas). If<br />
by the population growth of the sector. factor shares <strong>and</strong> relative wages <strong>and</strong> prices are not to<br />
An essential feature of the model is that labor will change, the rise in ratio of income to employment must<br />
adjust to keep the relative earnings of urban <strong>and</strong> rural be the same in the two sectors.<br />
employment in line. To incorporate this feature, the How well does the condition stated in equation 2-7,<br />
condition pertaining to the elasticity of output derived that average labor productivity will change by the same
24 George S. Tolley<br />
proportion in urban <strong>and</strong> rural employment, fit the facts? errors or differences in the way variables are calculated<br />
For sixty-six low- <strong>and</strong> middle-income economies for from available data. The uncertainty of output <strong>and</strong> emwhich<br />
the requisite income <strong>and</strong> population figures are ployment figures is well known, <strong>and</strong> the reasons for<br />
available to study growth rates for 1960-80, the mean of differing changes in measured employment <strong>and</strong> output<br />
the excess of the proportionate change in average urban connected with changing market orientation of produclabor<br />
productivity over average rural productivity is tion during development have often been discussed. In<br />
- 0.0001. The st<strong>and</strong>ard error of this mean is 0.0029. In general, more production may pass through the marketthese<br />
comparisons real nonagricultural <strong>and</strong> agricultural place as economic development proceeds over a twentyincomes<br />
are used as surrogates for urban <strong>and</strong> rural year period, but because of lags in data collection, statisincomes.<br />
It is assumed that employment is roughly tics may capture these changes only imperfectly.<br />
proportional to population, so that urban <strong>and</strong> rural Nonzero error of fit may also occur because assumppopulations<br />
can be used as surrogates for employment. tions of the model that are justified as first approxima-<br />
Alternatively, still with nonagricultural <strong>and</strong> agri- tion may not be exactly fulfilled. But the small size of the<br />
cultural incomes as surrogates for urban <strong>and</strong> rural in- errors suggests that the principal factors are indeed<br />
comes, the labor force in agriculture can be used as a captured by the model. In view of all the possible reasons<br />
surrogate for rural employment <strong>and</strong> the nonagricultural for existence of error, it is fair to say that the data fit the<br />
labor force as a surrogate for urban employment. Or, model well.<br />
more simply, the comparison may be viewed as an ap- It was specified that growth in output can be repreplication<br />
of the model to agricultural versus nonagri- sented as the sum of labor <strong>and</strong> nonlabor effects in each<br />
cultural employment rather than to urban versus rural sector in equations 2-3 <strong>and</strong> 2-4. Condition 2-7 (for<br />
employment. If agricultural <strong>and</strong> nonagricultural labor changes in employment relative to output in each sector<br />
forces are used, rather than rural <strong>and</strong> urban popula- as migration occurs in response to changes in dem<strong>and</strong>)<br />
tions, the mean of the excess of the proportionate was then derived. The model is completed by using the<br />
change in average nonagricultural labor productivity condition discussed above-that the total amount of<br />
over that of average agricultural productivity is 0.0024 labor used in the economy is the sum of urban <strong>and</strong><br />
<strong>and</strong> the st<strong>and</strong>ard error is 0.0029. nonurban labor, or N = N 11 + N,. The equation is<br />
To further test the extent to which equation 2-7 is differentiated with respect to time <strong>and</strong> divided by the<br />
satisfied, if the error attributable to the fact that original values of the variables. The annual proportionobserved<br />
changes in average productivity do not exactly ate rate of growth of the total population is expressed as<br />
fulfill the equation is small, most of the observed the product of the urban share of population <strong>and</strong> annual<br />
changes in output <strong>and</strong> employment will be explained by proportionate rate of growth of the urban population,<br />
the model. The small size of the error in relation to total plus the product of the nonurban share <strong>and</strong> the annual<br />
income or employment change is an indication of the proportionate rate of growth of the nonurban populaextent<br />
to which the hypothesis of equal proportionate tion; that is,<br />
changes ih average labor productivity is fulfilled. 2-8' N F N F N<br />
An error-of-fit measure, calculated for each economy, ( u a ais<br />
the proportionate annual change in average labor The four-equation model given by formulas 2-3, 2-4,<br />
productivity as a fraction of the mean of annual propor- 2-7, <strong>and</strong> 2-8 determines the four rates of growth that<br />
tionate urban <strong>and</strong> rural population growth. The median pertain to outpyt <strong>and</strong> employment in the two sectors,<br />
of the error-of-fit measures over all sixty-six economies that is, Y, Ya, N, <strong>and</strong> NA . To solve for the variable of<br />
is 0.030. Two-thirds of the measures fall between interest-urban population growth, Nu-equations 2-3<br />
- 0.735 <strong>and</strong> 0.826. When nonagricultural <strong>and</strong> agri- <strong>and</strong> 2-4 are substituted into equation 2-7 to eliminate<br />
cultural labor forces are used instead of urban <strong>and</strong> rural the Ys. The result is a relation between N1u <strong>and</strong> N 1 that<br />
populations, the median error-of-fit measure for the depends on the rates of growth of nonlabor sources of<br />
sixty-six economies is 0.067. Two-thirds of these mea- income in the two sectors. The relation can be written Na<br />
sures fall between - 0.981 <strong>and</strong> 0.828. = N 11 + (A,, - A,,) / (1 - E), indicating that urban <strong>and</strong><br />
The fact that most of the error-of-fit measures are rural populations move proportionately except as they<br />
substantially less than 1 indicates that most of the are influenced by differential changes in growth of nonobserved<br />
variation in output <strong>and</strong> employment is associ- labor sources of income, which have a multiplier effect<br />
ated with growth of nonlabor income sources <strong>and</strong> the of 1 / (1 - e) because under the model enough labor<br />
hypothesized proportionate changes in labor <strong>and</strong> that must be hired to drive the return to labor down to the<br />
relatively little change is left to be explained by errors or same level in each sector. The result for Na is inserted<br />
departures from the hypotheses of the model. The exis- into condition 2-8 for total employment <strong>and</strong> the equatence<br />
of nonzero error of fit may be partly a result of tion is solved for Nk:
<strong>Urbanization</strong> <strong>and</strong> <strong>Economic</strong> <strong>Development</strong> 25<br />
(F. _ F. mates of growth of urban <strong>and</strong> rural income, which may<br />
(2-9) N11 + 1 0 -Ael - ela be subject to great measurement errors <strong>and</strong> possible<br />
- inconsistencies in definition. To minimize the effects of<br />
The solution of the model forN11given by equation 2-9<br />
provides the basis for decomposing the rate of growth of<br />
measurement problems, the procedure used here is to<br />
average the changes in income in the two sectors <strong>and</strong><br />
the urban population into three factors. The first is total thus obtain income measures that conform to the propopulation<br />
growth of the nation, N, which has a propor- ductivity condition. Specifically, the average excess of<br />
tionate effect on urban population growth. The second is the rate of growth of income in each sector over the rate<br />
an urban productivity factor that stems from growth of of population growth in each sector yields an estimate of<br />
nonlabor sources of urban production. The positive the common rise in average labor productivity in the two<br />
effect of increases in nonlabor sources of urban produc- sectors. This estimate made on the basis of the observed<br />
tion is enhanced by the multiplier 1 / (1 - e) that is average for the two sectors can be added to population<br />
connected with keeping earnings growth the same in the growth in each sector to obtain the measures of income<br />
two sectors, <strong>and</strong> the magnitude of the effect is also growth in the sectors that would prevail if the model<br />
proportional to the fraction of the population in agricul- fitted the real situation precisely. After this attempt to<br />
ture. A given change in the absolute level of employment purge the income measurements of error <strong>and</strong> to elimias<br />
labor is reallocated will have a greater proportionate nate the effects those errors would spuriously introduce<br />
effect on urban population the smaller is the existing into estimates of the factors that affect urbanization,<br />
fraction of the population that is urban (which is to say, estimates of the As may be obtained as before by subthe<br />
larger the fraction that is nonurban). The third tracting the product of labor elasticity of output <strong>and</strong> the<br />
factor into which urban population growth is decom- amount of labor from the income values that conform to<br />
posed is a rural productivity factor which stems from the average labor productivity condition.<br />
growth of nonlabor sources of rural income. It is exactly Table 2-2 presents the results obtained when the modanalogous<br />
to the urban productivity factor, but it acts on el is applied to sixty-six low- <strong>and</strong> middle-income econourban<br />
population growth with a negative sign, since in mies, using urban population statistics from the World<br />
this model a rise in rural productivity increases rural Bank <strong>and</strong> an estimate of labor's share Fof 0.7. Column 1,<br />
population. the annual proportionate growth of urban population in<br />
each economy from 1960 to 1980, is the variable to be<br />
Application the Sample to<br />
Appicafton to the Sample<br />
explained. Column 2 is the average fraction of the<br />
population that is urban for 1960-80. This fraction was<br />
Measures of the rate of population growth N to be calculated to conform to equation 2-8, which relates the<br />
applied to equation 2-9 are readily available. The fraction rates of urban <strong>and</strong> rural population growth to the rate of<br />
of the population that is not urban, Fa, is available for growth of the total population. The fraction of the<br />
many countries but may be subject to more error than population that is rural, F,, is 1 - F,,. Arrangement of<br />
total population. Systematic measures of labor's elasticity<br />
of output F that are comparable among sectors <strong>and</strong><br />
nations are apparently not available, but impressions<br />
equation 2-8 as an expression for F gives as the fraction<br />
of the population that is urban F, = (N - Na) I (Nu 1 -<br />
Na), the ratio between the excess of total population<br />
about general orders of magnitude can be obtained. growth over nonurban population growth <strong>and</strong> the excess<br />
Although the growth in nonlabor sources of income (the of urban over nonurban population growth. This mea-<br />
As) cannot be directly observed, first-cut measurements sure is quite close to the simple average of the 1960 <strong>and</strong><br />
can be obtained with the use of equations 2-3 <strong>and</strong> 2-4. 1980 values for the fraction of the population that is<br />
That is, when either equation is solved for A, the con- urban, <strong>and</strong> in all cases it lies between those values. The<br />
tribution of growth in nonlabor sources of income to<br />
observed income growth is equal to the observed income<br />
methodjust described for calculatingF 11 in conformance<br />
with equation 2-8, along with the method described<br />
growth Y minus the product of elasticity of output of above for calculating the growth of nonlabor income<br />
labor F <strong>and</strong> the growth rate of labor N. (That is, the sources A to conform to equations 2-3 <strong>and</strong> 2-4, ensures<br />
nonlabor source of income growth is total income an internally consistent system of accounting in which<br />
growth minus the contribution of labor to income the factors that explain urban population growth exactly<br />
growth.) add up to urban population growth. Although other<br />
The calculations just described give only first-cut or, procedures for defining variables might have given<br />
at most, suggestive measurements of the As because about the same results, the procedures used here have<br />
they ignore the stipulation of the model that average the advantage of eliminating idiosyncracies in definition<br />
labor productivity rises at the same rate of growth in as a perceived reason for differences in rate of urbanizaboth<br />
sectors. The measures are dependent on the esti- tion. The analytic factors that explain urban population
26 George S. Tolley<br />
Table 2-<strong>2.</strong> Urban Population Change, Sixty-six Economies, 1960-80<br />
Anmual pro- Annual pro-<br />
Components of change<br />
in urban population<br />
Annual pro- portionate portionate<br />
portionate Urban growth in growth in Annual pro- Urban pro- Nonurban<br />
change share urban non- nonurban portionate ductivity productivity<br />
in urban of popula- labor nonlabor<br />
population, tion, 1980, sources of sources of<br />
Nu Fu income, Au income, A,,<br />
change in<br />
total population,<br />
N<br />
factory<br />
F,A&I<br />
(1 - e)<br />
factor,<br />
-FaAal<br />
(I- E)<br />
Error of fit,<br />
(Au - A,)!<br />
'/2 (u +X N)<br />
Economy (1) (2) (3) (4) (5) (6) (7) (8)<br />
Bangladesh 0.066 0.076 0.006 - 0.007 0.027 0.017 0.022 - 0.413<br />
Ethiopia 0.070 0.099 0.016 0.001 0.024 0.048 -0.002 -0.171<br />
Mali 0.054 0.151 0.016 0.005 0.024 0.045 -0.015 0.196<br />
Somalia 0.052 0.231 -0.025 - 0.036 0.024 -0.065 0.093 1.527<br />
Chad 0.067 0.118 -0.010 -0.026 0.020 -0.030 0.077 -1.101<br />
Burma 0.039 0.228 0.019 0.012 0.022 0.048 -0.030 - 1.193<br />
Burkina Faso 0.045 0.068 -0.001 -0.010 0.016 -0.002 0.032 0.828<br />
India 0.032 0.199 0.019 0.015 0.022 0.051 -0.041 0.567<br />
Malawi 0.070 0.062 0.028 0.016 0.029 0.089 - 0.049 - 0.249<br />
Rw<strong>and</strong>a 0.062 0.029 0.018 0.007 0.027 0.059 - 0.024 - 0.096<br />
Sri Lanka 0.041 0.223 0.019 0.012 0.021 0.050 -0.030 -0.315<br />
Guinea 0.061 0.141 0.013 0.002 0.029 0.038 -0.006 -0.190<br />
Zaire 0.060 0.242 - 0.006 -0.021 0.023 - 0.016 0.053 -0.176<br />
Niger 0.070 0.091 -0.001 - 0.014 0.031 -0.003 0.042 -0.554<br />
Benin 0.044 0.119 0.007 0.001 0.027 0.021 -0.004 0.633<br />
Pakistan 0.041 0.249 0.030 0.025 0.029 0.074 -0.062 0.442<br />
Tanzania 0.072 0.080 0.023 0.009 0.028 0.070 - 0.026 0.004<br />
Central African Republic 0.051 0.315 0.007 -0.005 0.022 0.017 0.012 - 0.747<br />
Haiti 0.055 0.247 0.004 -0.012 0.016 0.009 0.030 - 1.060<br />
Mauritania 0.128 0.102 0.009 - 0.025 0.026 0.026 0.076 - 0.313<br />
Lesotho 0.067 0.033 0.039 0.025 0.021 0.126 - 0.080 0.969<br />
Ug<strong>and</strong>a 0.077 0.080 0.006 - 0.008 0.034 0.018 0.026 - 0.724<br />
Sudan 0.070 0.166 0.003 - 0.013 0.024 0.009 0.037 -0.027<br />
Togo 0.053 0.132 0.034 0.025 0.026 0.098 - 0.071 0.671<br />
Kenya 0.070 0.101 0.017 0.005 0.035 0.051 - 0.016 - 0.246<br />
Senegal 0.029 0.240 0.010 0.008 0.025 0.025 - 0.021 - 0.538<br />
Indonesia 0.035 0.174 0.037 0.031 0.020 0.101 -0.087 0.826<br />
Egypt 0.031 0.415 0.037 0.033 0.022 0.073 -0.065 1.046<br />
Ghana 0.049 0.292 -0.001 -0.011 0.026 -0.002 0.025 -0.735<br />
Honduras 0.054 0.292 0.017 0.007 0.032 0.040 - 0.017 -0OA73<br />
Zambia 0.054 0.301 0.019 0.008 0.029 0.045 - 0.020 - 1.449<br />
Thail<strong>and</strong> 0.033 0.135 0.046 0.045 0.029 0.133 -0.129 1.101<br />
Bolivia 0.042 0.284 0.025 0.018 0.026 0.059 - 0.043 - 0.030<br />
Philippines 0.038 0.330 0.032 0.028 0.029 0.071 - 0.062 0.009<br />
Congo 0.028 0.350 0.004 0.001 0.023 0.008 - 0.002 1.138<br />
Nigeria 0.047 0.163 0.024 0.016 0.025 0.066 - 0.045 1.500<br />
El Salvador 0.036 0.395 0.022 0.020 0.033 0.043 -0.040 0.495<br />
Morocco 0.044 0.348 0.021 0.013 0.027 0.045 - 0.028 0.260<br />
Peru 0.047 0.567 0.027 0.014 0.028 0.039 -0.020 -0.149<br />
Cote d'lvoire 0.080 0.278 0.032 0.018 0.045 0.077 -0.042 0.009<br />
Nicaragua 0.043 0.470 0.041 0.034 0.031 0.073 - 0.060 -0.494<br />
Colombia 0.045 0.593 0.040 0.026 0.026 0.054 -0.035 - 1.148<br />
Paraguay 0.031 0.375 0.034 0.032 0.027 0.071 - 0.067 0.077<br />
Dominican Republic 0.055 0.402 0.032 0.019 0.029 0.064 - 0.037 0.044<br />
Guatemala 0.037 0.360 0.035 0.031 0.028 0.075 - 0.066 - 0.057<br />
Syrian Arab Republic 0.047 0.434 0.048 0.040 0.032 0.091 -0.076 -0.384<br />
Malaysia 0.036 0.270 0.042 0.039 0.028 0.103 - 0.095 0.652<br />
Jamaica 0.034 0.419 0.015 0.005 0.015 0.029 - 0.010 -1.283<br />
Korea, Republic of 0.056 0.410 0.064 0.047 0.022 0.125 -0.092 0.334
Table 2-2 (continued)<br />
<strong>Urbanization</strong> <strong>and</strong> <strong>Economic</strong> <strong>Development</strong> 27<br />
Annual pro-<br />
Annual pro- Annual proportionate<br />
portionate<br />
Components of change<br />
in urban population<br />
portionate Urban growth in growth in Annual pro- Urban pro- Nonurban<br />
Economy<br />
change share urban nonin<br />
urban of popula- labor<br />
population, tion, 1980, sources of<br />
N,, F,, income, A.<br />
(1) (2) (3)<br />
nonurban<br />
nonlabor<br />
sources of<br />
incomne, A.<br />
(4)<br />
portionate<br />
change in<br />
total population,<br />
N<br />
(5)<br />
ductivity<br />
factor,<br />
FaA]u<br />
(1 - e)<br />
(6)<br />
productivity<br />
factor,<br />
- FaAal<br />
(1 - e)<br />
(7)<br />
Error of fit,<br />
(Au - a,)/<br />
1N2 W +a)<br />
(8)<br />
Turkey 0.047 0.383 0.036 0.026 0.025 0.075 -0.053 0.301<br />
Algeria<br />
Mexico<br />
Panama<br />
Taiwan<br />
0.065<br />
0.046<br />
0.044<br />
0.038<br />
0.452<br />
0.592<br />
0.475<br />
0.680<br />
0.002<br />
0.029<br />
0.034<br />
0.057<br />
- 0.017<br />
0.018<br />
0.026<br />
0.044<br />
0.030<br />
0.033<br />
0.030<br />
0.024<br />
0.004<br />
0.039<br />
0.060<br />
0.061<br />
0.031<br />
-0.025<br />
-0.046<br />
-0.046<br />
- 0.195<br />
0.122<br />
0.012<br />
1.408<br />
Chile<br />
Costa Rica<br />
Brazil<br />
Uruguay<br />
Argentina<br />
Portugal<br />
Yugoslavia<br />
0.028<br />
0.038<br />
0.046<br />
0.010<br />
0.019<br />
0.018<br />
0.030<br />
0.749<br />
0.400<br />
0.556<br />
0.821<br />
0.782<br />
0.269<br />
0.348<br />
0.027<br />
0.033<br />
0.042<br />
0.016<br />
0.029<br />
0.029<br />
0.042<br />
0.016<br />
0.039<br />
0.030<br />
0.011<br />
0.022<br />
0.023<br />
0.033<br />
0.019<br />
0.030<br />
0.028<br />
0.008<br />
0.014<br />
0.003<br />
0.010<br />
0.022<br />
0.067<br />
0.062<br />
0.009<br />
0.021<br />
0.070<br />
0.091<br />
-0.014<br />
-0.059<br />
- 0.045<br />
-0.007<br />
-0.016<br />
-0.055<br />
- 0.071<br />
-<strong>2.</strong>719<br />
0.276<br />
0.260<br />
-5.082<br />
-0.914<br />
5.940<br />
0.430<br />
Venezuela<br />
Hong Kong<br />
Greece<br />
Spain<br />
Israel<br />
0.044<br />
0.023<br />
0.024<br />
0.024<br />
0.039<br />
0.756<br />
0.895<br />
0.526<br />
0.658<br />
0.836<br />
0.042<br />
0.044<br />
0.054<br />
0.048<br />
0.050<br />
0.029<br />
0.042<br />
0.042<br />
0.037<br />
0.037<br />
0.034<br />
0.023<br />
0.006<br />
0.011<br />
0.031<br />
0.035<br />
0.015<br />
0.085<br />
0.055<br />
0.027<br />
- 0.024<br />
-0.015<br />
-0.066<br />
-0.042<br />
- 0.020<br />
- 1.436<br />
<strong>2.</strong>877<br />
-0.601<br />
0.894<br />
- 0.642<br />
Note: Economies are listed in increasing order of 1978 per capita income.<br />
growth in fact add up exactly to measured urban popula- Column 8 presents the error-of-fit measure for each<br />
tion growth. economy. As discussed earlier, that measure is the dif-<br />
Columns 3 <strong>and</strong> 4 present measures of the average ference between urban <strong>and</strong> nonurban average productivannual<br />
rate of growth of the sources of nonlabor urban ity change (based on observed income) divided by the<br />
<strong>and</strong> nonurban income A, with the use of the purged average employment change in the two sectors. A posiincome<br />
values, as described above. tive sign indicates a greater urban than nonurban aver-<br />
The key columns are 5, 6, <strong>and</strong> 7. They show the age increase in labor productivity, using observed meadecomposition<br />
of the annual proportionate urban sures of income; a negative sign indicates the reverse. A<br />
population growth given in column 1 into the three value of less than one in absolute terms indicates that<br />
terms in equation 2-9. Thus, column 5 is the annual relatively more of the employment changes are associproportionate<br />
overall population growth of the econ- ated with the factors explained by the model than with<br />
omy, which makes a direct <strong>and</strong> equal contribution to failure to satisfy exactly the proportionate productivity<br />
urban population growth. Column 6 is the urban pro- condition. The effect of the error is smaller the closer is<br />
ductivity factor, which gives the effect of nonlabor urban the value to zero.<br />
income source growth on the rate of urban population Column 5, proportionate total population growth,<br />
growth. Column 6 is column 3 multiplied by the nonur- shows, as expected, that total population growth<br />
ban fraction of the population (calculable from the table accounts for a rate of urbanization that is generally on<br />
as 1 minus the urban fraction in column 2) <strong>and</strong> divided the order of 2 percent a year (0.020, as a decimal fracby<br />
the share of income that accrues to factors of production<br />
other than labor, 1 - e (in this case, 1 - 0.7, or<br />
tion, as expressed in the table). It ranges up to 3 percent<br />
in some cases <strong>and</strong> for certain economies, such as Yugo-<br />
0.3). Column 7, the nonurban productivity factor, is slavia, is very low. The direct effects of population<br />
calculated from column 4 in the same way as the urban growth thus cannot account for the high rates of urbanproductivity<br />
factor is calculated from column 3, except ization-up to 7 percent-which are found in the table.<br />
that the sign is changed, since nonurban productivity Population growth could also cause pressure on limited<br />
acts in the opposite direction from urban productivity as agricultural l<strong>and</strong> supplies <strong>and</strong> force growing numbers of<br />
an influence on the rate of urbanization. people to seek work in urban areas. This effect would be
28 George S. Tolley<br />
manifested in a resource scarcity situation in which to be associated with low rates of growth of nonlabor<br />
supplies of nonlabor resources were more expansible in rural income sources does not prove that l<strong>and</strong> scarcity<br />
urban than in rural areas. If nonlabor resources were as has been a highly important reason for rapid urbanizascarce<br />
in urban as in rural areas, in the sense of having tion. A more likely explanation of the finding may be the<br />
an elasticity of supply that is zero or equally small, general sluggishness of agriculture in the twenty-five<br />
nonlabor inputs would tend to increase by similar rela- economies <strong>and</strong> a general failure to advance knowledge<br />
tive amounts in both rural <strong>and</strong> urban areas <strong>and</strong> there or introduce new techniques-in short, a failure of nonwould<br />
be little impetus to urbanization. In a situation in l<strong>and</strong> conventional <strong>and</strong> nonconventional inputs to inwhich<br />
limited supplies of l<strong>and</strong> provided the major im- crease, even though l<strong>and</strong> supply may have been elastic.<br />
petus to urbanization, one would expect to see limited Lack of inputs other than l<strong>and</strong> may have acted to depress<br />
increases in nonlabor sources of income growth in rural the marginal productivity of labor <strong>and</strong> hence the deareas,<br />
coupled with larger increases in labor inputs in m<strong>and</strong> for labor in rural areas. If so, it is a lack of effective<br />
urban areas as the supply of urban sites with associated economic development in agriculture <strong>and</strong> not a lack of<br />
infrastructure <strong>and</strong> other urban facilities exp<strong>and</strong>ed to l<strong>and</strong>. that helped to foster high urbanization rates among<br />
accommodate people displaced from agriculture. These the countries that experienced low rates of growth of<br />
endogenous increases in urban nonlabor inputs would nonlabor rural income sources.<br />
be greater than the increases in agricultural nonlabor The interpretation of events in terms of a more generinputs,<br />
but if the only important impetus to urbaniza- al economic development perspective that goes beyond<br />
tion were displacement of agricultural labor, the in- preoccupation with the role of agricultural l<strong>and</strong> is<br />
creases in urban nonlabor inputs still might not be strengthened by considering additional results in table<br />
great, since in this depiction of the world more vigor- 2-<strong>2.</strong> One of the striking relations in the table is the<br />
ous positive impetuses to economic development are positive association between growth rates of urban <strong>and</strong><br />
lacking. rural nonlabor sources of income, as revealed by looking<br />
One might suppose that economies with less than 1 down columns 3 <strong>and</strong> 4. The two series have a simple<br />
percent a year growth in agricultural nonlabor inputs correlation coefficient (R2 ) of 0.964. Two reasons may<br />
may have a l<strong>and</strong> scarcity situation. In table 2-2 twenty- be noted for the positive association. First, the nonlabor<br />
five of the sixty-six economies have growth of nonlabor income sources include capital, which is mobile between<br />
sources of nonurban income of less than 1 percent a year sectors. Increases in the capital stock of an economy will<br />
(or, as a decimal fraction, 0.010) as indicated in column tend to be allocated among sectors so as to equalize the<br />
4. Of these, ten experienced negative rates of change in marginal returns to capital <strong>and</strong> impart changes in the<br />
nonlabor sources of income, which indicates retrogres- same direction to nonlabor income sources in the difsion<br />
<strong>and</strong> other special factors not explained by the usual ferent sectors. Second, <strong>and</strong> perhaps more important, the<br />
l<strong>and</strong> scarcity situation. Note that l<strong>and</strong> scarcity does not nonlabor income sources reflect more general economic<br />
imply negative growth of nonlabor sources of income development changes, in addition to conventional inbut<br />
rather no growth or a very small increase. The puts, that act to increase the productivity of the conveneconomies<br />
with low <strong>and</strong> negative growth for nonlabor tional inputs. There is some tendency for the effects of<br />
sources of nonurban income tend to be among those economic development changes to be pervasive; for exwith<br />
the lowest incomes, as indicated by their early ample, the influence of research, infrastructure, incenappearance<br />
in the table. (Economies are ranked by 1978 tive structures, <strong>and</strong> institutions tends to be felt throughper<br />
capita income.) It is also true that these economies out an economy. Just as there is a tendency to equalize<br />
generally have high urbanization rates. In the five returns to conventional inputs among sectors, there is<br />
lowest-income economies (Bangladesh, Ethiopia, Mali, some tendency to equalize returns to deeper economic<br />
Somalia, <strong>and</strong> Chad) rates of change for nonlabor sources development efforts, even though the latter tendency<br />
of rural income are negative or less than 1 percent a may be less perfect. The fact that the economies in table<br />
year. Each had a rate of growth of urban population of 2-2 which have low rates of growth of nonlabor rural<br />
over 5 percent a year (0.050, as a decimal). Of the income sources also tend to have low rates of growth of<br />
twenty-five economies with low or negative growth of nonlabor urban income sources suggests that general<br />
nonlabor sources of rural income, only three-Senegal, economic development differences, <strong>and</strong> not primarily<br />
Congo <strong>and</strong> Jamaica-had an urban population growth of agricultural l<strong>and</strong>, are at work in explaining those econoless<br />
than 4 percent a year. By contrast, in only twenty of mies' high rates of urbanization.<br />
the forty-one economies where growth of nonlabor An ancillary finding in table 2-2 is that the growth in<br />
sources of rural income was greater than 1 percent were nonlabor sources of income tends to rise with the per<br />
annual rates of urban population growth more than 4 capita income of the economy (which is to say, it rises as<br />
percent. one looks down the table). The simple R2 between the<br />
The apparent tendency for high rates of urbanization income rank of an economy (as indicated by its order in
<strong>Urbanization</strong> <strong>and</strong> <strong>Economic</strong> <strong>Development</strong> 29<br />
the table) <strong>and</strong> the urban nonlabor income source growth<br />
rate in column 3 is 0.658. The simpleR<br />
population analysis in which labor share, E, is 0.5 in-<br />
2 between income stead of 0.7; <strong>and</strong> two labor force analyses that use nonagrank<br />
<strong>and</strong> the rural nonlabor income source growth rate ricultural labor force as a surrogate for urban labor<br />
in column 4 is 0.64<strong>2.</strong> The finding reflects the tendency force, with e at 0.7 in one case <strong>and</strong> 0.5 in the other. The<br />
among these economies for the more affluent among results were essentially similar to those presented here.<br />
them to gain in relation to the less affluent. The existence of many variations from the general<br />
To return to factors that affect the rate of urbaniza- patterns that have been discussed indicates that condition,<br />
it is noteworthy that when columns 3 <strong>and</strong> 4 of table tions in individual economies -play a part in urbaniza-<br />
2-2 are compared, for every one of the sixty-six econ- tion. India <strong>and</strong> Burma are among the economies which<br />
omies the growth rate of urban nonlabor income st<strong>and</strong> out particularly as exceptions to some of the patsources<br />
is greater than that for rural nonlabor income terns in table 2-<strong>2.</strong> Both rank low in per capita income<br />
sources. This finding is consistent with the hypothesis <strong>and</strong> have high nonurban proportions of population, yet<br />
noted earlier, that the techniques of urban production unlike most other economies with these characteristics<br />
are easier to transfer among economies than those of they have relatively low urbanization rates. Growth rates<br />
agricultural production. Since an excess of urban over of urban <strong>and</strong> rural nonlabor income sources are largely<br />
rural nonlabor income source growth acts to foster offsetting in these two countries. The size of the Indian<br />
urbanization in this model, the rate of urban population economy might influence the result, but this consideragrowth<br />
is greater than the rate of overall population tion would not apply to Burma.<br />
growth for every one of the sixty-six economies. India <strong>and</strong> Burma are only two examples that indicate<br />
A final consideration in interpreting table 2-2 is the the usefulness of more analytic work for underst<strong>and</strong>ing<br />
role of the fraction of the population which is urban. If patterns of urbanization. For any one of the economies,<br />
this fraction is small, any differential change between more detailed analysis could be undertaken, with more<br />
urban <strong>and</strong> rural nonlabor income source growth has a refined identification of the factors that affect urbanizamagnified<br />
effect on urban population. The reason is that tion as an object.<br />
a given absolute change has a greater percentage effect Further comparative analytic work to contrast <strong>and</strong><br />
on a small number than on a large number. This effect is underst<strong>and</strong> differences among regions <strong>and</strong> different<br />
reflected in equation 2-9, in which the coefficient Fa / types of economies is recommended to strengthen the<br />
(1 - e) multiplies the growth rate of nonlabor income knowledge base for prediction <strong>and</strong> policy concerned with<br />
source to arrive at the urban <strong>and</strong> rural productivity economic development. Further work should give attenfactors.<br />
Thus, economies with large nonurban fractions tion to differences in industrial structure <strong>and</strong> to considin<br />
their populations tend to have greater urbanization erations that affect trade. Greater detail on types of<br />
rates. Since these economies generally have low per goods could be included, as could allowance for price<br />
capita incomes, they are the ones that have predomi- effects, age composition, education, dependency, <strong>and</strong><br />
nantly experienced the highest urbanization rates. other considerations bearing on work participation. The<br />
Progressing down the table to increasingly higher- assumption that the number of workers in urban areas<br />
income economies, one finds that the difference be- goes h<strong>and</strong> in h<strong>and</strong> with the population of these areas<br />
tween urban <strong>and</strong> rural nonlabor income source growth<br />
stays about the same or becomes larger, but the contributions<br />
of the urban <strong>and</strong> rural productivity factors<br />
decrease because of the declining value of the multiplier<br />
would be modified.<br />
Fa I (1 - E). Since Fa = 1 - Fu, the multiplier will be Conclusion<br />
greater than one if the fraction of the population that is<br />
urban is greater than the share of income that accrues to This chapter suggests that the degree to which a<br />
labor. The condition would be fulfilled for all but a country succeeds in fostering growth of urban produch<strong>and</strong>ful<br />
of the economies, regardless of the value of e, tivity is likely to be the major determinant of its urbanbut<br />
the multiplier falls more <strong>and</strong> more toward one ization. Population growth will continue to be a source<br />
toward the bottom of the table. The rates of growth of of both urban <strong>and</strong> nonurban growth. Countries that lag<br />
urban population decline until they are not much in growth of agricultural productivity will experience<br />
greater than the rate of overall population growth. This added urbanization pressures.<br />
is shown in equation 2-9, which gives an analytic expla- As important as these general findings is the usefulnation<br />
for the descriptive finding of the association be- ness of the framework of this chapter as a basis for<br />
tween the fraction that is urban <strong>and</strong> the growth rate of quantifying the experience of individual countries. Preurban<br />
population. diction <strong>and</strong> planning are enhanced, <strong>and</strong> the economic<br />
The analysis presented here of factors that affect ur- factors that influence the effectiveness of policies conbanization<br />
was carried out for three other cases: a cerned with urbanization can be better understood.
30 George S. Tolley<br />
Bibliography <strong>Development</strong> <strong>and</strong> Cultural Change, vol. 3, no. 1 (October),<br />
pp. 4-5.<br />
Armstrong, Harvey, <strong>and</strong> Jim Taylor. 1978.Regional<strong>Economic</strong> . 1957. "<strong>Urbanization</strong> <strong>and</strong> <strong>Economic</strong> Growth in Asia."<br />
Policy <strong>and</strong> Its Analysis. Deddington, Oxford, U.K.: Philip <strong>Economic</strong> <strong>Development</strong> <strong>and</strong> Cultural Change, vol. 6, no. 1<br />
Allan. (October), pp. 42-54.<br />
Arriaga, Edward. 1970. "A New Approach to the Measurement Kelley, Allen C., <strong>and</strong> Jeffrey G. Williamson, 1979. Modeling<br />
of <strong>Urbanization</strong>." <strong>Economic</strong> <strong>Development</strong> <strong>and</strong> Cultural <strong>Urbanization</strong> <strong>and</strong><strong>Economic</strong> Growth. Working Paper 79-81,<br />
Change, vol. 18, no. 2 (January), pp. 206-18. Laxenburg, Austria: International Institute for Applied Sys-<br />
Berry, Brian J. L. 1961. "City Size Distributions <strong>and</strong> <strong>Economic</strong> tems Analysis. September.<br />
<strong>Development</strong>." <strong>Economic</strong> <strong>Development</strong> <strong>and</strong> Cultural Lasvwn, J. R. 1973. "<strong>Urbanization</strong> <strong>and</strong> <strong>Development</strong>-The<br />
Change, vol. 9, no. 4, pt. 1 (July), pp. 573-88. Temporal Interaction Between Geographical <strong>and</strong> Sectoral<br />
Bourne, L. S., <strong>and</strong> J. W. Simmons, eds. 1978. Systems of Cities: Cluster." Urban Studies, vol. 10, no. 2 (June), pp. 163-88.<br />
Readings on Structure, Growth, <strong>and</strong> Policy. New York: Linn, J. F. 1979. "Automotive Taxation in the Cities of Develop-<br />
Oxford University Press. ing Countries." Nagarlok (January).<br />
Breese, Gerald. 1966. <strong>Urbanization</strong> in Newly Developing Lipton, Michael. 1977. Why PoorPeople Stay Poor: UrbanBias<br />
Countries. Englewood Cliffs, N.J.: Prentice-Hall. in World <strong>Development</strong>. Cambridge, Mass.: Harvard Uni-<br />
Chapin, Stuart F., Jr. 1971. "Selected Theories of Urban versity Press.<br />
Growth <strong>and</strong>Structure." In L. S.Bourne, ed.,InternalStruc- Miller, J. C. 1979. "Regional <strong>Development</strong>: A Review of the<br />
ture of the City: Readings on Space <strong>and</strong> Environment. New State of the Art." AID 20523. Agency for International De-<br />
York: Oxford University Press. velopment, Washington, D.C. Processed.<br />
Colosio, Donaldo. 1979. <strong>Urbanization</strong> <strong>and</strong><strong>Economic</strong> Develop- Mills, Edwin. 1971. "City Sizes in Developing Economies." In<br />
ment in Mexico. Working Paper 79-19. Laxenburg, Austria: Raanan Weitz, ed., <strong>Urbanization</strong> <strong>and</strong> the Developing Coun-<br />
International Institute for Applied Systems Analysis. tries. Report on the Sixth Rehovot Conference. Praeger<br />
Currie, L. 1975. "The Interrelation of Urban <strong>and</strong> National Special Studies in International <strong>Economic</strong>s <strong>and</strong> Develop-<br />
<strong>Economic</strong> Planning." Urban Studies, vol. 12, no. 1 (Febru- ment. New York: Praeger.<br />
ary), pp. 37-46. _ . 197<strong>2.</strong> 'Welfare Aspects of National Policy toward City<br />
Davis, Kingsley. 1965. "The <strong>Urbanization</strong> of the Human Popu- Sizes." Urban Studies, vol. 9, no. 1 (February), pp. 117-24.<br />
lation." Scientific American, vol. 213 (September), pp. 28, Pascal, Anthony H. 1971. "Urban Growth <strong>and</strong> <strong>Development</strong>:<br />
40. Discussion." American <strong>Economic</strong> Review, vol. 61, no. 2<br />
- 1971. "The Role of <strong>Urbanization</strong> in the <strong>Development</strong> (May), pp. 357-59.<br />
Process." In Raanan Weitz, ed., <strong>Urbanization</strong> <strong>and</strong> the De- Renaud, Bertr<strong>and</strong>. 1981. National <strong>Urbanization</strong> Policies in<br />
veloping Countries. Report on the Sixth Rehovot Confer- Developing Countries. New York: Oxford University Press.<br />
ence. Praeger Special Studies in International <strong>Economic</strong>s Reynolds, L. G. 1975. "China as a Less Developed Economy."<br />
<strong>and</strong> <strong>Development</strong>. New York: Praeger. American <strong>Economic</strong> Review, vol. 65, no. 3 (June), pp. 418-<br />
Felstehausen, H. 1971. "Planning Problems in Improving Co- 28.<br />
lombian Roads <strong>and</strong> Highways." L<strong>and</strong> <strong>Economic</strong>s, vol. 47, Richardson, Harry W. 1977. City Size <strong>and</strong> National Spatial<br />
no. 1 (February), pp. 1-13. Strategies in Developing Countries. World Bank Staff Work-<br />
Friedmann, J., <strong>and</strong> C. Weaver. 1979. Territory <strong>and</strong> Function. ing Paper 25<strong>2.</strong> Washington, D.C.<br />
University of Califomia Press. Rondinelly, Dennis A., <strong>and</strong> Kenneth Ruddle. 1978. Urbaniza-<br />
Hansen, Niles M. 1969. "Regional <strong>Development</strong> <strong>and</strong> the Rural tion <strong>and</strong> Rural <strong>Development</strong>: A Spatial Policy for Equitable<br />
Poor." Journal ofHuman Resources, vol. 4, no. 2 (Spring), Growth. New York: Praeger.<br />
pp. 205-14. Tolley, George S. 1974. "The Welfare <strong>Economic</strong>s of City Big-<br />
Hansen, Niles M., ed. 1976. Public Policy <strong>and</strong> Regional Eco- ness." Journal of Urban <strong>Economic</strong>s, vol. 1, no. 3, pp. 324nomic<strong>Development</strong>.<br />
TheExperience ofNine Western Coun- 45.<br />
tries. Cambridge, Mass.: Ballinger. Tolley, G. S., <strong>and</strong> G. D. Gwyer. 1967. "Intemational Trade in<br />
Harberger, C. 1970. "<strong>Economic</strong> Policy Problems in Latin Agricultural Products in Relation to <strong>Economic</strong> Develop-<br />
America: A Review." Journal of Political Economy, vol. 78, ment." In Herman M. Southworth <strong>and</strong> Bruce F. Johnston,<br />
no. 4, pt. 2 (January-August), pp. 1007-16. eds., Agricultural <strong>Development</strong> <strong>and</strong> <strong>Economic</strong> Growth.<br />
Henderson, J. V. 1980. "A Framework for International Com- New York: Cornell University Press. Pp. 403-47.<br />
parisons of Systems of Cities." Urban <strong>and</strong> Regional Report Tolley, G. S., <strong>and</strong> G. K. Kripalani. 1974. "Stages of Develop-<br />
80-3, World Bank, Washington, D.C. Processed. ment <strong>and</strong> <strong>Urbanization</strong>." In A. A. Brown, J. A. Licori, <strong>and</strong><br />
Holleb, D. B. 1976. "Mao's Legacy for Revolutionary Urban E. Neuberger, eds., Urban <strong>and</strong> Social <strong>Economic</strong>s in Market<br />
<strong>Development</strong>." Working Paper. University of Chicago, Cen- <strong>and</strong> Planned Economies. New York: Praeger.<br />
ter for Urban Studies. December. Tolley, G. S., <strong>and</strong> S. Smidt. 1964. "Agriculture <strong>and</strong> the Secular<br />
Hoselitz, Bert. 1954. "Introduction; The Role of Cities in Position of the U.S. Economy."Econometrica, vol. 32, no.4<br />
<strong>Economic</strong> <strong>Development</strong> <strong>and</strong> Cultural Change." <strong>Economic</strong> (October), pp. 554-75.
<strong>Urbanization</strong> <strong>and</strong> <strong>Economic</strong> <strong>Development</strong> 31<br />
Tolley, G. S., <strong>and</strong> Barton Smith. 1975. "Social Costs <strong>and</strong> the tives for Spatial Intervention for Developing Countries."<br />
Rural-Urban Balance." In Earl 0. Heady <strong>and</strong> Larry R. Whit- Working Paper. Chicago: University of Chicago.<br />
ing, eds., Externalities in the Transformation of Agricul- Townroe, Peter M. 1979. Employment Decentralization Polture:<br />
Distribution of Benefits <strong>and</strong> Costs from <strong>Development</strong>. icy Instruments for Large Cities in Less Developed Coun-<br />
Ames, Iowa: Iowa State University Press. tries. Vol. 10, pt. 2, in D. R. Diamond <strong>and</strong> J. McLoughlin,<br />
Tolley, George S., Philip E. Graves, <strong>and</strong> John L. Gardner, eds. eds., Progress in Planning. Elmsford, N.Y.: Pergamon.<br />
1979. Urban Growth Policy in a Market Economy. New Wheaton, W. C., <strong>and</strong> H. Shishido. 1979. "Urban Concentra-<br />
York: Academic Press. tion, Agglomeration Economies, <strong>and</strong> the Level of <strong>Economic</strong><br />
Tolley, G. S., R. J. Krumm, <strong>and</strong> P. Graves. "Design of Incen- <strong>Development</strong>." Working Paper. Cambridge, Mass.: MIT.