Mapping Manchester - University of Manchester
Mapping Manchester - University of Manchester
Mapping Manchester - University of Manchester

Create successful ePaper yourself
Turn your PDF publications into a flip-book with our unique Google optimized e-Paper software.
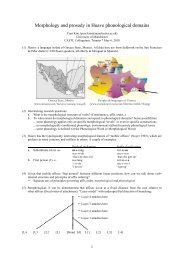
The car and the city<br />
SELNEC’s 1962 Highway Plan report distilled a range <strong>of</strong> statistics on the use<br />
<strong>of</strong> the road network in the region, using several distinct styles <strong>of</strong> thematic<br />
mapping to display and ‘dramatise’ the data. Maps are powerful visual<br />
tools which can be used to construct complex patterns into plausible and<br />
authoritative looking evidence. The examples reproduced here, both addressing<br />
the problems <strong>of</strong> immobility on <strong>Manchester</strong>’s roads in the early 1960s.<br />
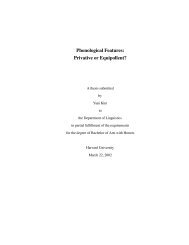
The issue <strong>of</strong> road congestion on key routes was a focus <strong>of</strong> the SELNEC report and has become<br />
progressively more severe in subsequent decades. A bold scheme for a congestion charge to ‘encourage’<br />
drivers <strong>of</strong>f the roads was recently advanced by the Association <strong>of</strong> Greater <strong>Manchester</strong> Authorities as part<br />
<strong>of</strong> a package <strong>of</strong> transport investment. The schematic above, on the back <strong>of</strong> a promotional leaflet, tried<br />
to explain when and where drivers would be charged, along with other key elements <strong>of</strong> public transport<br />
provision. The referendum over the scheme provoked a vigorous campaign from supporters and<br />
opponents alike. The public across Greater <strong>Manchester</strong> voted strongly against the congestion charge<br />
in December 2008. It has been suggested that this rejection partly reflected the positioning <strong>of</strong> charging<br />
points. Taking the charging zone out as far as the M60 meant many key facilities and businesses, such<br />
as the Trafford Centre, fell within the zone.’<br />
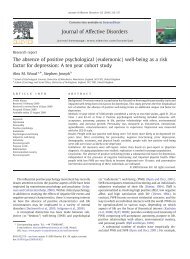
Isochronic map reproduced from<br />
S.E.L.N.E.C. A Highway Plan, 1962<br />
Contours <strong>of</strong> equal travel times<br />
represent varying geographical<br />
patterns <strong>of</strong> access into <strong>Manchester</strong><br />
for drivers commuting along trunk<br />
roads in the morning rush hour.<br />
(Courtesy <strong>of</strong> Chetham’s Library)<br />
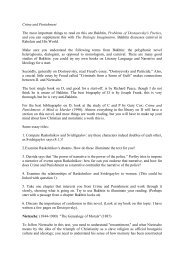
This hefty report, with its dramatic<br />
black and red cover – quite atypical <strong>of</strong><br />
anodyne transport studies – is packed<br />
with statistics, diagrams and maps.<br />
(Courtesy <strong>of</strong> Chetham’s Library)<br />
9