Mapping Manchester - University of Manchester
Mapping Manchester - University of Manchester
Mapping Manchester - University of Manchester

Create successful ePaper yourself
Turn your PDF publications into a flip-book with our unique Google optimized e-Paper software.
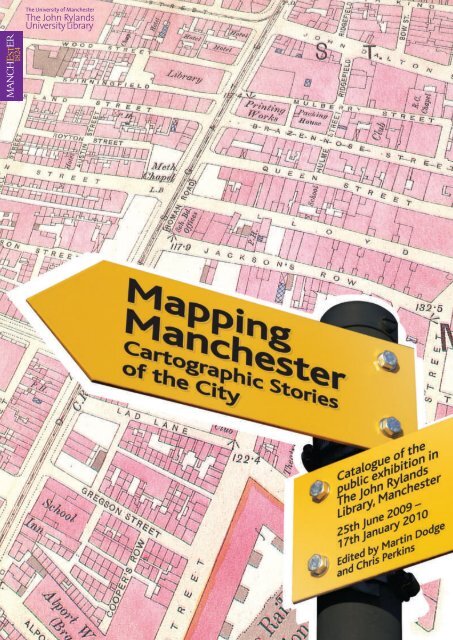
<strong>Mapping</strong> <strong>Manchester</strong><br />
Cartographic Stories <strong>of</strong> the City<br />
Exhibition catalogue edited by Martin Dodge and Chris Perkins<br />
Geography, School <strong>of</strong> Environment and Development<br />
The <strong>University</strong> <strong>of</strong> <strong>Manchester</strong><br />
Contents<br />
About the exhibition 3<br />
Exhibition acknowledgements 5<br />
Cabinet 1: The map makers 6<br />
Cabinet 2: The car and the city 8<br />
Cabinet 3: Public transport 10<br />
Cabinet 4: City <strong>of</strong> industry 12<br />
Cabinet 5: Wealth and poverty 14<br />
Cabinet 6: The moral city 16<br />
Cabinet 7: <strong>Mapping</strong> the future city 18<br />
Cabinet 8: Leisure and pleasure 20<br />
Cabinet 9: The hydraulic city 22<br />
Cabinet 10: Bird’s eye views <strong>of</strong> the city 24<br />
Panel 1: <strong>Mapping</strong> <strong>Manchester</strong> by cartographic scale 26<br />
Panel 2: <strong>Mapping</strong> <strong>Manchester</strong> by cartographic theme 27<br />
Panel 3: <strong>Mapping</strong> <strong>Manchester</strong> through time 28<br />
Panel 4: <strong>Mapping</strong> <strong>Manchester</strong> by changing cartographic design 29<br />
PC display 1: Population map for Greater <strong>Manchester</strong> 30<br />
PC display 2: Virtual model <strong>of</strong> <strong>Manchester</strong> city centre 31<br />
Piccadilly Gardens model 32<br />
Listing <strong>of</strong> exhibition items 33<br />
<strong>Mapping</strong> <strong>Manchester</strong> epilogue 38<br />
Exhibition opening, 24th June 2009.<br />
Photography courtesy <strong>of</strong> Tinho da Cruz.<br />
Copyright: Creative Commons license<br />
The John Rylands Library<br />
150 Deansgate,<br />
<strong>Manchester</strong><br />
M3 3EH, UK.<br />
0161 306 0555<br />
www.manchester.ac.uk/library<br />
jrl.visitors@manchester.ac.uk<br />
2009<br />
2
About the exhibition<br />
This exhibition reveals some <strong>of</strong> the ways in which mapping is ingrained into<br />
urban life. It demonstrates how maps change over time in response to<br />
technology, society and economic imperatives, highlighting visually striking<br />
cartographic representations <strong>of</strong> <strong>Manchester</strong>.<br />
<strong>Mapping</strong> <strong>Manchester</strong> showcases the wealth <strong>of</strong> cartographic treasures held by the <strong>University</strong> <strong>of</strong> <strong>Manchester</strong> and<br />
other institutions in the city, including generous loans <strong>of</strong> materials from the <strong>Manchester</strong> Archives and Local<br />
Studies Library. The maps exhibited are more than just ‘pretty pictures’ – they are powerful tools, instrumental<br />
to the development <strong>of</strong> contemporary <strong>Manchester</strong>, and can be read as rich stories <strong>of</strong> urban life. Over eighty<br />
different maps, plans, diagrams and photographs <strong>of</strong> the city – published over the last two hundred and fifty<br />
years – are on display. These range in date from the first large scale survey <strong>of</strong> the city published by William<br />
Green in 1794, to a 2008 statistical map <strong>of</strong> binge drinking hotspots across <strong>Manchester</strong>. A wide range <strong>of</strong><br />
formats can be seen – from network diagrams, building plans and strip maps, to three-dimensional bird’s-eye<br />
views, such as Heywood’s iconic Victorian Pictorial Map <strong>of</strong> <strong>Manchester</strong> and digital animated mapping.<br />
From SELNEC Highway Plan, 1962<br />
(Courtesy <strong>of</strong> Chetham’ s Library)<br />
Richard Bastow’s map <strong>of</strong><br />
housing, 1880s<br />
3
About the exhibition<br />
The cartographic stories told in the exhibition include:<br />
People behind the map, focusing upon contrasts in<br />
commercial mapping <strong>of</strong> <strong>Manchester</strong> over a two<br />
hundred year period.<br />
The role <strong>of</strong> mapping in foretelling developments in<br />
road and public transport networks.<br />
<strong>Manchester</strong> as an industrial powerhouse and<br />
commercial centre, looking at the Ship Canal and<br />
Trafford Park.<br />
<strong>Mapping</strong> contrasts between rich and poor housing<br />
in the city – through social surveys such as Richard<br />
Bastow’s map and the changing built environment<br />
<strong>of</strong> Hulme.<br />
Sanitary infrastructure to improve the health <strong>of</strong><br />
citizens is examined via maps <strong>of</strong> water supply,<br />
public baths and sewage systems.<br />
Changing moralities in the city is considered<br />
through representations <strong>of</strong> disease and drinking.<br />
The pleasures <strong>of</strong> mapping is brought to life in<br />
terms <strong>of</strong> visitors’ guides to Belle Vue Zoo and<br />
Pleasure Gardens, now no longer in existence.<br />
A series <strong>of</strong> display boards also highlight the<br />
different techniques employed by pr<strong>of</strong>essional<br />
cartographers to map the city. These displays<br />
examine change over time, scale, thematic<br />
content and design.<br />
We hope this exhibition will encourage you to visit <strong>Manchester</strong>’s rich map<br />
collections and to explore for yourself the changing cartographic stories <strong>of</strong> the city.<br />
The exhibition has been curated by Martin Dodge and Chris Perkins who work as lecturers in Geography in the<br />
School <strong>of</strong> Environment and Development at the <strong>University</strong> <strong>of</strong> <strong>Manchester</strong>. It builds upon a longstanding research<br />
interest in the many roles that maps play in society.<br />
For further information about their research, see www.sed.manchester.ac.uk/geography/research/maps/<br />
Detail from Goad Insurance Plan <strong>of</strong> <strong>Manchester</strong>,<br />
book 1, vol. 1, 1886 (Courtesy <strong>of</strong> Digital Archives)<br />
From John Heywood’s Pictorial Map <strong>of</strong> <strong>Manchester</strong><br />
and Salford, 1886 (Courtesy <strong>of</strong> Chetham’s Library)<br />
4
Exhibition acknowledgements<br />
Many items in the exhibition have been generously loaned by the <strong>Manchester</strong><br />
Archives and Local Studies Library. We are most grateful to Helen Lowe<br />
and Michael Powell <strong>of</strong> these two institutions for their assistance with all<br />
our enquiries.<br />
The exhibition would not have been possible without the graphical wizardry <strong>of</strong> Nick Scarle in the Cartographic<br />
Unit <strong>of</strong> the School <strong>of</strong> Environment and Development, <strong>University</strong> <strong>of</strong> <strong>Manchester</strong>.<br />
We should also like to thank the following for all their help with other loans and for the production <strong>of</strong> exhibition<br />
materials: Andrew Taylor; Richard Brook, <strong>Manchester</strong> School <strong>of</strong> Architecture; Alex Singleton, <strong>University</strong> College,<br />
London; Richard Dean, Canalmaps Archive; Karl Hennermann and Nigel Lawson, <strong>University</strong> <strong>of</strong> <strong>Manchester</strong>;<br />
Simon Mabey and Charles Edwards, ARUP; Peter Davenport, Digital Archives; Jon Davies, ICP Framing Ltd;<br />
and Morag Robson, who has the keys to the map cabinets!<br />
We are grateful to Rylands Library staff Donna Pope, Françoise Sullivan, Nina Main and Janet Woolwark for<br />
responding so helpfully to our assorted enquiries.<br />
For varied and intellectual discussions formulating the exhibition we would like to acknowledge, in particular,<br />
Paul Hindle, Bob Barr, Terry Wyke and Brian Robson.<br />
Lastly, thanks are also due to sterling work <strong>of</strong> Jacqui Fortnum and Jim Duff at Rylands Library, Deansgate for<br />
putting the exhibition together.<br />
Sponsors<br />
Design by Epigram<br />
www.epigram.co.uk<br />
The exhibition and the events programme has been generously supported by:<br />
<strong>Manchester</strong> Geomatics<br />
<strong>Manchester</strong> Geographical Society<br />
Laing O’Rourke<br />
ARUP<br />
John McAslan & Partners<br />
5
The map makers<br />
The story <strong>of</strong> the people behind map production is told here by contrasting an<br />
historical example <strong>of</strong> commercial cartography, alongside a contemporary<br />
equivalent.<br />
The first large-scale mapping <strong>of</strong> <strong>Manchester</strong> was carried out by William Green, who surveyed the city<br />
towards the end <strong>of</strong> the 1780s. At this date map-making was an expensive and risky enterprise. It<br />
involved laborious surveying followed by the engraving <strong>of</strong> copper plates. Maps were printed from<br />
these and sold to a limited, wealthy, audience. Cartographers used whatever information they could<br />
acquire, sometimes through the wholesale copying <strong>of</strong> other people’s maps and surveys. Commercial<br />
success for map-makers <strong>of</strong>ten depended less on accuracy and currency than on getting the map out to<br />
the market first.<br />
Charles Laurent managed to get access to Green’s survey, and issued a smaller scale map <strong>of</strong> <strong>Manchester</strong><br />
before Green was able to publish his large-scale map. Yet in many respects Laurent’s map can be<br />
regarded as an inferior design, albeit a more successful publication.<br />
6
The map makers<br />
Contemporary map-making relies upon different production technologies, but<br />
remains a risky commercial enterprise. The six different editions <strong>of</strong> Andrew<br />
Taylor’s large-scale map <strong>of</strong> the city centre <strong>of</strong> <strong>Manchester</strong> has been produced to<br />
occupy a market niche not filled by the Ordnance Survey, or commercial rivals<br />
like Geographers’ A-Z.<br />
The basis for Taylor’s maps is provided by large-scale Ordnance Survey plans. He supplements this ‘raw’<br />
data with a rigorous ground survey, recording changing land use and business names. By focusing on<br />
the commercial core <strong>of</strong> the city, he can publish the map at a larger scale than commercial, street-finding<br />
alternatives, providing greater detail such as the location <strong>of</strong> Sam’s Chop House on Back Pool Fold, or the<br />
waterfall in Millennium Square. Print runs are sufficient to sell out in two or three years, by which time<br />
a new revision has been undertaken by Taylor.’<br />
Excerpt from <strong>Manchester</strong> City Centre, Andrew Taylor, Sixth Edition 2008<br />
This detail highlights the commercial core <strong>of</strong> the city, with contrasting land-use indicated by a striking use <strong>of</strong> colour.<br />
(John Rylands <strong>University</strong> Library Map Collection)<br />
7
The car and the city<br />
The rapid expansion <strong>of</strong> car ownership since the 1950s has had a pr<strong>of</strong>ound effect<br />
on <strong>Manchester</strong>. New routes have cut across the city and many roads have been<br />
widened and reconfigured. The planners responsible for these new highways<br />
have relied on a multitude <strong>of</strong> maps and models.<br />
The map displayed here is the triumphal product <strong>of</strong> the South-East Lancashire and North-East Cheshire<br />
Area Highway Engineering Committee. The flagship representation <strong>of</strong> their 1962 Highway Plan set forth<br />
the need for numerous road building schemes deemed essential once funds became available. It<br />
symbolises the hopes <strong>of</strong> the early 1960s that visionary planning could, through scientific analysis,<br />
improve the functioning <strong>of</strong> roads and thus the efficiency <strong>of</strong> the city region. Much <strong>of</strong> this grand vision<br />
was never realised, although some key aspects <strong>of</strong> the inner and outer ring roads have come to pass,<br />
albeit in a the piecemeal fashion. What has become the M60 orbital motorway took until 2000 to realise.<br />
8
The car and the city<br />
SELNEC’s 1962 Highway Plan report distilled a range <strong>of</strong> statistics on the use<br />
<strong>of</strong> the road network in the region, using several distinct styles <strong>of</strong> thematic<br />
mapping to display and ‘dramatise’ the data. Maps are powerful visual<br />
tools which can be used to construct complex patterns into plausible and<br />
authoritative looking evidence. The examples reproduced here, both addressing<br />
the problems <strong>of</strong> immobility on <strong>Manchester</strong>’s roads in the early 1960s.<br />
The issue <strong>of</strong> road congestion on key routes was a focus <strong>of</strong> the SELNEC report and has become<br />
progressively more severe in subsequent decades. A bold scheme for a congestion charge to ‘encourage’<br />
drivers <strong>of</strong>f the roads was recently advanced by the Association <strong>of</strong> Greater <strong>Manchester</strong> Authorities as part<br />
<strong>of</strong> a package <strong>of</strong> transport investment. The schematic above, on the back <strong>of</strong> a promotional leaflet, tried<br />
to explain when and where drivers would be charged, along with other key elements <strong>of</strong> public transport<br />
provision. The referendum over the scheme provoked a vigorous campaign from supporters and<br />
opponents alike. The public across Greater <strong>Manchester</strong> voted strongly against the congestion charge<br />
in December 2008. It has been suggested that this rejection partly reflected the positioning <strong>of</strong> charging<br />
points. Taking the charging zone out as far as the M60 meant many key facilities and businesses, such<br />
as the Trafford Centre, fell within the zone.’<br />
Isochronic map reproduced from<br />
S.E.L.N.E.C. A Highway Plan, 1962<br />
Contours <strong>of</strong> equal travel times<br />
represent varying geographical<br />
patterns <strong>of</strong> access into <strong>Manchester</strong><br />
for drivers commuting along trunk<br />
roads in the morning rush hour.<br />
(Courtesy <strong>of</strong> Chetham’s Library)<br />
This hefty report, with its dramatic<br />
black and red cover – quite atypical <strong>of</strong><br />
anodyne transport studies – is packed<br />
with statistics, diagrams and maps.<br />
(Courtesy <strong>of</strong> Chetham’s Library)<br />
9
Public transport<br />
Most people in <strong>Manchester</strong> move around the city using public transport.<br />
Changes in network patterns have been mapped out over the last century and<br />
a half. Some <strong>of</strong> these maps promote the effectiveness <strong>of</strong> bus, train and tram<br />
routes and stations across <strong>Manchester</strong>. Others emphasise a more practical use<br />
and are designed to help passengers find their way. Policy makers have also<br />
created mapping to help them monitor passenger numbers, travel times, and to<br />
plan where future lines need to be developed. Large-scale surveys <strong>of</strong> stations,<br />
tramways, or railway lines conducted at different times reveal a fascinating level<br />
<strong>of</strong> historical detail about the local significance <strong>of</strong> public transport to the city.<br />
10
Contemporary mapping<br />
<strong>of</strong> public transport<br />
Public transport continues to evolve in response to government policy, changing<br />
demands and available funding. Not all proposals come to fruition: <strong>Manchester</strong><br />
still has no underground railway despite the various schemes put forward over<br />
the last hundred years. Bus routes proliferate across the city, and trams returned<br />
in the 1990s with Metrolink <strong>of</strong>fering new connections into the city centre. Older<br />
networks survive amidst the forward planning. <strong>Mapping</strong> continues to promote<br />
the competitive advantage <strong>of</strong> the networks, chart their use and guide travellers<br />
across the city.<br />
Reproduced from The Picc-Vic Project, Greater <strong>Manchester</strong> Council, 1975<br />
The ambitious early 1970s plans for an underground link between Piccadilly and Victoria stations were never realised<br />
despite this mapping.<br />
(John Rylands <strong>University</strong> Library, 711.7/G99)<br />
11
City <strong>of</strong> industry<br />
<strong>Manchester</strong> is a city <strong>of</strong> industry – a landscape <strong>of</strong> factories and warehouses<br />
developed over the last one hundred and sixty years. The changing fortunes<br />
<strong>of</strong> these industries have been captured in a range <strong>of</strong> different site plans,<br />
promotional displays and specialised maps.<br />
At the heart <strong>of</strong> the industrial metropolis lay the <strong>Manchester</strong> Docks and Trafford Park Industrial Estate.<br />
Developing from late 1890s as a zone for manufacturing industry, by the 1930s Trafford Park had grown<br />
into a sprawl <strong>of</strong> factories, warehouses and chemical plants – as laid out in the eye-catching promotional<br />
map on display in this case. The patches in green indicate available sites for new factories. The map also<br />
illustrates the importance <strong>of</strong> transportation – detailing systems <strong>of</strong> railways, roads and canals. The<br />
number <strong>of</strong> wharves and depots clearly illustrates that <strong>Manchester</strong>’s commercial success depended as<br />
much on distribution as production.<br />
Directly across the <strong>Manchester</strong> Ship Canal from Trafford Park lay the docks and warehouse complexes.<br />
This hub <strong>of</strong> commercial shipping is captured in the detailed nineteenth-century bird’s-eye view. The old<br />
<strong>Manchester</strong> Racecourse is also clearly visible in this drawing. By 1905 it had been destroyed to make way<br />
for Dock No. 9. Also prominent in the foreground is the large grain store, shown in greater detail in the<br />
Goad plan.<br />
12
Reproduced from Port <strong>of</strong> <strong>Manchester</strong>: Illustrated History <strong>of</strong> the <strong>Manchester</strong> Ship Canal,1708-1901<br />
(John Rylands <strong>University</strong> Library, OLD/6/21/4)<br />
Goad plan <strong>of</strong> grain elevator and store, reproduced<br />
from <strong>Manchester</strong> Carriers’ Warehouses, Book 3, 1900<br />
Chas Goad and company produced specialist mapping<br />
<strong>of</strong> commercial buildings and industrial sites for<br />
the purpose <strong>of</strong> fire insurance underwriting. The<br />
exceptionally detailed and frequently revised plans<br />
were the result <strong>of</strong> laborious surveying. In comparison<br />
to other maps, they are rich in contextual information<br />
– including details on construction materials. The grain<br />
storage building displayed here includes precise<br />
locations <strong>of</strong> fire hydrants and an indication <strong>of</strong> the<br />
uses <strong>of</strong> different floors <strong>of</strong> the building.<br />
(Courtesy <strong>of</strong> Digital Archives,<br />
www.digitalarchives.co.uk)<br />
13
Wealth and poverty<br />
<strong>Manchester</strong>’s burst <strong>of</strong> population growth in the first half <strong>of</strong> the nineteenth<br />
century brought with it severe housing problems. By the 1840s the ‘Shock City’<br />
became notorious for its slums.<br />
Concerted efforts from social reformers to improve the housing <strong>of</strong> the poor can be seen in the<br />
cartographic results <strong>of</strong> their surveys. Richard Bastow’s survey in the late 1880s mapped out the age <strong>of</strong><br />
housing as part <strong>of</strong> a sanitary campaign, and in 1904 a report on housing conditions, produced by The<br />
Citizens’ Association <strong>of</strong> <strong>Manchester</strong>, included a detailed map <strong>of</strong> housing quality. The areas <strong>of</strong> worst<br />
housing were shaded in dark colours, and the map shows a cluster which almost completely encircles<br />
the commercial core <strong>of</strong> the city.<br />
From the mid-nineteenth century private estates <strong>of</strong> substantial suburban villas were constructed, away<br />
from the poverty and crime <strong>of</strong> the inner neighbourhoods, for the affluent beneficiaries <strong>of</strong> <strong>Manchester</strong>’s<br />
industrial prosperity. An example <strong>of</strong> these developments can be seen in the sales map for the Oaks<br />
Estate, planned in 1843. In its bucolic design, individual houses are arranged in their own wooded<br />
grounds with curving driveways. The area <strong>of</strong> Oaks Estate is now occupied by the, not quite so elite,<br />
Owens Park student halls <strong>of</strong> residence <strong>of</strong> the <strong>University</strong> <strong>of</strong> <strong>Manchester</strong>!<br />
14
Re-housing in Hulme<br />
The story <strong>of</strong> social housing in <strong>Manchester</strong> is clearly illustrated by the inner city<br />
neighbourhood <strong>of</strong> Hulme, which has undergone a sequence <strong>of</strong> clearance and<br />
rebuilding programmes over the last eighty years or so. Starting in 1933 a<br />
wholesale scheme was enacted by the City Council to do away with back-toback<br />
housing. The three areas shaded purple on the plan displayed here were to<br />
be cleared. The page from the schedule shown lists some <strong>of</strong> the properties to be<br />
demolished – setting out the property owners but generally not the residents<br />
who were to be affected.<br />
Moving forward fifty years, Hulme underwent another round <strong>of</strong> wholesale housing renewal. This<br />
included the construction <strong>of</strong> four large multi-storey deck-access blocks known as the Crescents. In the<br />
layout plan the slender curving blocks are situated in parkland with playgrounds and pedestrian routes.<br />
In their 1965 briefing the architects drew inspirational parallels to the Georgian Crescents <strong>of</strong> Bath for<br />
the design.<br />
The Hulme 5 Crescents soon turned into an archetype <strong>of</strong> public-housing failure, gaining a reputation for<br />
their poor construction and for a high level <strong>of</strong> crime. They were demolished in 1991-1992 and replaced<br />
by a new mix <strong>of</strong> smaller scale housing units and flats.<br />
Folded map included with Hulme 5 Redevelopment: Report on Design, Hugh Wilson and Lewis Womersley, 1965<br />
(Courtesy <strong>of</strong> Chetham’s Library)<br />
15
The moral city<br />
Maps have social power and have been employed to demonstrate civilising<br />
factors in urban life as well as the temptations and risks that go with living in<br />
the city. Victorian middle-class social reformers sought to address the wide<br />
disparities in living conditions across <strong>Manchester</strong> by mapping out what they<br />
thought were the more dystopic aspects <strong>of</strong> urban life. The threat <strong>of</strong> disease<br />
was charted, and solutions presented in the form <strong>of</strong> hard work and a cleaner,<br />
healthier, lifestyle. The workhouse and public baths were <strong>of</strong>fered as possible<br />
solutions to the dangers, depravities and dirt <strong>of</strong> the city.<br />
16
The moral city<br />
Temperance reformers in the late Victorian period argued for a causal<br />
connection between poverty and the distribution <strong>of</strong> places where the demon<br />
drink could be purchased. A ‘rash’ <strong>of</strong> outlets are seen to cluster in the poorer<br />
parts <strong>of</strong> <strong>Manchester</strong> on the Drink Map. A tension between the pleasures <strong>of</strong><br />
drink and its opposition to an ethos <strong>of</strong> propriety and hard work is mapped<br />
out. Alcohol consumption continues to evoke strong emotions, currently in<br />
connection with the effects <strong>of</strong> binge drinking, and mapping illustrates it to<br />
be a significantly greater problem in some parts <strong>of</strong> the contemporary city.<br />
(Courtesy <strong>of</strong> the <strong>Manchester</strong> Geographical Society)<br />
17
<strong>Mapping</strong> the future city<br />
Maps allow possible futures to be made more tangible. Sometimes they help to<br />
plan an intended journey, but <strong>of</strong>ten the future they predict is never actually<br />
enacted. Many possible futures are mapped, but the images do not always<br />
reflect a reality – <strong>of</strong>ten they illustrate urban dreams. Planners, developers<br />
and architects have historically used schematic maps and building models to<br />
persuade policy makers and patrons. On display here are imagined futures for<br />
the city centre – contrasting an early nineteenth-century scheme for Piccadilly<br />
Gardens with the utopian dreams for a remodelled city, articulated in the City<br />
<strong>of</strong> <strong>Manchester</strong> Plan published after the Second World War.<br />
The plans shown here depict grandiose proposals for a new Crescent along the northern side <strong>of</strong> the<br />
Piccadilly esplanade, proposed by William Fairbairn in 1836. The improvements were never made in this<br />
form – contrast the proposals map and perspective drawings with the excerpt from the OS Five Foot<br />
Plan <strong>of</strong> the city, published in the subsequent decade, which represents the actual layout <strong>of</strong> buildings at<br />
this time.<br />
18
The 1945 Plan<br />
The destruction <strong>of</strong> areas <strong>of</strong> <strong>Manchester</strong> during the Second World War gave<br />
planners the opportunity to imagine a very different city. Their dreams were<br />
literally mapped out in the monumental 1945 Plan. At the heart <strong>of</strong> <strong>Manchester</strong><br />
the planners imagined swaths <strong>of</strong> wide roads encircling the centre along with<br />
bold modernist architecture. This would have made a very different city to that<br />
which actually evolved, piecemeal, over the next sixty-five years. Compare their<br />
imagined map and carefully constructed drawings <strong>of</strong> an orderly and utopian<br />
dream <strong>of</strong> a city with the more recent reconstruction <strong>of</strong> the gardens – mapped<br />
out and executed to make Piccadilly into the public gateway to the city for the<br />
Commonwealth Games in 2002.<br />
Reproduced from Plate 72 City <strong>of</strong> <strong>Manchester</strong> Plan, prepared by the City Council, 1945<br />
The central area <strong>of</strong> the <strong>Manchester</strong> imagined after the Second World War: note the huge roundabout and amusement<br />
centre next to a remodelled Piccadilly.<br />
(John Rylands <strong>University</strong> Library, R91041)<br />
19
Leisure and pleasure<br />
Organised leisure activities, events, exhibitions and sporting facilities are<br />
commonly mapped in guide-books and programmes to inform and entice<br />
participants.<br />
Here you can see an historical example <strong>of</strong> such mapping – an illustrated guide to the 1887 <strong>Manchester</strong><br />
exhibition; a major event in celebration <strong>of</strong> the Royal Jubilee which was opened by the Prince <strong>of</strong> Wales.<br />
Purpose built exhibition grounds near Old Trafford included large pavilions showing the range <strong>of</strong><br />
manufactured goods and arts <strong>of</strong> the city. The exhibition also displayed a model <strong>of</strong> the Ship Canal on<br />
the eve <strong>of</strong> its construction.<br />
20
Outdoor leisure<br />
Outdoor leisure activities such as walking and running are supported by<br />
specialist mapping. This Orienteering map has been designed and printed by<br />
enthusiasts for the sport. It depicts landscape features <strong>of</strong> particular interest to<br />
Orienteers, such as density <strong>of</strong> vegetation, which do not appear on Ordnance<br />
Survey or Internet maps.<br />
<strong>Manchester</strong> has relatively few green open spaces in the city centre. To increase the opportunities for<br />
recreation there are multi-million pound plans to create a new linear park which will run for 8km<br />
along the River Irwell from Salford Quays down to The Meadows. Once realised this will create new<br />
continuous paths for walking and open up neglected parts <strong>of</strong> the river course for public enjoyment.<br />
Promotional map for the new Irwell River park, 2008<br />
(Courtesy <strong>of</strong> Salford City Council)<br />
21
The hydraulic city<br />
The ways in which engineers have harnessed water for economic gain and social<br />
well-being are illustrated in a range <strong>of</strong> maps <strong>of</strong> canals, waterworks and sewers.<br />
A defining infrastructure project, and the epitome <strong>of</strong> Victorian engineering arrogance, the Ship Canal<br />
transformed <strong>Manchester</strong> into a port city when it opened in 1894. The scheme took decades <strong>of</strong> wrangling<br />
and planning to reach fruition and the landscape view on display here shows the imagined route. It was<br />
used to galvanise public support for this hugely ambitious undertaking. The pastoral idyll implied here<br />
belies the vast scale <strong>of</strong> the engineering works required to realise this hydraulic dream.<br />
A chain <strong>of</strong> large reservoirs built by the <strong>Manchester</strong> Corporation Waterworks in Longdendale valley<br />
between 1848 and 1877 still collects rain-water <strong>of</strong>f the moors for the city. The schematic map <strong>of</strong> the<br />
system from 1881 ably demonstrates how the city began to reach out towards a wide hinterland<br />
stretching eighteen miles to the Woodhead reservoir. As displayed on the accompanying cross-sectional<br />
view, the system allows water to simply flow down hill under the power <strong>of</strong> gravity and so feed into<br />
the city.<br />
22
Reproduced from John Frederic La Trobe Bateman’s History and Description <strong>of</strong> the <strong>Manchester</strong> Waterworks, 1884<br />
Arriving in the city the fresh water from the Longdendale reservoirs was distributed by network <strong>of</strong> new mains and<br />
pipes, hidden beneath the surface <strong>of</strong> streets but made visible in this map.<br />
(John Rylands <strong>University</strong> Library, 628.1/BAT)<br />
Davyhulme sewage works<br />
Victorian engineers also tackled the problem <strong>of</strong> what to do with waste-water. Collecting and processing sewage from<br />
a growing population required significant investment, including the construction <strong>of</strong> Davyhulme sewage works by<br />
<strong>Manchester</strong> Corporation on the banks <strong>of</strong> the Ship Canal. The intricacies<strong>of</strong> its filtering and treatment <strong>of</strong> sewage, are<br />
made real in delicate line work <strong>of</strong> this original engineering plan.<br />
(Courtesy <strong>of</strong> <strong>Manchester</strong> City Archives and Local Studies Library)<br />
23
Bird’s eye views <strong>of</strong> the city<br />
Most maps depict the built environment in two-dimensions but <strong>Manchester</strong>, like<br />
all other cities, is a three-dimensional urban landscape with buildings <strong>of</strong> various<br />
heights. There has been a long history <strong>of</strong> trying to map out this third dimension<br />
to evoke a more realistic feeling <strong>of</strong> the city, more recognisable than the<br />
artificially flat map.<br />
One approach has been to highlight individual buildings, <strong>of</strong>ten simulating an elevated viewpoint. These<br />
panoramic maps allow a considerable artistic licence. Some only highlight buildings that are deemed to<br />
be significant, for example John Heywood’s map <strong>of</strong> the city. Others stress the corporate branding <strong>of</strong><br />
<strong>Manchester</strong> as in the rich ‘logoscape’ on the ro<strong>of</strong>tops <strong>of</strong> the Cityscape plan. Others alter the size <strong>of</strong><br />
certain buildings, to highlight their civic importance, exemplified in the Victorian panorama drawn<br />
by H.W. Brewer, which exaggerates the size <strong>of</strong> the Town Hall. The artistic element <strong>of</strong>ten dominates in<br />
pre-industrial prospects, but also in bird’s-eye view panoramas <strong>of</strong> the Victorian city.<br />
A second tradition in three-dimensional mapping celebrates a much more scientific approach to the<br />
depiction <strong>of</strong> the built environment. Aerial photographs can depict a bird’s-eye view with realism and<br />
precision, either as vertical images or as oblique views. When employed interactively these images create<br />
an even more powerful impression <strong>of</strong> reality displayed, even though their construction may be carefully<br />
orchestrated. ARUP’s Digital <strong>Manchester</strong> model <strong>of</strong> the city is the latest attempt to render and animate<br />
the three-dimensional complexity <strong>of</strong> the city. This can be viewed on the exhibition PC screens.<br />
24
Reproduction <strong>of</strong> A Bird’s-Eye View <strong>of</strong> <strong>Manchester</strong> In 1889<br />
Drawn by H.W. Brewer and originally published as a foldout supplement to The Graphic, 8 November 1889.<br />
(Courtesy <strong>of</strong> ICP Framing Ltd, Ashton under Lyne, www.icpframing.co.uk)<br />
25
<strong>Mapping</strong> <strong>Manchester</strong> by<br />
cartographic scale<br />
Cartographers work by simplifying the world, reducing complexity to a known geometric scale in<br />
their maps<br />
At large scales much more detailed depictions <strong>of</strong> the city can be represented legibly in a map. The<br />
larger the scale the smaller the area <strong>of</strong> the city that can be seen: for a doubling <strong>of</strong> scale there is a<br />
consequent quadrupling <strong>of</strong> the detail that can be mapped, but only a quarter <strong>of</strong> the area can be<br />
covered<br />
There is a relationship between scale and what is termed cartographic ‘generalization’: smaller<br />
scale and less detailed maps have to generalize by representing reality more abstractly with<br />
simplified point, line and area symbols. So individual houses along a street are generalized on a<br />
1:50,000 scale map as a grey block<br />
The most detailed maps appear to be most ‘like’ the world that they represent, but can never<br />
perfectly mimic the places and practices that they depict<br />
Building scale, 1890<br />
Reproduced from Book <strong>of</strong> Plans and<br />
Elevations <strong>of</strong> the John Rylands Library,<br />
original scale 1/8” to 1’<br />
(Rylands Library Archive)<br />
National Scale<br />
Topographic map <strong>of</strong> the UK,<br />
original scale ca 1:3,500,000<br />
(Reproduced from http://upload.<br />
wikimedia.org/wikipedia/<br />
commons/3/39/Topographic_<br />
Map_<strong>of</strong>_the_UK_-_English.png)<br />
Urban scale<br />
Reproduced from Ordnance Survey<br />
<strong>Manchester</strong> and Salford, Explorer Sheet 277,<br />
original scale 1:25,000<br />
(John Rylands <strong>University</strong> Library Map<br />
Collection)<br />
Continental Scale<br />
Reproduced from CIA Europe,<br />
original scale 1:19,500,000<br />
(John Rylands <strong>University</strong> Library<br />
Map Collection)<br />
Global Scale<br />
Reproduced from CIA Physical Map <strong>of</strong> the World,<br />
original scale 1:35,000,000<br />
(John Rylands <strong>University</strong> Library Map Collection)<br />
Regional scale<br />
Reproduced from Ordnance Survey Travel<br />
Map, Sheet 4 North,<br />
original scale 1:250,000<br />
(John Rylands <strong>University</strong> Library Map<br />
Collection)<br />
26
<strong>Mapping</strong> <strong>Manchester</strong> by<br />
cartographic theme<br />
Cartographers make propositions about particular aspects <strong>of</strong> the world: these propositions<br />
typically coalesce into maps that appear to concentrate upon distinct subjects or ‘themes’<br />
Tightly focused propositions are represented in very different maps <strong>of</strong> the same area, that tell<br />
singular stories <strong>of</strong> the city<br />
Increasing specialization in the mapping industry means there has been an increasing diversity <strong>of</strong><br />
mapped themes, reflecting the interests <strong>of</strong> the funding bodies, or a closely identified market<br />
demand. A military map <strong>of</strong> <strong>Manchester</strong> depicts a different city to a land use map, a map <strong>of</strong><br />
income distribution, a noise map, a map <strong>of</strong> postcode boundaries, or a geological map<br />
Different ‘thematic’ map genres have emerged with strongly specialist market niches and very<br />
different ‘looks’. Some themes are in such widespread use that they subconsciously become<br />
default views <strong>of</strong> space (e.g. the city in Britain is synonymous with the A-Z map)<br />
Income distribution in Greater <strong>Manchester</strong><br />
(Courtesy <strong>of</strong> Alex Singleton, CASA <strong>University</strong><br />
College London)<br />
Excerpt from <strong>Manchester</strong> Land Use, 1971,<br />
original scale 1:25,000<br />
(John Rylands <strong>University</strong> Library Map<br />
Collection)<br />
Excerpt from Geological Map <strong>of</strong> <strong>Manchester</strong><br />
and Ashton Under Lyme,<br />
Solid Edition 1994, original scale 1:50,000<br />
(John Rylands <strong>University</strong> Library Map<br />
Collection)<br />
Excerpt from Postcode Map,<br />
original scale 1:100,000<br />
(John Rylands <strong>University</strong> Library Map<br />
Collection)<br />
Noise Map <strong>of</strong> <strong>Manchester</strong><br />
(Reproduced from<br />
http://noisemapping.defra.gov.uk)<br />
Excerpt from Soviet Military Map <strong>of</strong><br />
<strong>Manchester</strong>,<br />
original scale 1:25,000<br />
(John Rylands <strong>University</strong> Library Map<br />
Collection)<br />
27
<strong>Mapping</strong> <strong>Manchester</strong><br />
through time<br />
Cartographers must freeze time depicting an ever-changing city at a specified date on their maps<br />
Yet maps are not instant snapshots, they emerge from a process in which survey, compilation,<br />
printing and publication dates may vary greatly, and where different parts <strong>of</strong> the same map may<br />
in fact have been compiled at significantly different dates<br />
Maps <strong>of</strong> the same place through time will vary as production technologies and designs change<br />
over time, reflecting but also partly constituting, the politics and aesthetic culture <strong>of</strong> different<br />
time periods<br />
Despite these problems maps are a valuable source for understanding how places evolve over<br />
time for, for example the changing built form around the Rylands Library shown here<br />
1746<br />
Reproduced from Casson and Berry’s Plan<br />
<strong>of</strong> the Towns <strong>of</strong> <strong>Manchester</strong> and Salford<br />
(Courtesy <strong>of</strong> Digital Archives,<br />
www.digitalarchives.co.uk)<br />
1908<br />
Reproduced from Ordnance Survey,<br />
Sheet CIV-10, original scale 1:2500<br />
(John Rylands <strong>University</strong> Library Map<br />
Collection)<br />
1849<br />
Reproduced from Ordnance Survey Five Foot<br />
Plan, Sheet 28, original scale 1:1056<br />
(John Rylands <strong>University</strong> Library Map<br />
Collection)<br />
1958<br />
Reproduced from Ordnance Survey National<br />
Grid Plan, Sheet SJ 8398, original scale<br />
1:2500<br />
(John Rylands <strong>University</strong> Library Map<br />
Collection)<br />
1889<br />
Reproduced from Ordnance Survey,<br />
Sheet CIV-10, original scale 1:2500<br />
(John Rylands <strong>University</strong> Library Map<br />
Collection)<br />
2006<br />
Reproduced from Vertical aerial photograph<br />
<strong>of</strong> <strong>Manchester</strong><br />
(Courtesy <strong>of</strong> The GeoInformation Group and<br />
Landmap, htttp://landmap.mimas.ac.uk)<br />
28
<strong>Mapping</strong> <strong>Manchester</strong> by<br />
changing cartographic design<br />
Cartographers are able to skilfully manipulate the design <strong>of</strong> a map to target it at different<br />
markets or clients<br />
The same place, at the same time and scale, can be represented in radically different ways simply<br />
by altering the design elements <strong>of</strong> the map<br />
Colours, fonts and lettering, line style, point symbolization and the degree <strong>of</strong> generalization can<br />
all be changed to affect a different impression, from a ‘scientific’ look to a ‘playful’ feel<br />
The holistic combination <strong>of</strong> these design elements is read by map users who are able to<br />
appreciate layout, visual structure, hierarchy and notions <strong>of</strong> figure and ground relationships.<br />
Everyone is able to recognise and appreciate a well designed map<br />
Point symbols to highlight attractions:<br />
A standard road layout and building outlines but strips out all the<br />
text associated with the buildings. This is replaced by symbols<br />
depicting the building function. The map is clean and uncluttered.<br />
(Courtesy <strong>of</strong> Nick Scarle, based on Ordnance Survey Mastermap)<br />
Heritage design:<br />
A re-creation <strong>of</strong> an old style map which uses pale colour washes<br />
to mimic hand-colouring and an old style serif font in larger size<br />
type, giving the impression <strong>of</strong> attention to detail as well as<br />
legibility and highlighting traditional values.<br />
(Courtesy <strong>of</strong> Nick Scarle, based on Ordnance Survey Mastermap)<br />
Detail and accuracy:<br />
A black and white outline rendering <strong>of</strong> all roads, buildings and<br />
other features such as spot heights, giving an impression <strong>of</strong><br />
accuracy and detail – at the expense <strong>of</strong> legibility and impact.<br />
The overall impression is one <strong>of</strong> noise and clutter.<br />
(Courtesy <strong>of</strong> Nick Scarle, based on Ordnance Survey Mastermap)<br />
Modern simplicity:<br />
A modernistic version using bold colours for buildings (coded<br />
according to their function) and a modern humanist san-serif font<br />
for immediate impact, with the aim <strong>of</strong> allowing a user to very<br />
quickly identify a destination.<br />
(Courtesy <strong>of</strong> Nick Scarle, based on Ordnance Survey Mastermap)<br />
29
Population map for Greater<br />
<strong>Manchester</strong><br />
There are around 2.5 million people living in Greater <strong>Manchester</strong>. <strong>Mapping</strong><br />
population distribution is one way to make sense <strong>of</strong> the complex social<br />
geographies <strong>of</strong> the region. In this model detailed census data has been used<br />
to calculate resident population density, which is then mapped as ‘height’.<br />
The taller the area, the more people live there in a greater geographic<br />
concentration. When plotted, the result is a stepped-surface map that can be<br />
drawn in pseudo three-dimensional form. This can be animated by flying a<br />
virtual camera around it.<br />
Colour coding is used to indicate different categories <strong>of</strong> residential population density according to the scale<br />
shown here. Darker reds represent areas with a higher number <strong>of</strong> residents (measured in people per square<br />
hectare). Geographical context is given by the addition <strong>of</strong> motorways and key roads.<br />
The pattern <strong>of</strong> varying residential population density across the region clearly picks out<br />
the core towns and some their sub-centres. The most prominent are Bolton, Oldham<br />
and Stockport. However, the real peaks <strong>of</strong> population are right in the city centre. The<br />
very highest population densities are typically single blocks <strong>of</strong> flats – the ‘tallest’ is a<br />
<strong>University</strong> <strong>of</strong> <strong>Manchester</strong> student hall <strong>of</strong> residence on Granby Row. The flattest areas<br />
have little resident population although this does not mean they are empty or<br />
undeveloped. Many are business areas, industrial sites and retail parks which have a<br />
large daily influx <strong>of</strong> people.<br />
Data preparation and animation production by Karl Hennermann, School <strong>of</strong><br />
Environment and Development, <strong>University</strong> <strong>of</strong> <strong>Manchester</strong>.<br />
(Sources <strong>of</strong> data: 2001 Census, Office for Nation Statistics; Output areas boundaries,<br />
UKBORDERS, http://edina.ac.uk/ukborders/; Ordnance Survey Strategi,<br />
http://edina.ac.uk/digimap/)<br />
30
Virtual model <strong>of</strong> <strong>Manchester</strong><br />
city centre<br />
Understanding the complexities <strong>of</strong> the built form <strong>of</strong> cities is made easier by<br />
land-use maps, architectural plans, engineering schematics and new virtual<br />
models. Presented here is an animation <strong>of</strong> Digital <strong>Manchester</strong> – a detailed<br />
three-dimensional model <strong>of</strong> the city centre constructed by visualization experts<br />
at ARUP’s <strong>Manchester</strong> <strong>of</strong>fice. Created in 2007 with the endorsement <strong>of</strong> City<br />
Council, the model covers some 400 hectares and contains over four and a half<br />
thousand individual buildings. The geometry <strong>of</strong> the model was created using<br />
airborne LIDAR, aerial photogrammetry and Ordnance Survey Mastermap data.<br />
Digital <strong>Manchester</strong> is<br />
probably the most<br />
comprehensive virtual<br />
model <strong>of</strong> the city<br />
currently available. It<br />
has a large number <strong>of</strong><br />
potential uses in terms<br />
planning reviews, public<br />
communication and<br />
evaluating the visual<br />
impact <strong>of</strong> new<br />
buildings. The model<br />
can also be easily<br />
updated to<br />
accommodate the<br />
changing cityscape.<br />
Animation <strong>of</strong> Digital<br />
<strong>Manchester</strong> courtesy <strong>of</strong><br />
Simon Mabey and<br />
Charles Edwards, ARUP.<br />
31
Piccadilly Gardens model<br />
Model <strong>of</strong> Piccadilly Gardens design<br />
Small scale physical models are a common way for architects and planners to represent the city. Over the years many<br />
models <strong>of</strong> <strong>Manchester</strong> city centre have been made to envision how new buildings and future street layouts might look.<br />
The projection <strong>of</strong> designs <strong>of</strong>f a flat plan into solid, three-dimensional form can help people comprehend what they will<br />
be like in reality.<br />
This model was made by ARUP to visualise the design for a radical rebuilding <strong>of</strong> Piccadilly Gardens to create a very<br />
different feel. The scheme was realised in time for 2002 Commonwealth Games.<br />
(Courtesy <strong>of</strong> Charles Edwards <strong>of</strong> ARUP, <strong>Manchester</strong>)<br />
32
Listing <strong>of</strong> exhibition items<br />
Cabinet 1: The map makers<br />
Excerpt from Plan <strong>of</strong> <strong>Manchester</strong> and Salford, William Green, 1794<br />
(Courtesy <strong>of</strong> Digital Archives, www.digitalarchives.co.uk)<br />
Excerpted cartouche from Plan <strong>of</strong> <strong>Manchester</strong> and Salford, William Green, 1794<br />
(Courtesy <strong>of</strong> Digital Archives, www.digitalarchives.co.uk)<br />
Excerpt from Topographic Plan <strong>of</strong> <strong>Manchester</strong> and Salford, Charles Laurent, 1793<br />
(Courtesy <strong>of</strong> Digital Archives, www.digitalarchives.co.uk)<br />
<strong>Manchester</strong> City Centre, 6 maps by Andrew Taylor, 1996 to 2008<br />
(Courtesy <strong>of</strong> Andrew Taylor)<br />
Four photographs <strong>of</strong> Andrew Taylor surveying <strong>Manchester</strong> for revision <strong>of</strong> his map<br />
(Courtesy <strong>of</strong> Andrew Taylor)<br />
Excerpt from <strong>Manchester</strong> City Centre, Andrew Taylor, Sixth Edition 2008<br />
(John Rylands <strong>University</strong> Library Map Collection)<br />
Cabinet 2: The car and the city<br />
Fold out map included with S.E.L.N.E.C. A Highway Plan, 1962<br />
(Courtesy <strong>of</strong> Chetham’s Library)<br />
Congestion charge diagram, undated<br />
(Courtesy <strong>of</strong> Richard Brook, <strong>Manchester</strong> School <strong>of</strong> Architecture)<br />
Pro and anti congestion charge posters, undated<br />
(http://CleanAirNow.co.uk; www.stopthecharge.co.uk)<br />
Proposed route <strong>of</strong> congestion charge and tolling points in Trafford<br />
(Greater <strong>Manchester</strong> Passenger Transport Executive, www.gmfuturetransport.co.uk)<br />
Isochronic map reproduced from S.E.L.N.E.C. A Highway Plan, 1962<br />
(Courtesy <strong>of</strong> Chetham’s Library)<br />
Flowline map reproduced from S.E.L.N.E.C. A Highway Plan, 1962<br />
(Courtesy <strong>of</strong> Chetham’s Library)<br />
S.E.L.N.E.C. A Highway Plan, 1962<br />
(Courtesy <strong>of</strong> Chetham’s Library)<br />
Cabinet 3: Public transport<br />
Time Zone Map, 1914<br />
(Courtesy <strong>of</strong> <strong>Manchester</strong> City Archives and Local Studies Library)<br />
A Map <strong>of</strong> the City <strong>of</strong> <strong>Manchester</strong> in the Year <strong>of</strong> its First Civic Week, 1926<br />
(Courtesy <strong>of</strong> <strong>Manchester</strong> City Archives and Local Studies Library)<br />
The Handy Penny Street and Tram Map, c.1920s<br />
(John Rylands <strong>University</strong> Library Map Collection)<br />
London Road Station (now Piccadilly) shown on an excerpt from Ordnance Survey <strong>Manchester</strong><br />
and Salford 1:1,056 Sheet 20, 1849<br />
(Courtesy <strong>of</strong> Digital Archives, www.digitalarchives.co.uk)<br />
Map <strong>of</strong> proposed tunnel route and brochure cover reproduced from The Picc-Vic Project, Greater<br />
<strong>Manchester</strong> Council, 1975<br />
(John Rylands <strong>University</strong> Library, 711.7/G99)<br />
33
Listing continued<br />
Brochure cover reproduced from Metrolink: Light Rail in Greater <strong>Manchester</strong>, Greater <strong>Manchester</strong><br />
Passenger Authority and Executive, 1991<br />
(John Rylands <strong>University</strong> Library, A205834)<br />
Network statistic map reproduced from Transport Statistics: Greater <strong>Manchester</strong>, 2005<br />
(Greater <strong>Manchester</strong> Local Transport Plan, www.gmltp.co.uk)<br />
Future transport networks<br />
(Greater <strong>Manchester</strong> Passenger Transport Executive, www.gmpte.com)<br />
City-centre bus map, 2009<br />
(John Rylands <strong>University</strong> Library Map Collection)<br />
Cabinet 4: City <strong>of</strong> industry<br />
Promotional map <strong>of</strong> Trafford Park, 1936<br />
(Courtesy <strong>of</strong> <strong>Manchester</strong> City Archives and Local Studies Library)<br />
Bird’s eye view <strong>of</strong> the <strong>Manchester</strong> docks reproduced from Port <strong>of</strong> <strong>Manchester</strong>: Illustrated History<br />
<strong>of</strong> the <strong>Manchester</strong> Ship Canal,1708-1901<br />
(John Rylands <strong>University</strong> Library, OLD/6/21/4)<br />
<strong>Manchester</strong> from the Air, Jonathan C.K. Webb, 2007<br />
(Courtesy <strong>of</strong> Martin Dodge)<br />
Trafford Park: Britain’s Workshop and Storehouse, 1923<br />
(John Rylands <strong>University</strong> Library, OLD/6/21/5)<br />
Goad plan <strong>of</strong> grain elevator and store, reproduced from <strong>Manchester</strong> Carriers’ Warehouses,<br />
Book 3, 1900<br />
(Courtesy <strong>of</strong> Digital Archives, www.digitalarchives.co.uk)<br />
Cabinet 5: Wealth and poverty<br />
Housing conditions in <strong>Manchester</strong> & Salford : A report prepared for the Citizens' Association<br />
for the Improvement <strong>of</strong> the Unwholesome Dwellings and Surroundings <strong>of</strong> the People,<br />
T. R. Marr, 1904<br />
(Courtesy <strong>of</strong> Chetham’s Library)<br />
Excerpt from T.R. Marr’s Housing Conditions in <strong>Manchester</strong> and Salford, 1904<br />
(Courtesy <strong>of</strong> Chetham’s Library)<br />
Sales map for the Oaks Estate, 1843<br />
(Courtesy <strong>of</strong> <strong>Manchester</strong> City Archives and Local Studies Library)<br />
Richard Bastow’s map <strong>of</strong> housing, 1880s<br />
(John Rylands <strong>University</strong> Library Map Collection)<br />
Hulme slum clearance map, 1933<br />
(Courtesy <strong>of</strong> <strong>Manchester</strong> City Archives and Local Studies Library)<br />
Excerpt from Report <strong>of</strong> the Housing and Public Health Committees on the Proposed Hulme<br />
Clearance Scheme and the Provision <strong>of</strong> Rehousing Accommodation for Persons to be Displaced<br />
in Connection Therewith, 1933<br />
(John Rylands <strong>University</strong> Library, 711.4/M44)<br />
Folded map included with Hulme 5 Redevelopment: Report on Design, Hugh Wilson and Lewis<br />
Womersley, 1965<br />
(Courtesy <strong>of</strong> Chetham’s Library)<br />
34
Listing continued<br />
Two illustrations reproduced from Hulme 5 Redevelopment: Report on Design, Hugh Wilson<br />
and Lewis Womersley, 1965<br />
(Courtesy <strong>of</strong> Chetham’s Library)<br />
Contemporary Hulme mapped by Ordnance Survey Landline, 2006<br />
(Courtesy <strong>of</strong> EDINA Digimap, www.edina.ac.uk)<br />
Cabinet 6: The moral city<br />
The distribution <strong>of</strong> public baths across in the city, 1918<br />
(Courtesy <strong>of</strong> <strong>Manchester</strong> City Archives and Local Studies Library)<br />
Plan <strong>of</strong> Victoria Baths, 1902<br />
(Courtesy <strong>of</strong> <strong>Manchester</strong> City Archives and Local Studies Library)<br />
Cholera map from A Lecture On The Sanitary Condition Of Chorlton-On-Medlock,<br />
John Hatton, 1854<br />
(John Rylands <strong>University</strong> Library, /SC11B,(3) )<br />
<strong>Manchester</strong> Union Workhouse shown on an excerpt from Ordnance Survey <strong>Manchester</strong> and<br />
Salford 1:1,056 Sheet 23, 1848<br />
(Courtesy <strong>of</strong> Digital Archives, www.digitalarchives.co.uk)<br />
Drink Map, 1889<br />
(Courtesy <strong>of</strong> <strong>Manchester</strong> Geographical Society)<br />
Statistical map <strong>of</strong> binge drinking, reproduced from <strong>Manchester</strong>’s 2nd State <strong>of</strong> the Wards Report,<br />
2007/2008<br />
(Courtesy <strong>of</strong> the <strong>Manchester</strong> Partnership and <strong>Manchester</strong> City Council,<br />
www.manchesterpartnership.org.uk)<br />
Cabinet 7: <strong>Mapping</strong> the future city<br />
Observations on Improvements <strong>of</strong> the Town <strong>of</strong> <strong>Manchester</strong>: Particularly as Regards the<br />
Importance <strong>of</strong> Blending in those Improvements, the Chaste and Beautiful, with the Ornamental<br />
and Useful, 1836<br />
(John Rylands <strong>University</strong> Library, R151594)<br />
Piccadilly Gardens area shown on an excerpt from Ordnance Survey <strong>Manchester</strong> and Salford<br />
1:1,056 Sheet 29, 1849<br />
(Courtesy <strong>of</strong> Digital Archives, www.digitalarchives.co.uk)<br />
Plan reproduced from Observations on Improvements <strong>of</strong> the Town <strong>of</strong> <strong>Manchester</strong>: Particularly as<br />
Regards the Importance <strong>of</strong> Blending in those Improvements, the Chaste and Beautiful, with the<br />
Ornamental and Useful, 1836<br />
(John Rylands <strong>University</strong> Library, R151594)<br />
Drawings reproduced from Observations on Improvements <strong>of</strong> the Town <strong>of</strong> <strong>Manchester</strong>:<br />
Particularly as Regards the Importance <strong>of</strong> Blending in those Improvements, the Chaste and<br />
Beautiful, with the Ornamental and Useful, 1836<br />
(John Rylands <strong>University</strong> Library, R151594)<br />
Map reproduced from Plate 72 City <strong>of</strong> <strong>Manchester</strong> Plan, prepared by the City Council, 1945<br />
(John Rylands <strong>University</strong> Library, R91041)<br />
Piccadilly reproduced from Plate 83 City <strong>of</strong> <strong>Manchester</strong> Plan, prepared by the City Council, 1945<br />
(John Rylands <strong>University</strong> Library, R91041)<br />
35
Listing continued<br />
City <strong>of</strong> <strong>Manchester</strong> Plan, prepared by the City Council, 1945<br />
(John Rylands <strong>University</strong> Library, R91041)<br />
Piccadilly Gardens in 2009 mapped by Ordnance Survey MasterMap<br />
(Courtesy <strong>of</strong> EDINA Digimap, www.edina.ac.uk)<br />
Cabinet 8: Leisure and pleasure<br />
Royal Jubilee Exhibition plan, 1887<br />
(Courtesy <strong>of</strong> <strong>Manchester</strong> City Archives and Local Studies Library)<br />
Two images <strong>of</strong> the Royal Jubilee Exhibition reproduced from The Graphic, 7 May 1887<br />
(John Rylands <strong>University</strong> Library)<br />
Orienteering map <strong>of</strong> Heaton Park, 1990<br />
(John Rylands <strong>University</strong> Library Map Collection)<br />
Promotional map for the new Irwell River park, 2008<br />
(Courtesy <strong>of</strong> Salford City Council)<br />
Belle Vue guide and crowds at the main entrance, c.1952<br />
(Courtesy <strong>of</strong> Chetham’s Library)<br />
Belle Vue guide and map, 1936<br />
(Courtesy <strong>of</strong> Chetham’s Library)<br />
Belle Vue guide and map, 1931<br />
(Courtesy <strong>of</strong> Chetham’s Library)<br />
Belle Vue guide and bird’s-eye plan, 1899<br />
(Courtesy <strong>of</strong> Chetham’s Library)<br />
Cabinet 9: The hydraulic city<br />
Longdendale Waterworks, 1881<br />
(Courtesy <strong>of</strong> <strong>Manchester</strong> City Archives and Local Studies Library)<br />
Landscape view showing imagined route <strong>of</strong> the <strong>Manchester</strong> Ship Canal, 1883<br />
(Courtesy <strong>of</strong> <strong>Manchester</strong> Geographical Society)<br />
Davyhulme sewage works plan, undated<br />
(Courtesy <strong>of</strong> <strong>Manchester</strong> City Archives and Local Studies Library)<br />
Water mains plan reproduced from John Frederic La Trobe Bateman’s History and Description <strong>of</strong><br />
the <strong>Manchester</strong> Waterworks, 1884<br />
(John Rylands <strong>University</strong> Library, 628.1/BAT)<br />
Flooding at Wilton Grove, Heywood, August 2004<br />
(Courtesy <strong>of</strong> Nigel Lawson, School <strong>of</strong> Environment and Development, <strong>University</strong> <strong>of</strong> <strong>Manchester</strong>)<br />
<strong>Manchester</strong> Its Message: A Souvenir <strong>of</strong> the Visit <strong>of</strong> the Overseas Delegates to the International<br />
Advertising Convention, 1924<br />
(John Rylands <strong>University</strong> Library, OLD/6/21/3)<br />
<strong>Manchester</strong> Ship Canal strip map, c. late 1950s<br />
(Courtesy <strong>of</strong> Richard Dean, Canalmaps Archive, www.canalmaps.net)<br />
36
Listing continued<br />
Cabinet 10: Bird’s eye views <strong>of</strong> the city<br />
Cityscape Map, 1994<br />
(John Rylands <strong>University</strong> Library Map Collection)<br />
Reader’s Digest City Walks, undated<br />
(John Rylands <strong>University</strong> Library Map Collection)<br />
<strong>Manchester</strong> Mega Photo postcard, Aidan O’Rourke, www.aidan.co.uk, 2008<br />
(Courtesy <strong>of</strong> Martin Dodge)<br />
Vertical aerial photograph <strong>of</strong> <strong>Manchester</strong> City Centre, 2006<br />
(Courtesy <strong>of</strong> The GeoInformation Group and Landmap, htttp://landmap.mimas.ac.uk)<br />
Pictorial Map <strong>of</strong> <strong>Manchester</strong> and Salford, John Heywood, 1886<br />
(Courtesy <strong>of</strong> Chetham’s Library)<br />
Excerpt from Pictorial Map <strong>of</strong> <strong>Manchester</strong> and Salford, John Heywood, 1886<br />
(Courtesy <strong>of</strong> Chetham’s Library)<br />
Excerpt from <strong>of</strong> A Bird’s-Eye View <strong>of</strong> <strong>Manchester</strong> In 1889<br />
(Courtesy <strong>of</strong> ICP Framing Ltd, Ashton under Lyne, www.icpframing.co.uk)<br />
37
<strong>Mapping</strong> <strong>Manchester</strong><br />
Time Zone Map,1914<br />
This map, produced as part<br />
<strong>of</strong> transport policy report,<br />
details how long it took get<br />
by tram-car from different<br />
suburbs to Piccadilly<br />
or the Exchange.<br />
(Courtesy <strong>of</strong> <strong>Manchester</strong><br />
City Archives and Local<br />
Studies Library)<br />
A Map <strong>of</strong> the City <strong>of</strong> <strong>Manchester</strong> in the First Civic Week, 1926<br />
This promotional map was published as a supplement to the <strong>Manchester</strong> Guardian, highlighting ‘the ample means<br />
provided by the City Fathers by which the Citizens may transport and disport themselves in public vehicles’.<br />
(Courtesy <strong>of</strong> <strong>Manchester</strong> City Archives and Local Studies Library)