Intelligence, Surveillance, and Reconnaissance - Spawar
Intelligence, Surveillance, and Reconnaissance - Spawar
Intelligence, Surveillance, and Reconnaissance - Spawar

Create successful ePaper yourself
Turn your PDF publications into a flip-book with our unique Google optimized e-Paper software.
160<br />
INTELLIGENCE, SURVEILLANCE, AND RECONNAISSANCE<br />
Several design choices made it possible for an MFT<br />
algorithm to run in real time in an autonomous tripwire<br />
system. First, the number of Fourier bins considered<br />
was reduced to the eight strongest 0.07-Hzwide<br />
frequency bins from an assumed narrowb<strong>and</strong><br />
threat. Second, a two-path Lloyd’s Mirror-based<br />
spectral model served as a simple, yet robust,<br />
replacement for the normal-mode approach. Third,<br />
processing epochs were 3 minutes long. Fourth, the<br />
MFT evaluated each incoming track in a search grid<br />
1000 meters wide <strong>and</strong> 2000 meters long, offset 500<br />
meters from the receive array. Finally, the algorithm<br />
was ported to Texas Instruments’ TMS320C6701<br />
32-bit floating-point DSP, which served as a capable<br />
low-power processing device.<br />
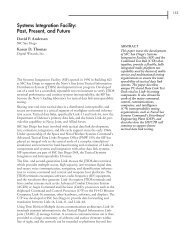
A submerged target track was declared if its correlation<br />
exceeded a 70% threshold. Figure 8 illustrates<br />
MFT results for two submerged source crossings of<br />
a Hydra system in 164 meters of water off Halifax,<br />
Nova Scotia.<br />
ADVANCED PROCESSING<br />
For engaging threats with negligible narrowb<strong>and</strong> energy, an alternative<br />
model-based process has been developed for targets with broadb<strong>and</strong> signatures.<br />
This advanced process performs waveform cross-correlations for<br />
all hydrophone pairs. The key is to exploit the distinct correlation peaks<br />
associated with a multipath arrival structure as a function of range <strong>and</strong><br />
depth. This is a distinctive fingerprint of the source location. Figure 9<br />
shows the measured range-dependent multipath arrival structure from a<br />
towed source twice crossing Hydra off the coast of San Diego. Figure 10<br />
shows a modeled version of this same array crossing, <strong>and</strong> Figure 11<br />
shows the result of stacking slices versus depth at each time epoch during<br />
the array crossings.<br />
SUMMARY<br />
Hydra <strong>and</strong> Kelp were the first underwater passive acoustic autonomous<br />
array systems to implement an MFT algorithm in real time. The ultralightweight,<br />
low-power, array sensor system was the result of 20 years of<br />
research <strong>and</strong> development in underwater acoustic surveillance systems at<br />
SSC San Diego. The digital array <strong>and</strong> processing capabilities in the node<br />
represent a state-of-the-art, flexible, <strong>and</strong> modular platform for evaluating<br />
advanced processing algorithms.<br />
ACKNOWLEDGMENTS<br />
Both the Hydra <strong>and</strong> Kelp projects were funded by the Office of Naval<br />
Research (ONR) 321SS (Dr. James McEachern team leader). Project<br />
engineers Chris Fletcher <strong>and</strong> Alan Fronk <strong>and</strong> technicians Norma Blas,<br />
Carolyn Kloss, <strong>and</strong> Al Brill also made valuable contributions to the project.<br />
Special thanks goes to Mark Stevenson, who was the project manager<br />
for Hydra <strong>and</strong> Kelp for many years.<br />
NORTH/SOUTH COORDINATES (m)<br />
2500<br />
2000<br />
1500<br />
1000<br />
500<br />
0<br />
–500<br />
–1000<br />
–1500<br />
1<br />
12<br />
–1000 –500<br />
HYDRA<br />
TRUE TRACK<br />
DECLARED TRACKS<br />
SEARCH GRID BOUNDARY<br />
9<br />
0 500 1000 1500 2000<br />
WEST/EAST COORDINATES (m)<br />
7<br />
5<br />
2500<br />
N<br />
3000<br />
FIGURE 8. Real-time MFT over Hydra. The 4-knot, 46-meter deep<br />
source crossed Hydra twice during 12 epochs. Submerged tracks<br />
were declared for epochs 7 <strong>and</strong> 9 using the search grid shown for<br />
incoming targets. Tracks for epochs 1, 5, <strong>and</strong> 12 are derived by<br />
reorienting the grid, in situ, with Telesonar.<br />
GEOTIME (min)<br />
0<br />
10<br />
20<br />
30<br />
40<br />
50<br />
60<br />
-0.15 -0.05 0.05 0.15 0.25<br />
TIME (sec)<br />
115<br />
110<br />
105<br />
100<br />
FIGURE 9. Measured multipath at a single<br />
Hydra array element during two array<br />
crossings. Note that the multipath is a<br />
distinctive fingerprint of source location.<br />
GEOTIME (min)<br />
50<br />
60<br />
70<br />
80<br />
90<br />
100<br />
-0.15 -0.05 0.05 0.15 0.25<br />
TIME (sec)<br />
FIGURE 10. Modeled multipath at a single<br />
Hydra array element during two array<br />
crossings. The model accurately reconstructs<br />
the measured multipath shown in<br />
Figure 9.<br />
10<br />
15<br />
20<br />
25