Multibeam Sonar Theory of Operation
Multibeam Sonar Theory of Operation
Multibeam Sonar Theory of Operation

Create successful ePaper yourself
Turn your PDF publications into a flip-book with our unique Google optimized e-Paper software.
<strong>Multibeam</strong> <strong>Sonar</strong> <strong>Theory</strong> <strong>of</strong> <strong>Operation</strong> Sidescan <strong>Sonar</strong><br />
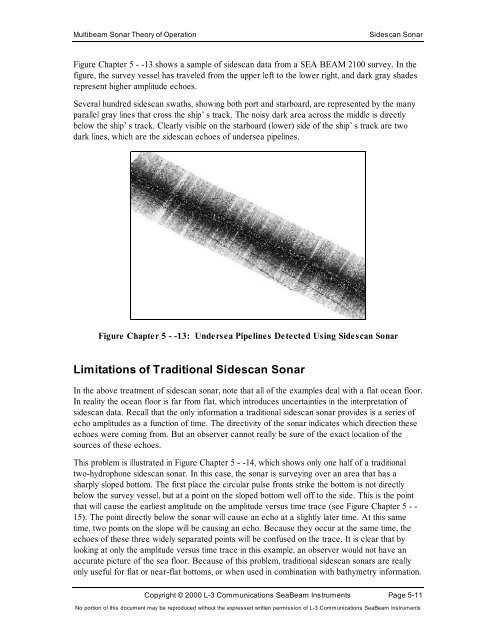
Figure Chapter 5 - -13 shows a sample <strong>of</strong> sidescan data from a SEA BEAM 2100 survey. In the<br />
figure, the survey vessel has traveled from the upper left to the lower right, and dark gray shades<br />
represent higher amplitude echoes.<br />
Several hundred sidescan swaths, showing both port and starboard, are represented by the many<br />
parallel gray lines that cross the ship’s track. The noisy dark area across the middle is directly<br />
below the ship’s track. Clearly visible on the starboard (lower) side <strong>of</strong> the ship’s track are two<br />
dark lines, which are the sidescan echoes <strong>of</strong> undersea pipelines.<br />
Figure Chapter 5 - -13: Undersea Pipelines Detected Using Sidescan <strong>Sonar</strong><br />
Limitations <strong>of</strong> Traditional Sidescan <strong>Sonar</strong><br />
In the above treatment <strong>of</strong> sidescan sonar, note that all <strong>of</strong> the examples deal with a flat ocean floor.<br />
In reality the ocean floor is far from flat, which introduces uncertainties in the interpretation <strong>of</strong><br />
sidescan data. Recall that the only information a traditional sidescan sonar provides is a series <strong>of</strong><br />
echo amplitudes as a function <strong>of</strong> time. The directivity <strong>of</strong> the sonar indicates which direction these<br />
echoes were coming from. But an observer cannot really be sure <strong>of</strong> the exact location <strong>of</strong> the<br />
sources <strong>of</strong> these echoes.<br />
This problem is illustrated in Figure Chapter 5 - -14, which shows only one half <strong>of</strong> a traditional<br />
two-hydrophone sidescan sonar. In this case, the sonar is surveying over an area that has a<br />
sharply sloped bottom. The first place the circular pulse fronts strike the bottom is not directly<br />
below the survey vessel, but at a point on the sloped bottom well <strong>of</strong>f to the side. This is the point<br />
that will cause the earliest amplitude on the amplitude versus time trace (see Figure Chapter 5 - -<br />
15). The point directly below the sonar will cause an echo at a slightly later time. At this same<br />
time, two points on the slope will be causing an echo. Because they occur at the same time, the<br />
echoes <strong>of</strong> these three widely separated points will be confused on the trace. It is clear that by<br />
looking at only the amplitude versus time trace in this example, an observer would not have an<br />
accurate picture <strong>of</strong> the sea floor. Because <strong>of</strong> this problem, traditional sidescan sonars are really<br />
only useful for flat or near-flat bottoms, or when used in combination with bathymetry information.<br />
Copyright © 2000 L-3 Communications SeaBeam Instruments Page 5-11<br />
No portion <strong>of</strong> this document may be reproduced without the expressed written permission <strong>of</strong> L-3 Communications SeaBeam Instruments