Multibeam Sonar Theory of Operation
Multibeam Sonar Theory of Operation
Multibeam Sonar Theory of Operation

You also want an ePaper? Increase the reach of your titles
YUMPU automatically turns print PDFs into web optimized ePapers that Google loves.
<strong>Multibeam</strong> <strong>Sonar</strong> <strong>Theory</strong> <strong>of</strong> <strong>Operation</strong> Detection Processing and Range Calculations<br />
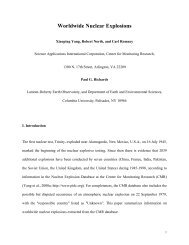
Recall that for each time slice, there was a threshold value T S computed in the Dynamic Threshold<br />
Processing. In Figure Chapter 4 - -24, the values <strong>of</strong> T S associated with each time slice are plotted.<br />
For some time slices, the amplitude A B falls below the threshold. In these cases the time slice is<br />
ignored.<br />
Figure Chapter 4 - -24: Eliminating Amplitudes Below the Dynamic Threshold<br />
The remaining sequence <strong>of</strong> amplitudes contains only those time slices between the start and stop<br />
gates that have amplitudes above their associated thresholds. From this, a TOA is computed for<br />
the echo in each beam. The TOA is found using an amplitude-weighted average <strong>of</strong> the times <strong>of</strong><br />
time slices that are between the gates and that have amplitudes above the thresholds. TOAs are<br />
computed for up to 151 beams in WMT processing.<br />
Choosing between BDI and WMT Data<br />
The BDI and WMT processes both produce DOA and TOA calculations for each <strong>of</strong> up to 151<br />
beams in the swath for each ping. The final stage <strong>of</strong> processing is to convert these records into<br />
true bathymetry data— depth measurements and corresponding positions in terms <strong>of</strong> longitudes<br />
and latitudes. Before doing so, the SEA BEAM 2100 must determine which <strong>of</strong> the results from<br />
the two processes to use for producing the final product.<br />
Both BDI and WMT have regimes in which they are likely to produce better estimations <strong>of</strong><br />
echoes. Figure Chapter 4 - -25 and Figure Chapter 4 - -26 consider two situations. Figure Chapter<br />
4 - -25 shows what is called the specular regime, where a sonar is looking in a direction<br />
perpendicular to the sea floor.<br />
Figure Chapter 4 - -26 shows the non-specular regime, where a sonar is looking at a shallow<br />
grazing angle to the sea floor. Both situations consider a single beam <strong>of</strong> a multibeam sonar, which<br />
has some beam width such that it is sensitive to echoes from an area on the sea floor.<br />
Copyright © 2000 L-3 Communications SeaBeam Instruments Page 4-25<br />
No portion <strong>of</strong> this document may be reproduced without the expressed written permission <strong>of</strong> L-3 Communications SeaBeam Instruments