Multibeam Sonar Theory of Operation
Multibeam Sonar Theory of Operation
Multibeam Sonar Theory of Operation

Create successful ePaper yourself
Turn your PDF publications into a flip-book with our unique Google optimized e-Paper software.
<strong>Multibeam</strong> <strong>Sonar</strong><br />
<strong>Theory</strong> <strong>of</strong> <strong>Operation</strong><br />
L-3 Communications SeaBeam Instruments<br />
141 Washington Street<br />
East Walpole, MA 02032-1155<br />
Copyright © 2000 L-3 Communications SeaBeam Instruments<br />
All rights reserved<br />
No portion <strong>of</strong> this document may be reproduced without the expressed written permission <strong>of</strong> L-3 Communications SeaBeam Instruments
Copyright © 2000 L-3 Communications SeaBeam Instruments<br />
<strong>Multibeam</strong> <strong>Sonar</strong> <strong>Theory</strong> <strong>of</strong> <strong>Operation</strong><br />
No portion <strong>of</strong> this document may be reproduced without the expressed written permission <strong>of</strong> L-3 Communications SeaBeam Instruments
<strong>Multibeam</strong> <strong>Sonar</strong> <strong>Theory</strong> <strong>of</strong> <strong>Operation</strong> Table <strong>of</strong> Contents<br />
Table <strong>of</strong> Contents<br />
Chapter 1 - Introduction<br />
Organization <strong>of</strong> this Document....................................................................................................................................1-3<br />
Scope <strong>of</strong> this Document................................................................................................................................................1-3<br />
Chapter 2 - <strong>Sonar</strong> Concepts<br />
The Physics <strong>of</strong> Sound in Water...................................................................................................................................2-1<br />
The Principles <strong>of</strong> <strong>Sonar</strong>.................................................................................................................................................2-3<br />
The <strong>Sonar</strong> Equation...............................................................................................................................................2-5<br />
A Single-Beam Depth Sounder....................................................................................................................................2-6<br />
Why <strong>Multibeam</strong>? The Limitations <strong>of</strong> a Single-Beam Depth Sounder....................................................................2-8<br />
Echo Location Questions – Where is the Bottom? ..........................................................................................2-8<br />
Survey Speed........................................................................................................................................................2-12<br />
The <strong>Multibeam</strong> Solution .....................................................................................................................................2-13<br />
Chapter 3 - Introduction to <strong>Multibeam</strong> <strong>Sonar</strong>: Projector and<br />
Hydrophone Systems<br />
Projector Arrays and Beam Forming...........................................................................................................................3-1<br />
Hydrophone Arrays ....................................................................................................................................................3-11<br />
Beam Steering...............................................................................................................................................................3-15<br />
The Mills Cross Technique........................................................................................................................................3-17<br />
The Mills Cross Applied in the SEA BEAM 2100 System ....................................................................................3-20<br />
The SEA BEAM 2100 Projector and Hydrophone Arrays ............................................................................3-20<br />
SEA BEAM 2100 Beam Steering........................................................................................................................3-21<br />
Chapter 4 - Detection Processing and Range Calculations<br />
Processing Steps............................................................................................................................................................4-1<br />
The Steered Beam Data.................................................................................................................................................4-5<br />
Dynamic Threshold Calculation ..................................................................................................................................4-6<br />
Time <strong>of</strong> Arrival (TOA) and Direction <strong>of</strong> Arrival (DOA) Calculations: BDI and WMT Processing.................4-10<br />
BDI Processing.....................................................................................................................................................4-11<br />
High-Resolution Angle Estimation ...........................................................................................................4-11<br />
Motion Compensation ................................................................................................................................4-12<br />
Application <strong>of</strong> the Start and Stop Gates...................................................................................................4-16<br />
Direction <strong>of</strong> Arrival (DOA) and Time <strong>of</strong> Arrival (TOA) Calculations..................................................4-17<br />
WMT Processing.................................................................................................................................................4-19<br />
Interpolating Amplitudes for Each Time Slice.........................................................................................4-20<br />
Amplitude-Weighted Time <strong>of</strong> Arrival (TOA) Computation ..................................................................4-21<br />
Copyright © 2000 L-3 Communications SeaBeam Instruments Page i<br />
No portion <strong>of</strong> this document may be reproduced without the expressed written permission <strong>of</strong> L-3 Communications SeaBeam Instruments
Table <strong>of</strong> Contents <strong>Multibeam</strong> <strong>Sonar</strong> <strong>Theory</strong> <strong>of</strong> <strong>Operation</strong><br />
Choosing between BDI and WMT Data..................................................................................................................4-23<br />
Range Calculation and Bottom Location..................................................................................................................4-26<br />
Sound Velocity and Ray Tracing.......................................................................................................................4-28<br />
Chapter 5 - Sidescan <strong>Sonar</strong><br />
Understanding Sidescan <strong>Sonar</strong> ...................................................................................................................................5-1<br />
How Sidescan <strong>Sonar</strong> Works.................................................................................................................................5-2<br />
A Basic Sidescan <strong>Sonar</strong>........................................................................................................................................5-6<br />
Limitations <strong>of</strong> Traditional Sidescan <strong>Sonar</strong> .......................................................................................................5-11<br />
The SEA BEAM 2100 Sidescan <strong>Sonar</strong>......................................................................................................................5-12<br />
Producing Sidescan Data With the SEA BEAM 2100....................................................................................5-13<br />
Mapping Sidescan Values for 2000 Pixel Resolution..............................................................................5-14<br />
Display <strong>of</strong> Sidescan Data............................................................................................................................5-15<br />
Glossary <strong>of</strong> Terms<br />
Page ii Copyright © 2000 L-3 Communications SeaBeam Instruments<br />
No portion <strong>of</strong> this document may be reproduced without the expressed written permission <strong>of</strong> L-3 Communications SeaBeam Instruments
<strong>Multibeam</strong> <strong>Sonar</strong> <strong>Theory</strong> <strong>of</strong> <strong>Operation</strong> Table <strong>of</strong> Contents<br />
List <strong>of</strong> Figures<br />
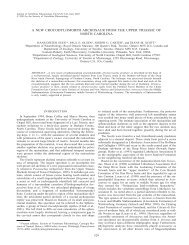
1-1 Contour Map <strong>of</strong> Perth Canyon ....................................................................................................................1-2<br />
2-1 Components <strong>of</strong> a Sound Wave....................................................................................................................2-2<br />
2-2 Components <strong>of</strong> an Echo Event on the Ocean Floor .................................................................................2-3<br />
2-3 Path <strong>of</strong> a Ping..................................................................................................................................................2-6<br />
2-4 Components <strong>of</strong> a Single-Beam Depth Sounder System...........................................................................2-7<br />
2-5 Surveying an Irregular Sea Floor.................................................................................................................2-9<br />
2-6 Using a Narrow-Beam Echo Sounder on an Irregular Sea Floor...........................................................2-10<br />
2-7 Ship Motion Effects on an Unstabilized Beam........................................................................................2-11<br />
2-8 Dependence <strong>of</strong> Ensonified Area on Depth..............................................................................................2-12<br />
2-9 <strong>Multibeam</strong> <strong>Sonar</strong> Swath..............................................................................................................................2-13<br />
3-1 Isotropic Expansion.......................................................................................................................................3-2<br />
3-2 Constructive and Destructive Interference................................................................................................3-3<br />
3-3 Positions <strong>of</strong> Constructive Interference (Example 1)..................................................................................3-4<br />
3-4 Positions <strong>of</strong> Constructive Interference (Example 2)..................................................................................3-5<br />
3-5 Directions <strong>of</strong> Constructive and Destructive Interference for Two Projectors with Spacing λ/2 .......3-6<br />
3-6 Beam Pattern for Two Hydrophones with Spacing λ/2............................................................................3-7<br />
3-7 Three-Dimensional Beam Pattern for Two Projectors with Spacing λ/2................................................3-8<br />
3-8 Beam Pattern <strong>of</strong> a Multiple-Element Line Array........................................................................................3-9<br />
3-9 Hydrophone Array with a Perpendicular Source....................................................................................3-11<br />
3-10 Hydrophone Traces for a Perpendicular Source.....................................................................................3-12<br />
3-11 Sum <strong>of</strong> Hydrophone Traces for a Perpendicular Source........................................................................3-12<br />
3-12 Hydrophone Array with Waves from an Angled Source......................................................................3-13<br />
3-13 Hydrophone Traces for an Angled Source..............................................................................................3-13<br />
3-14 Sum <strong>of</strong> Hydrophone Traces for an Angled Source ................................................................................3-14<br />
3-15 Beam Pattern for a Line Array <strong>of</strong> Hydrophones......................................................................................3-14<br />
3-16 Wavefronts Striking a Hydrophone Array from a Source at Angle θ .................................................3-15<br />
3-17 Main Lobe Shifted to Angle θ by Introducing a Time Delay................................................................3-16<br />
3-18 Hydrophone Array Processing Used to Observe Different Beam Patterns Simultaneously ...........3-17<br />
3-19 Projector Array Ensonifying a Strip <strong>of</strong> the Ocean Floor........................................................................3-18<br />
3-20 Projector and Hydrophone Arrays Arranged in a “Mills Cross”.........................................................3-19<br />
3-21 Mills Cross with Multiple Steered Beams ................................................................................................3-20<br />
3-22 Projector Array Pattern ...............................................................................................................................3-21<br />
3-23 “Flat” and “V” Configurations for Hydrophone Arrays........................................................................3-21<br />
3-24 Instantaneous Measurements S(t) <strong>of</strong> a Signal with Amplitude A(t) ....................................................3-22<br />
4-1 Analog-to-Digital Conversion <strong>of</strong> Hydrophone Data................................................................................4-2<br />
4-2 SEA BEAM 2100 Processing Steps – Raw Hydrophone Data to Bathymetry, Sidescan and Selected<br />
Beam.................................................................................................................................................................4-4<br />
4-3 Matrix <strong>of</strong> Steered Beam Data from a Single Ping Containing M Time Slices ........................................4-6<br />
4-4 Hydrophone Array at Time t 1.......................................................................................................................4-7<br />
4-5 Time Slice at Time 2 × t 1 ...............................................................................................................................4-7<br />
4-6 Hydrophone Array at Time t 2.......................................................................................................................4-8<br />
4-7 Time Slice at Time 2 × t 2 ...............................................................................................................................4-8<br />
4-8 Hydrophone Array at Time t 3.......................................................................................................................4-9<br />
4-9 Time Slice at Time 2 × t 3 ...............................................................................................................................4-9<br />
4-10 Dynamic Threshold Applied to a Time Slice ...........................................................................................4-10<br />
4-11 Parabola Fitting for High-Resolution Angle Estimation ........................................................................4-12<br />
4-12 Ship-Motion Coordinate System...............................................................................................................4-13<br />
4-13 Rotations about the Ship Center <strong>of</strong> Mass................................................................................................4-14<br />
4-14 Roll, Pitch, and Yaw Angles.......................................................................................................................4-15<br />
Copyright © 2000 L-3 Communications SeaBeam Instruments Page iii<br />
No portion <strong>of</strong> this document may be reproduced without the expressed written permission <strong>of</strong> L-3 Communications SeaBeam Instruments
Table <strong>of</strong> Contents <strong>Multibeam</strong> <strong>Sonar</strong> <strong>Theory</strong> <strong>of</strong> <strong>Operation</strong><br />
4-15 Adjusting Measured Angles for Roll .......................................................................................................4-16<br />
4-16 Hits Plotted Based on Angle and Time ....................................................................................................4-17<br />
4-17 Sample Predefined Beam Encompassing a Subset <strong>of</strong> Hits.....................................................................4-18<br />
4-18 Hit Envelope Calculation Within a Beam .................................................................................................4-18<br />
4-19 Amplitude-Weighted TOA and DOA.......................................................................................................4-19<br />
4-20 Finding the Roll-Adjusted Angles Nearest the Beam Angle................................................................4-20<br />
4-21 Beam Patterns <strong>of</strong> the Nearest Steered Beams..........................................................................................4-21<br />
4-22 Interpolated Amplitudes for a Single Beam in All Time Slices..............................................................4-22<br />
4-23 Eliminating Time Slices Outside the Gates...............................................................................................4-22<br />
4-24 Eliminating Amplitudes Below the Dynamic Threshold ........................................................................4-23<br />
4-25 Specular Regime: <strong>Sonar</strong> Perpendicular to the Sea Floor ........................................................................4-24<br />
4-26 Non-Specular Regime: <strong>Sonar</strong> at an Angle to the Sea Floor...................................................................4-24<br />
4-27 Amplitude versus Time Plot <strong>of</strong> the Echo Event in the Specular Regime.............................................4-25<br />
4-28 Amplitude versus Time Plot <strong>of</strong> the Echo Event in the Non-specular Regime ....................................4-25<br />
4-29 Specular and Non-specular Regimes with Different Sea Floors ...........................................................4-26<br />
4-30 Offset <strong>of</strong> Ping Illumination Due to Pitch...................................................................................................4-27<br />
4-31 Position <strong>of</strong> the Echo in a Single Beam ......................................................................................................4-28<br />
4-32 Ray Tracing to Find the Bottom ................................................................................................................4-29<br />
5-1 Example <strong>of</strong> Sidescan Mapping.....................................................................................................................5-2<br />
5-2 Single-Beam Echo Sounding System..........................................................................................................5-3<br />
5-3 Plot <strong>of</strong> Amplitude as a Function <strong>of</strong> Time....................................................................................................5-3<br />
5-4 Single-Beam Echo Sounder Schematic .......................................................................................................5-4<br />
5-5 Amplitude Versus Time Sequence ..............................................................................................................5-5<br />
5-6 Schematic with a Spherical Pulse Front with a Detailed Bottom.............................................................5-5<br />
5-7 Amplitude Versus Time Sequence ..............................................................................................................5-6<br />
5-8 An Overhead View <strong>of</strong> the Bottom ...............................................................................................................5-7<br />
5-9 Survey Vessel Towing a Line Array ...........................................................................................................5-8<br />
5-10 A Sidescan <strong>Sonar</strong> Measuring a Featured Ocean Floor with Four Pings...............................................5-9<br />
5-11 Amplitude Versus Time Plot for the Four Pings in 5-10.........................................................................5-10<br />
5-12 Port and Starboard Traces Plotted in Series ............................................................................................5-10<br />
5-13 Undersea Pipelines Detected Using Sidescan <strong>Sonar</strong> .............................................................................5-11<br />
5-14 Half <strong>of</strong> a Two-Hydrophone Sidescan <strong>Sonar</strong>............................................................................................5-12<br />
5-15 Amplitude versus Time Plot for the Situation Depicted in 5-14............................................................5-12<br />
5-16 Mapping Hits in the Sidescan Array ........................................................................................................5-15<br />
Page iv Copyright © 2000 L-3 Communications SeaBeam Instruments<br />
No portion <strong>of</strong> this document may be reproduced without the expressed written permission <strong>of</strong> L-3 Communications SeaBeam Instruments
<strong>Multibeam</strong> <strong>Sonar</strong> <strong>Theory</strong> <strong>of</strong> <strong>Operation</strong> Introduction<br />
Chapter 1 - Introduction<br />
Echo sounding is a technique for measuring water depths by transmitting acoustic pulses from the<br />
ocean surface and listening for their reflection (or echo) from the sea floor. This technique has<br />
been used since the early twentieth century to provide the vital depth input to charts that now map<br />
most <strong>of</strong> the world’s water-covered areas. These charts have permitted ships to navigate safely<br />
through the world’s oceans. In addition, information derived from echo sounding has aided in<br />
laying trans-oceanic telephone cables, exploring and drilling for <strong>of</strong>f-shore oil, locating important<br />
underwater mineral deposits, and improving our understanding <strong>of</strong> the Earth’s geological processes.<br />
Until the early 1960s most depth sounding used single-beam echo sounders. These devices make a<br />
single depth measurement with each acoustic pulse (or ping) and include both wide and narrow<br />
beam systems. Relatively inexpensive wide-beam “unstabilized” sounders detect echoes within a<br />
large solid angle under a vessel and are useful for finding potential hazards to safe navigation.<br />
However, these devices are unable to provide much detailed information about the sea bottom. On<br />
the other hand, more expensive narrow-beam “stabilized” sounders are capable <strong>of</strong> providing high<br />
spatial resolution with the small solid angle encompassed by their beam, but can cover only a<br />
limited survey area with each ping. Neither system provides a method for creating detailed maps<br />
<strong>of</strong> the sea floor that minimizes ship time and is thus cost-effective. The unstabilized systems lack<br />
the necessary spatial resolution, while the stabilized systems map too little area with each ping.<br />
In 1964, SeaBeam Instruments— at the time the Harris Anti-Submarine Warfare Division <strong>of</strong><br />
General Instrument Corporation— patented a technique for multiple narrow-beam depth sounding.<br />
The first such systems to use this technique were built by SeaBeam for the US Navy and were<br />
known as <strong>Sonar</strong> Array Sounding Systems (SASS). SASS employed two separate sonar arrays<br />
oriented orthogonal to one another— one for transmitting and one for receiving— an arrangement<br />
called a Mills Cross Array. The arrays and the associated analog electronics provided 90 1°-wide<br />
unstabilized beams. Roll and pitch compensation produced 60 1°-wide stabilized beams, which<br />
permitted mapping a 60° “fan” <strong>of</strong> the sea floor with each ping. This system allowed survey<br />
vessels to produce high-resolution coverage <strong>of</strong> wide swaths <strong>of</strong> the ocean bottom in far less ship<br />
time than would have been required for a single-beam echo sounder, greatly reducing the costs <strong>of</strong><br />
such mapping endeavors.<br />
Copyright © 2000 L-3 Communications SeaBeam Instruments Page 1-1<br />
No portion <strong>of</strong> this document may be reproduced without the expressed written permission <strong>of</strong> L-3 Communications SeaBeam Instruments
Introduction <strong>Multibeam</strong> <strong>Sonar</strong> <strong>Theory</strong> <strong>of</strong> <strong>Operation</strong><br />
Figure Chapter 1 - -1: Contour Map <strong>of</strong> Perth Canyon<br />
Most multibeam bathymetry systems still use the Mills Cross technique for beam forming.<br />
However, as faster computers and Large Scale Integrated (LSI) digital chips have become<br />
available, most <strong>of</strong> the signal processing, including beam forming, moved from analog signal<br />
processing into the digital (discrete) signal processing (DSP) domain using digital signal<br />
microprocessor (DSPμP) chips. The availability <strong>of</strong> fast DSPμPs has also permitted the<br />
implementation <strong>of</strong> sophisticated detection algorithms. As a result, survey vessels today can do onboard<br />
real-time multibeam processing and display <strong>of</strong> bathymetry data in a manner impossible only<br />
a few years ago. Figure Chapter 1 - -1 shows a sample <strong>of</strong> a high-quality ocean floor map<br />
produced by a SEA BEAM 2100 <strong>Multibeam</strong> Survey System, the latest generation <strong>of</strong> multibeam<br />
sonar from SeaBeam Instruments.<br />
The SEA BEAM 2100 system represents the culmination <strong>of</strong> over a third <strong>of</strong> a century <strong>of</strong> design,<br />
development, and production experience by SeaBeam Instruments in the area <strong>of</strong> multibeam<br />
bathymetric systems. With added sophistication, this latest generation multibeam sonar system has<br />
added capabilities and complexity. It is necessary to have a basic theoretical understanding <strong>of</strong> the<br />
way multibeam bathymetry systems in general, and the SEA BEAM 2100 in particular, work in<br />
order to both:<br />
Page 1-2 Copyright © 2000 L-3 Communications SeaBeam Instruments<br />
No portion <strong>of</strong> this document may be reproduced without the expressed written permission <strong>of</strong> L-3 Communications SeaBeam Instruments
<strong>Multibeam</strong> <strong>Sonar</strong> <strong>Theory</strong> <strong>of</strong> <strong>Operation</strong> Introduction<br />
• Operate the system in a manner that maximizes coverage and data quality<br />
• Evaluate the system performance for signs <strong>of</strong> system degradation<br />
Organization <strong>of</strong> this Document<br />
This manual provides a general explanation <strong>of</strong> the way a multibeam sonar system works and<br />
describes in detail the implementation <strong>of</strong> multibeam technology represented by the SEA BEAM<br />
2100 system.<br />
Chapter 2, “<strong>Sonar</strong> Concepts,” introduces the concepts and definitions involved in echo sounding,<br />
using a description <strong>of</strong> a simple single-beam echo sounder as an example. Characteristics <strong>of</strong> the<br />
creation and transmission <strong>of</strong> acoustic pulses in water and their echoes <strong>of</strong>f the ocean bottom are<br />
discussed. This chapter also explains some <strong>of</strong> the limitations <strong>of</strong> a single-beam sonar.<br />
Chapter 3, “Introduction to <strong>Multibeam</strong> <strong>Sonar</strong>: Projector and Hydrophone Systems,” describes the<br />
Mills Cross technique, including the processes <strong>of</strong> beam forming and beam steering and how it is<br />
applied to sonar and to the SEA BEAM 2100 in particular. The chapter discusses how systems<br />
that employ the Mills Cross technique can make up for many <strong>of</strong> the short-comings <strong>of</strong> single-beam<br />
echo sounders.<br />
Chapter 4, “Detection Processing and Range Calculation,” describes how the SEA BEAM 2100<br />
extracts signals and determines the location <strong>of</strong> the sea floor from multibeam echoes. The<br />
processes used for ship motion compensation and the formation <strong>of</strong> stable beams and the<br />
implementation <strong>of</strong> sound velocity pr<strong>of</strong>iles are discussed.<br />
Chapter 5, “Sidescan <strong>Sonar</strong>,” discusses sea floor imaging using sidescan sonars and how the<br />
SEA BEAM 2100 can be used simultaneously as a depth-finding and sidescan sonar.<br />
A glossary <strong>of</strong> the terminology <strong>of</strong> multibeam sonar technology is included as an appendix.<br />
Scope <strong>of</strong> this Document<br />
<strong>Multibeam</strong> technology involves a number <strong>of</strong> disciplines including underwater acoustics, digital<br />
signal processing, and detection theory statistics. Many excellent texts are available that provide<br />
in-depth mathematical treatment <strong>of</strong> each <strong>of</strong> these fields. The purpose <strong>of</strong> this document is not to<br />
cover all related topics in rigorous mathematical detail, but instead to present you with a simple,<br />
clear understanding <strong>of</strong> the fundamental concepts required to develop the full potential <strong>of</strong> a<br />
multibeam sonar system. Ideas are presented in a graphical and descriptive way, with minimal use<br />
<strong>of</strong> complex mathematics. Where appropriate, references to texts are provided so you can pursue<br />
topics in greater detail. While directed at users <strong>of</strong> the SEA BEAM 2100 system in particular, most<br />
<strong>of</strong> the concepts explained in this document are common to all multibeam sonars, so much <strong>of</strong> this<br />
information can be applied to any commercially available multibeam system.<br />
Copyright © 2000 L-3 Communications SeaBeam Instruments Page 1-3<br />
No portion <strong>of</strong> this document may be reproduced without the expressed written permission <strong>of</strong> L-3 Communications SeaBeam Instruments
Introduction <strong>Multibeam</strong> <strong>Sonar</strong> <strong>Theory</strong> <strong>of</strong> <strong>Operation</strong><br />
Page 1-4 Copyright © 2000 L-3 Communications SeaBeam Instruments<br />
No portion <strong>of</strong> this document may be reproduced without the expressed written permission <strong>of</strong> L-3 Communications SeaBeam Instruments
<strong>Multibeam</strong> <strong>Sonar</strong> <strong>Theory</strong> <strong>of</strong> <strong>Operation</strong> <strong>Sonar</strong> Concepts<br />
Chapter 2 - <strong>Sonar</strong> Concepts<br />
This chapter describes the components and operation <strong>of</strong> an echo-sounding system and the<br />
characteristics <strong>of</strong> its typical operating environment. It begins by introducing the most basic<br />
concepts associated with sonar technology. A simple single-beam echo sounder is then described<br />
in some detail to show the components and procedures common to all sonar systems. The<br />
limitations <strong>of</strong> this simple system are used as justification for the complexity <strong>of</strong> multibeam sonar.<br />
Much <strong>of</strong> the terminology <strong>of</strong> sonar systems is introduced in this section. Where terms are used for<br />
the first time, they are italicized. Their meaning is in the context where they are used. For a<br />
formal list <strong>of</strong> the definitions <strong>of</strong> these and other terms, a glossary is included as an appendix to this<br />
document.<br />
The Physics <strong>of</strong> Sound in Water<br />
It is clear to anyone who has immersed himself or herself in a lake or ocean that sounds can be<br />
heard underwater. The sounds <strong>of</strong> waves, power boats, and other bathers can be heard with<br />
remarkable clarity, even at considerable distances. In fact, sounds move quite efficiently through<br />
water, far more easily than they do through air. As an example, whales use sound to communicate<br />
over distances <strong>of</strong> tens or even hundreds <strong>of</strong> kilometers. The ability <strong>of</strong> sound to travel over such<br />
great distances allows remote sensing in a water environment. Devices that use sounds in such an<br />
application fall under the family <strong>of</strong> instruments known as sonars. To understand sonars, you must<br />
first understand sound. In particular, you must understand how sound moves in water.<br />
Sound travels in water in a moving series <strong>of</strong> pressure fronts known as a compressional wave.<br />
These pressure fronts move (or propagate) at a specific speed in water, the local speed <strong>of</strong><br />
sound. The local speed <strong>of</strong> sound can change depending on the conditions <strong>of</strong> the water such as its<br />
salinity, pressure, and temperature, but it is independent <strong>of</strong> the characteristics <strong>of</strong> the sound itself—<br />
all sound waves travel at the local speed <strong>of</strong> sound. In a typical ocean environment, the speed <strong>of</strong><br />
sound is in the neighborhood <strong>of</strong> 1500 meters per second (m/s). The section, “Detection Processing<br />
and Ray Calculation,” in Chapter 4 describes some <strong>of</strong> the physics behind the differences in speed<br />
<strong>of</strong> sound and how sonars can adapt to them.<br />
The physical distance between pressure fronts in a traveling sound wave is its wavelength. The<br />
number <strong>of</strong> pressure fronts that pass a stationary point in the water per unit time is the frequency<br />
<strong>of</strong> the wave. Wavelength, if measured in meters (m), and frequency, if measured in cycles per<br />
second (Hz), are related to each other through the speed <strong>of</strong> sound, which is measured in meters<br />
per second (m/s):<br />
speed <strong>of</strong> sound = frequency × wavelength<br />
When a sound wave encounters a change in the local speed <strong>of</strong> sound, its wavelength changes, but<br />
its frequency remains constant. For this reason, sound waves are generally described in terms <strong>of</strong><br />
their frequency.<br />
Copyright © 2000 L-3 Communications SeaBeam Instruments Page 2-1<br />
No portion <strong>of</strong> this document may be reproduced without the expressed written permission <strong>of</strong> L-3 Communications SeaBeam Instruments
<strong>Sonar</strong> Concepts <strong>Multibeam</strong> <strong>Sonar</strong> <strong>Theory</strong> <strong>of</strong> <strong>Operation</strong><br />
A sound wave carries a certain amount <strong>of</strong> acoustic energy. This energy can be measured by a<br />
device called a hydrophone, which measures the oscillations in pressure as the pressure fronts <strong>of</strong><br />
a sound wave pass. The size <strong>of</strong> these oscillations is the amplitude <strong>of</strong> the wave. The amplitude is<br />
related to the acoustic energy being transmitted in the wave— higher amplitude waves carry<br />
higher energy. Mathematically, the energy <strong>of</strong> a sound wave per unit time (called power) is<br />
proportional to the square <strong>of</strong> its amplitude.<br />
Figure Chapter 2 - -1 shows schematically the components <strong>of</strong> a sound wave. A series <strong>of</strong><br />
advancing pressure fronts, representing a traveling sound wave, are shown as a gray scale, with<br />
dark shades corresponding to high pressure and light shades corresponding to low pressure. The<br />
distance between the pressure fronts is the wavelength. The pressure fronts move with the speed<br />
<strong>of</strong> sound. Accompanying the gray scale is a measurement <strong>of</strong> the changes in pressure with time as<br />
seen by a stationary hydrophone in the water. The size <strong>of</strong> the oscillations in pressure is the<br />
amplitude, and the amount <strong>of</strong> time between peaks in the pressure is the inverse <strong>of</strong> the frequency,<br />
called the time period.<br />
Figure Chapter 2 - -1: Components <strong>of</strong> a Sound Wave<br />
As a sound wave propagates, it loses some <strong>of</strong> its acoustic energy. This happens because the<br />
transfer <strong>of</strong> pressure differences between molecules <strong>of</strong> water is not 100% efficient— some energy<br />
is lost as generated heat. The energy lost by propagating waves is called attenuation. As a sound<br />
wave is attenuated, its amplitude is reduced.<br />
Sound waves are useful for remote sensing in a water environment because some <strong>of</strong> them can<br />
travel for hundreds <strong>of</strong> kilometers without significant attenuation. Light and radio waves (which are<br />
used in radar), on the other hand, penetrate only a few meters into water before they lose virtually<br />
all <strong>of</strong> their energy. The level <strong>of</strong> attenuation <strong>of</strong> a sound wave is dependent on its frequency— high<br />
frequency sound is attenuated rapidly, while extremely low frequency sound can travel virtually<br />
unimpeded throughout the ocean. A sound wave from a typical sonar operating at 12 kHz loses<br />
about half <strong>of</strong> its energy to attenuation traveling 3000 meters through water.<br />
Page 2-2 Copyright © 2000 L-3 Communications SeaBeam Instruments<br />
No portion <strong>of</strong> this document may be reproduced without the expressed written permission <strong>of</strong> L-3 Communications SeaBeam Instruments
<strong>Multibeam</strong> <strong>Sonar</strong> <strong>Theory</strong> <strong>of</strong> <strong>Operation</strong> <strong>Sonar</strong> Concepts<br />
While acoustic energy travels well in water, it gets interrupted by a sudden change in medium,<br />
such as rock or sand. When a moving sound pulse encounters such a medium, some fraction <strong>of</strong> its<br />
energy propagates into the new material. How much <strong>of</strong> the energy is transmitted is dependent on<br />
a number <strong>of</strong> factors, including the impedance <strong>of</strong> the new material (a product <strong>of</strong> the material’s<br />
density and the speed <strong>of</strong> sound within it), the angle <strong>of</strong> incidence <strong>of</strong> the impinging pulse (the angle<br />
at which the sound pulse strikes the new medium), and the roughness <strong>of</strong> the new medium’s<br />
surface. The energy that is not transmitted into the new material must go back into the original<br />
medium— the water— as sound. Some amount <strong>of</strong> it is reflected <strong>of</strong>f the surface <strong>of</strong> the material—<br />
essentially it bounces <strong>of</strong>f in a direction that depends on the angle <strong>of</strong> incidence. The remainder is<br />
scattered in all directions. How much energy goes into reflection and how much goes into<br />
scattering depends on the characteristics <strong>of</strong> the material and the angle <strong>of</strong> incidence. The energy<br />
returned to the water (in other words, the energy that is not transmitted into the new medium) is<br />
called an echo. The echo maintains the frequency characteristics <strong>of</strong> the source wave. Figure<br />
Chapter 2 - -2 shows the components <strong>of</strong> an echo event on the ocean floor.<br />
Figure Chapter 2 - -2: Components <strong>of</strong> an Echo Event on the Ocean Floor<br />
The Principles <strong>of</strong> <strong>Sonar</strong><br />
A sonar is a device for remotely detecting and locating objects in water using sound. It does this<br />
by taking advantage <strong>of</strong> the behavior <strong>of</strong> sound in water. There are two basic types <strong>of</strong> sonar:<br />
• Passive sonars are essentially “listening” devices that record the sounds emitted by objects in<br />
water. Such instruments can be used to detect seismic events, ships, submarines, and marine<br />
creatures— anything that emits sound on its own. Their utility is in disciplines other than sea<br />
floor measurement, and they are not covered in this document.<br />
Copyright © 2000 L-3 Communications SeaBeam Instruments Page 2-3<br />
No portion <strong>of</strong> this document may be reproduced without the expressed written permission <strong>of</strong> L-3 Communications SeaBeam Instruments
<strong>Sonar</strong> Concepts <strong>Multibeam</strong> <strong>Sonar</strong> <strong>Theory</strong> <strong>of</strong> <strong>Operation</strong><br />
• Active sonars are devices that produce sound waves <strong>of</strong> specific, controlled frequencies, and<br />
listen for the echoes <strong>of</strong> these emitted sounds returned from remote objects in the water.<br />
<strong>Sonar</strong>s that measure ocean depths are active sonars.<br />
From this point on, this document only discusses active sonar devices used to remotely measure<br />
the depth <strong>of</strong> the ocean floor, a process called echo sounding or bathymetry measurement. The<br />
instruments that make these measurements are called echo sounders. The SEA BEAM 2100<br />
system is a complex echo sounder, but basic principles <strong>of</strong> all echo sounders apply to it.<br />
Echo sounders measure depth by generating a short pulse <strong>of</strong> sound, or ping, and then listening for<br />
the echo <strong>of</strong> the pulse from the bottom. The time between transmission <strong>of</strong> a pulse and the return <strong>of</strong><br />
its echo is the time it takes the sound to travel to the bottom and back. Knowing this time and the<br />
speed <strong>of</strong> sound in water allows you to calculate the range to the bottom. For instance, if you find<br />
that it takes 10 seconds between when a ping is transmitted and when you hear its echo, then<br />
using a speed <strong>of</strong> sound <strong>of</strong> 1500 m/s, you know it traveled 10 sec × 1500 m/s = 15000 m. Because<br />
this is the “round trip” distance— to the target and back— the range to the bottom is half <strong>of</strong> 15000,<br />
or 7500 m. In general:<br />
range = (1/2) × velocity × echo time<br />
To produce a sound wave, an echo sounder uses a device called a projector. A projector can be<br />
anything that is capable <strong>of</strong> producing a sound in water, and there are many forms <strong>of</strong> them tailored<br />
to specific applications. One type <strong>of</strong> projector system detonates explosive charges underwater—<br />
such devices are called “boomers.” “Sparkers” use high energy electrical discharges to create<br />
plasma bubbles. “Air guns” use compressed air to create a collapsing bubble underwater. These<br />
devices are used primarily for seismic surveys. They are limited in that the amplitude, frequency,<br />
and duration <strong>of</strong> the sound pulses they create cannot be maintained from one ping to the next.<br />
Bathymetric sonars require projectors that can repeatedly produce acoustic pulses with precise,<br />
controllable, and repeatable characteristics. They use projectors constructed <strong>of</strong> piezo-electric<br />
ceramic, a material that changes its size minutely when a voltage is applied to it. An echo sounder<br />
can use particular voltages to cause the piezo-electric projector to oscillate, transmitting a pressure<br />
wave with specific frequency characteristics into the water. Such a projector is analogous to a<br />
common loudspeaker, which converts electrical signals into oscillations <strong>of</strong> a cloth or paper<br />
membrane, transmitting energy into air in the form <strong>of</strong> sound waves.<br />
A sound pulse generated in water expands spherically from its source— its energy travels equally<br />
in all directions. As the sphere <strong>of</strong> a pulse front expands, its energy is being spread over a larger<br />
and larger area (the surface <strong>of</strong> the expanding sphere), causing a drop in energy per unit area. This<br />
drop in energy is called spreading loss. The pulse also suffers from some attenuation, or<br />
absorption loss. Collectively, spreading loss and absorption loss are called transmission loss.<br />
The total amount <strong>of</strong> transmission loss that affects a sound wave is dependent on the distance it<br />
travels— the farther a wave propagates, the weaker it gets.<br />
Page 2-4 Copyright © 2000 L-3 Communications SeaBeam Instruments<br />
No portion <strong>of</strong> this document may be reproduced without the expressed written permission <strong>of</strong> L-3 Communications SeaBeam Instruments
<strong>Multibeam</strong> <strong>Sonar</strong> <strong>Theory</strong> <strong>of</strong> <strong>Operation</strong> <strong>Sonar</strong> Concepts<br />
When a sound wave strikes a portion <strong>of</strong> the ocean bottom, it is said to illuminate or ensonify that<br />
part <strong>of</strong> the bottom. What happens to the acoustic energy at this point can be very complex. A<br />
portion <strong>of</strong> the energy is transmitted into the sea floor. How much energy is transmitted depends on<br />
the bottom material. Sand and silt absorb energy fairly easily. On the other hand, rocks and metal<br />
objects absorb minimal acoustic energy. The bulk <strong>of</strong> the energy that cannot be absorbed by the<br />
ensonified target is reflected or scattered back into the water. The fraction <strong>of</strong> incident energy per<br />
unit area that is directed back in the direction <strong>of</strong> the projector is called the backscattering<br />
strength <strong>of</strong> the bottom.<br />
After echoing <strong>of</strong>f the bottom, the return sound pulse endures more transmission loss. The echo<br />
sounder detects what is left <strong>of</strong> the return pulse using a hydrophone. Hydrophones do what<br />
projectors do in reverse— they convert the physical oscillations that they experience when sound<br />
waves impinge upon them into voltages. Hydrophones are analogous to microphones in that they<br />
convert sounds transmitted through the air into electrical signals. Because <strong>of</strong> the similarity <strong>of</strong> their<br />
functions, the projectors and hydrophones in a sonar system are <strong>of</strong>ten the same pieces <strong>of</strong><br />
hardware. The term transducer refers to both hydrophone and projector devices.<br />
In every stage <strong>of</strong> this process— ping generation, propagation, echoing, and reception— there are<br />
sources <strong>of</strong> sound that add themselves to the final signal received. These include, but are not<br />
limited to, ocean sounds (waves, for example), marine creatures, and shipboard sounds from the<br />
survey vessel and other vessels. There are also spurious signals that enter the signal from the<br />
sonar electronics. Collectively, the magnitude <strong>of</strong> these unwanted signals is called the noise level.<br />
The noise level limits the maximum range <strong>of</strong> any remote sensing instrument. In a noiseless world,<br />
the tiniest sonar echo from the sea floor could be detected. While a ping and its echo have<br />
transmission losses that make them weaker and weaker, they never actually drop to zero.<br />
However, in the real, noisy world they will eventually become so weak that they are<br />
indistinguishable from the noise level, and are thus undetectable. The signal-to-noise ratio is the<br />
ratio <strong>of</strong> the received signal strength to the noise level. It gives a measure <strong>of</strong> the detectability <strong>of</strong> a<br />
signal. The minimal signal-to-noise ratio required for a signal to be detectable depends on the<br />
specific application.<br />
The <strong>Sonar</strong> Equation<br />
<strong>Sonar</strong> engineers <strong>of</strong>ten keep track <strong>of</strong> all <strong>of</strong> the factors involved in the acoustic echoing process<br />
with the <strong>Sonar</strong> Equation. This equation expresses what is called the Signal Excess (SE), the<br />
strength <strong>of</strong> the measured echo return, in terms <strong>of</strong> the quantities described above— Transmission<br />
Loss (TL), Backscattering Strength (BS, <strong>of</strong>ten called target strength when used in the detection<br />
<strong>of</strong> discrete objects such as a mine or a submarine), the Target Area (TA), and Noise Level (NL).<br />
It also includes the transmitted Source Level (SL), which is a measure <strong>of</strong> the amount <strong>of</strong> acoustic<br />
energy put into the water by the projector. By convention, all quantities are in decibels (dBs):<br />
SE = SL - 2TL + BS - NL + TA<br />
Copyright © 2000 L-3 Communications SeaBeam Instruments Page 2-5<br />
No portion <strong>of</strong> this document may be reproduced without the expressed written permission <strong>of</strong> L-3 Communications SeaBeam Instruments
<strong>Sonar</strong> Concepts <strong>Multibeam</strong> <strong>Sonar</strong> <strong>Theory</strong> <strong>of</strong> <strong>Operation</strong><br />
The sonar equation can appear in different forms and may have additional terms. It clearly<br />
represents many <strong>of</strong> the factors involved in echo sounding and how they relate to one another. The<br />
sonar equation thus comes in handy during the design process or for predicting performances<br />
during many "what if" scenarios. Figure Chapter 2 - -3 follows the path <strong>of</strong> a ping from projector to<br />
the ocean floor and back to a hydrophone to show where each element <strong>of</strong> the sonar equation<br />
comes into play. The interested reader will find more information on sonar equations in the book,<br />
Principles <strong>of</strong> Underwater Sound by Robert J. Urick. 3rd edition: McGraw Hill, 1983.<br />
Figure Chapter 2 - -3: Path <strong>of</strong> a Ping<br />
A Single-Beam Depth Sounder<br />
The earliest, most basic, and still the most widely used echo sounding devices are single-beam<br />
depth sounders. The purpose <strong>of</strong> these instruments is to make one-at-a-time measurements <strong>of</strong> the<br />
ocean depth at many locations. Recorded depths can be combined with their physical locations to<br />
build a three-dimensional map <strong>of</strong> the ocean floor. In general, single-beam depth sounders are set<br />
up to make measurements from a vessel while it is in motion. While single-beam depth sounders<br />
have many limitations (discussed in this document), it is useful to understand how they work as a<br />
prelude to understanding a multibeam sonar.<br />
Page 2-6 Copyright © 2000 L-3 Communications SeaBeam Instruments<br />
No portion <strong>of</strong> this document may be reproduced without the expressed written permission <strong>of</strong> L-3 Communications SeaBeam Instruments
<strong>Multibeam</strong> <strong>Sonar</strong> <strong>Theory</strong> <strong>of</strong> <strong>Operation</strong> <strong>Sonar</strong> Concepts<br />
A single-beam depth sounder system consists <strong>of</strong> four basic components: a Transmitter, a<br />
Transducer, a Receiver, and a Control and Display system. These components are depicted<br />
schematically in Figure Chapter 2 - -4. In order to collect a series <strong>of</strong> depth measurements as a<br />
ship travels, the operations <strong>of</strong> the single-beam depth sounder are performed in a continuous cycle,<br />
called the ping cycle.<br />
Figure Chapter 2 - -4: Components <strong>of</strong> a Single-Beam Depth Sounder System<br />
Copyright © 2000 L-3 Communications SeaBeam Instruments Page 2-7<br />
No portion <strong>of</strong> this document may be reproduced without the expressed written permission <strong>of</strong> L-3 Communications SeaBeam Instruments
<strong>Sonar</strong> Concepts <strong>Multibeam</strong> <strong>Sonar</strong> <strong>Theory</strong> <strong>of</strong> <strong>Operation</strong><br />
The ping cycle is governed by the Control and Display system. In a single cycle, the Control and<br />
Display system signals the Transmitter system to produce a sound pulse (or ping). The<br />
Transmitter generates an oscillating electric signal with frequency characteristics that can be<br />
uniquely distinguished. The Transducer converts the electrical energy into sound waves. In this<br />
capacity it is being used as a projector. The oscillating electric signals are converted into<br />
mechanical vibrations that are transmitted into the water as an oscillating pressure or a sound<br />
wave. Upon its return as an echo from the sea floor, the sound pulse is received and converted<br />
back into electrical signals by the Transducer acting as a hydrophone. The Transducer passes on<br />
all received electrical signals to the Receiver system, where they are amplified and passed through<br />
a detection scheme to determine when an echo arrives. The time between transmission and<br />
reception is used by the Receiver system to compute a range or depth. This depth is reported and<br />
recorded by the Control and Display system. The Control and Display system then triggers the<br />
next ping. The amount <strong>of</strong> time required between the ping transmissions is called the ping time or<br />
ping interval. Using a continuous ping cycle, a series <strong>of</strong> depth measurements are taken and<br />
logged.<br />
Why <strong>Multibeam</strong>? The Limitations <strong>of</strong> a Single-<br />
Beam Depth Sounder<br />
While simple and inexpensive to build, and easy to use and understand, the single-beam echo<br />
sounder has a number <strong>of</strong> critical limitations that make it an inappropriate instrument for large-scale<br />
bathymetric survey work. These limitations have been the driving incentive behind the<br />
development <strong>of</strong> the more complex and expensive multibeam sonars such as the SEA BEAM<br />
2100.<br />
The purpose <strong>of</strong> a large-scale bathymetric survey is to produce accurate depth measurements for<br />
many neighboring points on the sea floor such that an accurate picture <strong>of</strong> the geography <strong>of</strong> the<br />
bottom can be established. To do this efficiently, two things are required <strong>of</strong> the sonar used: it must<br />
produce accurate depth measurements that correspond to well-defined locations on the sea floor<br />
(that is, specific latitudes and longitudes); and it must be able to make large numbers <strong>of</strong> these<br />
measurements in a reasonable amount <strong>of</strong> time. As you will see, the single-beam echo sounder falls<br />
short in both areas.<br />
Echo Location Questions – Where is the Bottom?<br />
The most basic function <strong>of</strong> an echo sounder is to measure the range to the ocean floor accurately.<br />
In a bathymetric survey, a sonar is most useful if it measures the range to a specific location on<br />
the bottom, ideally at a point directly below the vessel doing the survey.<br />
Page 2-8 Copyright © 2000 L-3 Communications SeaBeam Instruments<br />
No portion <strong>of</strong> this document may be reproduced without the expressed written permission <strong>of</strong> L-3 Communications SeaBeam Instruments
<strong>Multibeam</strong> <strong>Sonar</strong> <strong>Theory</strong> <strong>of</strong> <strong>Operation</strong> <strong>Sonar</strong> Concepts<br />
Using the single-beam echo sounder described above, you might assume that the time <strong>of</strong> the first<br />
echo from a ping determines the range to the bottom directly below the survey vessel. In the<br />
situation pictured in Figure Chapter 2 - -4 this is certainly the case— the earliest echo is from<br />
directly below the sonar, because that is where the ping first encounters the bottom. However,<br />
Figure Chapter 2 - -4 is drawn with an ideal, flat bottom. You can easily imagine a situation where<br />
the first echo might not be from a point directly below. Figure Chapter 2 - -5 shows a survey<br />
vessel over an irregular sea floor, where a bottom feature behind the vessel is closer to the sonar<br />
than the bottom directly below. Pings from the single-beam echo sounder, which spread out<br />
spherically from the sonar— equally in all directions— strike the bottom first at this point. There is<br />
no way for an operator on the survey vessel to know that the first return echo is not from the<br />
bottom directly below. This situation will produce an inaccurate measurement <strong>of</strong> the depth at this<br />
location.<br />
Figure Chapter 2 - -5: Surveying an Irregular Sea Floor<br />
A single-beam echo sounder can be designed such that it deals with this problem to some degree.<br />
It does this by introducing some directivity to the ping. Effectively, the bulk <strong>of</strong> the acoustic energy<br />
in the ping is focused within a narrow solid angle, or beam (how this is done is covered in Chapter<br />
3). The ping then ensonifies only a small patch <strong>of</strong> the bottom, and the first returned echo can be<br />
assumed to come from this area. Figure Chapter 2 - -6 shows how a narrow-beam echo sounder<br />
can be used to produce a more accurate depth measurement <strong>of</strong> an irregular sea floor.<br />
Copyright © 2000 L-3 Communications SeaBeam Instruments Page 2-9<br />
No portion <strong>of</strong> this document may be reproduced without the expressed written permission <strong>of</strong> L-3 Communications SeaBeam Instruments
<strong>Sonar</strong> Concepts <strong>Multibeam</strong> <strong>Sonar</strong> <strong>Theory</strong> <strong>of</strong> <strong>Operation</strong><br />
Figure Chapter 2 - -6: Using a Narrow-Beam Echo Sounder on an Irregular Sea Floor<br />
However, the narrow beam does not completely solve the problem for two reasons. First, since<br />
the transducers are mounted on the hull <strong>of</strong> a ship, which is subject to wave motion, the narrow<br />
beam illuminates scattered areas <strong>of</strong> the ocean floor (see Figure Chapter 2 - -7). This is what is<br />
known as an unstabilized beam. The magnitude <strong>of</strong> this problem depends on the severity <strong>of</strong> the<br />
weather, but it can be quite large. Roll and pitch angles <strong>of</strong> tens <strong>of</strong> degrees in moderately heavy<br />
seas are not uncommon in the open ocean. Secondly, beams are made narrower by making the<br />
transducer face larger. For example, a circular 12 kHz transducer with a 30° beam width has a<br />
diameter <strong>of</strong> roughly 25 cm, but requires a diameter <strong>of</strong> roughly 295 cm for a 2.5° beam. These<br />
larger transducers are more expensive to manufacture.<br />
Page 2-10 Copyright © 2000 L-3 Communications SeaBeam Instruments<br />
No portion <strong>of</strong> this document may be reproduced without the expressed written permission <strong>of</strong> L-3 Communications SeaBeam Instruments
<strong>Multibeam</strong> <strong>Sonar</strong> <strong>Theory</strong> <strong>of</strong> <strong>Operation</strong> <strong>Sonar</strong> Concepts<br />
Figure Chapter 2 - -7: Ship Motion Effects on an Unstabilized Beam<br />
The solid angle size <strong>of</strong> the beam determines how accurately a narrow beam sonar can determine<br />
the location <strong>of</strong> depths on the bottom. An observer recording an echo from such a sonar can<br />
determine only that the bottom is located somewhere within that angle at the computed range. For<br />
a simple sonar there is no way <strong>of</strong> extracting any more accurate information from the system. The<br />
size <strong>of</strong> the beam solid angle determines the resolution <strong>of</strong> a sonar. The term resolution may apply<br />
to the angle itself, or to the physical size <strong>of</strong> the area on the bottom the beam ensonifies. Note that<br />
in the latter definition, the resolution is not fixed— it depends on depth. The deeper a ping goes, the<br />
larger an area its fixed solid angle will intersect (see Figure Chapter 2 - -8). In general, the area <strong>of</strong><br />
the ensonified bottom is proportional to the beam solid angle and to the square <strong>of</strong> the depth.<br />
Copyright © 2000 L-3 Communications SeaBeam Instruments Page 2-11<br />
No portion <strong>of</strong> this document may be reproduced without the expressed written permission <strong>of</strong> L-3 Communications SeaBeam Instruments
<strong>Sonar</strong> Concepts <strong>Multibeam</strong> <strong>Sonar</strong> <strong>Theory</strong> <strong>of</strong> <strong>Operation</strong><br />
Survey Speed<br />
Figure Chapter 2 - -8: Dependence <strong>of</strong> Ensonified Area on Depth<br />
To be cost-effective, a bathymetric survey must be completed in a reasonably short amount <strong>of</strong><br />
time. For a survey to be performed properly, it must have a dedicated survey vessel, and, quite<br />
simply, ships are very expensive to operate. This is particularly true in a deep sea environment,<br />
where a survey vessel must be large enough to ride out the worst ocean weather and must have a<br />
dedicated staff to run and maintain it for days or weeks at a time. In the business <strong>of</strong> bathymetric<br />
surveying, time is equal to money in a very real sense.<br />
A single-beam echo sounder is not a time-efficient survey instrument because it makes only one<br />
depth measurement at a time. The area <strong>of</strong> the bottom ensonified by the sonar’s beam is the only<br />
part <strong>of</strong> the sea floor that can be considered “mapped” in a ping. Additional pings must be used to<br />
map all neighboring points. Recall that in the ping cycle, a ping echo must return before the next<br />
ping can be transmitted. This effectively removes the size <strong>of</strong> the time interval between pings from<br />
your control— it is dependent on the depth and the speed <strong>of</strong> sound. If a sonar has a very narrow<br />
beam, which provides highly accurate locations for its depth measurements, the mapping process<br />
will require many individual measurements and take a very long time. The process can be speeded<br />
up by using a sonar with a larger beam that maps a larger area with each ping, but with poorer<br />
bottom resolution.<br />
Page 2-12 Copyright © 2000 L-3 Communications SeaBeam Instruments<br />
No portion <strong>of</strong> this document may be reproduced without the expressed written permission <strong>of</strong> L-3 Communications SeaBeam Instruments
<strong>Multibeam</strong> <strong>Sonar</strong> <strong>Theory</strong> <strong>of</strong> <strong>Operation</strong> <strong>Sonar</strong> Concepts<br />
The <strong>Multibeam</strong> Solution<br />
A multibeam sonar is an instrument that can map more than one location on the ocean floor with<br />
a single ping and with higher resolution than those <strong>of</strong> conventional echo sounders. Effectively, the<br />
job <strong>of</strong> a narrow single-beam echo sounder is performed at several different locations on the<br />
bottom at once. These bottom locations are arranged such that they map a contiguous area <strong>of</strong> the<br />
bottom— usually a strip <strong>of</strong> points in a direction perpendicular to the path <strong>of</strong> the survey vessel. This<br />
area is called a swath. The dimension <strong>of</strong> the swath in the acrosstrack or athwartship direction<br />
(perpendicular to the path <strong>of</strong> the ship) is called the swath width, and it can be measured either as<br />
a fixed angle or as a physical size that changes with depth. The swath <strong>of</strong> a multibeam sonar is<br />
depicted in Figure Chapter 2 - -9.<br />
Figure Chapter 2 - -9: <strong>Multibeam</strong> <strong>Sonar</strong> Swath<br />
Copyright © 2000 L-3 Communications SeaBeam Instruments Page 2-13<br />
No portion <strong>of</strong> this document may be reproduced without the expressed written permission <strong>of</strong> L-3 Communications SeaBeam Instruments
<strong>Sonar</strong> Concepts <strong>Multibeam</strong> <strong>Sonar</strong> <strong>Theory</strong> <strong>of</strong> <strong>Operation</strong><br />
Clearly, this is highly advantageous. <strong>Multibeam</strong> sonars can map complete swaths <strong>of</strong> the bottom in<br />
roughly the time it takes for the echo to return from the farthest angle. For a 120°-swath system,<br />
this time is twice the ping cycle time <strong>of</strong> a single-beam sounder, but such a system typically<br />
provides over 100 soundings as opposed to only one. Because they are far more complex, the cost<br />
<strong>of</strong> a multibeam sonar can be many times that <strong>of</strong> a single-beam sonar. However, this cost is more<br />
than compensated by the savings associated with reduced ship operating time. As a consequence,<br />
multibeam sonars are the survey instrument <strong>of</strong> choice in most mapping applications, particularly in<br />
deep ocean environments where ship operating time is expensive.<br />
The SEA BEAM 2100 is a multibeam sonar system. It maps up to 151 sounding points at 1°<br />
intervals with each ping, and can cover areas tens <strong>of</strong> kilometers wide in depths <strong>of</strong> a few<br />
kilometers. How this is accomplished is the subject <strong>of</strong> the rest <strong>of</strong> this document.<br />
Page 2-14 Copyright © 2000 L-3 Communications SeaBeam Instruments<br />
No portion <strong>of</strong> this document may be reproduced without the expressed written permission <strong>of</strong> L-3 Communications SeaBeam Instruments
Introduction to <strong>Multibeam</strong> <strong>Sonar</strong>:<br />
<strong>Multibeam</strong> <strong>Sonar</strong> <strong>Theory</strong> <strong>of</strong> <strong>Operation</strong> Projector and Hydrophone Systems<br />
Chapter 3 - Introduction to <strong>Multibeam</strong><br />
<strong>Sonar</strong>: Projector and<br />
Hydrophone Systems<br />
The previous chapter examined how multibeam sonar can be used to make up for many <strong>of</strong> the<br />
short comings <strong>of</strong> single-beam sonar. It introduced the concept <strong>of</strong> directivity and narrow projector<br />
beams. This chapter describes how<br />
• groups <strong>of</strong> projectors, called projector arrays, and groups <strong>of</strong> hydrophones, called hydrophone<br />
arrays, can be used to produce narrow transmit and receive beams, a process called beam<br />
forming<br />
• these narrow beams can be targeted at specific angles using beam steering processes<br />
• a hydrophone array can be used to simultaneously record sound from many steered beams<br />
• projector and hydrophone arrays are combined in a Mills Cross arrangement<br />
• all <strong>of</strong> these techniques are employed in the SEA BEAM 2100 system<br />
Projector Arrays and Beam Forming<br />
Recall from the section, “A Single-Beam Depth Sounder,” in Chapter 2, that a ping from a simple<br />
single-beam echo sounder expands spherically with uniform amplitude as it propagates through<br />
water, spreading its acoustic energy equally in all directions. This symmetric spreading is called an<br />
isotropic expansion, and the projector that produces it is called an isotropic source. A good<br />
example <strong>of</strong> a wave with isotropic expansion is the circular pattern produced when a small stone is<br />
dropped in a quiet pond (see Figure Chapter 3 - -1).<br />
Copyright © 2000 L-3 Communications SeaBeam Instruments Page 3-1<br />
No portion <strong>of</strong> this document may be reproduced without the expressed written permission <strong>of</strong> L-3 Communications SeaBeam Instruments
Introduction to <strong>Multibeam</strong> <strong>Sonar</strong>:<br />
Projector and Hydrophone Systems <strong>Multibeam</strong> <strong>Sonar</strong> <strong>Theory</strong> <strong>of</strong> <strong>Operation</strong><br />
Figure Chapter 3 - -1: Isotropic Expansion<br />
An isotropic source is not ideal for a depth-sounding sonar for two reasons:<br />
• The spherically expanding pulse strikes the ocean floor in all directions. There is no way to<br />
determine the direction <strong>of</strong> the return echoes, so no detailed information about the bottom can<br />
be discerned.<br />
• The power <strong>of</strong> the transmitted pulse is sent equally in all directions, so much <strong>of</strong> it is squandered,<br />
ensonifying areas that may not be interesting.<br />
Fortunately, groups <strong>of</strong> isotropic sources, called projector arrays, can be used to transmit nonisotropic<br />
waves or sound waves whose amplitude varies as a function <strong>of</strong> angular location (still<br />
spreading spherically), allowing projected pulses to have a degree <strong>of</strong> directivity. Directed pulses<br />
can be used to ensonify specific areas on the ocean floor, causing stronger echoes from these<br />
locations. Ranges can then be found to those locations, generating more detailed information about<br />
the bottom.<br />
Recall from the section, “The Physics <strong>of</strong> Sound in Water,” in Chapter 2, that a sound wave is<br />
composed <strong>of</strong> a series <strong>of</strong> pressure oscillations. The circular solid lines in Figure Chapter 3 - -1<br />
represent high pressure peaks. Spaced half-way between these lines are low pressure troughs<br />
represented by dashed lines. Alone, an ideal single-point projector always produces an isotropically<br />
expanding wave. Operating at a constant frequency, it creates a continuous series <strong>of</strong> equally<br />
spaced, expanding peaks and troughs, which look similar to what is pictured in Figure Chapter 3 - -<br />
1.<br />
Page 3-2 Copyright © 2000 L-3 Communications SeaBeam Instruments<br />
No portion <strong>of</strong> this document may be reproduced without the expressed written permission <strong>of</strong> L-3 Communications SeaBeam Instruments
Introduction to <strong>Multibeam</strong> <strong>Sonar</strong>:<br />
<strong>Multibeam</strong> <strong>Sonar</strong> <strong>Theory</strong> <strong>of</strong> <strong>Operation</strong> Projector and Hydrophone Systems<br />
If two neighboring projectors are emitting identical isotropically expanding signals, their wave<br />
patterns will overlap and interfere with each other. This situation is depicted in Figure Chapter 3 -<br />
-2. At some points in the surrounding water, the peaks <strong>of</strong> the pattern from one projector will<br />
coincide with peaks from the other, and will add to create a new, stronger peak. Troughs that<br />
coincide with troughs will create new, deeper troughs. This is called constructive interference. At<br />
other points, peaks from one projector will coincide with troughs <strong>of</strong> the other and will effectively<br />
cancel each other. This is called destructive interference.<br />
In general, constructive interference occurs at points where the distances to each projector are<br />
equal, or where the difference between the two distances is equal to an integer number <strong>of</strong><br />
wavelengths. Destructive interference occurs at positions where the difference between the<br />
distances to the projectors is half a wavelength, or half a wavelength plus an integer number <strong>of</strong><br />
wavelengths (1.5, 2.5, 3.5, and so forth). If a hydrophone is placed at the positions <strong>of</strong> constructive<br />
interference, a combined wave would be measured with an amplitude twice that <strong>of</strong> the signals<br />
emitted by each projector individually. A hydrophone placed at a position <strong>of</strong> destructive<br />
interference would measure nothing at all. Where are these places?<br />
Figure Chapter 3 - -2: Constructive and Destructive Interference<br />
Copyright © 2000 L-3 Communications SeaBeam Instruments Page 3-3<br />
No portion <strong>of</strong> this document may be reproduced without the expressed written permission <strong>of</strong> L-3 Communications SeaBeam Instruments
Introduction to <strong>Multibeam</strong> <strong>Sonar</strong>:<br />
Projector and Hydrophone Systems <strong>Multibeam</strong> <strong>Sonar</strong> <strong>Theory</strong> <strong>of</strong> <strong>Operation</strong><br />
In Figure Chapter 3 - -3, two projectors P 1 and P 2 are separated by a distance d (referred to as<br />
the element spacing). Consider a point located distance R 1 from P 1 and R 2 from P 2 . If this point is<br />
located anywhere on the perpendicular bisector <strong>of</strong> line P1P2, then R 1 and R 2 are equal. Any point<br />
along this line will witness constructive interference.<br />
Figure Chapter 3 - -3: Positions <strong>of</strong> Constructive Interference (Example 1)<br />
The locations <strong>of</strong> other constructive interference are less obvious, but they can be found with some<br />
simple geometry. In Figure Chapter 3 - -4, two projectors P 1 and P 2 again have a spacing d.<br />
Consider a point at a location R 1 from P 1 and R 2 from P 2 . The direction to this location (labeled R 0<br />
in the figure) intersects a line perpendicular to the spacing d with an angle θ 0 . Next, assume that<br />
the point you are considering is very far away compared to the spacing <strong>of</strong> the projectors—<br />
meaning that R 1 and R 2 are much larger than d. For a typical operating environment for a sonar,<br />
this is a good approximation— projectors are spaced centimeters apart (d = cm) and the ocean<br />
floor they are ensonifying is hundreds or thousands <strong>of</strong> meters away (R 0 = 100 m to 1000 m,<br />
meaning R 0 /d = 1000 to 10000). This is called the far field approximation, and it is necessary to<br />
keep computations simple. In this situation, the lines R 0 , R 1 , and R 2 are treated as parallel, and all<br />
intersecting angles θ 0 , θ 1 , and θ 2 as equal.<br />
Page 3-4 Copyright © 2000 L-3 Communications SeaBeam Instruments<br />
No portion <strong>of</strong> this document may be reproduced without the expressed written permission <strong>of</strong> L-3 Communications SeaBeam Instruments
Introduction to <strong>Multibeam</strong> <strong>Sonar</strong>:<br />
<strong>Multibeam</strong> <strong>Sonar</strong> <strong>Theory</strong> <strong>of</strong> <strong>Operation</strong> Projector and Hydrophone Systems<br />
Figure Chapter 3 - -4: Positions <strong>of</strong> Constructive Interference (Example 2)<br />
The difference between R 1 and R 2 is the line segment labeled A in Figure Chapter 3 - -4. If all<br />
angles are equal, this distance is:<br />
or more simply:<br />
A = d × cos (90 - θ 0 ), (3.1)<br />
A = d × sin θ 0 . (3.2)<br />
Recall that constructive interference occurs when A is an integer number <strong>of</strong> wavelengths:<br />
where λ represents wavelength.<br />
Substituting Equation 3.2 for A:<br />
Similarly, destructive interference will occur where:<br />
A/λ = 0, 1, 2, 3, 4, . . . . . . . . . .etc., (3.3)<br />
(d/λ) × sin θ 0 = 0, 1, 2, 3, 4, . . . . . . . .etc. (3.4)<br />
(d/λ) × sin θ 0 = .5, 1.5, 2.5, 3.5, . . . . . . .etc. (3.5)<br />
From these equations you can see that locations <strong>of</strong> constructive and destructive interference are<br />
dependent on the projector spacing d, the wavelength <strong>of</strong> the sound emitted λ, and the angle θ 0 to<br />
the location. Both d and λ remain constant for a typical sonar installation— the only remaining<br />
variable is θ 0 . This indicates that two projectors in the configuration described will transmit<br />
constructively interfering (that is, high amplitude) waves in certain directions, while in others it<br />
will transmit nothing due to destructive interference. Knowing d in terms <strong>of</strong> λ, you can determine<br />
which directions will have constructive and destructive interference.<br />
Copyright © 2000 L-3 Communications SeaBeam Instruments Page 3-5<br />
No portion <strong>of</strong> this document may be reproduced without the expressed written permission <strong>of</strong> L-3 Communications SeaBeam Instruments
Introduction to <strong>Multibeam</strong> <strong>Sonar</strong>:<br />
Projector and Hydrophone Systems <strong>Multibeam</strong> <strong>Sonar</strong> <strong>Theory</strong> <strong>of</strong> <strong>Operation</strong><br />
A typical sonar spacing d is λ/2— half a wavelength— because the angles at which destructive<br />
and constructive interference occur are most advantageous. Using d/λ = l/2 in the Equations 3.4<br />
and 3.5 yields:<br />
Constructive interference: θ = 0, 180<br />
Destructive interference: θ = 90, 270<br />
So, the two projector arrays will transmit the highest energy sound in the directions θ = 0, 180, and<br />
no sound at all in the directions θ = 90, 270 (see Figure Chapter 3 - -5). The emission <strong>of</strong> this<br />
system can be measured with a hydrophone located at different angles around it. At 0 and 180, it<br />
measures maximum amplitude, while at 90 and 270 it measures nothing. At angles in between,<br />
there is a mix <strong>of</strong> constructive and destructive interference leading to intermediate amplitudes. By<br />
positioning a hydrophone at a set radius and many different angles around a projector array, you<br />
can record the amplitude <strong>of</strong> emitted sound in different directions. Figure Chapter 3 - -6 plots<br />
measured amplitude as a function <strong>of</strong> angle for a two projector array. Figure Chapter 3 - -6 is a<br />
polar plot— amplitudes are measured along radial lines from the center. The amplitude plot is what<br />
is known as a beam pattern, or array pattern (and sometimes a power pattern). It clearly<br />
shows that the bulk <strong>of</strong> the energy emitted by the two projector array propagates perpendicular to<br />
the axis <strong>of</strong> separation <strong>of</strong> the projectors.<br />
Figure Chapter 3 - -5: Directions <strong>of</strong> Constructive and Destructive Interference for Two<br />
Projectors with Spacing l/2<br />
Page 3-6 Copyright © 2000 L-3 Communications SeaBeam Instruments<br />
No portion <strong>of</strong> this document may be reproduced without the expressed written permission <strong>of</strong> L-3 Communications SeaBeam Instruments
Introduction to <strong>Multibeam</strong> <strong>Sonar</strong>:<br />
<strong>Multibeam</strong> <strong>Sonar</strong> <strong>Theory</strong> <strong>of</strong> <strong>Operation</strong> Projector and Hydrophone Systems<br />
Figure Chapter 3 - -6: Beam Pattern for Two Hydrophones with Spacing l/2<br />
Remember that projectors operate in a three-dimensional environment. To accurately represent<br />
the beam pattern <strong>of</strong> a two-projector array, Figure Chapter 3 - -6 should be rotated around the axis<br />
<strong>of</strong> separation <strong>of</strong> the projectors, about which it is symmetric (see Figure Chapter 3 - -7). Because<br />
three-dimensional drawings <strong>of</strong> beam patterns are difficult to interpret, the patterns are usually<br />
drawn in two-dimensions. For those beam patterns with an axis <strong>of</strong> symmetry, a two-dimensional<br />
drawing provides a complete description. More complex patterns that are not symmetric about an<br />
axis are usually represented by multiple drawings showing the cross-section <strong>of</strong> the pattern at<br />
different angles.<br />
Copyright © 2000 L-3 Communications SeaBeam Instruments Page 3-7<br />
No portion <strong>of</strong> this document may be reproduced without the expressed written permission <strong>of</strong> L-3 Communications SeaBeam Instruments
Introduction to <strong>Multibeam</strong> <strong>Sonar</strong>:<br />
Projector and Hydrophone Systems <strong>Multibeam</strong> <strong>Sonar</strong> <strong>Theory</strong> <strong>of</strong> <strong>Operation</strong><br />
Figure Chapter 3 - -7: Three-Dimensional Beam Pattern for Two Projectors with<br />
Spacing l/2<br />
One useful way <strong>of</strong> interpreting Figure Chapter 3 - -6 is as a plot <strong>of</strong> the angles at which the energy<br />
<strong>of</strong> an acoustic pulse is directed. In the figure, the highest level <strong>of</strong> acoustic energy is directed<br />
perpendicular to the axis <strong>of</strong> projector separation. Objects in these directions are ensonified with<br />
the most energy and return the strongest echoes. Objects in other directions return significantly<br />
weaker echoes. This selective projection <strong>of</strong> energy is called directivity. The beam pattern<br />
provides a measure <strong>of</strong> the directivity <strong>of</strong> a system— projector arrays that direct the bulk <strong>of</strong> their<br />
energy at a very narrow range <strong>of</strong> angles are said to have a high directivity.<br />
Real projector arrays generally have more than two projector elements and have complex beam<br />
patterns. One common array configuration is a simple extension <strong>of</strong> the two projector array— an<br />
arrangement <strong>of</strong> many projectors in a straight line called a line array. The beam pattern <strong>of</strong> a<br />
multiple-element line array is pictured in Figure Chapter 3 - -8. Although detailed mathematics are<br />
required to compute this pattern, it is essentially just an extension <strong>of</strong> the reasoning used to find the<br />
two-projector array pattern. This complex beam pattern can be used to point out the features <strong>of</strong> all<br />
such patterns.<br />
Page 3-8 Copyright © 2000 L-3 Communications SeaBeam Instruments<br />
No portion <strong>of</strong> this document may be reproduced without the expressed written permission <strong>of</strong> L-3 Communications SeaBeam Instruments
Introduction to <strong>Multibeam</strong> <strong>Sonar</strong>:<br />
<strong>Multibeam</strong> <strong>Sonar</strong> <strong>Theory</strong> <strong>of</strong> <strong>Operation</strong> Projector and Hydrophone Systems<br />
Figure Chapter 3 - -8: Beam Pattern <strong>of</strong> a Multiple-Element Line Array<br />
The bulk <strong>of</strong> the energy in the line array beam pattern is in what is called the main lobe. The<br />
direction <strong>of</strong> the peak energy projection— the center <strong>of</strong> the main lobe— is called the maximum<br />
response axis (MRA) <strong>of</strong> the beam pattern. The width or beam solid angle <strong>of</strong> the main lobe,<br />
which is a measure <strong>of</strong> the pattern's directivity, is twice the angle from the axis to the half power<br />
point on the pattern— the angle at which the projected power is exactly half that <strong>of</strong> the axis. This<br />
is referred to as the beam width measured to the -3 dB point, where the projected power is -3 dB<br />
that <strong>of</strong> the axis (these points are almost equal, as -3 dB corresponds roughly to 1/2).<br />
The main lobe <strong>of</strong> the line array pattern is narrower than that <strong>of</strong> the two-projector array pattern. In<br />
general, the larger an array or projector system is in a dimension, the narrower the main lobe <strong>of</strong><br />
the beam it projects in perpendicular directions will be. A good first approximation for the width <strong>of</strong><br />
the main lobe <strong>of</strong> a pattern <strong>of</strong> a system with size D (which can be the physical size <strong>of</strong> the<br />
transducer in a single-projector system, or (N - 1) × d, the total length <strong>of</strong> N elements in an array<br />
with spacing d) transmitting at a wavelength λ is:<br />
half power beam width (degrees) = 50.6 × λ/D (3.6)<br />
Copyright © 2000 L-3 Communications SeaBeam Instruments Page 3-9<br />
No portion <strong>of</strong> this document may be reproduced without the expressed written permission <strong>of</strong> L-3 Communications SeaBeam Instruments
Introduction to <strong>Multibeam</strong> <strong>Sonar</strong>:<br />
Projector and Hydrophone Systems <strong>Multibeam</strong> <strong>Sonar</strong> <strong>Theory</strong> <strong>of</strong> <strong>Operation</strong><br />
Equation 3.6 illustrates some <strong>of</strong> the design considerations involved in building a sonar system. If a<br />
high-resolution sonar system is desired, a narrow beam is needed. The width <strong>of</strong> the beam can be<br />
reduced by building larger projectors and arrays, but there are physical limits on both.<br />
Alternatively, shorter wavelengths can be used. However, shorter wavelength sound, which is also<br />
higher frequency, suffers greater attenuation in water as discussed in the section “The Physics <strong>of</strong><br />
Sound in Water.” The attenuation can be compensated for by raising the transmitted power, but<br />
there are limits to the amount <strong>of</strong> power a single projector can cleanly transmit into water.<br />
On either side <strong>of</strong> the main lobe are a series <strong>of</strong> side lobes where partial constructive interference<br />
takes place. In general, the purpose <strong>of</strong> the array is to ensonify targets in the direction <strong>of</strong> the main<br />
lobe. The side lobes are an annoyance— not only is some <strong>of</strong> the projector energy being<br />
squandered in these directions, but there might be echoes from them as well, and these may be<br />
confused with the echoes from the target in the main lobe. The nearest set <strong>of</strong> side lobes on either<br />
side <strong>of</strong> the main lobe are called the first side lobes, and subsequent sets are called the second<br />
side lobes, third side lobes, and so on. The strength <strong>of</strong> side lobes is measured as a fraction <strong>of</strong> the<br />
power projected into them divided by the power projected into the main lobe, and is called the side<br />
lobe level. These numbers are given in dB. For an array in which all projectors emit the same<br />
power level, the first side lobe level is roughly -13 dB.<br />
Side lobes in the beam patterns <strong>of</strong> projector arrays are unavoidable, although the energy that is<br />
projected into them can be reduced by projecting stronger signals from the individual elements in<br />
the center <strong>of</strong> an array than from those on the edges. This technique is called shading, and the<br />
fraction <strong>of</strong> energy that is projected by each projector element divided by the energy projected by<br />
the peak element is called its shading value. There are a variety <strong>of</strong> algorithms used to determine<br />
what shading values should be applied to each array element. Different combinations <strong>of</strong> shading<br />
values produce different side lobe structures. One popular shading scheme, called<br />
Dolph-Chebyshev shading, can be used to bring all side lobe levels to a uniform value. In theory,<br />
this side lobe level can be any value, but practical considerations limit side lobe reduction generally<br />
to a maximum <strong>of</strong> -40 dB. Although it can be used to reduce the side lobes, shading also causes the<br />
width <strong>of</strong> the main lobe to be larger, decreasing the directivity <strong>of</strong> the system (and nullifying some <strong>of</strong><br />
the advantage <strong>of</strong> the large array). A comparison <strong>of</strong> the approximate widths <strong>of</strong> the main lobes <strong>of</strong><br />
different array sizes both unshaded (-13 dB first side lobe levels) and with Chebyshev shading to<br />
obtain -35 dB side lobe levels is given in Table Chapter 3 - -1. Discovering the proper balance <strong>of</strong><br />
shading, array size, and array elements that yields high directivity with minimal side lobes is a<br />
complex art.<br />
Table Chapter 3 - -1: Main Lobe Width Comparisons<br />
Beamwidth<br />
Array Elements Unshaded Chebyshev (-35 dB)<br />
20 5.1° 6.8°<br />
40 2.5° 3.3°<br />
48 2.1° 2.8°<br />
80 1.3° 1.6°<br />
96 1.1° 1.4°<br />
Page 3-10 Copyright © 2000 L-3 Communications SeaBeam Instruments<br />
No portion <strong>of</strong> this document may be reproduced without the expressed written permission <strong>of</strong> L-3 Communications SeaBeam Instruments
Introduction to <strong>Multibeam</strong> <strong>Sonar</strong>:<br />
<strong>Multibeam</strong> <strong>Sonar</strong> <strong>Theory</strong> <strong>of</strong> <strong>Operation</strong> Projector and Hydrophone Systems<br />
Hydrophone Arrays<br />
The previous section described how arrays <strong>of</strong> projectors can be used to generate narrow beams<br />
<strong>of</strong> sound that will ensonify small patches <strong>of</strong> the sea floor. Hydrophones as well as projectors can<br />
be formed into arrays. Where projector arrays transmit sound into narrow beams, hydrophones<br />
arrays are used to receive sound from narrow beams.<br />
It is easy to see how this works. In Figure Chapter 3 - -9 through Figure Chapter 3 - -14, a line<br />
array <strong>of</strong> hydrophones is examined in two situations. In Figure Chapter 3 - -9, a source<br />
perpendicular to the axis <strong>of</strong> the line array is producing sound waves. The source <strong>of</strong> these sound<br />
waves is in the far field, such that the wave fronts striking the hydrophone array are a series <strong>of</strong><br />
parallel lines. Each hydrophone in the array is making an independent measurement <strong>of</strong> the wave.<br />
The signal measured by each hydrophone as a function <strong>of</strong> time can be plotted in what is called a<br />
signal trace. Figure Chapter 3 - -10 shows signal traces for three <strong>of</strong> the hydrophones. Because<br />
the parallel waves are striking these hydrophones at exactly the same time, these three plots are<br />
identical— measured peaks and troughs occur at the same times. The three measurements are<br />
said to be in phase. Summing the three hydrophone traces results in a trace with the same<br />
frequency but three times the amplitude (pictured in Figure Chapter 3 - -11)— the measurements<br />
<strong>of</strong> the three hydrophones add constructively. Collectively, the hydrophone array is highly sensitive<br />
to sounds from this direction.<br />
Figure Chapter 3 - -9: Hydrophone Array with a Perpendicular Source<br />
Copyright © 2000 L-3 Communications SeaBeam Instruments Page 3-11<br />
No portion <strong>of</strong> this document may be reproduced without the expressed written permission <strong>of</strong> L-3 Communications SeaBeam Instruments
Introduction to <strong>Multibeam</strong> <strong>Sonar</strong>:<br />
Projector and Hydrophone Systems <strong>Multibeam</strong> <strong>Sonar</strong> <strong>Theory</strong> <strong>of</strong> <strong>Operation</strong><br />
Figure Chapter 3 - -10: Hydrophone Traces for a Perpendicular Source<br />
Figure Chapter 3 - -11: Sum <strong>of</strong> Hydrophone Traces for a Perpendicular Source<br />
Figure Chapter 3 - -12 shows the same hydrophone array receiving sound waves from a source at<br />
an angle θ <strong>of</strong>f the perpendicular. Due to the angle <strong>of</strong> the source, the parallel waves from this<br />
source strike the hydrophones in the array at different times. This causes the hydrophone traces to<br />
look different— peaks and troughs occur at different times as pictured in Figure Chapter 3 - -13.<br />
The three measurements are said to be out <strong>of</strong> phase. The sum <strong>of</strong> the three hydrophone traces<br />
has peaks and troughs eliminating each other— they add destructively (see Figure Chapter 3 - -<br />
14). Collectively, the hydrophone array is not sensitive to sounds from this direction.<br />
Page 3-12 Copyright © 2000 L-3 Communications SeaBeam Instruments<br />
No portion <strong>of</strong> this document may be reproduced without the expressed written permission <strong>of</strong> L-3 Communications SeaBeam Instruments
Introduction to <strong>Multibeam</strong> <strong>Sonar</strong>:<br />
<strong>Multibeam</strong> <strong>Sonar</strong> <strong>Theory</strong> <strong>of</strong> <strong>Operation</strong> Projector and Hydrophone Systems<br />
Figure Chapter 3 - -12: Hydrophone Array with Waves from an Angled Source<br />
Figure Chapter 3 - -13: Hydrophone Traces for an Angled Source<br />
Copyright © 2000 L-3 Communications SeaBeam Instruments Page 3-13<br />
No portion <strong>of</strong> this document may be reproduced without the expressed written permission <strong>of</strong> L-3 Communications SeaBeam Instruments
Introduction to <strong>Multibeam</strong> <strong>Sonar</strong>:<br />
Projector and Hydrophone Systems <strong>Multibeam</strong> <strong>Sonar</strong> <strong>Theory</strong> <strong>of</strong> <strong>Operation</strong><br />
Figure Chapter 3 - -14: Sum <strong>of</strong> Hydrophone Traces for an Angled Source<br />
Placing a projector at many distant (far field) points around the hydrophone array, and recording<br />
the sum <strong>of</strong> what the hydrophone elements measure, generates a familiar pattern. Figure Chapter 3<br />
- -15 shows the pattern that would result from such a series <strong>of</strong> measurements for a line array <strong>of</strong><br />
hydrophones. As in the case <strong>of</strong> the projector arrays, these pictures, called beam patterns, share<br />
many <strong>of</strong> the same features and terminology associated with projector arrays— main lobes, side<br />
lobes, axis, shading, and beam widths are all defined the same way. In fact, if you were to<br />
measure the beam patterns <strong>of</strong> an array <strong>of</strong> transducers operating as a projector array and then as a<br />
hydrophone array (recall that they can act as both), the patterns would be identical. This is called<br />
the principle <strong>of</strong> reciprocity because the hydrophone arrays follow exactly the same rules that<br />
projector arrays do.<br />
Page 3-14 Copyright © 2000 L-3 Communications SeaBeam Instruments<br />
No portion <strong>of</strong> this document may be reproduced without the expressed written permission <strong>of</strong> L-3 Communications SeaBeam Instruments
Introduction to <strong>Multibeam</strong> <strong>Sonar</strong>:<br />
<strong>Multibeam</strong> <strong>Sonar</strong> <strong>Theory</strong> <strong>of</strong> <strong>Operation</strong> Projector and Hydrophone Systems<br />
Figure Chapter 3 - -15: Beam Pattern for a Line Array <strong>of</strong> Hydrophones<br />
In short, the important points to remember about the beam patterns <strong>of</strong> both projector and<br />
hydrophone arrays are the following:<br />
• The larger an array is in a dimension, the narrower its main lobe will be in the plane<br />
perpendicular to that dimension.<br />
• The width <strong>of</strong> the main lobe is measured at the half power point.<br />
• Side lobes are undesirable, but unavoidable.<br />
• Side lobes can be reduced through techniques such as shading at the cost <strong>of</strong> widening the<br />
main lobe.<br />
• The beam pattern <strong>of</strong> a transducer array acting as projectors is the same as that <strong>of</strong> it acting as<br />
hydrophones.<br />
Beam Steering<br />
The previous section described how an array <strong>of</strong> hydrophones can be used to receive sound<br />
preferentially from specific perpendicular directions. This section describes how an array can be<br />
altered to receive preferentially from any <strong>of</strong> a number <strong>of</strong> directions. This technique is called beam<br />
steering. Effectively, it allows the angle <strong>of</strong> the axis <strong>of</strong> the beam pattern, pictured in Figure<br />
Chapter 3 - -15, to be changed.<br />
Copyright © 2000 L-3 Communications SeaBeam Instruments Page 3-15<br />
No portion <strong>of</strong> this document may be reproduced without the expressed written permission <strong>of</strong> L-3 Communications SeaBeam Instruments
Introduction to <strong>Multibeam</strong> <strong>Sonar</strong>:<br />
Projector and Hydrophone Systems <strong>Multibeam</strong> <strong>Sonar</strong> <strong>Theory</strong> <strong>of</strong> <strong>Operation</strong><br />
Consider, once again, a line array receiving sound from an arbitrary angle θ <strong>of</strong>f the perpendicular<br />
(see Figure Chapter 3 - -16). Recall that the sound from this angle arrived at the elements <strong>of</strong> the<br />
hydrophone array out <strong>of</strong> phase, causing the signals at the different hydrophones to add<br />
destructively. The reason for this is that the sound waves must travel different distances to reach<br />
each hydrophone. In Figure Chapter 3 - -16, sound waves first strike the hydrophone labeled 3.<br />
They must travel the distance labeled A before reaching hydrophone 2, and distance B before<br />
reaching hydrophone 1. These distances can be computed using the spacing between the<br />
hydrophones (both assumed in this case to equal d, although this is by no means a requirement):<br />
A = d × sin θ (3.7)<br />
B = 2d × sin θ<br />
Figure Chapter 3 - -16: Wavefronts Striking a Hydrophone Array from a Source at<br />
Angle q<br />
The extra times required for the wave front to reach each hydrophone are given by the distances<br />
divided by the local sound speed c:<br />
T 2 (time to hydrophone 2) = A / c = (d sin θ) / c (3.8)<br />
T 1 (time to hydrophone 1) = B / c = (2d sin θ) / c<br />
Knowing these time differences you can cause the hydrophone array to have maximum sensitivity<br />
at angle θ by summing the individual hydrophone readings slightly <strong>of</strong>fset in time such that the<br />
wave fronts constructively interfere. In this example, you would sum the reading <strong>of</strong> hydrophone 3<br />
with the reading <strong>of</strong> hydrophone 2 delayed by T 2 and the reading <strong>of</strong> hydrophone 1 delayed by time<br />
T 1 . This is called introducing a time delay. It causes the main lobe <strong>of</strong> the beam pattern to shift<br />
such that its axis is at angle θ from the perpendicular (see Figure Chapter 3 - -17). By applying<br />
time delays, or alternatively equivalent phase delays to hydrophone readings and summing them<br />
(a concept covered in the description <strong>of</strong> SEA BEAM 2100 processing), an array can be “steered”<br />
to maximize its sensitivity to any angle θ.<br />
Page 3-16 Copyright © 2000 L-3 Communications SeaBeam Instruments<br />
No portion <strong>of</strong> this document may be reproduced without the expressed written permission <strong>of</strong> L-3 Communications SeaBeam Instruments
Introduction to <strong>Multibeam</strong> <strong>Sonar</strong>:<br />
<strong>Multibeam</strong> <strong>Sonar</strong> <strong>Theory</strong> <strong>of</strong> <strong>Operation</strong> Projector and Hydrophone Systems<br />
Figure Chapter 3 - -17: Main Lobe Shifted to Angle q by Introducing a Time Delay<br />
Note that in steering a hydrophone array to be sensitive to a particular angle, nothing about the<br />
array itself is changed— only the interpretation <strong>of</strong> the data it records is altered. By changing the<br />
data processing, the same array can be steered to observe any <strong>of</strong> a large range <strong>of</strong> angles. In fact,<br />
using the same recorded data from the elements <strong>of</strong> the hydrophone array, different data<br />
processing can be used to examine the sounds coming from different angles simultaneously. In<br />
this way, a hydrophone array can be used to examine the echoes from a single ping at many<br />
different locations.<br />
Copyright © 2000 L-3 Communications SeaBeam Instruments Page 3-17<br />
No portion <strong>of</strong> this document may be reproduced without the expressed written permission <strong>of</strong> L-3 Communications SeaBeam Instruments
Introduction to <strong>Multibeam</strong> <strong>Sonar</strong>:<br />
Projector and Hydrophone Systems <strong>Multibeam</strong> <strong>Sonar</strong> <strong>Theory</strong> <strong>of</strong> <strong>Operation</strong><br />
The product <strong>of</strong> this process— the series <strong>of</strong> beam-steered traces B θ1 (t), B θ2 (t), . . . . B θM (t)— can<br />
be treated as a series <strong>of</strong> independent measurements <strong>of</strong> signals from different angles between θ1<br />
and θM. Effectively, beam steering is used to create a series <strong>of</strong> “virtual” hydrophone arrays, each<br />
sensitive to a different angle (see Figure Chapter 3 - -18).<br />
Figure Chapter 3 - -18: Hydrophone Array Processing Used to Observe Different<br />
Beam Patterns Simultaneously<br />
The Mills Cross Technique<br />
Recall that each <strong>of</strong> the beam patterns in Figure Chapter 3 - -8, Figure Chapter 3 - -15, Figure<br />
Chapter 3 - -17, and Figure Chapter 3 - -18 are two-dimensional representations <strong>of</strong> threedimensional<br />
patterns. The true beam pattern in each <strong>of</strong> these situations can be seen by rotating the<br />
figure about the axis <strong>of</strong> the line array (see Figure Chapter 3 - -6 and Figure Chapter 3 - -7). A<br />
projector line array transmits sound preferentially in all directions perpendicular to the axis <strong>of</strong> the<br />
array, ensonifying a strip <strong>of</strong> the ocean bottom (see Figure Chapter 3 - -19). Similarly, a<br />
hydrophone array aligned parallel to the projector array receives echoes from all locations along a<br />
similar strip <strong>of</strong> the ocean floor. If you want to accurately locate echoes on the ocean floor, this is<br />
not very useful! The projector array will cause echoes all along the ensonified strip, and the<br />
hydrophone array will pick up echoes from a similar strip. There will be no way <strong>of</strong> telling where<br />
the echoes are occurring along these strips.<br />
Page 3-18 Copyright © 2000 L-3 Communications SeaBeam Instruments<br />
No portion <strong>of</strong> this document may be reproduced without the expressed written permission <strong>of</strong> L-3 Communications SeaBeam Instruments
Introduction to <strong>Multibeam</strong> <strong>Sonar</strong>:<br />
<strong>Multibeam</strong> <strong>Sonar</strong> <strong>Theory</strong> <strong>of</strong> <strong>Operation</strong> Projector and Hydrophone Systems<br />
Figure Chapter 3 - -19: Projector Array Ensonifying a Strip <strong>of</strong> the Ocean Floor<br />
If, however, the projector and hydrophone arrays are perpendicular to each other, the strip <strong>of</strong> the<br />
ocean floor ensonified by the projectors will intersect with the strip <strong>of</strong> the ocean floor observed by<br />
the hydrophones. This occurs in only a small area with dimensions that correspond approximately<br />
to the projector and hydrophone array beamwidths (see Figure Chapter 3 - -20). While echoes<br />
occur along the entire ensonified area, and sound may be received from the entire observed area,<br />
the only part <strong>of</strong> the bottom both ensonified by the projector array and observed by the hydrophone<br />
array beam is the area where the two strips overlap. The amplitude trace from the hydrophone<br />
array will contain only those echoes from the transmitted ping that occur in this area. The<br />
perpendicular arrangement <strong>of</strong> the projector and hydrophone line arrays is called a Mills Cross,<br />
named after a pioneering radio astronomy instrument built in New South Wales, Australia.<br />
Copyright © 2000 L-3 Communications SeaBeam Instruments Page 3-19<br />
No portion <strong>of</strong> this document may be reproduced without the expressed written permission <strong>of</strong> L-3 Communications SeaBeam Instruments
Introduction to <strong>Multibeam</strong> <strong>Sonar</strong>:<br />
Projector and Hydrophone Systems <strong>Multibeam</strong> <strong>Sonar</strong> <strong>Theory</strong> <strong>of</strong> <strong>Operation</strong><br />
Figure Chapter 3 - -20: Projector and Hydrophone Arrays Arranged in a “Mills Cross”<br />
Recall that beam steering can be used to observe echoes generated from multiple angles with the<br />
hydrophone array. These different angles observe parallel strips <strong>of</strong> the bottom, which in the Mills<br />
Cross arrangement, will intersect with the ensonified area in a series <strong>of</strong> small patches (see Figure<br />
Chapter 3 - -21). In this way, the multiple steered beams can be used to receive the echoes from<br />
discrete locations all along the ensonified area, allowing the sonar to determine ranges to a strip <strong>of</strong><br />
locations with each ping. This technique is used by all modern multibeam sonar systems.<br />
Page 3-20 Copyright © 2000 L-3 Communications SeaBeam Instruments<br />
No portion <strong>of</strong> this document may be reproduced without the expressed written permission <strong>of</strong> L-3 Communications SeaBeam Instruments
Introduction to <strong>Multibeam</strong> <strong>Sonar</strong>:<br />
<strong>Multibeam</strong> <strong>Sonar</strong> <strong>Theory</strong> <strong>of</strong> <strong>Operation</strong> Projector and Hydrophone Systems<br />
Figure Chapter 3 - -21: Mills Cross with Multiple Steered Beams<br />
The Mills Cross Applied in the SEA BEAM 2100<br />
System<br />
The SEA BEAM 2100 multibeam sonar utilizes the Mills Cross technique to produce highresolution<br />
maps <strong>of</strong> the ocean floor. This section describes the projector and hydrophone array<br />
configurations used by the 2100, the beams formed by those systems, and how beam steering is<br />
accomplished.<br />
Copyright © 2000 L-3 Communications SeaBeam Instruments Page 3-21<br />
No portion <strong>of</strong> this document may be reproduced without the expressed written permission <strong>of</strong> L-3 Communications SeaBeam Instruments
Introduction to <strong>Multibeam</strong> <strong>Sonar</strong>:<br />
Projector and Hydrophone Systems <strong>Multibeam</strong> <strong>Sonar</strong> <strong>Theory</strong> <strong>of</strong> <strong>Operation</strong><br />
The SEA BEAM 2100 Projector and Hydrophone Arrays<br />
The SEA BEAM 2100 12 kHz projector system consists <strong>of</strong> a line <strong>of</strong> 10 to 14 projector elements<br />
mounted along the keel <strong>of</strong> its survey vessel. Because it is far longer in the alongtrack direction<br />
(parallel to the ship’s keel and its direction <strong>of</strong> motion) than in the acrosstrack or athwartship<br />
direction (perpendicular to the ship’s keel), the complete projector array is similar to a line array. It<br />
projects a beam that is narrow in the alongtrack direction (roughly 2 degrees), and wide in the<br />
acrosstrack direction, illuminating a wide swath <strong>of</strong> the bottom. Dolph-Chebyshev shading<br />
techniques are used to even the illumination in the acrosstrack direction, reducing side lobe levels<br />
to between -25 and -30 dB, depending on the number <strong>of</strong> projector elements. A cross-section <strong>of</strong><br />
the beam pattern <strong>of</strong> the SEA BEAM 2100 projector array at 12 kHz is depicted in Figure Chapter<br />
3 - -22. This pattern has been tailored such that more energy is directed towards the wide<br />
acrosstrack directions where return signals usually arrive with lower signal-to-noise levels. Less<br />
energy is directed near the vertical where backscattering strengths are usually high and travel<br />
distances are shorter.<br />
Figure Chapter 3 - -22: Projector Array Pattern<br />
The SEA BEAM 2100 hydrophone array is mounted in the athwartship direction, forming the Mills<br />
Cross. It consists <strong>of</strong> between 48 and 80 hydrophones, depending on the installation, and can either<br />
be mounted in a “flat” configuration if the survey vessel has a flat bottom, or in a “V”<br />
configuration if the survey ship has v-shaped bottom (see Figure Chapter 3 - -23). In the flat<br />
configuration, the received echoes <strong>of</strong> the entire array are processed together, while in the “V”<br />
configuration the two sides <strong>of</strong> the array are processed separately. The reasons for this are related<br />
to the high-speed data processing shortcuts used in beam steering.<br />
Page 3-22 Copyright © 2000 L-3 Communications SeaBeam Instruments<br />
No portion <strong>of</strong> this document may be reproduced without the expressed written permission <strong>of</strong> L-3 Communications SeaBeam Instruments
Introduction to <strong>Multibeam</strong> <strong>Sonar</strong>:<br />
<strong>Multibeam</strong> <strong>Sonar</strong> <strong>Theory</strong> <strong>of</strong> <strong>Operation</strong> Projector and Hydrophone Systems<br />
Figure Chapter 3 - -23: “Flat” and “V” Configurations for Hydrophone Arrays<br />
SEA BEAM 2100 Beam Steering<br />
The data from the hydrophones is used to form a maximum <strong>of</strong> 151 steered beams, which have<br />
beam widths in the athwartship direction <strong>of</strong> approximately 2 degrees, and spacing <strong>of</strong> roughly 1<br />
degree between their axes. Beam steering is accomplished through digital signal processing.<br />
Each element i <strong>of</strong> the N elements <strong>of</strong> the hydrophone array ( N for the SEA BEAM 2100 is<br />
between 48 and 80) records a signal trace Si(t). It is important to understand the relationship<br />
between the measurement S(t) and the amplitude A(t) <strong>of</strong> a signal. The amplitude A(t) measures<br />
the change in signal strength. It does not measure the oscillations <strong>of</strong> a wave that are observed by<br />
instantaneous measurements. Consider the signal segment pictured in Figure Chapter 3 - -24.<br />
Figure Chapter 3 - -24: Instantaneous Measurements S(t) <strong>of</strong> a Signal with Amplitude<br />
A(t)<br />
The amplitude A(t), which changes with time, is represented by the dashed lines. Within the<br />
envelope <strong>of</strong> the changing amplitude, the signal oscillates with its frequency f.<br />
S(t) is an instantaneous measurement <strong>of</strong> this signal made at time t. Knowing the frequency <strong>of</strong> the<br />
signal and its amplitude A(t) at time t, the instantaneous signal measurement is given by:<br />
S(t) = A(t) cos (2πft) (3.9)<br />
This equation can be rewritten in terms <strong>of</strong> the phase φ(t) <strong>of</strong> the signal at time t:<br />
Copyright © 2000 L-3 Communications SeaBeam Instruments Page 3-23<br />
No portion <strong>of</strong> this document may be reproduced without the expressed written permission <strong>of</strong> L-3 Communications SeaBeam Instruments
Introduction to <strong>Multibeam</strong> <strong>Sonar</strong>:<br />
Projector and Hydrophone Systems <strong>Multibeam</strong> <strong>Sonar</strong> <strong>Theory</strong> <strong>of</strong> <strong>Operation</strong><br />
where:<br />
or equivalently:<br />
S(t) = A(t) cos (φ(t)) (3.10)<br />
φ(t) = 2πft (3.11)<br />
The phase φ(t) is simply a measure <strong>of</strong> where a signal is in its oscillations. An instantaneous<br />
measure <strong>of</strong> a signal will yield S(t), as described above, but what you are really interested in is<br />
A(t), the amplitude. If measurements <strong>of</strong> S(t) and φ(t) are made simultaneously, A(t) can be<br />
extracted using Equation 3.12.<br />
The SEA BEAM 2100 measures both signal strength S(t) and phase φ(t). Both pieces <strong>of</strong><br />
information are converted from continuous analog signals to a series <strong>of</strong> discrete digital<br />
measurements through the analog-to-digital converters. These measurements are made at the<br />
sampling rate, which is between 1 and 3 milliseconds. All <strong>of</strong> the signal and phase data for all<br />
hydrophones from one <strong>of</strong> these samples is called a time slice.<br />
Page 3-24 Copyright © 2000 L-3 Communications SeaBeam Instruments<br />
(3.12)<br />
To form a steered beam, the signals from the hydrophones S1(t) through SN(t) must be combined<br />
with the correct adjustments for the path differences between different elements. Recall from<br />
Equation 3.7 that the path difference <strong>of</strong> a signal from steered beam angle θ between two<br />
elements <strong>of</strong> an array spaced d apart is given by:<br />
d sin θ (3.13)<br />
If the N hydrophones are numbered i = 0 through i = N 1, the path differences required to<br />
properly combine the signals <strong>of</strong> each are given by:<br />
id sin θ (3.14)<br />
For computational purposes, it is easier to speak in terms <strong>of</strong> the phase difference between<br />
hydrophone elements rather than the path difference. The phase difference is a measure <strong>of</strong> the<br />
fractional number <strong>of</strong> wave oscillations that occur in the path difference. The phase difference in<br />
one complete oscillation or cycle is 2π. The fractional difference in phase caused by the path<br />
difference id sin θ is given by:<br />
2π<br />
id sin θ<br />
(3.15)<br />
λ<br />
The in-phase signal received from an angle θ by each hydrophone is the measured signal adjusted<br />
by the appropriate phase delay. Using Equations 3.9 and 3.15, you can find the signal <strong>of</strong><br />
hydrophone element i with the appropriate phase delay required to form a steered beam at<br />
angle θ, called Bi(θ), in terms <strong>of</strong> the instantaneous measurements Si and φi within a time slice:<br />
(3.16)<br />
(3.17)<br />
No portion <strong>of</strong> this document may be reproduced without the expressed written permission <strong>of</strong> L-3 Communications SeaBeam Instruments
Introduction to <strong>Multibeam</strong> <strong>Sonar</strong>:<br />
<strong>Multibeam</strong> <strong>Sonar</strong> <strong>Theory</strong> <strong>of</strong> <strong>Operation</strong> Projector and Hydrophone Systems<br />
The combined steered beam at angle θ for a particular time slice is found by summing the<br />
contributions <strong>of</strong> all hydrophones, with appropriate shading coefficients si:<br />
(3.18)<br />
(3.19)<br />
The calculations required to form M steered beams from the data <strong>of</strong> N hydrophones within one<br />
time slice can be represented using matrix algebra. The phase delay required for hydrophone i at a<br />
beam steered to angle θm as Dmi is defined as:<br />
Then the operation required to find a steered beam becomes:<br />
The logic required to form M steered beams can then be expressed as a matrix multiplication:<br />
(3.20)<br />
(3.21)<br />
To create M steered beams out <strong>of</strong> data from N hydrophones requires on the order <strong>of</strong> M × N<br />
operations. These computations must be completed for each time slice in real time— before data<br />
appears from the next time slice. The time between time slices is only a few milliseconds— far too<br />
short for the matrix multiplication to be performed. Fortunately, some computation short cuts can<br />
be used.<br />
Equation 3.19 is similar to a familiar equation— that <strong>of</strong> a Fast Fourier Transform (FFT 1 ):<br />
where k is an integer.<br />
This is a useful similarity if we make the substitutions:<br />
(3.22)<br />
1 The subject <strong>of</strong> FFTs is vast and deep. Interested readers will find more information in Discrete-Time Signal<br />
Processing by A. V. Oppenheim and R. W. Schafer: Prentice Hall, 1989.<br />
Copyright © 2000 L-3 Communications SeaBeam Instruments Page 3-25<br />
No portion <strong>of</strong> this document may be reproduced without the expressed written permission <strong>of</strong> L-3 Communications SeaBeam Instruments
Introduction to <strong>Multibeam</strong> <strong>Sonar</strong>:<br />
Projector and Hydrophone Systems <strong>Multibeam</strong> <strong>Sonar</strong> <strong>Theory</strong> <strong>of</strong> <strong>Operation</strong><br />
Page 3-26 Copyright © 2000 L-3 Communications SeaBeam Instruments<br />
(3.23)<br />
Equation 3.19 can be used to find B(θ) at any arbitrary θ. However, the FFT can be used only to<br />
solve for angles θ k where the substitution in Equation 3.23 holds true. Solving this equation for<br />
θk:<br />
(3.24)<br />
From Equation 3.24, you can see that the beam steering angles that emerge from the FFT<br />
processing will be limited to a discrete set <strong>of</strong> angles which will depend on λ/d and on N, the<br />
number <strong>of</strong> hydrophones in the array. These angles can be found using values <strong>of</strong> k, which range<br />
from -N/2 to N/2 - 1. Using a hydrophone spacing d <strong>of</strong> λ/2, a 48-hydrophone installation would<br />
yield angles <strong>of</strong>:<br />
k beam<br />
angle<br />
0 0°<br />
1 ± 2.4°<br />
2 ± 4.8°<br />
3 ± 7.2°<br />
4 ± 9.6°<br />
5 ± 12.0°<br />
etc.<br />
Recall that θ is measured such that 0.0 is perpendicular to the hydrophone array.<br />
For certain sizes <strong>of</strong> N (preferably powers <strong>of</strong> 2), special techniques for solving FFTs are available.<br />
Fortunately, N is not strictly limited to the number <strong>of</strong> physical hydrophones in an array. Equation<br />
3.22 and FFT processing work fine if the value <strong>of</strong> hi (corresponding to signal Si and shading si)<br />
is 0. The SEA BEAM 2100 adds a number <strong>of</strong> “virtual” hydrophones with Sj and sj equal to 0 in<br />
order to trick the FFT into processing data with N a power <strong>of</strong> 2. This is also done to increase<br />
beam density.<br />
The FFT computations, which are performed on high-speed digital signal processors (DSPs), allow<br />
the SEA BEAM 2100 beam steering to be accomplished in real time. The FFT processing<br />
produces a time series <strong>of</strong> amplitudes for beams with axes at the beam steering angles. Echoes<br />
recorded from these time series would correspond to locations on the sea floor to which each <strong>of</strong><br />
these angles was pointing. These data must be translated into measurements <strong>of</strong> ocean depths. The<br />
processing required to do this translation is the subject <strong>of</strong> the next chapter.<br />
No portion <strong>of</strong> this document may be reproduced without the expressed written permission <strong>of</strong> L-3 Communications SeaBeam Instruments
Introduction to <strong>Multibeam</strong> <strong>Sonar</strong>:<br />
<strong>Multibeam</strong> <strong>Sonar</strong> <strong>Theory</strong> <strong>of</strong> <strong>Operation</strong> Projector and Hydrophone Systems<br />
Copyright © 2000 L-3 Communications SeaBeam Instruments Page 3-27<br />
No portion <strong>of</strong> this document may be reproduced without the expressed written permission <strong>of</strong> L-3 Communications SeaBeam Instruments
<strong>Multibeam</strong> <strong>Sonar</strong> <strong>Theory</strong> <strong>of</strong> <strong>Operation</strong> Detection Processing and Range Calculations<br />
Chapter 4 - Detection Processing and<br />
Range Calculations<br />
The SEA BEAM 2100 employs the beam steering technique described in Chapter 3 to convert the<br />
amplitude and phase information recorded by the hydrophone array into the amplitudes <strong>of</strong> echoes<br />
observed by the array at discrete angles.<br />
This chapter outlines the additional processing that is performed to convert the steered beam data<br />
into usable output.<br />
Processing Steps<br />
The data processing stream <strong>of</strong> the SEA BEAM 2100 is best understood in terms <strong>of</strong> its timing.<br />
Data is collected by the individual elements <strong>of</strong> the hydrophone array in analog form— each<br />
hydrophone reports continuous voltages representing the amplitudes and phases <strong>of</strong> incoming<br />
signals. These continuous signals are converted to discrete digital signals by the analog-to-digital<br />
converters (see Figure Chapter 4 - -1). The digital data takes the form <strong>of</strong> multiple voltage<br />
readings, each representing the value <strong>of</strong> the continuous analog signal at a precise instant in time.<br />
Collectively, all <strong>of</strong> the instantaneous signal and phase information from all hydrophones in one <strong>of</strong><br />
these precise time instants is called a time slice <strong>of</strong> data. Time slices are separated in time by the<br />
sampling interval, which for the SEA BEAM 2100 is either 4/3 or 8/3 milliseconds depending on<br />
the pulse length or duration <strong>of</strong> the pulse.<br />
Copyright © 2000 L-3 Communications SeaBeam Instruments Page 4-1<br />
No portion <strong>of</strong> this document may be reproduced without the expressed written permission <strong>of</strong> L-3 Communications SeaBeam Instruments
Detection Processing and Range Calculations <strong>Multibeam</strong> <strong>Sonar</strong> <strong>Theory</strong> <strong>of</strong> <strong>Operation</strong><br />
Figure Chapter 4 - -1: Analog-to-Digital Conversion <strong>of</strong> Hydrophone Data<br />
All <strong>of</strong> the time slices that contain the echoes <strong>of</strong> a single sonar ping are called a ping <strong>of</strong> data. Each<br />
ping <strong>of</strong> data is processed by the SEA BEAM 2100 to produce usable output in three forms:<br />
• Bathymetry. This is “traditional” sonar data— depth measurements and their positions on the<br />
sea floor. A single ping <strong>of</strong> the SEA BEAM 2100 produces up to 151 <strong>of</strong> these depth<br />
measurements (or beams) arranged in a swath as described in Chapter 2. The beams can be<br />
described also in terms <strong>of</strong> their angles and ranges from the survey ship. They are spaced<br />
1 degree apart, and have a resolution <strong>of</strong> 2 degrees. They are stabilized for ship motions.<br />
• Selected Beam. This measurement displays the amplitude <strong>of</strong> echoes received from the axis <strong>of</strong><br />
1 <strong>of</strong> the 151 stabilized beams as a function <strong>of</strong> time. This will show not only the echo used to<br />
find the range for the beam, but also other echoes that occurred before and after it. The angle<br />
<strong>of</strong> the beam is chosen by the SEA BEAM 2100 operator.<br />
• Sidescan. This data shows the amplitude <strong>of</strong> the echoes returned from the bottom. The echoes<br />
are co-located with bathymetry. The processing <strong>of</strong> sidescan data is described in Chapter 5.<br />
Page 4-2 Copyright © 2000 L-3 Communications SeaBeam Instruments<br />
No portion <strong>of</strong> this document may be reproduced without the expressed written permission <strong>of</strong> L-3 Communications SeaBeam Instruments
<strong>Multibeam</strong> <strong>Sonar</strong> <strong>Theory</strong> <strong>of</strong> <strong>Operation</strong> Detection Processing and Range Calculations<br />
Some <strong>of</strong> the data processing, particularly in the early stages, is done on a per-time-slice basis. For<br />
instance, the FFT process is applied to each time slice, yielding the amplitudes <strong>of</strong> echoes received<br />
from all steered beams in a single time instant. Later processing, and the ultimate end products,<br />
are on a per-ping basis— the bathymetry and sidescan data that are reported apply to the echoes<br />
generated during a single ping. The selected beam reports a time sequence, in effect showing the<br />
echoes seen by a beam in every time slice during a ping.<br />
The major processing steps used by the SEA BEAM 2100 are outlined schematically in<br />
Figure Chapter 4 - -2. Raw digital hydrophone data, which is composed <strong>of</strong> signal measurements<br />
and phase information, is processed on a per-time-slice basis by the beam steering FFT to produce<br />
steered beam data. A dynamic threshold value, which is used in noise discrimination, is then<br />
computed for each time slice. This value is used in later processing steps. Two distinct processing<br />
schemes are then used to convert the per-time-slice angles and amplitudes to a set <strong>of</strong> beam angles<br />
or direction <strong>of</strong> arrivals (DOAs) and time <strong>of</strong> arrivals (TOAs) <strong>of</strong> bottom echoes. Both <strong>of</strong> these<br />
processes employ ship motion data to convert direction angles from the hydrophone-centered<br />
coordinate system in which they are measured into the Earth-centered coordinate system. The<br />
two processes are known as Bearing Direction Indicator (BDI) and Weighted Mean Time<br />
(WMT). They run in parallel— the SEA BEAM 2100 does both <strong>of</strong> them at the same time— and<br />
they calculate independent measurements <strong>of</strong> angles and times. To some degree they are<br />
redundant, because each generates valid data on its own. However, the BDI process<br />
simultaneously does many <strong>of</strong> the calculations required for sidescan output (see Chapter 5), and the<br />
WMT process also generates the selected beam data. In addition, the two processes each have<br />
bottom configurations and beam angle regimes in which they perform best, so they can be used<br />
together to select final “best” DOA and TOA measurements, increasing the overall accuracy <strong>of</strong><br />
the system. The final stage <strong>of</strong> processing uses the sound velocity pr<strong>of</strong>ile to do “ray tracing,”<br />
converting DOAs and TOAs to bathymetry data— depths and locations.<br />
Copyright © 2000 L-3 Communications SeaBeam Instruments Page 4-3<br />
No portion <strong>of</strong> this document may be reproduced without the expressed written permission <strong>of</strong> L-3 Communications SeaBeam Instruments
Detection Processing and Range Calculations <strong>Multibeam</strong> <strong>Sonar</strong> <strong>Theory</strong> <strong>of</strong> <strong>Operation</strong><br />
Figure Chapter 4 - -2: SEA BEAM 2100 Processing Steps – Raw Hydrophone Data to<br />
Bathymetry, Sidescan and Selected Beam<br />
Page 4-4 Copyright © 2000 L-3 Communications SeaBeam Instruments<br />
No portion <strong>of</strong> this document may be reproduced without the expressed written permission <strong>of</strong> L-3 Communications SeaBeam Instruments
<strong>Multibeam</strong> <strong>Sonar</strong> <strong>Theory</strong> <strong>of</strong> <strong>Operation</strong> Detection Processing and Range Calculations<br />
This chapter follows these processing steps in order, describing each in detail. First, however, the<br />
chapter describes the steered beam data emerging from the FFT, which forms the raw material<br />
for the SEA BEAM 2100 processing.<br />
The Steered Beam Data<br />
The beam forming/beam steering process described in Chapter 3 uses an FFT to convert the<br />
measurements from the hydrophone arrays into steered beam amplitudes. This is done for each<br />
time slice individually. Recall from the “Beam Steering” section in Chapter 3, that the angles <strong>of</strong><br />
steered beams are determined by the equation (3.10):<br />
where d is the spacing between hydrophones, λ is the wavelength <strong>of</strong> the signal used, and k ranges<br />
between -N/2 and N/2 - 1, N being the number <strong>of</strong> hydrophones (including “virtual” hydrophones) in<br />
the array. After the FFT, each time slice contains N amplitude measurements A 1 , A 2 , .....A N , each<br />
associated with a steered beam angle θ 1 , θ 2 , .....θ N . Steered beam angles given by Equation 4.1<br />
are measured with respect to the hydrophone array. The angles θ 1 , θ 2 , .....θ N do not change<br />
between time slices.<br />
Copyright © 2000 L-3 Communications SeaBeam Instruments Page 4-5<br />
No portion <strong>of</strong> this document may be reproduced without the expressed written permission <strong>of</strong> L-3 Communications SeaBeam Instruments<br />
(4.1)
Detection Processing and Range Calculations <strong>Multibeam</strong> <strong>Sonar</strong> <strong>Theory</strong> <strong>of</strong> <strong>Operation</strong><br />
All <strong>of</strong> the data for a single ping cycle that emerges from the FFT processing is represented as a<br />
matrix (see Figure Chapter 4 - -3). The ping cycle contains M time slices, represented by columns<br />
in the figure, each with an associated time t 1 , t 2 , ... t M , measured relative to the ping time t 0 (<strong>of</strong>ten<br />
called “t-zero”). Each time slice contains N amplitude measurements associated with the angles<br />
θ 1 , θ 2 , .....θ N (which are in the left-most column). An individual amplitude measurement A mn can be<br />
identified in the matrix by its subscripts: m for the time slice (between 1 and M); n for the steered<br />
beam angle (from 1 to N).<br />
Figure Chapter 4 - -3: Matrix <strong>of</strong> Steered Beam Data from a Single Ping Containing M<br />
Time Slices<br />
Dynamic Threshold Calculation<br />
A single time slice <strong>of</strong> data represents the echoes received by the hydrophone array in terms <strong>of</strong><br />
their direction (θ) and amplitude in an instant <strong>of</strong> time. Depending on the range and configuration <strong>of</strong><br />
the bottom and the time slice, these echoes can be very different. Figure Chapter 4 - -4 through<br />
Figure Chapter 4 - -9 consider a hydrophone array receiving echoes from a single ping ensonifying<br />
a complex sea floor and the echoes that occur in different time slices. For pictorial simplicity, the<br />
system has only 12 steered beams, although the principles discussed apply to a larger number <strong>of</strong><br />
beams.<br />
Page 4-6 Copyright © 2000 L-3 Communications SeaBeam Instruments<br />
No portion <strong>of</strong> this document may be reproduced without the expressed written permission <strong>of</strong> L-3 Communications SeaBeam Instruments
<strong>Multibeam</strong> <strong>Sonar</strong> <strong>Theory</strong> <strong>of</strong> <strong>Operation</strong> Detection Processing and Range Calculations<br />
In Figure Chapter 4 - -4, a time t 1 has passed since the sonar system has transmitted a ping. As<br />
yet, the ping has not reached the bottom, so there are no bottom echoes produced at time t 1 . The<br />
time slice at time 2 × t 1 , which is when any echoes produced at time t 1 would be received<br />
(remember, any echoes must travel back to the hydrophone array, and to do so requires the same<br />
amount <strong>of</strong> time it took the ping to propagate outward) will contain no echoes from the sea floor.<br />
However, it will have measurable amplitudes, as pictured in Figure Chapter 4 - -5. These<br />
amplitudes are due to background noise (discussed in “The Principles <strong>of</strong> <strong>Sonar</strong>” in Chapter 2).<br />
Figure Chapter 4 - -4: Hydrophone Array at Time t1<br />
Figure Chapter 4 - -5: Time Slice at Time 2 · t 1<br />
Copyright © 2000 L-3 Communications SeaBeam Instruments Page 4-7<br />
No portion <strong>of</strong> this document may be reproduced without the expressed written permission <strong>of</strong> L-3 Communications SeaBeam Instruments
Detection Processing and Range Calculations <strong>Multibeam</strong> <strong>Sonar</strong> <strong>Theory</strong> <strong>of</strong> <strong>Operation</strong><br />
Figure Chapter 4 - -6 considers the same hydrophone array at a later time t 2 . The ping has<br />
propagated to the point where it is intersecting the bottom at a single point, at angle θ A to the<br />
hydrophone array. The time slice at time 2 × t 2 contains the echo from this point (see Figure<br />
Chapter 4 - -7). Note that θ A does not necessarily occur at one <strong>of</strong> the axes <strong>of</strong> the steered<br />
beams— in general it will occur at angles between two beams. The echo will cause high<br />
amplitudes in several surrounding beams— strongest in those closest, but measurable in others.<br />
This is because each steered beam has a beamwidth (as discussed in the section, “Projector<br />
Arrays and Beam Forming,” in Chapter 3). For instance, the beam with axis at θ 7 in Figure<br />
Chapter 4 - -7, receives the echo at θ A close to its axis— near the peak response <strong>of</strong> the beam— so<br />
it generates a strong amplitude. The beam with axis θ 9 receives the same echo farther away from<br />
its axis, generating a weaker amplitude. Far away beams, such as those at θ 2 and θ 12 , do not see<br />
the echo at all.<br />
Figure Chapter 4 - -6: Hydrophone Array at Time t2<br />
Page 4-8 Copyright © 2000 L-3 Communications SeaBeam Instruments<br />
No portion <strong>of</strong> this document may be reproduced without the expressed written permission <strong>of</strong> L-3 Communications SeaBeam Instruments
<strong>Multibeam</strong> <strong>Sonar</strong> <strong>Theory</strong> <strong>of</strong> <strong>Operation</strong> Detection Processing and Range Calculations<br />
Figure Chapter 4 - -7: Time Slice at Time 2 · t 2<br />
Figure Chapter 4 - -8 shows a third situation at time t 3 . The ping front is intersecting the sea floor<br />
at two points, creating echoes from angles θ B and θ C . These echoes will cause two sets <strong>of</strong> beams<br />
to record high amplitudes, as pictured in Figure Chapter 4 - -9.<br />
Figure Chapter 4 - -8: Hydrophone Array at Time t3<br />
Copyright © 2000 L-3 Communications SeaBeam Instruments Page 4-9<br />
No portion <strong>of</strong> this document may be reproduced without the expressed written permission <strong>of</strong> L-3 Communications SeaBeam Instruments
Detection Processing and Range Calculations <strong>Multibeam</strong> <strong>Sonar</strong> <strong>Theory</strong> <strong>of</strong> <strong>Operation</strong><br />
Figure Chapter 4 - -9: Time Slice at Time 2 · t 3<br />
Each time slice the SEA BEAM 2100 records has some variation <strong>of</strong> the situations presented in the<br />
examples above. Time slices always record amplitudes due to noise. In addition, they can have<br />
one, many, or no echoes at all from the sea floor. Echoes from the sea floor cause amplitudes in<br />
several beams, both due to intersection <strong>of</strong> the beams’ main lobes and to side lobes with the echo.<br />
Within a time slice, the true signals need to be separated from the noise and signals due to side<br />
lobes so that the former can be analyzed and the latter ignored. This process, called noise<br />
discrimination, is accomplished by applying a detection threshold to the time slice. A detection<br />
threshold is simply a level above which amplitudes are assumed to be parts <strong>of</strong> signals, and below<br />
which amplitudes are ignored. The level is computed based on the relative strengths <strong>of</strong> side lobes<br />
and the estimated noise levels in the steered beams and it is unique to each time slice. Figure<br />
Chapter 4 - -10 shows a detection threshold applied to the time slice pictured in Figure Chapter 4 -<br />
-9. Amplitude levels above the threshold are processed as signals, while those below the threshold<br />
are ignored (although values below the threshold can be used for sidescan). BDI and WMT have<br />
different ways <strong>of</strong> using the threshold value, as described in the sections that follow.<br />
Figure Chapter 4 - -10: Dynamic Threshold Applied to a Time Slice<br />
Page 4-10 Copyright © 2000 L-3 Communications SeaBeam Instruments<br />
No portion <strong>of</strong> this document may be reproduced without the expressed written permission <strong>of</strong> L-3 Communications SeaBeam Instruments
<strong>Multibeam</strong> <strong>Sonar</strong> <strong>Theory</strong> <strong>of</strong> <strong>Operation</strong> Detection Processing and Range Calculations<br />
Time <strong>of</strong> Arrival (TOA) and Direction <strong>of</strong> Arrival<br />
(DOA) Calculations: BDI and WMT Processing<br />
The complex matrix <strong>of</strong> data pictured in Figure Chapter 4 - -3 must be reduced from amplitude<br />
measurements on a per-time-slice basis where angles are measured relative to the hydrophone<br />
array to a smaller number <strong>of</strong> per-ping measurements from which bathymetry data can be derived.<br />
The SEA BEAM 2100 reduces the matrix to a set <strong>of</strong> echo measurements for a maximum <strong>of</strong> 151<br />
stabilized beams for each ping. The beams are spaced 1 degree apart in the athwartship direction,<br />
and have beam widths <strong>of</strong> 2 degrees. For each beam, two pieces <strong>of</strong> information are derived:<br />
• Echo direction <strong>of</strong> arrival (DOA): the true angle from which the bottom echo detected within<br />
each beam was received, in Earth-centered coordinates.<br />
• Echo time <strong>of</strong> arrival (TOA): the time, relative to the time <strong>of</strong> ping transmission, at which the<br />
echo within a beam was received.<br />
The SEA BEAM 2100 uses two independent algorithms to accomplish this— Bearing Direction<br />
Indicator (BDI) and Weighted Mean Time (WMT). BDI and WMT have different approaches<br />
to analyzing the data— BDI processing tries to accurately locate the DOA <strong>of</strong> an echo within each<br />
beam and then computes the TOA <strong>of</strong> that echo, while WMT fixes the DOA at the center <strong>of</strong> each<br />
beam and attempts to precisely calculate the time <strong>of</strong> arrival. Each <strong>of</strong> these approaches has its<br />
advantages, as explained in the sections that follow.<br />
BDI Processing<br />
BDI processing computes precise directions <strong>of</strong> arrival (DOAs) and times <strong>of</strong> arrival (TOAs) for<br />
echoes within each beam. The primary steps involved in this procedure are the following:<br />
1. High-resolution Angle Estimation: The measurements from all steered beams in each time<br />
slice are combined to determine from which precise angles echoes are being received by the<br />
hydrophone array in that slice.<br />
2. Motion Compensation: Measurements <strong>of</strong> the complex hydrophone array motions due to sea<br />
conditions are used to convert angles measured with respect to the hydrophone array into<br />
angles measured with respect to the Earth. This processing is performed on time slices<br />
individually.<br />
3. Application <strong>of</strong> Start and Stop Gates: Each angle within a time slice is checked against the<br />
operator-specified (manual mode) or system-specified (auto mode) start and stop gates.<br />
Those that are not within the gates are eliminated.<br />
4. DOA and TOA Calculation: All time slices for a ping are combined, and the angles and times<br />
<strong>of</strong> the echoes from each are used to compute mean DOAs and TOAs within each beam.<br />
Copyright © 2000 L-3 Communications SeaBeam Instruments Page 4-11<br />
No portion <strong>of</strong> this document may be reproduced without the expressed written permission <strong>of</strong> L-3 Communications SeaBeam Instruments
Detection Processing and Range Calculations <strong>Multibeam</strong> <strong>Sonar</strong> <strong>Theory</strong> <strong>of</strong> <strong>Operation</strong><br />
High-Resolution Angle Estimation<br />
Within a time slice, the angles at which echoes strike the hydrophones do not necessarily<br />
correspond to the axis angles <strong>of</strong> the steered beams. In fact, because the beams are wide enough<br />
to overlap to some degree, an echo event is actually measured by more than one neighboring<br />
beam. Beams that have axes aimed near the true angle to an echo source measure higher<br />
amplitudes than those aimed farther away. The relative levels <strong>of</strong> these amplitude measurements<br />
can be used to find the true angle to the source with precision. This process is called High-<br />
Resolution Angle Estimation.<br />
An individual time slice may contain zero, one, or many echoes. These three situations are<br />
depicted in Figure Chapter 4 - -5, Figure Chapter 4 - -7, and Figure Chapter 4 - -9. Figure Chapter<br />
4 - -5 shows a time slice that contains no genuine echoes; Figure Chapter 4 - -7 has a single echo<br />
from direction θ A ; and Figure Chapter 4 - -9 has multiple echoes from θ B and θ C . Using the<br />
amplitudes measured at the steered beam angles, you can determine the true angles at which the<br />
echoes are originating— the θ A , θ B , and θ C from the examples above, and amplitudes that measure<br />
the strength <strong>of</strong> the echoes corresponding to those angles.<br />
The first stage in this process is applying the detection threshold that has been computed for this<br />
time slice. All amplitudes below the detection threshold are not considered parts <strong>of</strong> true echoes.<br />
The result <strong>of</strong> a detection threshold application to the time slice from Figure Chapter 4 - -9 is<br />
pictured in Figure Chapter 4 - -10. In the figure, all amplitudes below the detection threshold,<br />
which is represented by the dashed line, are ignored (ignored values are shaded gray). Remaining<br />
are two groups <strong>of</strong> high amplitudes (shaded black).<br />
The amplitudes that emerge from the detection threshold are then processed to determine the true<br />
angles <strong>of</strong> the echoes that caused them. Individual echoes cause high amplitudes in several<br />
neighboring beams, so they occur in groups. Using the strength <strong>of</strong> the amplitudes in each beam,<br />
and knowing what the beam patterns <strong>of</strong> the formed beams look like, you can make a fairly<br />
accurate estimate <strong>of</strong> the true angle to the source causing the echo.<br />
Recall that the beam pattern <strong>of</strong> a hydrophone array can be computed knowing the frequency <strong>of</strong><br />
the sonar and the characteristics <strong>of</strong> the array (number <strong>of</strong> elements, element spacing, and so forth).<br />
An approximation <strong>of</strong> the main lobe <strong>of</strong> the beam pattern is fitted to each group <strong>of</strong> high amplitudes<br />
using a least squares fit process. The location <strong>of</strong> the peak <strong>of</strong> the best fit is taken as the angle to<br />
the true source causing the group <strong>of</strong> high amplitudes. Figure Chapter 4 - -11 shows the fitting<br />
process to the two groups <strong>of</strong> high amplitudes in this example.<br />
Page 4-12 Copyright © 2000 L-3 Communications SeaBeam Instruments<br />
No portion <strong>of</strong> this document may be reproduced without the expressed written permission <strong>of</strong> L-3 Communications SeaBeam Instruments
<strong>Multibeam</strong> <strong>Sonar</strong> <strong>Theory</strong> <strong>of</strong> <strong>Operation</strong> Detection Processing and Range Calculations<br />
Figure Chapter 4 - -11: Parabola Fitting for High-Resolution Angle Estimation<br />
A time slice with no strong echoes might produce no angle estimates, if all measured amplitudes<br />
are below the detection threshold. In these cases, however, the strongest amplitude value and its<br />
associated beam angle are saved for use in the sidescan data processing.<br />
Each angle/amplitude pair that emerges from the angle estimation process is called a hit. A hit is<br />
composed <strong>of</strong> three pieces <strong>of</strong> data: its angle, its amplitude, and the time it occurred (equal to the<br />
time associated with the time slice).<br />
Motion Compensation<br />
The Angle Estimation process produces a list <strong>of</strong> hits including their amplitudes and angles for each<br />
time slice. However, the angles have been measured with respect to the hydrophone array, and<br />
the hydrophone array is mounted on a moving platform, a vessel at sea. Before the reported<br />
echoes can be translated into measurements <strong>of</strong> the sea floor, and before they can be compared<br />
between time slices (the hydrophone array will be in different positions and at different angles in<br />
different time slices), the motions <strong>of</strong> the hydrophone array must be measured and taken into<br />
account. This process is called motion compensation, or beam stabilization.<br />
The motions <strong>of</strong> a ship at sea and the hydrophone mounted to it are highly complex and somewhat<br />
unpredictable. Some <strong>of</strong> these motions are deliberate, such as the ship’s forward progress, or turns.<br />
However, most are due to the effects <strong>of</strong> waves.<br />
All motion <strong>of</strong> a ship can be described by using a point called the center <strong>of</strong> mass. The center <strong>of</strong><br />
mass <strong>of</strong> a ship is exactly that— it is an imaginary point in space that represents the center <strong>of</strong> the<br />
weight distribution <strong>of</strong> the ship. It is also the point about which a ship will rotate if any external<br />
force is applied to it. Around the center <strong>of</strong> mass a three dimensional coordinate system is<br />
constructed (see Figure Chapter 4 - -12). The three coordinates are:<br />
• The x, or acrosstrack direction – This is the direction perpendicular to the ships track and<br />
parallel to the surface <strong>of</strong> the sea.<br />
• The y, or alongtrack direction – This is the direction parallel to the ships direction <strong>of</strong> travel, or<br />
track.<br />
• The z, or vertical direction – This is the direction perpendicular to the surface <strong>of</strong> the sea.<br />
Copyright © 2000 L-3 Communications SeaBeam Instruments Page 4-13<br />
No portion <strong>of</strong> this document may be reproduced without the expressed written permission <strong>of</strong> L-3 Communications SeaBeam Instruments
Detection Processing and Range Calculations <strong>Multibeam</strong> <strong>Sonar</strong> <strong>Theory</strong> <strong>of</strong> <strong>Operation</strong><br />
Figure Chapter 4 - -12: Ship-Motion Coordinate System<br />
A ship at sea experiences translational motion in each <strong>of</strong> these three directions. Fore and aft<br />
motion in the alongtrack direction is called surge. Port and starboard motion in the acrosstrack<br />
direction is called sway. Up and down motion in the vertical direction is called heave.<br />
Page 4-14 Copyright © 2000 L-3 Communications SeaBeam Instruments<br />
No portion <strong>of</strong> this document may be reproduced without the expressed written permission <strong>of</strong> L-3 Communications SeaBeam Instruments
<strong>Multibeam</strong> <strong>Sonar</strong> <strong>Theory</strong> <strong>of</strong> <strong>Operation</strong> Detection Processing and Range Calculations<br />
There are also rotational motions around the axis <strong>of</strong> each <strong>of</strong> these coordinates (see Figure<br />
Chapter 4 - -13):<br />
• Rotation about the x-direction is called pitch.<br />
• Rotation about the y-direction is called roll.<br />
• Rotation about the z-direction is called yaw.<br />
Figure Chapter 4 - -13: Rotations about the Ship Center <strong>of</strong> Mass<br />
Copyright © 2000 L-3 Communications SeaBeam Instruments Page 4-15<br />
No portion <strong>of</strong> this document may be reproduced without the expressed written permission <strong>of</strong> L-3 Communications SeaBeam Instruments
Detection Processing and Range Calculations <strong>Multibeam</strong> <strong>Sonar</strong> <strong>Theory</strong> <strong>of</strong> <strong>Operation</strong><br />
The effect <strong>of</strong> rotation about each <strong>of</strong> these directions is illustrated in Figure Chapter 4 - -14. The<br />
degree <strong>of</strong> rotation is measured as an angle.<br />
Figure Chapter 4 - -14: Roll, Pitch, and Yaw Angles<br />
Between time slices, the ship moves in each <strong>of</strong> these six different ways: surge, sway, and heave<br />
<strong>of</strong> its center <strong>of</strong> mass, and roll, pitch, and yaw about its center <strong>of</strong> mass. In other words, the ship has<br />
six degrees <strong>of</strong> freedom to its motion. The SEA BEAM 2100 accepts input from two<br />
measurement systems that constantly monitor all six degrees <strong>of</strong> freedom:<br />
• The Navigation instrument records the position <strong>of</strong> the ship (latitude, longitude, and heading at<br />
time <strong>of</strong> ping) associated with surge, sway, and yaw motions.<br />
• The Vertical Reference Unit (VRU) records roll, pitch, and heave information.<br />
Of these instrument readings, the roll and pitch values from the VRU are necessary for per-timeslice<br />
processing. The VRU, however, does not make measurements with the frequency <strong>of</strong> the<br />
time slices. Obtaining unique and accurate values that correspond to the times <strong>of</strong> the time slices<br />
requires linear interpolations from the two nearest VRU measurements.<br />
Page 4-16 Copyright © 2000 L-3 Communications SeaBeam Instruments<br />
No portion <strong>of</strong> this document may be reproduced without the expressed written permission <strong>of</strong> L-3 Communications SeaBeam Instruments
<strong>Multibeam</strong> <strong>Sonar</strong> <strong>Theory</strong> <strong>of</strong> <strong>Operation</strong> Detection Processing and Range Calculations<br />
BDI processing adjusts the hits in each time slice for the appropriate roll value (compensation for<br />
other motions is done elsewhere in the processing). It also takes into account two additional angles<br />
in the same direction as roll— the mounting angle <strong>of</strong> the hydrophone array (measured such that<br />
horizontal is zero) and the roll bias <strong>of</strong> the sonar installation. The roll bias angle is found through a<br />
calibration process that should be performed periodically on the SEA BEAM 2100 (see Chapter 8<br />
in the SEA BEAM 2100 Operator’s Manual). Together, these three values form a roll <strong>of</strong>fset<br />
angle, θ R . Each hit in a time slice can be converted from the coordinate system <strong>of</strong> the hydrophone<br />
array to the Earth-centered coordinate system by adding θ R to its measured angle. This process is<br />
illustrated in Figure Chapter 4 - -15.<br />
Figure Chapter 4 - -15: Adjusting Measured Angles for Roll<br />
Application <strong>of</strong> the Start and Stop Gates<br />
The SEA BEAM 2100 allows the operator (either manually or automatically) to choose a set <strong>of</strong><br />
start gates and stop gates. While the system operator sees the start and stop gates as a tracker<br />
<strong>of</strong> depth on screen, internally they are specified in terms <strong>of</strong> beam angle and time. For a particular<br />
angle, the start gate tells the SEA BEAM 2100 that all hits which occur before it at that angle<br />
should be ignored. The stop gate specifies that all hits which occur after it should be ignored. Only<br />
hits that occur in the time between the start and stop gates are retained.<br />
Within a single time slice, there will be ranges <strong>of</strong> angles at which a hit should be retained, and at<br />
which a hit should be ignored. The gates are applied to all time slices, and all hits that fall outside<br />
the start and stop gates for their respective angles are discarded.<br />
Copyright © 2000 L-3 Communications SeaBeam Instruments Page 4-17<br />
No portion <strong>of</strong> this document may be reproduced without the expressed written permission <strong>of</strong> L-3 Communications SeaBeam Instruments
Detection Processing and Range Calculations <strong>Multibeam</strong> <strong>Sonar</strong> <strong>Theory</strong> <strong>of</strong> <strong>Operation</strong><br />
Direction <strong>of</strong> Arrival (DOA) and Time <strong>of</strong> Arrival (TOA) Calculations<br />
All remaining hits from a ping cycle are then compiled. Recall that each hit has three pieces <strong>of</strong><br />
information associated with it— its amplitude, its angle in the Earth-centered coordinate system,<br />
and the time at which it occurred. In Figure Chapter 4 - -16 dots are plotted to represent each <strong>of</strong><br />
the hits in a ping cycle. Each hit is located on the plot based on its angle θ H and time t H (the<br />
amplitude <strong>of</strong> each hit is not represented in the figure). The bulk <strong>of</strong> the hits are located in the same<br />
area, forming a “cloud,” which represents the pr<strong>of</strong>ile <strong>of</strong> the sea floor.<br />
Figure Chapter 4 - -16: Hits Plotted Based on Angle and Time<br />
This plot can be divided up into areas that correspond to the predefined beams <strong>of</strong> the SEA BEAM<br />
2100. Each beam is centered on an integer degree and has a width <strong>of</strong> 2 degrees. There are up to<br />
151 beams. In Figure Chapter 4 - -17, a sample beam is plotted with axis angle θ B . Within its 2degree<br />
beamwidth, this sample beam contains a number <strong>of</strong> hits (drawn as black dots) that is a<br />
subset <strong>of</strong> all <strong>of</strong> the hits (drawn as gray dots). The SEA BEAM 2100 uses the enclosed subset <strong>of</strong><br />
hits within each beam to calculate a mean DOA, TOA, and amplitude corresponding to that beam.<br />
Page 4-18 Copyright © 2000 L-3 Communications SeaBeam Instruments<br />
No portion <strong>of</strong> this document may be reproduced without the expressed written permission <strong>of</strong> L-3 Communications SeaBeam Instruments
<strong>Multibeam</strong> <strong>Sonar</strong> <strong>Theory</strong> <strong>of</strong> <strong>Operation</strong> Detection Processing and Range Calculations<br />
Figure Chapter 4 - -17: Sample Predefined Beam Encompassing a Subset <strong>of</strong> Hits<br />
This process has two steps:<br />
1. A mean and standard deviation <strong>of</strong> the TOAs <strong>of</strong> all enclosed hits is computed. These are used<br />
to compute a statistical “envelope” in time, centered at the mean time t MEAN with a width twice<br />
that <strong>of</strong> the standard deviation t σ (see Figure Chapter 4 - -18). Hits within the beam that fall<br />
outside this envelope are discarded.<br />
Copyright © 2000 L-3 Communications SeaBeam Instruments Page 4-19<br />
No portion <strong>of</strong> this document may be reproduced without the expressed written permission <strong>of</strong> L-3 Communications SeaBeam Instruments
Detection Processing and Range Calculations <strong>Multibeam</strong> <strong>Sonar</strong> <strong>Theory</strong> <strong>of</strong> <strong>Operation</strong><br />
Figure Chapter 4 - -18: Hit Envelope Calculation Within a Beam<br />
2. The amplitude-weighted mean TOA and DOA are computed from the times and angles <strong>of</strong> all<br />
remaining hits. These values are then used as the TOA and DOA for the beam (see<br />
Figure Chapter 4 - -19). The amplitude <strong>of</strong> the beam is computed by a simple mean.<br />
Figure Chapter 4 - -19: Amplitude-Weighted TOA and DOA<br />
Page 4-20 Copyright © 2000 L-3 Communications SeaBeam Instruments<br />
No portion <strong>of</strong> this document may be reproduced without the expressed written permission <strong>of</strong> L-3 Communications SeaBeam Instruments
<strong>Multibeam</strong> <strong>Sonar</strong> <strong>Theory</strong> <strong>of</strong> <strong>Operation</strong> Detection Processing and Range Calculations<br />
For each <strong>of</strong> up to 151 beams, TOA, DOA, and beam amplitude values are calculated. Note that<br />
the final DOA need not coincide with beam axis.<br />
WMT Processing<br />
In contrast to BDI, Weighted Mean Time (WMT) processing begins by defining a set <strong>of</strong> beam<br />
angles (or DOAs) in the Earth-centered coordinate system and then computes the precise TOA<br />
<strong>of</strong> the echoes from those angles. In the case <strong>of</strong> the SEA BEAM 2100, up to 151 such angles are<br />
defined, positioned one degree apart at integer degree values -75°, -74°,...-1°, 0°, 1°, ...74°, 75°<br />
(that is, at the axis <strong>of</strong> the beams used in BDI processing). Each defined DOA angle is called a<br />
beam.<br />
The processing required for each beam is identical and independent <strong>of</strong> all <strong>of</strong> the other beams.<br />
WMT can be described by following the processing <strong>of</strong> only a single beam, which is called θ B . It<br />
should be remembered that this procedure is repeated for each <strong>of</strong> the other beams as well.<br />
Interpolating Amplitudes for Each Time Slice<br />
The first stages <strong>of</strong> WMT processing are done on each time slice <strong>of</strong> raw steered beam data<br />
individually. Recall that a time slice <strong>of</strong> steered beam data has N measurements <strong>of</strong> amplitude<br />
A 1 - A N at angles θ 1 - θ N . There is also a threshold value Ts, which was computed using the<br />
processes described in the section on Dynamic Thresholding. Beginning with a defined beam<br />
angle θ B , each <strong>of</strong> the angles can be adjusted in the time slice for roll θ R (where θ R contains all roll<br />
factors: roll bias, mounting angle, and time-dependent roll – see Motion Compensation), and find<br />
the two closest, θ n and θ n+1 on either side <strong>of</strong> θ B (see Figure Chapter 4 - -20). Note that the values<br />
<strong>of</strong> n and n + 1 will be different for each time slice, because there will be different roll values θ R<br />
for each time slice.<br />
Copyright © 2000 L-3 Communications SeaBeam Instruments Page 4-21<br />
No portion <strong>of</strong> this document may be reproduced without the expressed written permission <strong>of</strong> L-3 Communications SeaBeam Instruments
Detection Processing and Range Calculations <strong>Multibeam</strong> <strong>Sonar</strong> <strong>Theory</strong> <strong>of</strong> <strong>Operation</strong><br />
Figure Chapter 4 - -20: Finding the Roll-Adjusted Angles Nearest the Beam Angle<br />
Both θ n and θ n+1 have amplitude values associated with them, A n and A n+1 . They will also have<br />
complex beam patterns, which tell you their response to echoes as a function <strong>of</strong> angle from their<br />
axis (see Figure Chapter 4 - -21). For each <strong>of</strong> these two beams, you can calculate a relative<br />
“weight” based on the response level <strong>of</strong> their beam pattern at the angle between them and θ B (θ B -<br />
θ n , or θ n+1 - θ B ). From their amplitudes A n and A n+1 and these computed weights, you can<br />
interpolate a new amplitude A B , which is the amplitude <strong>of</strong> the echo received from direction θ B .<br />
Thus, you are obtaining the echo returns in a beam whose axis is always fixed with reference to<br />
earth. This processing is repeated for each time slice.<br />
Page 4-22 Copyright © 2000 L-3 Communications SeaBeam Instruments<br />
No portion <strong>of</strong> this document may be reproduced without the expressed written permission <strong>of</strong> L-3 Communications SeaBeam Instruments
<strong>Multibeam</strong> <strong>Sonar</strong> <strong>Theory</strong> <strong>of</strong> <strong>Operation</strong> Detection Processing and Range Calculations<br />
Figure Chapter 4 - -21: Beam Patterns <strong>of</strong> the Nearest Steered Beams<br />
Amplitude-Weighted Time <strong>of</strong> Arrival (TOA) Computation<br />
The amplitudes <strong>of</strong> the echoes A B associated with each time slice are collected and ordered<br />
sequentially in time. Since there are many time slices per ping, the collection can be quite large.<br />
The sequence <strong>of</strong> amplitudes represents a record <strong>of</strong> the echoes received from θ B during the ping<br />
cycle, including noise events, true bottom echoes, and reverberation events. A collection <strong>of</strong><br />
amplitudes A B for beam angle θ B is represented schematically in Figure Chapter 4 - -22.<br />
Copyright © 2000 L-3 Communications SeaBeam Instruments Page 4-23<br />
No portion <strong>of</strong> this document may be reproduced without the expressed written permission <strong>of</strong> L-3 Communications SeaBeam Instruments
Detection Processing and Range Calculations <strong>Multibeam</strong> <strong>Sonar</strong> <strong>Theory</strong> <strong>of</strong> <strong>Operation</strong><br />
Figure Chapter 4 - -22: Interpolated Amplitudes for a Single Beam in All Time Slices<br />
Time sequences such as this can be examined by the operator if the beam with angle θ B is the<br />
selected beam. The selected beam, which is chosen from the SEA BEAM 2100 menu (see<br />
Chapter 9 <strong>of</strong> the SEA BEAM 2100 Operator’s Manual), corresponds to one <strong>of</strong> the beam angles<br />
used in WMT processing. The sequence <strong>of</strong> amplitudes <strong>of</strong> the selected beam is represented on a<br />
logarithmic scale. It allows the operator to examine the “cleanliness” <strong>of</strong> acoustic returns— if<br />
beams contain well-defined bottom echoes, if there is much noise present, if there is are<br />
secondary echoes, and so forth.<br />
For each beam, an associated start gate and stop gate are specified as times (either by the<br />
SEA BEAM 2100 operator or computed automatically). Essentially, the start gate tells the<br />
SEA BEAM 2100 to only process time slices that occur after it, and the stop gate tells it to only<br />
process time slices that occur before it. All other time slices are ignored when computing WMT<br />
TOAs. In Figure Chapter 4 - -23 start and stop gates are applied to the sequence <strong>of</strong> echo events<br />
for the beam angle θ B .<br />
Figure Chapter 4 - -23: Eliminating Time Slices Outside the Gates<br />
Page 4-24 Copyright © 2000 L-3 Communications SeaBeam Instruments<br />
No portion <strong>of</strong> this document may be reproduced without the expressed written permission <strong>of</strong> L-3 Communications SeaBeam Instruments
<strong>Multibeam</strong> <strong>Sonar</strong> <strong>Theory</strong> <strong>of</strong> <strong>Operation</strong> Detection Processing and Range Calculations<br />
Recall that for each time slice, there was a threshold value T S computed in the Dynamic Threshold<br />
Processing. In Figure Chapter 4 - -24, the values <strong>of</strong> T S associated with each time slice are plotted.<br />
For some time slices, the amplitude A B falls below the threshold. In these cases the time slice is<br />
ignored.<br />
Figure Chapter 4 - -24: Eliminating Amplitudes Below the Dynamic Threshold<br />
The remaining sequence <strong>of</strong> amplitudes contains only those time slices between the start and stop<br />
gates that have amplitudes above their associated thresholds. From this, a TOA is computed for<br />
the echo in each beam. The TOA is found using an amplitude-weighted average <strong>of</strong> the times <strong>of</strong><br />
time slices that are between the gates and that have amplitudes above the thresholds. TOAs are<br />
computed for up to 151 beams in WMT processing.<br />
Choosing between BDI and WMT Data<br />
The BDI and WMT processes both produce DOA and TOA calculations for each <strong>of</strong> up to 151<br />
beams in the swath for each ping. The final stage <strong>of</strong> processing is to convert these records into<br />
true bathymetry data— depth measurements and corresponding positions in terms <strong>of</strong> longitudes<br />
and latitudes. Before doing so, the SEA BEAM 2100 must determine which <strong>of</strong> the results from<br />
the two processes to use for producing the final product.<br />
Both BDI and WMT have regimes in which they are likely to produce better estimations <strong>of</strong><br />
echoes. Figure Chapter 4 - -25 and Figure Chapter 4 - -26 consider two situations. Figure Chapter<br />
4 - -25 shows what is called the specular regime, where a sonar is looking in a direction<br />
perpendicular to the sea floor.<br />
Figure Chapter 4 - -26 shows the non-specular regime, where a sonar is looking at a shallow<br />
grazing angle to the sea floor. Both situations consider a single beam <strong>of</strong> a multibeam sonar, which<br />
has some beam width such that it is sensitive to echoes from an area on the sea floor.<br />
Copyright © 2000 L-3 Communications SeaBeam Instruments Page 4-25<br />
No portion <strong>of</strong> this document may be reproduced without the expressed written permission <strong>of</strong> L-3 Communications SeaBeam Instruments
Detection Processing and Range Calculations <strong>Multibeam</strong> <strong>Sonar</strong> <strong>Theory</strong> <strong>of</strong> <strong>Operation</strong><br />
Figure Chapter 4 - -25: Specular Regime: <strong>Sonar</strong> Perpendicular to the Sea Floor<br />
Figure Chapter 4 - -26: Non-Specular Regime: <strong>Sonar</strong> at an Angle to the Sea Floor<br />
In the specular situation depicted in Figure Chapter 4 - -25, the spherical ping front from a sonar is<br />
almost parallel to the bottom and will simultaneously strike the bottom along a wide area. Within a<br />
sonar beam, the ping will produce a strong echo with a very short duration. An amplitude versus<br />
time plot <strong>of</strong> this event is pictured in Figure Chapter 4 - -27. On the other hand, a ping front in the<br />
non-specular situation depicted in Figure Chapter 4 - -26 will strike a small portion <strong>of</strong> the sea floor<br />
at a time and be in contact with the bottom for a long time as it propagates. Its echo will be weak<br />
in amplitude but long in duration as depicted in Figure Chapter 4 - -28.<br />
Page 4-26 Copyright © 2000 L-3 Communications SeaBeam Instruments<br />
No portion <strong>of</strong> this document may be reproduced without the expressed written permission <strong>of</strong> L-3 Communications SeaBeam Instruments
<strong>Multibeam</strong> <strong>Sonar</strong> <strong>Theory</strong> <strong>of</strong> <strong>Operation</strong> Detection Processing and Range Calculations<br />
Figure Chapter 4 - -27: Amplitude versus Time Plot <strong>of</strong> the Echo Event in the Specular<br />
Regime<br />
Figure Chapter 4 - -28: Amplitude versus Time Plot <strong>of</strong> the Echo Event in the Nonspecular<br />
Regime<br />
Recall that WMT processing holds fixed the angle <strong>of</strong> an echo within a beam (at the axis <strong>of</strong> the<br />
beam) and computes its TOA by amplitude weighted average. BDI, on the other hand, attempts to<br />
accurately fix the angle <strong>of</strong> an echo within the beam and calculate the TOA for it. You can see by<br />
looking at Figure Chapter 4 - -25 that finding an accurate angle in the specular case is not an easy<br />
task. Because the echo from all angles within the entire area observed by a beam arrive at the<br />
same time, there is little angle-specific information to work with. In this case, BDI computations<br />
would be unreliable. However, because the echo has such a short duration (see Figure Chapter 4 -<br />
-27), a precise calculation <strong>of</strong> its arrival time can be made using WMT processing. In the nonspecular<br />
situation, accurate angle calculations can be made because the echoes from different<br />
angles within a beam are spread out over time. BDI processing produces good results in this<br />
situation. WMT processing, in contrast, would have difficulty accurately locating the time <strong>of</strong> an<br />
echo by amplitude-weighted mean, because the echo would have such a long duration with a<br />
poorly-defined amplitude peak (see Figure Chapter 4 - -28).<br />
Copyright © 2000 L-3 Communications SeaBeam Instruments Page 4-27<br />
No portion <strong>of</strong> this document may be reproduced without the expressed written permission <strong>of</strong> L-3 Communications SeaBeam Instruments
Detection Processing and Range Calculations <strong>Multibeam</strong> <strong>Sonar</strong> <strong>Theory</strong> <strong>of</strong> <strong>Operation</strong><br />
Because BDI results generate more accurate DOA information, the SEA BEAM 2100 system<br />
attempts to use them where possible. This is mostly in the non-specular regions, generally in the<br />
“outer” beams that are at large angles from the vertical (although you could imagine situations<br />
where the non-specular region would be directly below the survey ship, depending on the bottom<br />
configuration – see Figure Chapter 4 - -29). Where BDI calculations produce no results, WMT<br />
processing is used.<br />
Figure Chapter 4 - -29: Specular and Non-specular Regimes with Different Sea Floors<br />
Range Calculation and Bottom Location<br />
The final stage in bathymetry processing is to convert echo DOA and TOA measurements into<br />
depths and positions. In doing so, the complications introduced by the pitch <strong>of</strong> the survey vessel at<br />
the time <strong>of</strong> the ping and changes in the velocity <strong>of</strong> sound at different ocean depths must be taken<br />
into account.<br />
Consider a survey ship transmitting a single ping. At the time <strong>of</strong> transmission, the ship will have a<br />
pitch angle, which is recorded by the VRU system (see the “Motion Compensation” section<br />
above). Recall from the section, “Beam Formation,” in Chapter 2, that the SEA BEAM 2100<br />
transmits a fan-shaped beam, narrow in the alongtrack direction, but wide in the acrosstrack<br />
direction. This beam illuminates a strip <strong>of</strong> the ocean floor, ideally directly below the survey ship in<br />
a dead calm sea. However, because the ship will have a pitch angle at the time a ping is<br />
transmitted, the area ensonified by the ping will be <strong>of</strong>fset in the alongtrack direction by the pitch<br />
angle (see Figure Chapter 4 - -30).<br />
Page 4-28 Copyright © 2000 L-3 Communications SeaBeam Instruments<br />
No portion <strong>of</strong> this document may be reproduced without the expressed written permission <strong>of</strong> L-3 Communications SeaBeam Instruments
<strong>Multibeam</strong> <strong>Sonar</strong> <strong>Theory</strong> <strong>of</strong> <strong>Operation</strong> Detection Processing and Range Calculations<br />
Figure Chapter 4 - -30: Offset <strong>of</strong> Ping Illumination Due to Pitch<br />
Next, look at the echo from a single beam, which has an angle and TOA measurement from the<br />
WMT and BDI calculations. Recall from the “Beam Steering” section in Chapter 2 that the<br />
SEA BEAM 2100 beam is fan-shaped, narrow in the acrosstrack direction, but wide in the<br />
alongtrack direction. It observes echoes from a long, narrow strip <strong>of</strong> the ocean floor, but only sees<br />
echoes from transmitted pings in the small area where this strip intersects the area illuminated by<br />
the ping (see Figure Chapter 4 - -31). This position will have an <strong>of</strong>fset in the along-track direction<br />
given by the pitch angle, and an <strong>of</strong>fset in the across-track direction given by the beam DOAs. The<br />
angle between the across-track direction and the direction to the position <strong>of</strong> the echo is called the<br />
bearing angle. The angle between the vertical and the echo position (as seen by the ship) is<br />
called the launch angle. Both the bearing angle and the launch angle can be determined from the<br />
pitch and beam angles.<br />
Copyright © 2000 L-3 Communications SeaBeam Instruments Page 4-29<br />
No portion <strong>of</strong> this document may be reproduced without the expressed written permission <strong>of</strong> L-3 Communications SeaBeam Instruments
Detection Processing and Range Calculations <strong>Multibeam</strong> <strong>Sonar</strong> <strong>Theory</strong> <strong>of</strong> <strong>Operation</strong><br />
Figure Chapter 4 - -31: Position <strong>of</strong> the Echo in a Single Beam<br />
The launch angle represents the angle at which an echo was received by the survey ship. The<br />
TOA <strong>of</strong> the echo represents the time it took the ping to travel to the position <strong>of</strong> the echo and back<br />
to the ship. Using these two values, you can compute the exact location <strong>of</strong> the echo in latitude and<br />
longitude and depth if you know the sound velocity characteristics <strong>of</strong> the ocean between the<br />
surface and the bottom.<br />
Sound Velocity and Ray Tracing<br />
The sound velocity characteristics <strong>of</strong> a typical ocean environment are very complex. Sound<br />
velocity in water depends on the salt content (or salinity) <strong>of</strong> the water, its pressure, and<br />
temperature. While salinity is a fairly stable quantity throughout the oceans, and changes in water<br />
pressure with depth follow well-understood laws, the temperature <strong>of</strong> ocean water can change<br />
from place to place, between different depths in the same place, and even vary from day to day.<br />
The most accurate bathymetry results only from a sonar system which has up-to-date information<br />
about the changes <strong>of</strong> the sound velocity as a function <strong>of</strong> depth (called the sound velocity pr<strong>of</strong>ile)<br />
for the area in which it is operating.<br />
Page 4-30 Copyright © 2000 L-3 Communications SeaBeam Instruments<br />
No portion <strong>of</strong> this document may be reproduced without the expressed written permission <strong>of</strong> L-3 Communications SeaBeam Instruments
<strong>Multibeam</strong> <strong>Sonar</strong> <strong>Theory</strong> <strong>of</strong> <strong>Operation</strong> Detection Processing and Range Calculations<br />
The sound velocity pr<strong>of</strong>ile <strong>of</strong> an area <strong>of</strong> ocean can be approximated by a set <strong>of</strong> layers, each with a<br />
different sound velocity. Sound traveling through different layers moves at different speeds. In<br />
addition, when changing from one layer to another, the direction <strong>of</strong> the sound changes. When<br />
traveling from a region <strong>of</strong> high sound velocity to one <strong>of</strong> lower sound velocity, a sound wave bends<br />
toward the vertical. When traveling from low to high speed regions, it bends away from the<br />
vertical. If you start with the launch angle and TOA <strong>of</strong> an echo, you can follow the path an the<br />
echo must have taken from the bottom, changing its angle based on the sound velocity pr<strong>of</strong>ile (see<br />
Figure Chapter 4 - -32). Within each layer, you subtract the amount <strong>of</strong> time it would take the echo<br />
to travel through the layer at the appropriate angle (twice— once down, once back) from the<br />
TOA. Eventually, you are going to run out <strong>of</strong> time, yielding the location <strong>of</strong> the true echo. This<br />
process is called ray tracing. Using the location <strong>of</strong> the true echo, you can get the true depth to<br />
the echo, and the bearing <strong>of</strong>fset— the distance between it and the position directly below the<br />
sonar. Combining the bearing angle (see Figure Chapter 4 - -31) and the navigation information <strong>of</strong><br />
the survey ship with the bearing <strong>of</strong>fset will give the exact longitude and latitude <strong>of</strong> the echo<br />
position.<br />
Figure Chapter 4 - -32: Ray Tracing to Find the Bottom<br />
The SEA BEAM 2100 system uses a sound velocity pr<strong>of</strong>ile with up to 29 layers <strong>of</strong> different sound<br />
velocity, which are described by 30 depth/sound velocity value pairs entered by the operator. Ray<br />
tracing is performed for each <strong>of</strong> the echoes reported by the BDI and/or WMT processing, yielding<br />
up the 151 echo depths and locations for each ping. This process makes the assumption that the<br />
velocity gradient is linear. Interested readers can refer to Acoustical Oceanography by Clarence<br />
S. Clay and Herman Medwin: John Wiley & Sons, 1977.<br />
Copyright © 2000 L-3 Communications SeaBeam Instruments Page 4-31<br />
No portion <strong>of</strong> this document may be reproduced without the expressed written permission <strong>of</strong> L-3 Communications SeaBeam Instruments
Detection Processing and Range Calculations <strong>Multibeam</strong> <strong>Sonar</strong> <strong>Theory</strong> <strong>of</strong> <strong>Operation</strong><br />
Page 4-32 Copyright © 2000 L-3 Communications SeaBeam Instruments<br />
No portion <strong>of</strong> this document may be reproduced without the expressed written permission <strong>of</strong> L-3 Communications SeaBeam Instruments
<strong>Multibeam</strong> <strong>Sonar</strong> <strong>Theory</strong> <strong>of</strong> <strong>Operation</strong> Sidescan <strong>Sonar</strong><br />
Chapter 5 - Sidescan <strong>Sonar</strong><br />
Previous chapters in this document presented sonar as a tool for finding water depths using the<br />
time delays <strong>of</strong> acoustic echoes. Yet this is only one function <strong>of</strong> sonar and only one <strong>of</strong> the two<br />
ways sonar is employed in the SEA BEAM 2100 system. The other way in which the<br />
SEA BEAM 2100 may be used is as a sidescan sonar. This section provides a description <strong>of</strong><br />
sidescan sonar— how it works and what it is used for. It includes a detailed description <strong>of</strong> the<br />
SEA BEAM 2100 sidescan sonar system including an examination <strong>of</strong> the methods used for<br />
collecting and processing data.<br />
Understanding Sidescan <strong>Sonar</strong><br />
Instead <strong>of</strong> measuring the depth to the ocean bottom, a sidescan sonar reveals information about<br />
sea floor composition by taking advantage <strong>of</strong> the different sound absorbing and reflecting<br />
characteristics <strong>of</strong> different materials. Some types <strong>of</strong> material, such as metals or recently extruded<br />
volcanic rock, are very efficient at reflecting acoustic pulses. Clay and silt, on the other hand, do<br />
not reflect sound well. Strong reflectors create strong echoes, while weak reflectors create<br />
weaker echoes. Knowing these characteristics, you can use the strength <strong>of</strong> acoustic returns to<br />
examine the composition <strong>of</strong> the sea floor. Reporting the strength <strong>of</strong> echoes is essentially what a<br />
sidescan sonar is designed to do.<br />
Combining bottom-composition information provided by a sidescan sonar with the depth<br />
information from a range-finding sonar can be a powerful tool for examining the characteristics <strong>of</strong><br />
an ocean bottom. Figure Chapter 5 - -1 shows an example <strong>of</strong> such a combination <strong>of</strong> data types.<br />
The seafloor canyon that was mapped in bathymetry in Figure 1-1 is shown mapped in sidescan.<br />
The bathymetry map clearly shows the shape <strong>of</strong> the canyon, while the sidescan indicates that the<br />
material forming the floor <strong>of</strong> the canyon, which is highly reflective, is different from that <strong>of</strong> the<br />
canyon walls and from the surrounding sea floor.<br />
Copyright © 2000 L-3 Communications SeaBeam Instruments Page 5-1<br />
No portion <strong>of</strong> this document may be reproduced without the expressed written permission <strong>of</strong> L-3 Communications SeaBeam Instruments
Sidescan <strong>Sonar</strong> <strong>Multibeam</strong> <strong>Sonar</strong> <strong>Theory</strong> <strong>of</strong> <strong>Operation</strong><br />
Figure Chapter 5 - -1: Example <strong>of</strong> Sidescan Mapping<br />
How Sidescan <strong>Sonar</strong> Works<br />
Sidescan sonar employs much <strong>of</strong> the same hardware and processes as a conventional depthsounding<br />
sonar. Pulses are transmitted by a transmitter using a projector (or array <strong>of</strong> projectors),<br />
and hydrophones receive echoes <strong>of</strong> those pulses from the ocean floor and pass them to a receiver<br />
system. Where sidescan sonar differs from a depth-sounding system is in the way it processes<br />
these returns.<br />
Page 5-2 Copyright © 2000 L-3 Communications SeaBeam Instruments<br />
No portion <strong>of</strong> this document may be reproduced without the expressed written permission <strong>of</strong> L-3 Communications SeaBeam Instruments
<strong>Multibeam</strong> <strong>Sonar</strong> <strong>Theory</strong> <strong>of</strong> <strong>Operation</strong> Sidescan <strong>Sonar</strong><br />
To explain the processing <strong>of</strong> a sidescan sonar, recall the description <strong>of</strong> a simple, single-beam echo<br />
sounding system in Chapter 2, “<strong>Sonar</strong> Concepts“ (see Figure Chapter 5 - -2). To briefly review,<br />
the transmitter <strong>of</strong> the single-beam echo sounder produces an acoustic pulse, or ping, which is<br />
transferred into the water by the projector. The ping expands as a spherical wave from its source,<br />
striking the sea floor at the point closest to the projector source. The ping is then reflected in a<br />
return spherical wave, part <strong>of</strong> which is detected by the hydrophone. The receiver records the<br />
returned echo, which can be illustrated by a plot <strong>of</strong> amplitude as a function <strong>of</strong> time (see<br />
Figure Chapter 5 - -3). The time between the transmission <strong>of</strong> the ping and the reception <strong>of</strong> its<br />
echo is used to compute the range to the sea floor.<br />
Figure Chapter 5 - -2: Single-Beam Echo Sounding System<br />
Copyright © 2000 L-3 Communications SeaBeam Instruments Page 5-3<br />
No portion <strong>of</strong> this document may be reproduced without the expressed written permission <strong>of</strong> L-3 Communications SeaBeam Instruments
Sidescan <strong>Sonar</strong> <strong>Multibeam</strong> <strong>Sonar</strong> <strong>Theory</strong> <strong>of</strong> <strong>Operation</strong><br />
Figure Chapter 5 - -3: Plot <strong>of</strong> Amplitude as a Function <strong>of</strong> Time<br />
This simplified picture does not consider what happens to the transmitted pulse after it first strikes<br />
the bottom, because a single-beam echo sounder is only interested in the time between<br />
transmission and the earliest return echo. Yet to a sidescan sonar, the first returned echo only<br />
marks when things start to get interesting. Look at what happens to the transmitted pulse as it<br />
continues its spherical propagation.<br />
Figure Chapter 5 - -4 shows the single-beam echo sounder schematic at a time shortly after the<br />
ping first intersected with the bottom. At this time, the first return echo is on its way back to the<br />
hydrophones. But the ping is still expanding, and in our schematic is intersecting the bottom at two<br />
points. These points also create echoes. They are weaker than the first return (remember, as the<br />
spherical pulse expands and propagates, it loses power), and they occur after it does (because it<br />
took the ping longer to get to them). It is easy to see that as the pulse front continues to propagate,<br />
it will produce a continuous series <strong>of</strong> weakening echoes in time. If the receiver continues to collect<br />
these echoes, it will see a amplitude versus time sequence similar to the one pictured in Figure<br />
Chapter 5 - -5, with a strong first bottom echo followed by a declining slope <strong>of</strong> continuous returns.<br />
Page 5-4 Copyright © 2000 L-3 Communications SeaBeam Instruments<br />
No portion <strong>of</strong> this document may be reproduced without the expressed written permission <strong>of</strong> L-3 Communications SeaBeam Instruments
<strong>Multibeam</strong> <strong>Sonar</strong> <strong>Theory</strong> <strong>of</strong> <strong>Operation</strong> Sidescan <strong>Sonar</strong><br />
Figure Chapter 5 - -4: Single-Beam Echo Sounder Schematic<br />
Figure Chapter 5 - -5: Amplitude Versus Time Sequence<br />
Thus far, this discussion has ignored the characteristics <strong>of</strong> the ocean bottom. Although unstated,<br />
the assumption to this point has been that the bottom is perfectly flat and perfectly uniform.<br />
Consider now what happens when some detail is added to the ocean bottom. Figure Chapter 5 - -6<br />
redraws the schematic (shown in Figure Chapter 5 - -4) with a spherical pulse front some time<br />
after the first bottom echo. In this case, however, a box represents detail on the bottom. This box<br />
is more efficient at reflecting acoustic energy than the surrounding uniform bottom. Because <strong>of</strong><br />
this, the energy <strong>of</strong> its echo is slightly higher than that <strong>of</strong> the surrounding bottom, which causes a<br />
small jump in the amplitude measured by the receiver at the time <strong>of</strong> its return. An observer looking<br />
at the amplitude versus time sequence in Figure Chapter 5 - -7 would be able to discern from this<br />
jump that some discrete feature exists on the bottom.<br />
Copyright © 2000 L-3 Communications SeaBeam Instruments Page 5-5<br />
No portion <strong>of</strong> this document may be reproduced without the expressed written permission <strong>of</strong> L-3 Communications SeaBeam Instruments
Sidescan <strong>Sonar</strong> <strong>Multibeam</strong> <strong>Sonar</strong> <strong>Theory</strong> <strong>of</strong> <strong>Operation</strong><br />
Figure Chapter 5 - -6: Schematic with a Spherical Pulse Front with a Detailed Bottom<br />
Figure Chapter 5 - -7: Amplitude Versus Time Sequence<br />
In reality, <strong>of</strong> course, ocean bottoms can be very complex. They may be composed <strong>of</strong> many<br />
different components, all with different acoustic reflection characteristics. True amplitude versus<br />
time sequences observed by receivers are similarly complex.<br />
Page 5-6 Copyright © 2000 L-3 Communications SeaBeam Instruments<br />
No portion <strong>of</strong> this document may be reproduced without the expressed written permission <strong>of</strong> L-3 Communications SeaBeam Instruments
<strong>Multibeam</strong> <strong>Sonar</strong> <strong>Theory</strong> <strong>of</strong> <strong>Operation</strong> Sidescan <strong>Sonar</strong><br />
A Basic Sidescan <strong>Sonar</strong><br />
As a practical instrument, the simplistic sidescan sonar described above is not very useful. While it<br />
provides the times <strong>of</strong> echoes, it does not provide their direction. Returning to the example<br />
presented in Figure Chapter 5 - -6 and Figure Chapter 5 - -7, the sidescan sonar detects a bottom<br />
feature (the box). From the amplitude versus time plot in Figure Chapter 5 - -7, an observer can<br />
tell there is a highly reflective feature on the bottom. From the time difference between the first<br />
echo (which is presumed to be due to the bottom directly below the sonar system) and the echo <strong>of</strong><br />
the reflective feature, the observer can compute the range to the feature from the sonar. But<br />
remember, this is all the information the observer has.<br />
Figure Chapter 5 - -8 shows the bottom in this example redrawn from an overhead view. The “X”<br />
marks the point on the sea floor where the ping strikes first, creating the first return echo. After<br />
striking at the “X,” the spherical pulse front continues to propagate, intersecting the bottom in an<br />
expanding circle, eventually striking the bottom feature represented by the box. The observer can<br />
compute the range R between the “X” and the box, but otherwise does not know where on the<br />
ring <strong>of</strong> the expanding wave front the box is. In the real world, where sidescan sonars are used to<br />
locate objects such as rock formations or sunken vessels on the bottom, it is easy to see that this<br />
simple depth sounder amplitude information is too limited to be useful.<br />
Figure Chapter 5 - -8: An Overhead View <strong>of</strong> the Bottom<br />
Copyright © 2000 L-3 Communications SeaBeam Instruments Page 5-7<br />
No portion <strong>of</strong> this document may be reproduced without the expressed written permission <strong>of</strong> L-3 Communications SeaBeam Instruments
Sidescan <strong>Sonar</strong> <strong>Multibeam</strong> <strong>Sonar</strong> <strong>Theory</strong> <strong>of</strong> <strong>Operation</strong><br />
Most sidescan sonars deal with this problem by introducing some directivity to their projected<br />
pulses, and, to some degree, their receivers. This is done by using a line array <strong>of</strong> projectors to<br />
send pulses. The long axis <strong>of</strong> the line array is oriented parallel to the direction <strong>of</strong> travel <strong>of</strong> the<br />
sonar survey vessel (<strong>of</strong>ten the arrays are towed behind the ship). Recall from the discussion <strong>of</strong><br />
Beam Forming in Chapter 3 that a line array <strong>of</strong> projectors sends a circular pulse that expands in a<br />
plane perpendicular to the long axis <strong>of</strong> the array. Figure Chapter 5 - -9 shows a survey vessel<br />
towing a line array, and the propagation <strong>of</strong> circular pulses from that array. These pulses first strike<br />
the bottom directly below the sonar system, and then their intersection with the sea floor travels<br />
away from the array in either direction. Echoes are returned first from the bottom directly below<br />
the array, followed by echoes from points farther and farther away along a line perpendicular to<br />
the array axis and the survey ship’s track.<br />
Figure Chapter 5 - -9: Survey Vessel Towing a Line Array<br />
Page 5-8 Copyright © 2000 L-3 Communications SeaBeam Instruments<br />
No portion <strong>of</strong> this document may be reproduced without the expressed written permission <strong>of</strong> L-3 Communications SeaBeam Instruments
<strong>Multibeam</strong> <strong>Sonar</strong> <strong>Theory</strong> <strong>of</strong> <strong>Operation</strong> Sidescan <strong>Sonar</strong><br />
Sidescan sonars can receive the echoes from the bottom using two hydrophones, each set up to<br />
receive the returns from one side <strong>of</strong> the ship’s survey track. In reality, instead <strong>of</strong> one projector<br />
and two hydrophone arrays, two line arrays are used as transducers. One transmits a fan beam<br />
towards the port side and then listens to its returns, and the other does the same on the starboard<br />
side. To understand the reason for this arrangement refer again to Figure Chapter 5 - -9. When a<br />
pulse front first strikes the bottom below the survey vessel, an echo returns from only the one<br />
point <strong>of</strong> intersection. Later, however, the pulse front intersects the bottom at two points, one on<br />
each side <strong>of</strong> the ship. The echoes from these two points would occur simultaneously, and a single<br />
hydrophone system would have no way <strong>of</strong> distinguishing between them. If, however, two separate<br />
hydrophones each record the echoes from only one side <strong>of</strong> the ship, there would be no such<br />
confusion. The name sidescan is used for historical reasons— because these sonars were<br />
originally built to be sensitive to echo returns from bottom locations on either side <strong>of</strong> a survey ship,<br />
instead <strong>of</strong> directly below as was the case for a traditional single-beam depth-sounder. With the<br />
advent <strong>of</strong> multibeam sonars such as the SEA BEAM 2100, which map both depth and sidescan<br />
across a swath <strong>of</strong> the bottom, the distinction inherent in this name has become less meaningful.<br />
In practice, sidescan sonars tend to mount both the line array and hydrophones on a towfish, a<br />
device that is towed in the water somewhat below the surface behind a survey vessel. As the<br />
survey vessel travels, the towfish transmits and listens to the echoes <strong>of</strong> a series <strong>of</strong> pulses (see<br />
Figure Chapter 5 - -10). The echoes <strong>of</strong> each pulse are used to build up an amplitude versus time<br />
plot (or trace) for each side <strong>of</strong> the vessel (see Figure Chapter 5 - -11). To adjust for the decline in<br />
the strength <strong>of</strong> echoes due to attenuation, a time-varying gain is applied to the amplitude values so<br />
that sea floor features with similar reflectivities have similar amplitudes. Eventually the noise<br />
inherent in the system (which remains constant) becomes comparable to the amplitude <strong>of</strong> the<br />
echo, and the amplified trace becomes dominated by noise. Recording <strong>of</strong> each trace is usually cut<br />
<strong>of</strong>f before this occurs so that the next ping can be transmitted.<br />
Figure Chapter 5 - -10: A Sidescan <strong>Sonar</strong> Measuring a Featured Ocean Floor with Four<br />
Pings<br />
Copyright © 2000 L-3 Communications SeaBeam Instruments Page 5-9<br />
No portion <strong>of</strong> this document may be reproduced without the expressed written permission <strong>of</strong> L-3 Communications SeaBeam Instruments
Sidescan <strong>Sonar</strong> <strong>Multibeam</strong> <strong>Sonar</strong> <strong>Theory</strong> <strong>of</strong> <strong>Operation</strong><br />
Figure Chapter 5 - -11: Amplitude Versus Time Plot for the Four Pings in Figure<br />
Chapter 5 - -10<br />
Each trace is converted into a series <strong>of</strong> gray shades on a plotting device. The shade <strong>of</strong> gray is<br />
determined by the amplitude (white corresponding to high amplitude, black to low amplitude, or<br />
vice-versa). The port and starboard traces are plotted next to and facing each other so that the<br />
ship’s track is at the center <strong>of</strong> the picture, and subsequent pairs <strong>of</strong> traces are plotted in series to<br />
build up a “picture” <strong>of</strong> the bottom (see Figure Chapter 5 - -12).<br />
Figure Chapter 5 - -12: Port and Starboard Traces Plotted in Series<br />
Page 5-10 Copyright © 2000 L-3 Communications SeaBeam Instruments<br />
No portion <strong>of</strong> this document may be reproduced without the expressed written permission <strong>of</strong> L-3 Communications SeaBeam Instruments
<strong>Multibeam</strong> <strong>Sonar</strong> <strong>Theory</strong> <strong>of</strong> <strong>Operation</strong> Sidescan <strong>Sonar</strong><br />
Figure Chapter 5 - -13 shows a sample <strong>of</strong> sidescan data from a SEA BEAM 2100 survey. In the<br />
figure, the survey vessel has traveled from the upper left to the lower right, and dark gray shades<br />
represent higher amplitude echoes.<br />
Several hundred sidescan swaths, showing both port and starboard, are represented by the many<br />
parallel gray lines that cross the ship’s track. The noisy dark area across the middle is directly<br />
below the ship’s track. Clearly visible on the starboard (lower) side <strong>of</strong> the ship’s track are two<br />
dark lines, which are the sidescan echoes <strong>of</strong> undersea pipelines.<br />
Figure Chapter 5 - -13: Undersea Pipelines Detected Using Sidescan <strong>Sonar</strong><br />
Limitations <strong>of</strong> Traditional Sidescan <strong>Sonar</strong><br />
In the above treatment <strong>of</strong> sidescan sonar, note that all <strong>of</strong> the examples deal with a flat ocean floor.<br />
In reality the ocean floor is far from flat, which introduces uncertainties in the interpretation <strong>of</strong><br />
sidescan data. Recall that the only information a traditional sidescan sonar provides is a series <strong>of</strong><br />
echo amplitudes as a function <strong>of</strong> time. The directivity <strong>of</strong> the sonar indicates which direction these<br />
echoes were coming from. But an observer cannot really be sure <strong>of</strong> the exact location <strong>of</strong> the<br />
sources <strong>of</strong> these echoes.<br />
This problem is illustrated in Figure Chapter 5 - -14, which shows only one half <strong>of</strong> a traditional<br />
two-hydrophone sidescan sonar. In this case, the sonar is surveying over an area that has a<br />
sharply sloped bottom. The first place the circular pulse fronts strike the bottom is not directly<br />
below the survey vessel, but at a point on the sloped bottom well <strong>of</strong>f to the side. This is the point<br />
that will cause the earliest amplitude on the amplitude versus time trace (see Figure Chapter 5 - -<br />
15). The point directly below the sonar will cause an echo at a slightly later time. At this same<br />
time, two points on the slope will be causing an echo. Because they occur at the same time, the<br />
echoes <strong>of</strong> these three widely separated points will be confused on the trace. It is clear that by<br />
looking at only the amplitude versus time trace in this example, an observer would not have an<br />
accurate picture <strong>of</strong> the sea floor. Because <strong>of</strong> this problem, traditional sidescan sonars are really<br />
only useful for flat or near-flat bottoms, or when used in combination with bathymetry information.<br />
Copyright © 2000 L-3 Communications SeaBeam Instruments Page 5-11<br />
No portion <strong>of</strong> this document may be reproduced without the expressed written permission <strong>of</strong> L-3 Communications SeaBeam Instruments
Sidescan <strong>Sonar</strong> <strong>Multibeam</strong> <strong>Sonar</strong> <strong>Theory</strong> <strong>of</strong> <strong>Operation</strong><br />
Figure Chapter 5 - -14: Half <strong>of</strong> a Two-Hydrophone Sidescan <strong>Sonar</strong><br />
Figure Chapter 5 - -15: Amplitude versus Time Plot for the Situation Depicted in<br />
Figure Chapter 5 - -14<br />
The SEA BEAM 2100 Sidescan <strong>Sonar</strong><br />
While primarily designed as a depth-sounding instrument, the SEA BEAM 2100 simultaneously<br />
provides sidescan data <strong>of</strong> the ocean bottom. This sidescan data measures roughly the same swath<br />
area covered by the depth information, but with considerably better resolution. Where the depth<br />
measurements are limited in their resolution to 151 beams <strong>of</strong> roughly 1°-widths, the sidescan<br />
divides the swath width into 2000 pixels <strong>of</strong> data. Unlike traditional sidescan sonars that use a flatbottom<br />
assumption to find the location <strong>of</strong> objects on the ocean floor, the SEA BEAM 2100<br />
sidescan information is co-located with the measured depths, so an observer can tell not only the<br />
amplitude <strong>of</strong> a return as in conventional sidescan but also where it is on the bottom. This colocated<br />
data allows bottom features to be examined in terms <strong>of</strong> their geometry, shown by the<br />
depth information and their composition as indicated by their sidescan returns.<br />
Page 5-12 Copyright © 2000 L-3 Communications SeaBeam Instruments<br />
No portion <strong>of</strong> this document may be reproduced without the expressed written permission <strong>of</strong> L-3 Communications SeaBeam Instruments
<strong>Multibeam</strong> <strong>Sonar</strong> <strong>Theory</strong> <strong>of</strong> <strong>Operation</strong> Sidescan <strong>Sonar</strong><br />
To maximize the sidescan capabilities <strong>of</strong> the SEA BEAM 2100, you need to understand the<br />
processes used to collect it. This section gives a brief overview <strong>of</strong> the steps <strong>of</strong> sidescan data<br />
collection performed by the sonar, with particular emphasis on where and when sidescan returns<br />
can be influenced by user intervention.<br />
Producing Sidescan Data With the SEA BEAM 2100<br />
The SEA BEAM 2100 sidescan sonar uses the same hardware as the depth-sounding sonar. In<br />
fact, it uses the same pings and much <strong>of</strong> the same processing. Only fairly late in the data<br />
processing do the procedures for measuring bathymetry and generating sidescan imagery diverge.<br />
This arrangement allows the SEA BEAM 2100 to produce both types <strong>of</strong> data without much more<br />
computation than would be required for each individually.<br />
As described in previous chapters, the projectors in the SEA BEAM 2100 system are arranged in<br />
a line array, similar to a traditional sidescan sonar. The projector array is aligned with the direction<br />
<strong>of</strong> travel <strong>of</strong> the survey vessel, although rather than being towed, it is mounted on the ship’s hull.<br />
This array ensonifies a strip <strong>of</strong> the bottom perpendicular to the survey vessel’s track. Instead <strong>of</strong><br />
using line arrays for both transmission and reception in traditional sidescan sonar, the SEA BEAM<br />
2100 has an array <strong>of</strong> hydrophones (between 48 and 80, depending on the installation), mounted<br />
athwartship— at right angles to the projector array. The data from the hydrophones is processed to<br />
extract both amplitude and angle information. While this processing is a complex procedure, it can<br />
be understood as a series <strong>of</strong> fairly straight-forward steps.<br />
Many <strong>of</strong> the steps in the procedure are the same as those required for bathymetry measurement.<br />
Specifically, the processing required for Beam Forming and Beam Steering, High-Resolution<br />
Angle Estimation and Adjusting Final Angles for Roll is identical for both types <strong>of</strong> measurements.<br />
These processes are all described in detail in earlier chapters (Beam Forming and Beam Steering<br />
in Chapter 3, and Angle Estimation and Roll Compensation in Chapter 4). To briefly review:<br />
• Beam Forming and Beam Steering – The amplitude and phase information from all <strong>of</strong> the<br />
elements in the hydrophone array are passed through an FFT to obtain amplitudes detected by<br />
several steered beams (the number <strong>of</strong> beams depends on the installation).<br />
• High-Resolution Angle Estimation – The measurements <strong>of</strong> all beams in each time interval are<br />
collected into a time slice. Within each time slice, the response pattern <strong>of</strong> the beam is used to<br />
precisely determine the angle to specific echo events that occur in that time slice.<br />
• Adjusting Final Angle for Roll – The angles measured in the above item are adjusted to the<br />
changing angle <strong>of</strong> the hydrophone array, yielding the true angles to echoes on the sea floor.<br />
BDI bathymetry and sidescan processing essentially share the result <strong>of</strong> these three procedures.<br />
Emerging from them is a list <strong>of</strong> time slices, each with amplitudes and direction angles for a number<br />
<strong>of</strong> echo events (called hits). At this point, the Bathymetry and Sidescan processing diverge.<br />
Copyright © 2000 L-3 Communications SeaBeam Instruments Page 5-13<br />
No portion <strong>of</strong> this document may be reproduced without the expressed written permission <strong>of</strong> L-3 Communications SeaBeam Instruments
Sidescan <strong>Sonar</strong> <strong>Multibeam</strong> <strong>Sonar</strong> <strong>Theory</strong> <strong>of</strong> <strong>Operation</strong><br />
Mapping Sidescan Values for 2000 Pixel Resolution<br />
The final stage <strong>of</strong> sidescan data processing is mapping the detected echoes to build an image <strong>of</strong><br />
the sea floor. In detecting the echoes <strong>of</strong> a specific ping, the SEA BEAM 2100 monitors the<br />
particular set <strong>of</strong> sequential time slices that generally range between when the first (nearest) and<br />
last (farthest) bottom echoes are expected. This range is controlled by the SEA BEAM 2100<br />
operator through the Start and Stop Gates settings (see Chapter 9 <strong>of</strong> the SEA BEAM 2100<br />
Operator’s Manual for information about the theory and operation <strong>of</strong> the Start and Stop Gates<br />
settings).<br />
Recall that the sidescan process collects the echoes from a swath <strong>of</strong> the sea floor that is oriented<br />
perpendicular to the path <strong>of</strong> a survey vessel. For each bottom swath, the SEA BEAM 2100<br />
sidescan data is mapped into an array <strong>of</strong> 2000 pixel locations. This array contains the amplitudes<br />
<strong>of</strong> echoes from the sea floor. The physical size represented by these 2000 pixels is determined by<br />
the value <strong>of</strong> sidescan pixel size, which is set by the SEA BEAM 2100 operator (see Chapter 10<br />
<strong>of</strong> the SEA BEAM 2100 Operator’s Manual for information on setting sidescan pixel size). For<br />
instance, if the sidescan pixel size is set to 2 meters per pixel, the 2000-pixel sidescan swath is<br />
4000 meters wide. In all cases the mapped swath is centered directly below the path <strong>of</strong> the survey<br />
vessel.<br />
The echoes from all relevant time slices are added to the sidescan swath array. The echo angles<br />
are converted to physical locations on the bottom based on sound velocity. These are then mapped<br />
into the pixels in the sidescan swath array (see Figure Chapter 5 - -16). Amplitudes <strong>of</strong> echoes that<br />
fall within the physical limits <strong>of</strong> the 2000 pixel swath are retained; all others are discarded. At the<br />
conclusion <strong>of</strong> the process, some pixels will have no echoes recorded in them, some will have one,<br />
and others will have many. Pixels that have one echo are assigned the amplitude <strong>of</strong> that echo. If a<br />
pixel has more than one echo, the average <strong>of</strong> the amplitudes is used. Pixels with no reported<br />
echoes are assigned a value interpolated from neighboring pixels.<br />
Page 5-14 Copyright © 2000 L-3 Communications SeaBeam Instruments<br />
No portion <strong>of</strong> this document may be reproduced without the expressed written permission <strong>of</strong> L-3 Communications SeaBeam Instruments
<strong>Multibeam</strong> <strong>Sonar</strong> <strong>Theory</strong> <strong>of</strong> <strong>Operation</strong> Sidescan <strong>Sonar</strong><br />
Figure Chapter 5 - -16: Mapping Hits in the Sidescan Array<br />
The 2000 amplitude values that result from this process are recorded in the sidescan sonar record.<br />
Display <strong>of</strong> Sidescan Data<br />
The SEA BEAM 2100 displays the 2000 pixels <strong>of</strong> sidescan data as gray scales on both the<br />
operator control station screen and a thermal graphic recorder. To accomplish this, the amplitude<br />
values <strong>of</strong> the sidescan data are converted to gray scales.<br />
The amplitude values are first converted to dB power units using the following conversion formula:<br />
Power (dB) = 20.0 x log10 (Amplitude)<br />
The conversion <strong>of</strong> power to gray scale is governed by the SEA BEAM 2100 operator through the<br />
values <strong>of</strong> gray scale minimum and gray scale maximum. See Chapter 10 <strong>of</strong> the SEA BEAM<br />
2100 Operator’s Manual for information on setting these values.<br />
Copyright © 2000 L-3 Communications SeaBeam Instruments Page 5-15<br />
No portion <strong>of</strong> this document may be reproduced without the expressed written permission <strong>of</strong> L-3 Communications SeaBeam Instruments
Sidescan <strong>Sonar</strong> <strong>Multibeam</strong> <strong>Sonar</strong> <strong>Theory</strong> <strong>of</strong> <strong>Operation</strong><br />
Page 5-16 Copyright © 2000 L-3 Communications SeaBeam Instruments<br />
No portion <strong>of</strong> this document may be reproduced without the expressed written permission <strong>of</strong> L-3 Communications SeaBeam Instruments
<strong>Multibeam</strong> <strong>Sonar</strong> <strong>Theory</strong> <strong>of</strong> <strong>Operation</strong> Glossary <strong>of</strong> Terms<br />
Glossary <strong>of</strong> Terms<br />
absorption loss The energy lost by a propagating wave to the medium in which it is<br />
traveling.<br />
acoustic energy The energy carried by a sound wave.<br />
acrosstrack See athwartship.<br />
active sonar A device that makes remote measurements in a water medium by<br />
transmitting sounds and processing their echoes <strong>of</strong>f remote targets.<br />
alongtrack Dorection parallel to a ship's keel and its direction <strong>of</strong> motion.<br />
amplitude The measured size <strong>of</strong> the oscillations <strong>of</strong> a wave.<br />
analog signal A measurement that is continuous in time.<br />
angle <strong>of</strong> incidence The angle at which a sound pulse strikes a medium, usually measured<br />
with respect to the perpendicular.<br />
athwartship or<br />
acrosstrack<br />
The direction that is perpendicular to a ship’s keel.<br />
attenuation Any loss in energy <strong>of</strong> a propagating wave.<br />
backscattering<br />
strength<br />
bathymetry<br />
measurement<br />
The fraction <strong>of</strong> incident energy per unit area that is directed back from<br />
the ocean bottom in the direction <strong>of</strong> the projector.<br />
See echo sounding.<br />
beam Used to describe focusing <strong>of</strong> acoustic energy by a hydrophone system<br />
or <strong>of</strong> sensitivity to received acoustic energy within a narrow solid<br />
angle.<br />
beam forming The process <strong>of</strong> using projector arrays and hydrophone arrays to<br />
produce narrow transmit beams and receive beams.<br />
beam pattern A description <strong>of</strong> the focusing <strong>of</strong> transmitted or received acoustic<br />
energy within a beam as a function <strong>of</strong> angle. Also called a power<br />
pattern or directivity pattern.<br />
beam stabilization See motion compensation.<br />
beam steering The process <strong>of</strong> using time delays or phase delays to direct the beams<br />
<strong>of</strong> a hydrophone array at specific angles.<br />
beam width or beam<br />
solid angle<br />
A measurement <strong>of</strong> the size <strong>of</strong> the main lobe <strong>of</strong> a beam pattern.<br />
Measured at the half power point.<br />
bearing angle The angle between the direction to a bottom echo and the athwartship<br />
direction, measured on the sea floor.<br />
Copyright © 2000 L-3 Communications SeaBeam Instruments Page 1<br />
No portion <strong>of</strong> this document may be reproduced without the expressed written permission <strong>of</strong> L-3 Communications SeaBeam Instruments
Glossary <strong>of</strong> Terms <strong>Multibeam</strong> <strong>Sonar</strong> <strong>Theory</strong> <strong>of</strong> <strong>Operation</strong><br />
Bearing Direction<br />
Indicator (BDI)<br />
One <strong>of</strong> two algorithms used by the SEA BEAM 2100 to convert<br />
steered beam data into Time <strong>of</strong> Arrival (TOA) and Direction <strong>of</strong><br />
Arrival (DOA) measurements for bathymetry. See also WMT.<br />
center <strong>of</strong> mass A point in space within an object about which its weight is evenly<br />
distributed and about which it will rotate.<br />
compressional wave A wave that propagates through a medium such that oscillations occur<br />
in the direction <strong>of</strong> propagation Compare to translational wave.<br />
constructive<br />
interference<br />
The overlap <strong>of</strong> two or more wave patterns in phase, such that their<br />
peaks and troughs coincide creating new, higher peaks and new,<br />
deeper troughs, respectively.<br />
degrees <strong>of</strong> freedom The number <strong>of</strong> different ways in which an object may move, including<br />
both translational and rotational motion.<br />
destructive<br />
interference<br />
The overlap <strong>of</strong> two or more wave patterns out <strong>of</strong> phase, such that the<br />
peaks <strong>of</strong> one wave line up with the troughs <strong>of</strong> another, effectively<br />
canceling them.<br />
detection threshold A predicted amplitude value applied to the values in a time slice to<br />
eliminate the noise from the true echoes <strong>of</strong> the sea floor.<br />
digital signal or<br />
discrete signal<br />
A representation <strong>of</strong> an analog signal by periodic measurements <strong>of</strong> its<br />
amplitude with a frequency sufficient to uniquely identify the signal’s<br />
analog qualities.<br />
direction angle The angle at which the axis <strong>of</strong> a beam is directed, and where it has<br />
peak sensitivity (in the case <strong>of</strong> a hydrophone array) or where it<br />
transmits peak energy (in the case <strong>of</strong> a projector array).<br />
directivity A measure <strong>of</strong> the degree to which a beam pattern is focused, such<br />
that narrow beam patterns have high directivity and wide beam<br />
patterns have low directivity.<br />
directivity patterns See beam patterns.<br />
discrete Fourier<br />
Transform<br />
Dolph-Chebyshev<br />
shading<br />
A Fourier Transform that is accomplished by means <strong>of</strong> a sum <strong>of</strong><br />
discrete values, rather than by using an integral.<br />
A shading technique that generates uniform, low level side lobes in a<br />
beam pattern.<br />
dynamic threshold The computation <strong>of</strong> detection thresholds for individual time slices<br />
based on the specific content <strong>of</strong> each time slice.<br />
echo The acoustic energy <strong>of</strong> a sound that has “bounced” <strong>of</strong>f a remote<br />
target.<br />
echo sounder The instruments used to make bathymetric measurements, for<br />
example, SEA BEAM 2100.<br />
Page 2 Copyright © 2000 L-3 Communications SeaBeam Instruments<br />
No portion <strong>of</strong> this document may be reproduced without the expressed written permission <strong>of</strong> L-3 Communications SeaBeam Instruments
<strong>Multibeam</strong> <strong>Sonar</strong> <strong>Theory</strong> <strong>of</strong> <strong>Operation</strong> Glossary <strong>of</strong> Terms<br />
echo sounding or<br />
bathymetry<br />
measurement<br />
Remote measurement <strong>of</strong> the depth <strong>of</strong> the ocean floor.<br />
element spacing The distance between projectors or hydrophones in an array.<br />
ensonify or illuminate To bathe a target or area on the sea floor with transmitted sound.<br />
far field A regime in which the distances to objects <strong>of</strong> remote sensing is much<br />
larger than the size <strong>of</strong> the device doing the remote sensing, allowing a<br />
simplification <strong>of</strong> the mathematics involved through approximation. In a<br />
sonar, far field approximations are valid if the ocean depth is much<br />
larger that the size <strong>of</strong> the sonar.<br />
Fast Fourier<br />
Transforms (FFT)<br />
An algorithm used to solve a discrete Fourier Transform with minimal<br />
computation time.<br />
first side lobes The first and strongest side lobes outside <strong>of</strong> the main lobe <strong>of</strong> a beam<br />
pattern.<br />
frequency The number <strong>of</strong> oscillations <strong>of</strong> an acoustic wave that pass an individual<br />
hydrophone each second.<br />
heave Ship motion in the vertical direction.<br />
hydrophone A device that “listens” to sounds in water by converting the physical<br />
oscillations it experiences due to impinging sound waves into voltages.<br />
illuminate See ensonify.<br />
isotropic expansion The expansion <strong>of</strong> transmitted energy such as a pulse <strong>of</strong> sound, such<br />
that it is propagating equally in all directions.<br />
isotropic source A source <strong>of</strong> an isotropically expanding signal, such as a single small<br />
projector.<br />
half power point The point on the main lobe <strong>of</strong> a beam pattern at which it is transmitting<br />
or receiving at half <strong>of</strong> its peak power.<br />
high-resolution angle<br />
estimation<br />
The process by which the steered beam data is used to estimate the<br />
angles <strong>of</strong> echoes to a high degree <strong>of</strong> accuracy. Part <strong>of</strong> BDI<br />
processing.<br />
hydrophone array A group <strong>of</strong> hydrophones that collectively process incoming signals,<br />
usually with the purpose <strong>of</strong> beam formation and beam steering.<br />
impedance A measure <strong>of</strong> the “resistance” <strong>of</strong> a material to a wave propagating<br />
through it. For sound waves, the impedance is a product <strong>of</strong> a<br />
material’s density and the sound speed within it.<br />
interference The interaction <strong>of</strong> wave patterns from more than one source, which<br />
causes new wave patterns. Can be constructive, destructive, or a<br />
combination <strong>of</strong> both.<br />
Copyright © 2000 L-3 Communications SeaBeam Instruments Page 3<br />
No portion <strong>of</strong> this document may be reproduced without the expressed written permission <strong>of</strong> L-3 Communications SeaBeam Instruments
Glossary <strong>of</strong> Terms <strong>Multibeam</strong> <strong>Sonar</strong> <strong>Theory</strong> <strong>of</strong> <strong>Operation</strong><br />
launch angle The angle between the vertical and the direction <strong>of</strong> arrival <strong>of</strong> an echo,<br />
including <strong>of</strong>fsets due to pitch.<br />
line array A projector or hydrophone array where the elements <strong>of</strong> the array are<br />
arranged in a line.<br />
local speed <strong>of</strong> sound The speed at which a sound wave will travel in a medium. In water,<br />
the sound speed is a function <strong>of</strong> the salinity, pressure, and temperature<br />
<strong>of</strong> the water, but is independent <strong>of</strong> the characteristics <strong>of</strong> the sound<br />
itself.<br />
main lobe The part <strong>of</strong> a beam pattern into which the bulk <strong>of</strong> energy is<br />
transmitted to or received from.<br />
maximum response<br />
axis (MRA)<br />
The angle <strong>of</strong> a beam pattern at which maximum power is transmittted<br />
or received.<br />
mounting angle The angle at which a hydrophone array is fixed to the bottom <strong>of</strong> a<br />
ship, measured such that a horizontal array has a mounting angle <strong>of</strong><br />
zero.<br />
motion compensation<br />
or beam stabilization<br />
The process by which the motions <strong>of</strong> a survey vessel are removed<br />
from sonar data to make bathymetric measurements in the Earthcentered<br />
coordinate system.<br />
multibeam sonar An instrument that can map more than one location on the ocean floor<br />
with a single ping and with higher resolution than single-beam echo<br />
sounders.<br />
noise discrimination A process by which noise is ignored and signals are extracted from a<br />
noisy sonar input.<br />
noise level The magnitude <strong>of</strong> unwanted spurious signals in the sonar input.<br />
non-specular regime The situation where the echoes from the bottom are scatterdominated,<br />
usually where the sonar is at an angle to the perpendicular<br />
to the sea floor.<br />
passive sonar Listening devices that record the sounds emitted by objects in water<br />
(seismic events, ships, submarines, and marine creatures, which all<br />
emit sounds on their own).<br />
peaks Maximum values <strong>of</strong> the amplitude <strong>of</strong> a wave.<br />
phase delay or phase<br />
difference<br />
The fractional number <strong>of</strong> oscillations <strong>of</strong> a wave as it propagates some<br />
distance.<br />
phase shift A change in the phase <strong>of</strong> a signal applied to compensate for a phase<br />
delay.<br />
ping A short pulse <strong>of</strong> sound generated by an active sonar for undersea<br />
measurement.<br />
Page 4 Copyright © 2000 L-3 Communications SeaBeam Instruments<br />
No portion <strong>of</strong> this document may be reproduced without the expressed written permission <strong>of</strong> L-3 Communications SeaBeam Instruments
<strong>Multibeam</strong> <strong>Sonar</strong> <strong>Theory</strong> <strong>of</strong> <strong>Operation</strong> Glossary <strong>of</strong> Terms<br />
ping cycle A continuous cycle for a depth sounder used to collect a series <strong>of</strong><br />
depth measurements as the ship it is mounted on travels.<br />
ping time or ping<br />
interval<br />
The amount <strong>of</strong> time required for return echoes and processing<br />
between the transmission <strong>of</strong> pings.<br />
peaks The high pressure regions in the series <strong>of</strong> pressure oscillations that<br />
make up a sound wave.<br />
pitch Rotation <strong>of</strong> a ship about the acrosstrack dimension.<br />
power The energy <strong>of</strong> a sound wave per unit time. Computed as the square <strong>of</strong><br />
the amplitude <strong>of</strong> the wave.<br />
principle <strong>of</strong> reciprocity A transducer instrument acting as a hydrophone will produce a beam<br />
pattern identical to that <strong>of</strong> it acting as a projector.<br />
projector A device that transmits sound into water.<br />
projector array A group <strong>of</strong> projectors that collectively produce sounds, usually with<br />
the purpose <strong>of</strong> beam forming and beam steering.<br />
resolution A characteristic <strong>of</strong> a sonar that is determined by the size <strong>of</strong> the beam<br />
solid angle.<br />
roll Rotation <strong>of</strong> a ship about the alongtrack dimension.<br />
roll bias An <strong>of</strong>fset angle in the roll direction that depends on the ship<br />
configuration but is stable over short periods <strong>of</strong> time. Measured during<br />
calibration <strong>of</strong> a sonar system and applied to all measured angles.<br />
roll <strong>of</strong>fset angle The combination <strong>of</strong> all angles about the alongtrack dimension,<br />
including time-dependent roll, roll bias, and mounting angle.<br />
salinity The relative salt content <strong>of</strong> the ocean, part <strong>of</strong> sound velocity pr<strong>of</strong>ile<br />
computations, usually in parts per million (PPM).<br />
sampling rate The time between digital measurements <strong>of</strong> an analog signal.<br />
scatter Energy that bounces <strong>of</strong>f a target in all directions (in other words, is not<br />
reflected).<br />
selected beam An operator-selected angle at which the echoes received by the sonar<br />
are reported as a function <strong>of</strong> time. This allows an examination <strong>of</strong> the<br />
quality <strong>of</strong> sonar returns.<br />
shading A technique whereby the signals to or from particular elements <strong>of</strong><br />
transducer array are reduced such that side lobes in the resultant<br />
beam pattern are reduced.<br />
shading value A factor applied to the signal from a particular transducer element in a<br />
shading scheme.<br />
side lobe Smaller lobes <strong>of</strong> the beam pattern in which sensitivity rises and falls at<br />
large angles from the beam axis in an endless series.<br />
Copyright © 2000 L-3 Communications SeaBeam Instruments Page 5<br />
No portion <strong>of</strong> this document may be reproduced without the expressed written permission <strong>of</strong> L-3 Communications SeaBeam Instruments
Glossary <strong>of</strong> Terms <strong>Multibeam</strong> <strong>Sonar</strong> <strong>Theory</strong> <strong>of</strong> <strong>Operation</strong><br />
side lobe level The magnitude <strong>of</strong> the first side lobe in a series <strong>of</strong> side lobes, usually<br />
expressed as a fraction <strong>of</strong> the peak <strong>of</strong> the main lobe.<br />
sidescan sonar A sonar that measures the strength <strong>of</strong> echoes from different locations<br />
<strong>of</strong> the ocean floor, revealing information about the composition <strong>of</strong> the<br />
material there.<br />
signal-to-noise ratio The ratio <strong>of</strong> the received signal strength to the noise level, which gives<br />
a measure <strong>of</strong> the detectability <strong>of</strong> a signal.<br />
signal excess (SE) The amount by which the return signal exceeds the minimum signal<br />
level required for detection.<br />
single-beam depth<br />
sounders<br />
Echo sounding devices that make one-per-ping measurements <strong>of</strong> the<br />
ocean depth at many locations.<br />
sonar A device used to remotely detect and locate objects in the water using<br />
sound.<br />
sonar devices A family <strong>of</strong> instruments that use sound for remote-sensing in a water<br />
environment.<br />
<strong>Sonar</strong> Equation A mathematical expression that relates all the factors involved in the<br />
acoustic echoing process.<br />
sound speed The speed at which sounds propagate in a medium.<br />
sound velocity pr<strong>of</strong>ile Description <strong>of</strong> the sound velocity as a function <strong>of</strong> the depth at a given<br />
location.<br />
specular regime The situation where the echoes from the bottom are reflectiondominated,<br />
usually where the sonar is near perpendicular to the sea<br />
floor.<br />
spreading loss Drop in energy per unit area as a propagating pulse front expands.<br />
start and stop gates Operator-selected values that bracket the times at which the sonar<br />
processing should pay attention to the echoes. Start and stop gates can<br />
be unique for each beam angle.<br />
surge Translational motion in the alongtrack direction.<br />
swath A contiguous area on the ocean bottom, usually a strip <strong>of</strong> points in a<br />
direction perpendicular to the path <strong>of</strong> the survey vessel.<br />
swath width The dimension <strong>of</strong> the swath in the athwartship direction (perpendicular<br />
to the path <strong>of</strong> the ship), which can be measured either as a fixed angle<br />
or as a physical size that changes with depth.<br />
sway Translational motion in the acrosstrack direction.<br />
target strength A term for the backscattering strength when dealing with discrete<br />
objects, such as a mine or a submarine.<br />
Page 6 Copyright © 2000 L-3 Communications SeaBeam Instruments<br />
No portion <strong>of</strong> this document may be reproduced without the expressed written permission <strong>of</strong> L-3 Communications SeaBeam Instruments
<strong>Multibeam</strong> <strong>Sonar</strong> <strong>Theory</strong> <strong>of</strong> <strong>Operation</strong> Glossary <strong>of</strong> Terms<br />
time delay The amount <strong>of</strong> time required for a wave to propagate between two<br />
locations.<br />
time shift or phase<br />
shift<br />
A translation <strong>of</strong> a signal in time used to make up for a time delay.<br />
time slice A discrete time interval containing all <strong>of</strong> the information received by<br />
all <strong>of</strong> the hydrophones in an array in one digital time sample.<br />
time spacing The interval between discrete digital time samples. See also sampling<br />
rate.<br />
towfish A device that is towed in the water somewhat below the surface <strong>of</strong><br />
the water behind a survey vessel.<br />
transducer A general term for devices that convert energy from one form to<br />
another, including both hydrophones and projectors.<br />
transmission loss Combination <strong>of</strong> spreading loss and absorption loss <strong>of</strong> a sound wave.<br />
translational wave A wave that propagates through a medium such that oscillations occur<br />
perpendicular to the direction <strong>of</strong> propagation.<br />
transmitted source<br />
level (SL)<br />
A measure <strong>of</strong> the amount <strong>of</strong> acoustic energy put into a signal by the<br />
projector.<br />
troughs The low pressure regions in the series <strong>of</strong> pressure oscillations that<br />
make up a sound wave; minimum values <strong>of</strong> the amplitude.<br />
unstabilized beam A beam for which no adjustments for a ship’s motion are made.<br />
wavelength The physical distance between peak amplitudes in a wave.<br />
Weighted Mean Time<br />
(WMT)<br />
One <strong>of</strong> two algorithms used by the SEA BEAM 2100 to convert<br />
steered beam data into Time <strong>of</strong> Arrival (TOA) and Direction <strong>of</strong><br />
Arrival (DOA) measurements for bathymetry. See also BDI.<br />
yaw Rotation <strong>of</strong> a ship about the vertical dimension.<br />
Copyright © 2000 L-3 Communications SeaBeam Instruments Page 7<br />
No portion <strong>of</strong> this document may be reproduced without the expressed written permission <strong>of</strong> L-3 Communications SeaBeam Instruments
Glossary <strong>of</strong> Terms <strong>Multibeam</strong> <strong>Sonar</strong> <strong>Theory</strong> <strong>of</strong> <strong>Operation</strong><br />
Page 8 Copyright © 2000 L-3 Communications SeaBeam Instruments<br />
No portion <strong>of</strong> this document may be reproduced without the expressed written permission <strong>of</strong> L-3 Communications SeaBeam Instruments