THE SMOOTH SOUNDING GRAPH. A Manual for Field Work ... - BGR
THE SMOOTH SOUNDING GRAPH. A Manual for Field Work ... - BGR THE SMOOTH SOUNDING GRAPH. A Manual for Field Work ... - BGR
37 5+6 Labourers pulling the current cable to the initial position in a wide bend around the "holy" district. On the drums the cable always should run from the top (Fig.27). Now the measurement can start; at each point along the measuring tape the apparent resistivity ρa is calculated from current I, voltage U and fac- tor K. In order to determine immediately the right order of the resistivity, with which the curve starts, significant importance is due to the calcula- tion of the first value for the apparent resistivity. For L/2=1,5m and a/2=0,5m the geometrical factor K is 2π=6,28 (exactly 2πa after Wenner, see chapter 1.3). If now the electrode current I will be adjusted numeri- cally to the factor K, the potential electrode voltage U is numerically equal to the apparent resistivity ρa. This results from formula (13) in chapter 1.4 ρ a = U K I In practice normally the following three possibilities at the starting point result from this: a.) ρ a[ Ωm] = U[ mV ] × 6, 28m 0, 628mA = U[ mV ] × 10 U[ mV ] b.) ρ a[ Ωm] = × 6, 28m = U[ mV ] × 1 6, 280mA U[ mV ] c.) ρ a[ Ωm] = × 6, 28m = U[ mV ] × 0, 1 62, 80mA Using dry batteries the process I=K cannot be realized. ρa then has to be calculated on a slide rule or nowadays on a pocket-computer. The ρa-data are directly plotted on bi-logarithmic transparent paper, and for a better control written in a minute-book. Besides the date, site (with height above m.s.l.) and number of the sounding this minute-book should also contain the measured electrode current I[mA], the measured potential electrode voltage U[mV] and of course the apparent resistivity ρa. An additional column seems desirable for remarks like industrial current, tellurics, weather (rain, sun, wind, thunderstorm) and perhaps a short description of the field (mash-wire
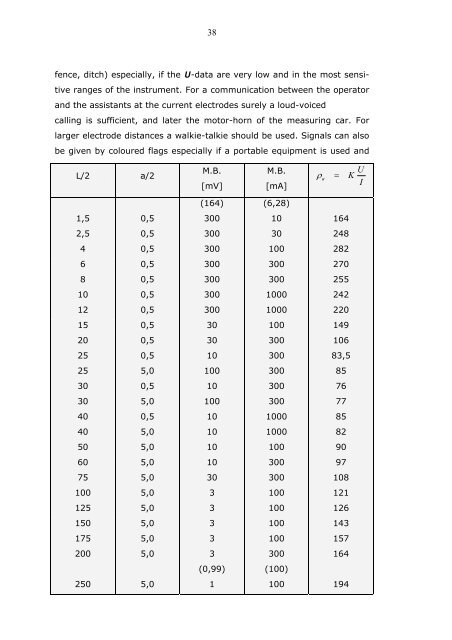
38 fence, ditch) especially, if the U-data are very low and in the most sensi- tive ranges of the instrument. For a communication between the operator and the assistants at the current electrodes surely a loud-voiced calling is sufficient, and later the motor-horn of the measuring car. For larger electrode distances a walkie-talkie should be used. Signals can also be given by coloured flags especially if a portable equipment is used and L/2 a/2 1,5 0,5 M.B. [mV] (164) 300 M.B. [mA] (6,28) ρ a = 10 164 2,5 0,5 300 30 248 4 0,5 300 100 282 6 0,5 300 300 270 8 0,5 300 300 255 10 0,5 300 1000 242 12 0,5 300 1000 220 15 0,5 30 100 149 20 0,5 30 300 106 25 0,5 10 300 83,5 25 5,0 100 300 85 30 0,5 10 300 76 30 5,0 100 300 77 40 0,5 10 1000 85 40 5,0 10 1000 82 50 5,0 10 100 90 60 5,0 10 300 97 75 5,0 30 300 108 100 5,0 3 100 121 125 5,0 3 100 126 150 5,0 3 100 143 175 5,0 3 100 157 200 5,0 3 300 164 250 5,0 (0,99) 1 (100) 100 194 U K I
- Page 1 and 2: THE SMOOTH SOUNDING GRAPH A Manual
- Page 3 and 4: Preface 2 This manual shall be a pr
- Page 5 and 6: 1. Basic rules 4 The first chapter
- Page 7 and 8: This current density is marked as j
- Page 9 and 10: 8 Fig.2 Fig.3 Fig.4 Fig.5
- Page 11 and 12: 10 1.3. The four-electrode arrangem
- Page 13 and 14: 12 Fig.6 Fig.7 Fig.8
- Page 15 and 16: 14 If we compare equations (10) and
- Page 17 and 18: Case 2 (Fig. 10) 16 Now we observe
- Page 19 and 20: 1.5. The fundamental principle for
- Page 21 and 22: Case 3 (Fig.14) 20 The electrode di
- Page 23 and 24: with just the same factor K. 22 Aft
- Page 25 and 26: 24 Fig17 layers with different resi
- Page 27 and 28: 26 Simulating this zooming by enlar
- Page 29 and 30: 28 1.6. Shifting of potential elect
- Page 31 and 32: 30 Fig.21 Fig.22 Fig23
- Page 33 and 34: 32 2.1. How to carry out a field me
- Page 35 and 36: L/2 a/2 1,5 6,28 2 11,8 2,5 18,9 34
- Page 37: 36 Fig.27 Fig.28 Before we start th
- Page 41 and 42: 40 by experience. The measurement i
- Page 43 and 44: 42 2.2. Possible errors influencing
- Page 45 and 46: 2.2.4. Crossing a ditch (Fig.26/29)
- Page 47 and 48: 46 accuracy is not so important the
- Page 49 and 50: 2.2.8. Insulation and leakage curre
- Page 51 and 52: 50 Fig.31. They are ascending with
- Page 53 and 54: 52 If j' is negative, i.e. the dist
38<br />
fence, ditch) especially, if the U-data are very low and in the most sensi-<br />
tive ranges of the instrument. For a communication between the operator<br />
and the assistants at the current electrodes surely a loud-voiced<br />
calling is sufficient, and later the motor-horn of the measuring car. For<br />
larger electrode distances a walkie-talkie should be used. Signals can also<br />
be given by coloured flags especially if a portable equipment is used and<br />
L/2 a/2<br />
1,5 0,5<br />
M.B.<br />
[mV]<br />
(164)<br />
300<br />
M.B.<br />
[mA]<br />
(6,28)<br />
ρ<br />
a<br />
=<br />
10 164<br />
2,5 0,5 300 30 248<br />
4 0,5 300 100 282<br />
6 0,5 300 300 270<br />
8 0,5 300 300 255<br />
10 0,5 300 1000 242<br />
12 0,5 300 1000 220<br />
15 0,5 30 100 149<br />
20 0,5 30 300 106<br />
25 0,5 10 300 83,5<br />
25 5,0 100 300 85<br />
30 0,5 10 300 76<br />
30 5,0 100 300 77<br />
40 0,5 10 1000 85<br />
40 5,0 10 1000 82<br />
50 5,0 10 100 90<br />
60 5,0 10 300 97<br />
75 5,0 30 300 108<br />
100 5,0 3 100 121<br />
125 5,0 3 100 126<br />
150 5,0 3 100 143<br />
175 5,0 3 100 157<br />
200 5,0 3 300 164<br />
250 5,0<br />
(0,99)<br />
1<br />
(100)<br />
100 194<br />
U<br />
K<br />
I


