

Lesson Plan: PreK "Charts and Bar Graphs"
Lesson Plan: PreK "Charts and Bar Graphs"
Lesson Plan: PreK "Charts and Bar Graphs"

You also want an ePaper? Increase the reach of your titles
YUMPU automatically turns print PDFs into web optimized ePapers that Google loves.
St<strong>and</strong>ards Addressed<br />
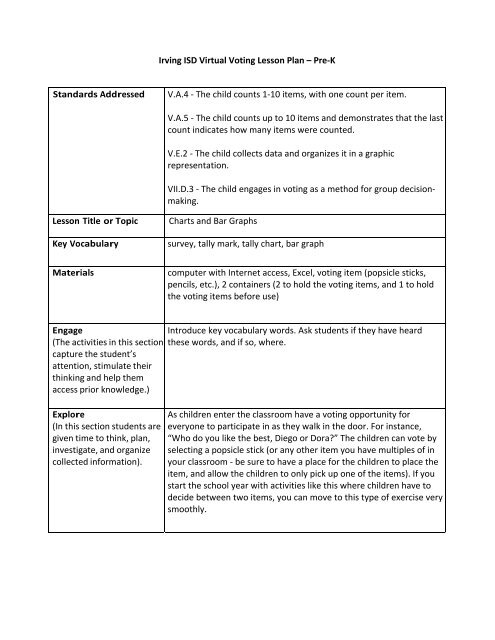
Irving ISD Virtual Voting <strong>Lesson</strong> <strong>Plan</strong> – Pre‐K<br />
<strong>Lesson</strong> Title or Topic <strong>Charts</strong> <strong>and</strong> <strong>Bar</strong> Graphs<br />
V.A.4 ‐ The child counts 1‐10 items, with one count per item.<br />
V.A.5 ‐ The child counts up to 10 items <strong>and</strong> demonstrates that the last<br />
count indicates how many items were counted.<br />
V.E.2 ‐ The child collects data <strong>and</strong> organizes it in a graphic<br />
representation.<br />
VII.D.3 ‐ The child engages in voting as a method for group decision‐<br />
making.<br />
Key Vocabulary survey, tally mark, tally chart, bar graph<br />
Materials computer with Internet access, Excel, voting item (popsicle sticks,<br />
pencils, etc.), 2 containers (2 to hold the voting items, <strong>and</strong> 1 to hold<br />
the voting items before use)<br />
Engage<br />
(The activities in this section<br />
capture the student’s<br />
attention, stimulate their<br />
thinking <strong>and</strong> help them<br />
access prior knowledge.)<br />
Explore<br />
(In this section students are<br />
given time to think, plan,<br />
investigate, <strong>and</strong> organize<br />
collected information).<br />
Introduce key vocabulary words. Ask students if they have heard<br />
these words, <strong>and</strong> if so, where.<br />
As children enter the classroom have a voting opportunity for<br />
everyone to participate in as they walk in the door. For instance,<br />
“Who do you like the best, Diego or Dora?” The children can vote by<br />
selecting a popsicle stick (or any other item you have multiples of in<br />
your classroom ‐ be sure to have a place for the children to place the<br />
item, <strong>and</strong> allow the children to only pick up one of the items). If you<br />
start the school year with activities like this where children have to<br />
decide between two items, you can move to this type of exercise very<br />
smoothly.
Explain<br />
(Students are now involved<br />
in an analysis of their<br />
exploration. Their<br />
underst<strong>and</strong>ing is clarified<br />
<strong>and</strong> modified because of<br />
reflective activities).<br />
Reference the daily commitment the children make (Frog Street<br />
Curriculum, Theme 2, pg. 171) <strong>and</strong> help them to make the connection<br />
between their daily choices [ex. using kinds words, using helping<br />
h<strong>and</strong>s, using big voice, listening to other’s big voices] <strong>and</strong> making a<br />
choice on a larger scale.<br />
Remind the children of the voting opportunity they had as they<br />
walked in the door. Talk about how you are going to be talking about<br />
the information gathered through this selection process. Be sure to<br />
explain this is not a voting opportunity where something is going to<br />
win, but merely a survey to see which is the most popular. [You might<br />
take this opportunity to differentiate between voting for informational<br />
purposes <strong>and</strong> voting for making a selection of something tangible.]<br />
When we want to find out information from a group of people, we<br />
take a survey. By asking people what they like we are gathering<br />
information, which we can look at <strong>and</strong> figure out what the majority of<br />
the people like.
Elaborate / Extend<br />
(This section gives students<br />
the opportunity to exp<strong>and</strong><br />
<strong>and</strong> solidify their<br />
underst<strong>and</strong>ing of the<br />
concept <strong>and</strong> apply it to a<br />
real world situation.)<br />
Get the containers the children used to make their earlier selection.<br />
[Be sure to have the containers labeled, not only for the children to<br />
easily make their decision, but also so when the containers are moved<br />
they are not confused.] Show the children the container. Remind<br />
them this is not selecting something as a winner. but rather gathering<br />
information as to the favorite character of the children in the<br />
classroom. Choose one of the containers <strong>and</strong> begin to count with the<br />
children the voting items in the container. [It would work best if you<br />
have a place you can put the items down so the children can see them<br />
at all times.] Once you have counted the items, introduce the<br />
vocabulary words tally mark. Using a chart paper, white board, or<br />
other writing surface show the children how to write a tally mark.<br />
Have one of the children make a tally mark for each of the voting<br />
items as the class counts the items in the first container. Repeat with<br />
the second container. [Be sure the child records the tally marks in a<br />
different color, or in the area you have designated for the second<br />
container.]<br />
Once you have the tally marks for each of the choices, ask the children<br />
if they can easily decide which of the two choices was the most<br />
popular? Ask how they were able to decide the most popular?<br />
Introduce the vocabulary word bar graph. [Have the computer<br />
connected to the projection system <strong>and</strong> setup with an Excel<br />
spreadsheet or one of the online bar graph generators open <strong>and</strong> ready<br />
to enter information,. Be sure to have an icon for each of the choices<br />
the children had at the beginning of the lesson <strong>and</strong> the numeral along<br />
the edge so the children can see them for reference purposes (they<br />
may not be used, but it is great reinforcement when it comes to the<br />
counting portion of the analysis).] Using the spreadsheet (either<br />
through Excel or using one of the online bar graph generates listed<br />
below) explain to the children that each box represents one student’s<br />
choice. As you begin to count the voting items, have one child at a<br />
time come to the computer <strong>and</strong> color in the box above or next to the<br />
appropriate character [depending on the direction of your bar graph ‐<br />
it would be good to do the lesson both ways so the children can see<br />
how one shows the selections grow taller <strong>and</strong> the other makes the<br />
selection grow longer.].<br />
Once the graph has been completed talk about the results of the<br />
survey.<br />
Questions :<br />
Which character is the most popular?<br />
How can you tell which character is the most popular?<br />
How many more people like (Diego) more than (Dora)?<br />
Which character is the least popular?<br />
How many people would need to vote for Dora in order for her to be<br />
more popular than Diego?
Followup/Extensions You can allow the children to practice creating a tally chart <strong>and</strong> bar<br />
graph through the “<strong>Charts</strong> <strong>and</strong> <strong>Bar</strong> Graph” game, Picture Maker,<br />
http://www.brainpopjr.com/math/data/tallycharts<strong>and</strong>bargraphs/pict<br />
uremaker/.<br />
[This can be completed as a small group or individual activity. It would<br />
be best if this activity were done with some adult supervision or<br />
demonstrated in a large group setting in order to verify<br />
underst<strong>and</strong>ing. This is a great follow‐up activity to the h<strong>and</strong>s‐on<br />
activity completed during the lesson.]<br />
Home Connection Ask the children to create a simple bar graph with their family<br />
showing the number of males <strong>and</strong> females in their household.<br />
When the graphs are returned, allow the children to get into<br />
groups of 2 ‐ 3 to talk about <strong>and</strong> compare their graphs.<br />
Questions:<br />
o Which person has the most females in their family?<br />
o Which person has the most males in their family?<br />
o Who has the most members in their family?<br />
o Who has the least number of people in their family.<br />
Resources Online Resources:<br />
BrainPop, Jr. ‐ “<strong>Charts</strong> <strong>and</strong> <strong>Bar</strong> Graph” (video)<br />
Interactive White Board activity ideas ‐<br />
http://www.prometheanplanet.com/server.php?show=conRes<br />
ource.9907<br />
http://www.prometheanplanet.com/server.php?show=conRes<br />
ource.11348<br />
Individual or Small group review<br />
http://www.sfsocialstudies.com/g1/u6/index.html ‐ this is a<br />
great interactive game where the children must read the graph<br />
<strong>and</strong> select the appropriate numeral response<br />
Online <strong>Bar</strong> Grapher<br />
http://www.amblesideprimary.com/ambleweb/mentalmaths/g<br />
rapher.html<br />
http://www.mathsisfun.com/data/data‐graph.php<br />
Multiple Resources ‐ printables <strong>and</strong> presentations to use or<br />
springboard from<br />
http://www.primaryresources.co.uk/maths/mathsF1.htm#pict<br />
ograms<br />
Book Recommendations :<br />
Graficas de barras = <strong>Bar</strong> Graphs por Vijaya Khisty Bodach<br />
Graph It! by Lisa Trumbauer<br />
Tally <strong>Charts</strong> by Vijaya Khisty Bodach

