FRESH WATER - Taranaki Regional Council
FRESH WATER - Taranaki Regional Council
FRESH WATER - Taranaki Regional Council

You also want an ePaper? Increase the reach of your titles
YUMPU automatically turns print PDFs into web optimized ePapers that Google loves.
Table 4.28: Wetland numbers.<br />
In 2008, aerial photos taken in 2007 were used to evaluate changes<br />
in the extent of wetland coverage in the region from 1996. The grid<br />
references listed in the 1996 inventory were examined on the 2007<br />
aerial photos and the area of each wetland was calculated. Table 4.28<br />
sets out the number of wetlands found through the 1996 survey, the<br />
number that were found to have disappeared and the number found in<br />
2008, according to ecological district. The number of wetlands found<br />
in 2008 differed from that found in 1996 because: some had clearly<br />
disappeared (and this was verifi ed by checking aerial photos taken in<br />
2001), some areas originally classifi ed as estuaries were not counted<br />
(as they were not really estuaries), some errors in grid references<br />
were found, some areas had been double-counted in 1996 and some<br />
additional wetlands were located.<br />
Table 4.28 shows that of the original 717 natural wetlands identifi ed in<br />
the 1996 inventory 63 (8.8%) were confi rmed to have disappeared. The<br />
majority of wetlands that had disappeared were from the Egmont and<br />
Foxton ecological districts, areas where there is greatest pressure for<br />
land development from agriculture. The majority of these wetlands were<br />
estimated as being less than 5 ha.<br />
Ecological District TOTAL<br />
Egmont Nth <strong>Taranaki</strong> Matemate _ aonga Manawatu Plains Foxton<br />
Number of wetlands reported in the 1996 survey 289 125 187 56 50 717<br />
Number found to have disappeared by 2008 23 16 1 8 15 63<br />
Total number of wetlands found in 2008 272 107 174 45 41 639<br />
Area of wetlands found in 2008 (ha) 1,762.5 659.3 977.3 275.7 372.9 4,048<br />
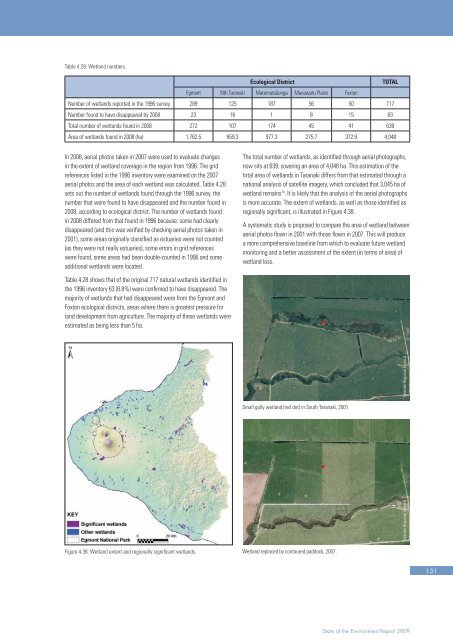
Figure 4.38. Wetland extent and regionally signifi cant wetlands.<br />
The total number of wetlands, as identifi ed through aerial photographs,<br />
now sits at 639, covering an area of 4,048 ha. This estimation of the<br />
total area of wetlands in <strong>Taranaki</strong> differs from that estimated through a<br />
national analysis of satellite imagery, which concluded that 3,045 ha of<br />
wetland remains 70 . It is likely that the analysis of the aerial photographs<br />
is more accurate. The extent of wetlands, as well as those identifi ed as<br />
regionally signifi cant, is illustrated in Figure 4.38.<br />
A systematic study is proposed to compare the area of wetland between<br />
aerial photos fl own in 2001 with those fl own in 2007. This will produce<br />
a more comprehensive baseline from which to evaluate future wetland<br />
monitoring and a better assessment of the extent (in terms of area) of<br />
wetland loss.<br />
Small gully wetland (red dot) in South <strong>Taranaki</strong>, 2001.<br />
Wetland replaced by contoured paddock, 2007.<br />
<strong>Taranaki</strong> <strong>Regional</strong> <strong>Council</strong><br />
<strong>Taranaki</strong> <strong>Regional</strong> <strong>Council</strong><br />
State of the Environment Report 2009<br />
131