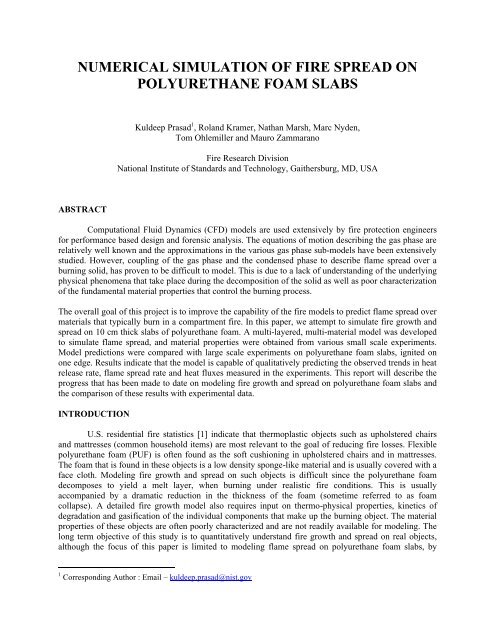
numerical simulation of fire spread on polyurethane foam slabs
numerical simulation of fire spread on polyurethane foam slabs
numerical simulation of fire spread on polyurethane foam slabs

Create successful ePaper yourself
Turn your PDF publications into a flip-book with our unique Google optimized e-Paper software.
NUMERICAL SIMULATION OF FIRE SPREAD ON<br />
POLYURETHANE FOAM SLABS<br />
ABSTRACT<br />
Kuldeep Prasad 1 , Roland Kramer, Nathan Marsh, Marc Nyden,<br />
Tom Ohlemiller and Mauro Zammarano<br />
Fire Research Divisi<strong>on</strong><br />
Nati<strong>on</strong>al Institute <str<strong>on</strong>g>of</str<strong>on</strong>g> Standards and Technology, Gaithersburg, MD, USA<br />
Computati<strong>on</strong>al Fluid Dynamics (CFD) models are used extensively by <str<strong>on</strong>g>fire</str<strong>on</strong>g> protecti<strong>on</strong> engineers<br />
for performance based design and forensic analysis. The equati<strong>on</strong>s <str<strong>on</strong>g>of</str<strong>on</strong>g> moti<strong>on</strong> describing the gas phase are<br />
relatively well known and the approximati<strong>on</strong>s in the various gas phase sub-models have been extensively<br />
studied. However, coupling <str<strong>on</strong>g>of</str<strong>on</strong>g> the gas phase and the c<strong>on</strong>densed phase to describe flame <str<strong>on</strong>g>spread</str<strong>on</strong>g> over a<br />
burning solid, has proven to be difficult to model. This is due to a lack <str<strong>on</strong>g>of</str<strong>on</strong>g> understanding <str<strong>on</strong>g>of</str<strong>on</strong>g> the underlying<br />
physical phenomena that take place during the decompositi<strong>on</strong> <str<strong>on</strong>g>of</str<strong>on</strong>g> the solid as well as poor characterizati<strong>on</strong><br />
<str<strong>on</strong>g>of</str<strong>on</strong>g> the fundamental material properties that c<strong>on</strong>trol the burning process.<br />
The overall goal <str<strong>on</strong>g>of</str<strong>on</strong>g> this project is to improve the capability <str<strong>on</strong>g>of</str<strong>on</strong>g> the <str<strong>on</strong>g>fire</str<strong>on</strong>g> models to predict flame <str<strong>on</strong>g>spread</str<strong>on</strong>g> over<br />
materials that typically burn in a compartment <str<strong>on</strong>g>fire</str<strong>on</strong>g>. In this paper, we attempt to simulate <str<strong>on</strong>g>fire</str<strong>on</strong>g> growth and<br />
<str<strong>on</strong>g>spread</str<strong>on</strong>g> <strong>on</strong> 10 cm thick <strong>slabs</strong> <str<strong>on</strong>g>of</str<strong>on</strong>g> <strong>polyurethane</strong> <strong>foam</strong>. A multi-layered, multi-material model was developed<br />
to simulate flame <str<strong>on</strong>g>spread</str<strong>on</strong>g>, and material properties were obtained from various small scale experiments.<br />
Model predicti<strong>on</strong>s were compared with large scale experiments <strong>on</strong> <strong>polyurethane</strong> <strong>foam</strong> <strong>slabs</strong>, ignited <strong>on</strong><br />
<strong>on</strong>e edge. Results indicate that the model is capable <str<strong>on</strong>g>of</str<strong>on</strong>g> qualitatively predicting the observed trends in heat<br />
release rate, flame <str<strong>on</strong>g>spread</str<strong>on</strong>g> rate and heat fluxes measured in the experiments. This report will describe the<br />
progress that has been made to date <strong>on</strong> modeling <str<strong>on</strong>g>fire</str<strong>on</strong>g> growth and <str<strong>on</strong>g>spread</str<strong>on</strong>g> <strong>on</strong> <strong>polyurethane</strong> <strong>foam</strong> <strong>slabs</strong> and<br />
the comparis<strong>on</strong> <str<strong>on</strong>g>of</str<strong>on</strong>g> these results with experimental data.<br />
INTRODUCTION<br />
U.S. residential <str<strong>on</strong>g>fire</str<strong>on</strong>g> statistics [1] indicate that thermoplastic objects such as upholstered chairs<br />
and mattresses (comm<strong>on</strong> household items) are most relevant to the goal <str<strong>on</strong>g>of</str<strong>on</strong>g> reducing <str<strong>on</strong>g>fire</str<strong>on</strong>g> losses. Flexible<br />
<strong>polyurethane</strong> <strong>foam</strong> (PUF) is <str<strong>on</strong>g>of</str<strong>on</strong>g>ten found as the s<str<strong>on</strong>g>of</str<strong>on</strong>g>t cushi<strong>on</strong>ing in upholstered chairs and in mattresses.<br />
The <strong>foam</strong> that is found in these objects is a low density sp<strong>on</strong>ge-like material and is usually covered with a<br />
face cloth. Modeling <str<strong>on</strong>g>fire</str<strong>on</strong>g> growth and <str<strong>on</strong>g>spread</str<strong>on</strong>g> <strong>on</strong> such objects is difficult since the <strong>polyurethane</strong> <strong>foam</strong><br />
decomposes to yield a melt layer, when burning under realistic <str<strong>on</strong>g>fire</str<strong>on</strong>g> c<strong>on</strong>diti<strong>on</strong>s. This is usually<br />
accompanied by a dramatic reducti<strong>on</strong> in the thickness <str<strong>on</strong>g>of</str<strong>on</strong>g> the <strong>foam</strong> (sometime referred to as <strong>foam</strong><br />
collapse). A detailed <str<strong>on</strong>g>fire</str<strong>on</strong>g> growth model also requires input <strong>on</strong> thermo-physical properties, kinetics <str<strong>on</strong>g>of</str<strong>on</strong>g><br />
degradati<strong>on</strong> and gasificati<strong>on</strong> <str<strong>on</strong>g>of</str<strong>on</strong>g> the individual comp<strong>on</strong>ents that make up the burning object. The material<br />
properties <str<strong>on</strong>g>of</str<strong>on</strong>g> these objects are <str<strong>on</strong>g>of</str<strong>on</strong>g>ten poorly characterized and are not readily available for modeling. The<br />
l<strong>on</strong>g term objective <str<strong>on</strong>g>of</str<strong>on</strong>g> this study is to quantitatively understand <str<strong>on</strong>g>fire</str<strong>on</strong>g> growth and <str<strong>on</strong>g>spread</str<strong>on</strong>g> <strong>on</strong> real objects,<br />
although the focus <str<strong>on</strong>g>of</str<strong>on</strong>g> this paper is limited to modeling flame <str<strong>on</strong>g>spread</str<strong>on</strong>g> <strong>on</strong> <strong>polyurethane</strong> <strong>foam</strong> <strong>slabs</strong>, by<br />
1 Corresp<strong>on</strong>ding Author : Email – kuldeep.prasad@nist.gov
performing <str<strong>on</strong>g>numerical</str<strong>on</strong>g> <str<strong>on</strong>g>simulati<strong>on</strong></str<strong>on</strong>g>s using the Fire Dynamics Simulator (FDS) and comparing model<br />
predicti<strong>on</strong>s with available experimental data.<br />
MATERIAL PROPERTY ESTIMATION FROM SMALL SCALE EXPERIMENTS<br />
In order to capture the various physical and chemical processes occurring during the<br />
decompositi<strong>on</strong> <str<strong>on</strong>g>of</str<strong>on</strong>g> <strong>polyurethane</strong> <strong>foam</strong> and subsequently use that informati<strong>on</strong> in flame <str<strong>on</strong>g>spread</str<strong>on</strong>g> models, it is<br />
critical to understand how <strong>polyurethane</strong> is created. Polyurethane <strong>foam</strong> is formed out <str<strong>on</strong>g>of</str<strong>on</strong>g> a reacti<strong>on</strong> <str<strong>on</strong>g>of</str<strong>on</strong>g> an<br />
isocyanate (typically, toluene diisocynate or TDI) with a polyol [2]. The isocyanate and the polyol form<br />
the major comp<strong>on</strong>ents <str<strong>on</strong>g>of</str<strong>on</strong>g> all <strong>polyurethane</strong> <strong>foam</strong>. Commercial <strong>foam</strong> may c<strong>on</strong>tain eight different<br />
ingredients, including these two plus catalysts, blowing agents, surfactants and <str<strong>on</strong>g>fire</str<strong>on</strong>g> retardants. The<br />
physical properties can be widely varied by adjusting the nature and proporti<strong>on</strong>s <str<strong>on</strong>g>of</str<strong>on</strong>g> these many<br />
ingredients. All <str<strong>on</strong>g>of</str<strong>on</strong>g> these in turn affect the details <str<strong>on</strong>g>of</str<strong>on</strong>g> the <str<strong>on</strong>g>fire</str<strong>on</strong>g> behavior <str<strong>on</strong>g>of</str<strong>on</strong>g> <strong>polyurethane</strong> <strong>foam</strong>s. Thermal<br />
stability <str<strong>on</strong>g>of</str<strong>on</strong>g> the various materials that make up the <strong>foam</strong> can have an important effect <strong>on</strong> their igniti<strong>on</strong> and<br />
flammability. The <strong>foam</strong> used for the small scale laboratory tests, as well as the large scale experiments<br />
with which the <str<strong>on</strong>g>numerical</str<strong>on</strong>g> <str<strong>on</strong>g>simulati<strong>on</strong></str<strong>on</strong>g>s will be compared in the current paper, can best be described as a<br />
commercially available flexible poly-ether <strong>polyurethane</strong> <strong>foam</strong> similar to, but not exactly like the special<br />
reference material GM 21 [3]. For comparis<strong>on</strong> purposes <strong>on</strong>ly, a summary <str<strong>on</strong>g>of</str<strong>on</strong>g> the chemical and physical<br />
informati<strong>on</strong> for material GM 21 can be found in [3].<br />
Thermal decompositi<strong>on</strong> and decompositi<strong>on</strong> kinetics <str<strong>on</strong>g>of</str<strong>on</strong>g> different <strong>polyurethane</strong> <strong>foam</strong>s and elastomers have<br />
been studied extensively in the literature for many years [4,5,6,7]. Since <strong>foam</strong> formulati<strong>on</strong>s can vary<br />
significantly, thermal decompositi<strong>on</strong> analysis was performed <strong>on</strong> the specific <strong>foam</strong> samples used in the<br />
flame <str<strong>on</strong>g>spread</str<strong>on</strong>g> experiments (as discussed later in the modeling secti<strong>on</strong>) with a Pyris-1 thermogravimetry<br />
(TG) apparatus. A c<strong>on</strong>stant sample mass <str<strong>on</strong>g>of</str<strong>on</strong>g> ~10 mg (powder) was used in all experiments (three replicates<br />
at three different heating rates). The TG tests were performed in a transient envir<strong>on</strong>ment with nitrogen at<br />
a flow rate <str<strong>on</strong>g>of</str<strong>on</strong>g> 30 ml/min. The TG curves for polyether-<strong>polyurethane</strong> <strong>foam</strong> (used in the current study)<br />
under the heating rate <str<strong>on</strong>g>of</str<strong>on</strong>g> 5 o C/min (left) and 10 o C/min (right) in nitrogen are shown in Figure 1. Results<br />
indicate that there are two distinct stages <str<strong>on</strong>g>of</str<strong>on</strong>g> decompositi<strong>on</strong> for PUF in a nitrogen envir<strong>on</strong>ment. In the first<br />
stage, approximately 34.5 % <str<strong>on</strong>g>of</str<strong>on</strong>g> the sample mass was lost in a temperature range <str<strong>on</strong>g>of</str<strong>on</strong>g> 250 o C to 310 o C,<br />
while in the sec<strong>on</strong>d stage, 65.5 % <str<strong>on</strong>g>of</str<strong>on</strong>g> mass was lost at higher temperature from 340 o C to 380 o C. The<br />
mass loss rate curve peaks at 280 o C and 362 o C for the first and sec<strong>on</strong>d stages respectively. As the<br />
heating rate increases, the peak value <str<strong>on</strong>g>of</str<strong>on</strong>g> the mass loss rate increases significantly for the first stage and to<br />
a small extent for the sec<strong>on</strong>d stage. Mass loss rate peaks shift to higher temperatures as the heating rate<br />
increases.<br />
TG measurement, when combined with observati<strong>on</strong>s <str<strong>on</strong>g>of</str<strong>on</strong>g> the physical structure <str<strong>on</strong>g>of</str<strong>on</strong>g> the <strong>foam</strong> [4] during the<br />
decompositi<strong>on</strong> process (as obtained from a rheometer test [4]), can provide an important input for<br />
<str<strong>on</strong>g>numerical</str<strong>on</strong>g> modeling and <str<strong>on</strong>g>simulati<strong>on</strong></str<strong>on</strong>g> <str<strong>on</strong>g>of</str<strong>on</strong>g> flame <str<strong>on</strong>g>spread</str<strong>on</strong>g> <strong>on</strong> large <strong>foam</strong> <strong>slabs</strong>. Rheometer tests indicate that the<br />
<strong>on</strong>set <str<strong>on</strong>g>of</str<strong>on</strong>g> physical collapse <str<strong>on</strong>g>of</str<strong>on</strong>g> the <strong>foam</strong> is closely related to the first weight loss peak, and that this is<br />
essentially the temperature at which the <strong>foam</strong> appears to melt. The <strong>foam</strong> is a cross-linked polymer and the<br />
polymer b<strong>on</strong>ds must be broken for any melting / collapse to occur. Understanding the decompositi<strong>on</strong> <str<strong>on</strong>g>of</str<strong>on</strong>g><br />
PUF can be difficult because the type <str<strong>on</strong>g>of</str<strong>on</strong>g> b<strong>on</strong>ds and their number can vary with <strong>foam</strong> formulati<strong>on</strong>. Ravey<br />
and Pearce [5] have explained that decompositi<strong>on</strong> <str<strong>on</strong>g>of</str<strong>on</strong>g> PUF involves breaking <str<strong>on</strong>g>of</str<strong>on</strong>g> biuret and allophanate<br />
b<strong>on</strong>ds at temperatures below 200 o C, however these b<strong>on</strong>ds do not exist in significant proporti<strong>on</strong>s in most<br />
PUF. The urethane and urea b<strong>on</strong>ds break above 200 o C and regenerate toluene diisocynate (TDI) al<strong>on</strong>g<br />
with the original polyol. Depolymerizati<strong>on</strong> chemistry [5-7] indicates that the TDI boils at about 250 o C,<br />
while the polyol is left behind and forms a melt pool. Polyol itself degrades at much higher temperatures<br />
<str<strong>on</strong>g>of</str<strong>on</strong>g> 320-350 o C. The first peak in the mass loss rate curve is thus attributed to the release <str<strong>on</strong>g>of</str<strong>on</strong>g> TDI (escaping<br />
in the form <str<strong>on</strong>g>of</str<strong>on</strong>g> toluene diamine), while the sec<strong>on</strong>d peak is associated with the decompositi<strong>on</strong> <str<strong>on</strong>g>of</str<strong>on</strong>g> polyol.<br />
Note that <strong>foam</strong>s are typically formed out <str<strong>on</strong>g>of</str<strong>on</strong>g> a reacti<strong>on</strong> between TDI and polyol and that most formulati<strong>on</strong>s
c<strong>on</strong>tain approximately 33 % by mass <str<strong>on</strong>g>of</str<strong>on</strong>g> TDI, 66 % by mass <str<strong>on</strong>g>of</str<strong>on</strong>g> polyol and 1 % <str<strong>on</strong>g>of</str<strong>on</strong>g> other additives. This<br />
again is c<strong>on</strong>sistent with TG data, where the mass lost during the first and sec<strong>on</strong>d stage were 34.5 % and<br />
65.5 % respectively.<br />
Figure 1. TG and DTG curves <str<strong>on</strong>g>of</str<strong>on</strong>g> <strong>polyurethane</strong> <strong>foam</strong> in nitrogen envir<strong>on</strong>ment at heating rates <str<strong>on</strong>g>of</str<strong>on</strong>g> 5 o C/min<br />
(left) and 10 o C/min (right).<br />
Kinetic parameters governing the thermal degradati<strong>on</strong> <str<strong>on</strong>g>of</str<strong>on</strong>g> PUF required for the subsequent <str<strong>on</strong>g>numerical</str<strong>on</strong>g><br />
modeling were obtained using TG data and genetic algorithms [8]. TG tests were performed in an air<br />
envir<strong>on</strong>ment as well, but <strong>on</strong>ly the data from tests performed in nitrogen (Figure 1) were used in the<br />
subsequent analysis. Since the goal is to model flame <str<strong>on</strong>g>spread</str<strong>on</strong>g> <strong>on</strong> large <strong>foam</strong> <strong>slabs</strong>, it is expected that the<br />
ambient oxygen is c<strong>on</strong>sumed in the flame and will not be available for oxidative decompositi<strong>on</strong>. As a<br />
result <strong>on</strong>ly thermal decompositi<strong>on</strong> <str<strong>on</strong>g>of</str<strong>on</strong>g> the <strong>foam</strong> is c<strong>on</strong>sidered in this study and TG tests performed in a<br />
nitrogen envir<strong>on</strong>ment are suitable for this purpose. Arrhenius type reacti<strong>on</strong> rate parameters were fitted<br />
using the GPYRO s<str<strong>on</strong>g>of</str<strong>on</strong>g>tware [8, 9] for the two step mechanism (the first involving breaking <str<strong>on</strong>g>of</str<strong>on</strong>g> the<br />
<strong>polyurethane</strong> b<strong>on</strong>d and vaporizati<strong>on</strong> <str<strong>on</strong>g>of</str<strong>on</strong>g> TDI, while the sec<strong>on</strong>d involves decompositi<strong>on</strong> <str<strong>on</strong>g>of</str<strong>on</strong>g> the liquid<br />
polyol) as suggested by TG data, as listed in Table 1. The parameters can be used to obtain the rate <str<strong>on</strong>g>of</str<strong>on</strong>g><br />
decompositi<strong>on</strong> using the expressi<strong>on</strong>,<br />
d(<br />
m / m0<br />
) E<br />
n<br />
= Aexp(<br />
− )( m / m0<br />
)<br />
dt<br />
RT<br />
where, m is the instantaneous mass <str<strong>on</strong>g>of</str<strong>on</strong>g> the sample, m 0 is the original mass, A is the pre-exp<strong>on</strong>ential<br />
factor, E is the activati<strong>on</strong> energy and n is the reacti<strong>on</strong> order. See Equati<strong>on</strong> 3.87 in [10] for more<br />
details <strong>on</strong> the reacti<strong>on</strong> rate expressi<strong>on</strong> where the Arrhenius parameters are used.<br />
Table 1. Kinetic parameters for thermal decompositi<strong>on</strong> <str<strong>on</strong>g>of</str<strong>on</strong>g> PUF derived from TG data<br />
Pre-exp<strong>on</strong>ential factor A Activati<strong>on</strong> Energy E Temperature Exp<strong>on</strong>ent n<br />
(1/s)<br />
(kJ/kmole)<br />
Reacti<strong>on</strong> 1 1.686E8 135000 1.00<br />
Reacti<strong>on</strong> 2 8.746E9 175000 1.16<br />
The microcalorimetric measurements were performed <strong>on</strong> a pyrolysis combusti<strong>on</strong> flow calorimeter<br />
(PCFC) to obtain heat release rates for the first and sec<strong>on</strong>d stage reacti<strong>on</strong>s. Tests were performed in<br />
triplicate <strong>on</strong> ~1 mg sample at a heating rate <str<strong>on</strong>g>of</str<strong>on</strong>g> 20 o C/s. The raw data as shown in Figure 2 shows the heat<br />
release rate (Watts per gram <str<strong>on</strong>g>of</str<strong>on</strong>g> virgin material) plotted as a functi<strong>on</strong> <str<strong>on</strong>g>of</str<strong>on</strong>g> time. The two stage behavior
c<strong>on</strong>sistent with TG data was again observed in the microcalorimeter measurements. After a baseline shift<br />
correcti<strong>on</strong>, the area under the curve was integrated to obtain an average heat release <str<strong>on</strong>g>of</str<strong>on</strong>g> 9,600 kJ/kg and<br />
17,500 kJ/kg for the first and sec<strong>on</strong>d stage respectively, with a total heat release <str<strong>on</strong>g>of</str<strong>on</strong>g> 27,100 kJ/kg (per kg<br />
<str<strong>on</strong>g>of</str<strong>on</strong>g> original <strong>foam</strong>). The TG mass loss data can be combined with microcalorimeter data to obtain heat<br />
release rates per kg <str<strong>on</strong>g>of</str<strong>on</strong>g> gases released.<br />
Figure 2. Microcalorimeter raw data (three replicates) indicating the two stage behavior as seen in the<br />
heat release rate vs. time pr<str<strong>on</strong>g>of</str<strong>on</strong>g>ile for <strong>polyurethane</strong> <strong>foam</strong> samples.<br />
C<strong>on</strong>e calorimeter experiments were c<strong>on</strong>ducted using the original prototype <str<strong>on</strong>g>of</str<strong>on</strong>g> the c<strong>on</strong>e calorimeter, <strong>on</strong><br />
100 mm square <strong>polyurethane</strong> <strong>foam</strong> samples at flux levels ranging from 20 kW/m 2 -50 kW/m 2 . The test<br />
protocol detailed in ASTM E 1354 was used in the experiments. The primary result <str<strong>on</strong>g>of</str<strong>on</strong>g> a c<strong>on</strong>e calorimeter<br />
test was a measurement <str<strong>on</strong>g>of</str<strong>on</strong>g> the heat release rate (derived from oxygen c<strong>on</strong>sumpti<strong>on</strong> calorimetry) as a<br />
functi<strong>on</strong> <str<strong>on</strong>g>of</str<strong>on</strong>g> time. The mass loss <str<strong>on</strong>g>of</str<strong>on</strong>g> the burning specimen was also recorded in the c<strong>on</strong>e calorimeter test.<br />
Figure 3 shows the heat release rate (kW/m 2 ) and sample mass plotted as a functi<strong>on</strong> <str<strong>on</strong>g>of</str<strong>on</strong>g> time for an<br />
external heat flux <str<strong>on</strong>g>of</str<strong>on</strong>g> 45 kW/m 2 . Data indicates that the pyrolysis process and burning <str<strong>on</strong>g>of</str<strong>on</strong>g> the <strong>foam</strong> slab is a<br />
two stage process as previously noted. The first stage lasts for approximately 40 sec<strong>on</strong>ds, during which<br />
the heat release rate goes from zero to a peak value <str<strong>on</strong>g>of</str<strong>on</strong>g> 300 kW/m 2 . During this stage the mass <str<strong>on</strong>g>of</str<strong>on</strong>g> the<br />
sample decreases gradually, and approximately <strong>on</strong>e third <str<strong>on</strong>g>of</str<strong>on</strong>g> the mass is lost. Video observati<strong>on</strong>s <str<strong>on</strong>g>of</str<strong>on</strong>g> the<br />
test sample indicate that the <strong>foam</strong> has collapsed at the end <str<strong>on</strong>g>of</str<strong>on</strong>g> the first stage and a liquid melt layer is left<br />
at the bottom <str<strong>on</strong>g>of</str<strong>on</strong>g> the pan. During the sec<strong>on</strong>d stage, the heat release rate increases dramatically to over 800<br />
kW/m 2 followed by a decay phase. From the heat release rate and mass loss rate, the effective heat <str<strong>on</strong>g>of</str<strong>on</strong>g><br />
combusti<strong>on</strong> (heat release per unit mass) was calculated and was found to compare favorably with the<br />
microcalorimeter data. The heat <str<strong>on</strong>g>of</str<strong>on</strong>g> gasificati<strong>on</strong> was also derived from the c<strong>on</strong>e data using the methods<br />
proposed by Dill<strong>on</strong> et al. [12] and Janssen et al. [13]. Since the external flux in the c<strong>on</strong>e experiments is<br />
comparable to that measured in the flame <str<strong>on</strong>g>spread</str<strong>on</strong>g> experiments, the heat release rate measured in the c<strong>on</strong>e<br />
calorimeter experiments can be used directly in the models as discussed in the next secti<strong>on</strong>.<br />
Thermo-physical properties <str<strong>on</strong>g>of</str<strong>on</strong>g> <strong>foam</strong> (density, thermal c<strong>on</strong>ductivity and specific heat) are needed to model<br />
the burning process. The density <str<strong>on</strong>g>of</str<strong>on</strong>g> <strong>foam</strong> was measured to be 23.5 kg/m 3 . However, no direct<br />
measurements were made for temperature dependent thermal c<strong>on</strong>ductivity and specific heat for the <strong>foam</strong><br />
used in the current study. Instead, temperature independent values for a generic <strong>foam</strong> formulati<strong>on</strong> were<br />
obtained from literature [14, 15]. Thermo-physical properties <str<strong>on</strong>g>of</str<strong>on</strong>g> polyether polyol (obtained during the<br />
melt phase) were not directly measured, instead properties <str<strong>on</strong>g>of</str<strong>on</strong>g> VORANOL 235-056 were obtained [16]<br />
and used in the flame <str<strong>on</strong>g>spread</str<strong>on</strong>g> modeling. Radiati<strong>on</strong> is the dominant mode <str<strong>on</strong>g>of</str<strong>on</strong>g> heat transfer in the gas phase
and optical properties such as emissivity and absorpti<strong>on</strong> coefficient for both <strong>foam</strong> and polyol were<br />
estimated from published literature [17]. Properties used in the flame <str<strong>on</strong>g>spread</str<strong>on</strong>g> <str<strong>on</strong>g>simulati<strong>on</strong></str<strong>on</strong>g>s are listed in<br />
Table 2.<br />
Figure 3. C<strong>on</strong>e calorimetry data (three replicates) for a 10 x 10 cm sample <str<strong>on</strong>g>of</str<strong>on</strong>g> <strong>polyurethane</strong> <strong>foam</strong> subjected<br />
to a heat flux <str<strong>on</strong>g>of</str<strong>on</strong>g> 45 kW/m 2 (n<strong>on</strong> piloted case). Heat release rate (left) and mass loss (right) are plotted as a<br />
functi<strong>on</strong> <str<strong>on</strong>g>of</str<strong>on</strong>g> time (with three replicates), indicating the two stage behavior.<br />
NUMERICAL MODELING OF PYROLYSIS ON POLYURETHANE FOAM SLABS<br />
Simulati<strong>on</strong>s <str<strong>on</strong>g>of</str<strong>on</strong>g> flame <str<strong>on</strong>g>spread</str<strong>on</strong>g> <strong>on</strong> <strong>polyurethane</strong> <strong>foam</strong> <strong>slabs</strong> have been performed using the NIST<br />
Fire Dynamics Simulator (FDS). FDS is a low Mach number CFD (computati<strong>on</strong>al fluid dynamics)<br />
s<str<strong>on</strong>g>of</str<strong>on</strong>g>tware suitable for modeling <str<strong>on</strong>g>fire</str<strong>on</strong>g>s, that has been used extensively by <str<strong>on</strong>g>fire</str<strong>on</strong>g> protecti<strong>on</strong> engineers for <str<strong>on</strong>g>fire</str<strong>on</strong>g><br />
modeling and forensic analysis. Over a period <str<strong>on</strong>g>of</str<strong>on</strong>g> six m<strong>on</strong>ths, hundreds <str<strong>on</strong>g>of</str<strong>on</strong>g> FDS <str<strong>on</strong>g>simulati<strong>on</strong></str<strong>on</strong>g>s were<br />
performed with models <str<strong>on</strong>g>of</str<strong>on</strong>g> various levels <str<strong>on</strong>g>of</str<strong>on</strong>g> complexity. Simulati<strong>on</strong>s included <strong>on</strong>e-dimensi<strong>on</strong>al models<br />
which are computati<strong>on</strong>ally inexpensive, as well as two and three-dimensi<strong>on</strong>al models running <strong>on</strong> multiple<br />
processors. Various strategies were developed to model the solid phase and compare predicted results<br />
with observed flame <str<strong>on</strong>g>spread</str<strong>on</strong>g> rate and heat release measured in the experiments. Sensitivity to input<br />
parameters was determined and the effect <str<strong>on</strong>g>of</str<strong>on</strong>g> initial c<strong>on</strong>diti<strong>on</strong>s, burner c<strong>on</strong>figurati<strong>on</strong>, boundary c<strong>on</strong>diti<strong>on</strong>s<br />
and grid resoluti<strong>on</strong> was ascertained. In the following secti<strong>on</strong>, we will describe how the modeling <str<strong>on</strong>g>of</str<strong>on</strong>g><br />
<strong>polyurethane</strong> <strong>foam</strong> <strong>slabs</strong> has evolved over the past few m<strong>on</strong>ths.<br />
Pyrolysis Model #1<br />
The first attempt at modeling flame <str<strong>on</strong>g>spread</str<strong>on</strong>g> <strong>on</strong> large <strong>slabs</strong> <str<strong>on</strong>g>of</str<strong>on</strong>g> PUF assumed that the heat release rate<br />
history <str<strong>on</strong>g>of</str<strong>on</strong>g> a solid element was identical to that measured from the c<strong>on</strong>e calorimeter or other small scale<br />
tests. This approach is <strong>on</strong>e that is used comm<strong>on</strong>ly by the <str<strong>on</strong>g>fire</str<strong>on</strong>g> protecti<strong>on</strong> engineers [18]. In this model, the<br />
burning rate <str<strong>on</strong>g>of</str<strong>on</strong>g> the <strong>polyurethane</strong> <strong>foam</strong> (modeled as a homogenous material) was c<strong>on</strong>trolled by specifying<br />
the heat release rate per unit area obtained directly from the c<strong>on</strong>e calorimeter tests. An igniti<strong>on</strong><br />
temperature can be specified to delay burning until this specified temperature is reached in the solid. The<br />
mass flux at the <strong>foam</strong> surface is computed by dividing the heat release by the heat <str<strong>on</strong>g>of</str<strong>on</strong>g> combusti<strong>on</strong>. The<br />
advantage <str<strong>on</strong>g>of</str<strong>on</strong>g> this approach is that the user does not need to specify parameters associated with the<br />
decompositi<strong>on</strong> kinetics, and that the c<strong>on</strong>e data can be directly used in the <str<strong>on</strong>g>simulati<strong>on</strong></str<strong>on</strong>g>s. The computed<br />
burning rates however are independent <str<strong>on</strong>g>of</str<strong>on</strong>g> the external flux <strong>on</strong> the surface, which can lead to significant<br />
errors, if the object is part <str<strong>on</strong>g>of</str<strong>on</strong>g> a building <str<strong>on</strong>g>fire</str<strong>on</strong>g>. Since during the c<strong>on</strong>e tests, heat release rate and mass loss
ate vary with the intensity <str<strong>on</strong>g>of</str<strong>on</strong>g> the external flux, it is difficult to determine, a priori, which heat release rate<br />
curve (from the c<strong>on</strong>e data) should be used in the flame <str<strong>on</strong>g>spread</str<strong>on</strong>g> <str<strong>on</strong>g>simulati<strong>on</strong></str<strong>on</strong>g>s.<br />
Pyrolysis Model #2<br />
A more complete predictive capability is needed, where the burning rate would be computed in the<br />
<str<strong>on</strong>g>simulati<strong>on</strong></str<strong>on</strong>g>, instead <str<strong>on</strong>g>of</str<strong>on</strong>g> being dialed in from the c<strong>on</strong>e calorimeter data as in Pyrolysis Model #1. The<br />
parameters for solid phase reacti<strong>on</strong> are specified to model the burning rate <str<strong>on</strong>g>of</str<strong>on</strong>g> PUF decompositi<strong>on</strong>. In this<br />
model, the <strong>foam</strong> is again modeled as a homogeneous material and a single solid phase decompositi<strong>on</strong><br />
reacti<strong>on</strong> c<strong>on</strong>trols the burning rate. A heat <str<strong>on</strong>g>of</str<strong>on</strong>g> reacti<strong>on</strong> value accounts for the energy that is used to vaporize<br />
the fuel. When <strong>foam</strong> decomposes, fuel gases are produced, which in turn undergo gas phase combusti<strong>on</strong><br />
to form products. In this approach, a multi-layered model was used the <strong>foam</strong> slab resting <strong>on</strong> a 1” thick<br />
gypsum board slab, modeled as an inert layer <str<strong>on</strong>g>of</str<strong>on</strong>g> material. This model does not have the capability to<br />
predict the two step process (observed in the TG data as well as the c<strong>on</strong>e experiments) where the <strong>foam</strong><br />
collapses and melts releasing TDI during the first stage and the polyol decomposes during the sec<strong>on</strong>d<br />
stage).<br />
Pyrolysis Model #3<br />
In order to capture the two stage behavior that was observed in the experiments, the approach (described<br />
in Pyrolysis Model #2) was modified such that the <strong>foam</strong> decompositi<strong>on</strong> was modeled as a two step<br />
process. In the first step, <strong>foam</strong> decomposes to release TDI gases and liquid polyol, while during the<br />
sec<strong>on</strong>d step, polyol vaporizes into fuel gases, which in-turn undergoes exothermic gas phase combusti<strong>on</strong>.<br />
This multi-material model can capture the two step process that is observed in the TG data and the c<strong>on</strong>e<br />
tests, but requires additi<strong>on</strong>al Arrhenius kinetic parameters, heats <str<strong>on</strong>g>of</str<strong>on</strong>g> gasificati<strong>on</strong> and heat <str<strong>on</strong>g>of</str<strong>on</strong>g> combusti<strong>on</strong><br />
for the two step reacti<strong>on</strong>. Implementati<strong>on</strong> <str<strong>on</strong>g>of</str<strong>on</strong>g> this model within FDS versi<strong>on</strong> 5.2 is difficult due to the large<br />
differences in the densities <str<strong>on</strong>g>of</str<strong>on</strong>g> <strong>foam</strong> and polyol (23.5 and 1012.0 kg/m 3 respectively). Visual observati<strong>on</strong>s<br />
during the tests reveal that during the melting/collapse phase, tiny beads <str<strong>on</strong>g>of</str<strong>on</strong>g> polyol were formed <strong>on</strong> the<br />
surface <str<strong>on</strong>g>of</str<strong>on</strong>g> the <strong>foam</strong>. The surface area occupied by these tiny beads <str<strong>on</strong>g>of</str<strong>on</strong>g> polyol is small compared to that <str<strong>on</strong>g>of</str<strong>on</strong>g><br />
the <strong>foam</strong> (due to the very high density ratio between polyol and <strong>foam</strong>) and as a result the <strong>foam</strong> c<strong>on</strong>tinues<br />
to melt and collapse, while releasing TDI. At some point, all the TDI has been release and the <strong>foam</strong><br />
collapses resulting in a polyol melt layer whose thickness is much smaller than that <str<strong>on</strong>g>of</str<strong>on</strong>g> the <strong>foam</strong>. The<br />
current FDS versi<strong>on</strong> does not have the capability to model this multiphase behavior (i.e. the polyol is<br />
distributed uniformly, not beaded) and it moreover, assumes a <strong>on</strong>e-dimensi<strong>on</strong>al solid phase model. This<br />
limitati<strong>on</strong> in modeling capability results in the c<strong>on</strong>versi<strong>on</strong> <str<strong>on</strong>g>of</str<strong>on</strong>g> the cells c<strong>on</strong>sisting <str<strong>on</strong>g>of</str<strong>on</strong>g> <strong>foam</strong> into polyol. The<br />
cells c<strong>on</strong>taining polyol are now directly heated by the <str<strong>on</strong>g>fire</str<strong>on</strong>g>. As a result, in the model, the cells c<strong>on</strong>taining<br />
polyol decompose and vaporize before all the TDI has been released. This approach is therefore not<br />
suitable since it would c<strong>on</strong>tradict the observati<strong>on</strong>s made from the TG test data, rheometer tests and video<br />
observati<strong>on</strong>s during a c<strong>on</strong>e test.<br />
Pyrolysis Model #4<br />
The flame <str<strong>on</strong>g>spread</str<strong>on</strong>g> model for <strong>polyurethane</strong> <strong>foam</strong> <strong>slabs</strong> was modified again to overcome some <str<strong>on</strong>g>of</str<strong>on</strong>g> the<br />
problems that were identified with the previous approach (Pyrolysis Model #3). C<strong>on</strong>e calorimeter data as<br />
well as TG data indicates that approximately <strong>on</strong>e-third <str<strong>on</strong>g>of</str<strong>on</strong>g> the <strong>foam</strong> decomposes and releases TDI, while<br />
the remaining <strong>foam</strong> collapses and forms liquid polyol. The c<strong>on</strong>e tests further indicate that the polyol<br />
mainly burns after the TDI has been released. These two important observati<strong>on</strong>s al<strong>on</strong>g with the fact that<br />
the <str<strong>on</strong>g>numerical</str<strong>on</strong>g> tools are currently unable to model collapse <str<strong>on</strong>g>of</str<strong>on</strong>g> the <strong>foam</strong> led to the development <str<strong>on</strong>g>of</str<strong>on</strong>g> the new<br />
model. In this model, the <strong>foam</strong> slab resting <strong>on</strong> a gypsum board is modeled with three layers. The top most<br />
layer is assumed to release TDI <strong>on</strong>ly. Based <strong>on</strong> TG data, TDI forms approximately <strong>on</strong>e-third <str<strong>on</strong>g>of</str<strong>on</strong>g> the mass<br />
<str<strong>on</strong>g>of</str<strong>on</strong>g> the <strong>foam</strong>, and as a result the thickness <str<strong>on</strong>g>of</str<strong>on</strong>g> this layer was <strong>on</strong>e-third the thickness <str<strong>on</strong>g>of</str<strong>on</strong>g> the <strong>foam</strong> slab used in
the experiments. The layer has thermal properties <str<strong>on</strong>g>of</str<strong>on</strong>g> <strong>foam</strong> and has a reference temperature corresp<strong>on</strong>ding<br />
to the first peak <str<strong>on</strong>g>of</str<strong>on</strong>g> the chemical reacti<strong>on</strong> in the TG tests. The sec<strong>on</strong>d layer has properties <str<strong>on</strong>g>of</str<strong>on</strong>g> liquid polyol.<br />
The thickness <str<strong>on</strong>g>of</str<strong>on</strong>g> this layer accounts for the density differences between the <strong>foam</strong> and the polyol and the<br />
fact that <strong>on</strong>ly two thirds <str<strong>on</strong>g>of</str<strong>on</strong>g> the <strong>foam</strong> produces liquid polyol. Both the <strong>foam</strong> layers and the polyol layers<br />
are assigned a heat <str<strong>on</strong>g>of</str<strong>on</strong>g> combusti<strong>on</strong> value, obtained from microcalorimeter data and c<strong>on</strong>e tests. The kinetic<br />
parameters were obtained from TG data. The bottom most layer c<strong>on</strong>sists <str<strong>on</strong>g>of</str<strong>on</strong>g> a n<strong>on</strong>-reacting 2.5 cm thick<br />
slab <str<strong>on</strong>g>of</str<strong>on</strong>g> gypsum board. As the <strong>foam</strong> (top layer) is heated, the <strong>foam</strong> will decompose and release TDI.<br />
When all the <strong>foam</strong> is c<strong>on</strong>sumed, the liquid polyol will heat up and undergo decompositi<strong>on</strong>.<br />
Pyrolysis model #2, 3 and 4 were used to simulate a c<strong>on</strong>e experiment using a 1-D model. Figure 4 shows<br />
the results <str<strong>on</strong>g>of</str<strong>on</strong>g> the c<strong>on</strong>e <str<strong>on</strong>g>simulati<strong>on</strong></str<strong>on</strong>g>s for model #2 (top right sub-figure), model #3 (bottom left sub-figure)<br />
and model #4 (bottom right sub-figure). Since the 1-D <str<strong>on</strong>g>simulati<strong>on</strong></str<strong>on</strong>g>s did not include a gas phase, an external<br />
flux value <str<strong>on</strong>g>of</str<strong>on</strong>g> 85 kW/m 2 was used. Note that the c<strong>on</strong>e data used an external flux value <str<strong>on</strong>g>of</str<strong>on</strong>g> 45 kW/m 2 , but an<br />
additi<strong>on</strong>al 40 kW/m 2 was applied to simulate the flux from the flame (as observed in the flame <str<strong>on</strong>g>spread</str<strong>on</strong>g><br />
experiments). Performing c<strong>on</strong>e <str<strong>on</strong>g>simulati<strong>on</strong></str<strong>on</strong>g>s in a nitrogen envir<strong>on</strong>ment would be very helpful in comparing<br />
the various models, since it would remove the complexity associated with burning in the gas phase. A<br />
qualitative comparis<strong>on</strong> <str<strong>on</strong>g>of</str<strong>on</strong>g> the results with c<strong>on</strong>e data (Figure 4 top left sub-figure) indicates that <strong>on</strong>ly<br />
pyrolysis model #4 can replicate the two stage behavior. As a result the flame <str<strong>on</strong>g>spread</str<strong>on</strong>g> <str<strong>on</strong>g>simulati<strong>on</strong></str<strong>on</strong>g>s<br />
(discussed in the next secti<strong>on</strong>) were performed with pyrolysis model #4.<br />
Figure 4. Comparis<strong>on</strong> <str<strong>on</strong>g>of</str<strong>on</strong>g> mass vs. time plots measure in a c<strong>on</strong>e experiment (top left sub-figure), with 1-D<br />
<str<strong>on</strong>g>simulati<strong>on</strong></str<strong>on</strong>g>s performed using pyrolysis model #2 (top right sub-figure), model #3 (bottom left sub-figure)<br />
and model #4 (bottom right sub-figure).<br />
C<strong>on</strong>e Measurement Pyrolysis Model #2<br />
Pyrolysis Model #3 Pyrolysis Model #4
Comparis<strong>on</strong> <str<strong>on</strong>g>of</str<strong>on</strong>g> Numerical Predicti<strong>on</strong>s with Experimental Measurements <strong>on</strong> Flame Spread<br />
Numerical <str<strong>on</strong>g>simulati<strong>on</strong></str<strong>on</strong>g>s were performed using the NIST Fire Dynamics Simulator (FDS) s<str<strong>on</strong>g>of</str<strong>on</strong>g>tware<br />
to study flame <str<strong>on</strong>g>spread</str<strong>on</strong>g> <strong>on</strong> large <strong>slabs</strong> <str<strong>on</strong>g>of</str<strong>on</strong>g> 10 cm thick <strong>polyurethane</strong> <strong>foam</strong> [10, 19]. Material property data<br />
was derived from the laboratory scale experiments (Table 1 and Table 2) and the approach for modeling<br />
the c<strong>on</strong>densed phase was as discussed in the previous secti<strong>on</strong>. The degree <str<strong>on</strong>g>of</str<strong>on</strong>g> complexity in the<br />
<str<strong>on</strong>g>simulati<strong>on</strong></str<strong>on</strong>g>s has evolved gradually over a period <str<strong>on</strong>g>of</str<strong>on</strong>g> six m<strong>on</strong>ths. Initially very simple 1-D <str<strong>on</strong>g>simulati<strong>on</strong></str<strong>on</strong>g>s were<br />
performed to simulate a c<strong>on</strong>e experiment performed in a nitrogen envir<strong>on</strong>ment. This removes the<br />
complexity associated with combusti<strong>on</strong> in the gas phase and the heat flux back to the solid surface,<br />
instead the sample was radiated with a c<strong>on</strong>stant specified external heat flux from a radiant heater. The<br />
goal <str<strong>on</strong>g>of</str<strong>on</strong>g> these preliminary calculati<strong>on</strong>s was to understand the c<strong>on</strong>densed phase mechanisms and the role <str<strong>on</strong>g>of</str<strong>on</strong>g><br />
the various c<strong>on</strong>densed phase parameters. The 1-D <str<strong>on</strong>g>simulati<strong>on</strong></str<strong>on</strong>g>s are attractive since they are<br />
computati<strong>on</strong>ally inexpensive (CPU costs is <str<strong>on</strong>g>of</str<strong>on</strong>g> the order <str<strong>on</strong>g>of</str<strong>on</strong>g> a few minutes). 2-D <str<strong>on</strong>g>numerical</str<strong>on</strong>g> <str<strong>on</strong>g>simulati<strong>on</strong></str<strong>on</strong>g>s <str<strong>on</strong>g>of</str<strong>on</strong>g><br />
flame <str<strong>on</strong>g>spread</str<strong>on</strong>g> were c<strong>on</strong>ducted to understand the role <str<strong>on</strong>g>of</str<strong>on</strong>g> gas phase parameters and grid resoluti<strong>on</strong> <strong>on</strong> flame<br />
<str<strong>on</strong>g>spread</str<strong>on</strong>g>. The CPU time for these <str<strong>on</strong>g>simulati<strong>on</strong></str<strong>on</strong>g>s is <str<strong>on</strong>g>of</str<strong>on</strong>g> the order <str<strong>on</strong>g>of</str<strong>on</strong>g> <strong>on</strong>e day. Sensitivity studies were c<strong>on</strong>ducted<br />
with these models to identify the relative importance <str<strong>on</strong>g>of</str<strong>on</strong>g> various input parameters. Further refinements to<br />
the model were made during the course <str<strong>on</strong>g>of</str<strong>on</strong>g> 3-D <str<strong>on</strong>g>simulati<strong>on</strong></str<strong>on</strong>g>s <str<strong>on</strong>g>of</str<strong>on</strong>g> the c<strong>on</strong>e calorimeter experiments to<br />
simulate the burning <str<strong>on</strong>g>of</str<strong>on</strong>g> PUF in air. Heat release rate and burning rates were compared with experimental<br />
data. Although the results <str<strong>on</strong>g>of</str<strong>on</strong>g> these <str<strong>on</strong>g>simulati<strong>on</strong></str<strong>on</strong>g>s and comparis<strong>on</strong> with experimental data has not been<br />
reported in this paper (results will be reported elsewhere due to lack <str<strong>on</strong>g>of</str<strong>on</strong>g> space), these <str<strong>on</strong>g>simulati<strong>on</strong></str<strong>on</strong>g>s were<br />
critical in the development <str<strong>on</strong>g>of</str<strong>on</strong>g> the 3-D models that were eventually used for simulating flame <str<strong>on</strong>g>spread</str<strong>on</strong>g> <strong>on</strong><br />
large <strong>polyurethane</strong> <strong>foam</strong> <strong>slabs</strong>.<br />
Table 2. Property values for <strong>foam</strong> and polyol used in the flame <str<strong>on</strong>g>spread</str<strong>on</strong>g> <str<strong>on</strong>g>simulati<strong>on</strong></str<strong>on</strong>g>s<br />
Property<br />
Polyurethane Foam Polyol<br />
Value Source Value Source<br />
Density 23 kg/m 3 Flame <str<strong>on</strong>g>spread</str<strong>on</strong>g><br />
experiment<br />
1012 kg/m 3 Ref. [16]<br />
Heat Capacity 1 kJ/kg/K Ref. [14, 15] 2 kJ/kg/K Ref. [16]<br />
Thermal C<strong>on</strong>ductivity 0.05 W/m/K Ref. [14, 15] 0.15 W/m/K Ref. [4]<br />
Heat <str<strong>on</strong>g>of</str<strong>on</strong>g> Reacti<strong>on</strong> 1960 kJ/kg Ref. [3] , DSC 1960 kJ/kg Ref [3] , DSC<br />
Heat <str<strong>on</strong>g>of</str<strong>on</strong>g> Combusti<strong>on</strong> 9600 kJ/kg Micro- 17500 kJ/kg Microcalorimetercalorimeter<br />
Thickness 3.4 cm TGA 0.16 cm TGA<br />
Absorpti<strong>on</strong> Coefficient 50000 1/m Default 50000 1/m Default<br />
Emissivity 0.9 Default 0.9 Default<br />
The base <str<strong>on</strong>g>of</str<strong>on</strong>g> the computati<strong>on</strong>al domain used for 3-D <str<strong>on</strong>g>simulati<strong>on</strong></str<strong>on</strong>g>s <str<strong>on</strong>g>of</str<strong>on</strong>g> flame <str<strong>on</strong>g>spread</str<strong>on</strong>g> <strong>on</strong> 10 cm thick <strong>slabs</strong> <str<strong>on</strong>g>of</str<strong>on</strong>g><br />
PUF was 1.2 m x 1.2 m square ( covering the entire slab) and extended 1 m above the surface <str<strong>on</strong>g>of</str<strong>on</strong>g> the <strong>foam</strong>.<br />
Four multiple meshes were used to grid the computati<strong>on</strong>al domain above the <strong>foam</strong> slab. Each mesh was<br />
uniformly spaced in the horiz<strong>on</strong>tal directi<strong>on</strong> and the grid size in the horiz<strong>on</strong>tal directi<strong>on</strong> was 1 mm. Mesh<br />
stretching was used in the vertical directi<strong>on</strong> with very fine mesh close to the surface (minimum grid size<br />
was 1 mm). Open boundary c<strong>on</strong>diti<strong>on</strong>s were used <strong>on</strong> all faces except the bottom face which represents the<br />
PUF slab. In the <str<strong>on</strong>g>simulati<strong>on</strong></str<strong>on</strong>g>s the slab was ignited with a line burner al<strong>on</strong>g <strong>on</strong>e entire edge <str<strong>on</strong>g>of</str<strong>on</strong>g> the slab,<br />
supplying energy at the rate <str<strong>on</strong>g>of</str<strong>on</strong>g> 1000 kW/m 2 .<br />
Simulati<strong>on</strong> results were compared with experiments <strong>on</strong> 10 cm thick <strong>slabs</strong> c<strong>on</strong>ducted at NIST’s Large Fire<br />
Laboratory (20). Figure 5 shows three photographs taken during a flame <str<strong>on</strong>g>spread</str<strong>on</strong>g> experiment <strong>on</strong> a 10 cm<br />
thick slab <str<strong>on</strong>g>of</str<strong>on</strong>g> PUF. During each experiment (c<strong>on</strong>ducted <strong>on</strong> a 1.2 m square slab) heat release rate, flame<br />
<str<strong>on</strong>g>spread</str<strong>on</strong>g> rate, heat flux and thermocouple temperature measurements were made to create a database to
validate <str<strong>on</strong>g>numerical</str<strong>on</strong>g> models. The PUF used in the large scale tests was identical (same batch) to that used<br />
in the small scale laboratory tests such as TG, microcalorimeter and c<strong>on</strong>e experiments, and these data<br />
have been reported earlier. The photographs show the igniti<strong>on</strong> stage (left sub-figure), the flame <str<strong>on</strong>g>spread</str<strong>on</strong>g><br />
stage (middle) and the final burning stage (right sub-figure) <str<strong>on</strong>g>of</str<strong>on</strong>g> the <strong>foam</strong>. Smokeview visualizati<strong>on</strong>s (heat<br />
release rate per unit volume) <str<strong>on</strong>g>of</str<strong>on</strong>g> the flame <str<strong>on</strong>g>spread</str<strong>on</strong>g> <str<strong>on</strong>g>simulati<strong>on</strong></str<strong>on</strong>g> <strong>on</strong> PUF <strong>slabs</strong> are shown in Figure 6. The<br />
smokeview images also show an igniti<strong>on</strong> stage (left sub-figure), a flame <str<strong>on</strong>g>spread</str<strong>on</strong>g> stage (middle) and full<br />
burning stage (right sub-figure), and these pictures qualitatively compare with the photographs <str<strong>on</strong>g>of</str<strong>on</strong>g> the<br />
flame <str<strong>on</strong>g>spread</str<strong>on</strong>g> experiments. During the initial igniti<strong>on</strong> stage, the flame pr<str<strong>on</strong>g>of</str<strong>on</strong>g>ile was parallel to the edge that<br />
was ignited, but it gradually transiti<strong>on</strong>s into a parabolic pr<str<strong>on</strong>g>of</str<strong>on</strong>g>ile (middle sub-figure). Flame <str<strong>on</strong>g>spread</str<strong>on</strong>g> rate was<br />
fastest in the centre (due to higher radiative flux from the flames to the <strong>foam</strong> slab) and relatively slower at<br />
the edges <str<strong>on</strong>g>of</str<strong>on</strong>g> the slab. Note that the early stages <str<strong>on</strong>g>of</str<strong>on</strong>g> the experiment can be approximated as a 2-D<br />
phenomena, if the parabolic flame <str<strong>on</strong>g>spread</str<strong>on</strong>g> pr<str<strong>on</strong>g>of</str<strong>on</strong>g>ile or the the 3-D pool burning do not have to be captured in<br />
the <str<strong>on</strong>g>simulati<strong>on</strong></str<strong>on</strong>g>s. During the flame <str<strong>on</strong>g>spread</str<strong>on</strong>g> stage, the <strong>foam</strong> collapses and releases the TDI, while the polyol<br />
is left behind as a pool <strong>on</strong> top <str<strong>on</strong>g>of</str<strong>on</strong>g> the gypsum board. The last sub-figure indicates burning <str<strong>on</strong>g>of</str<strong>on</strong>g> the polyol<br />
which is accompanied by very intense heat release rates and tall flames.<br />
Figure 5. Igniti<strong>on</strong>, flame <str<strong>on</strong>g>spread</str<strong>on</strong>g> and burning <str<strong>on</strong>g>of</str<strong>on</strong>g> a 10 cm thick slab <str<strong>on</strong>g>of</str<strong>on</strong>g> <strong>polyurethane</strong> <strong>foam</strong>.<br />
Figure 6. 3-D Smokeview visualizati<strong>on</strong> <str<strong>on</strong>g>of</str<strong>on</strong>g> the flame <str<strong>on</strong>g>spread</str<strong>on</strong>g> <strong>on</strong> a 4” thick slab <str<strong>on</strong>g>of</str<strong>on</strong>g> <strong>polyurethane</strong> <strong>foam</strong>.<br />
Figure 7 shows a comparis<strong>on</strong> <str<strong>on</strong>g>of</str<strong>on</strong>g> heat release rate (kW) plotted as a functi<strong>on</strong> <str<strong>on</strong>g>of</str<strong>on</strong>g> time for the experiments<br />
(left sub-figure, measured using oxygen c<strong>on</strong>sumpti<strong>on</strong> calorimetry) and the model predicti<strong>on</strong>s (right subfigure).<br />
Model predicti<strong>on</strong>s indicate that the heat release rate increases gradually during the first 70 s and
eaches a plateau at about 200 kW. Bey<strong>on</strong>d that point, the increase in heat release rate was more rapid and<br />
a peak value <str<strong>on</strong>g>of</str<strong>on</strong>g> 650 kW was obtained at 150 s. The heat release rate curve died down, <strong>on</strong>ce the <strong>foam</strong> slab<br />
was completely c<strong>on</strong>sumed. The experiments indicate a similar behavior <str<strong>on</strong>g>of</str<strong>on</strong>g> slow gradual increase in the<br />
heat release rate curve followed by a more intense burning regime and a subsequent decay phase.<br />
Numerical <str<strong>on</strong>g>simulati<strong>on</strong></str<strong>on</strong>g>s indicate that the flame <str<strong>on</strong>g>spread</str<strong>on</strong>g> rate was at least twice as fast as observed in the<br />
experiments, although the peak heat release rate values compared favorably.<br />
Figure 7. Comparis<strong>on</strong> <str<strong>on</strong>g>of</str<strong>on</strong>g> experimentally measured (left sub-figure, showing a set <str<strong>on</strong>g>of</str<strong>on</strong>g> five tests) and<br />
<str<strong>on</strong>g>numerical</str<strong>on</strong>g> predicted (right sub-figure) heat release rate (kW) plotted as a functi<strong>on</strong> <str<strong>on</strong>g>of</str<strong>on</strong>g> time for a 10 cm<br />
thick <strong>polyurethane</strong> <strong>foam</strong> slab.<br />
Figure 8. Comparis<strong>on</strong> <str<strong>on</strong>g>of</str<strong>on</strong>g> experimentally measured and <str<strong>on</strong>g>numerical</str<strong>on</strong>g> predicted heat flux plotted as a functi<strong>on</strong><br />
<str<strong>on</strong>g>of</str<strong>on</strong>g> time. The flux was measured by a heat flux gauge located at 0.9 m from the ignited edge.<br />
The experimentally measured heat flux (kW/m 2 ) plotted as a functi<strong>on</strong> <str<strong>on</strong>g>of</str<strong>on</strong>g> time was compared with model<br />
predicti<strong>on</strong>s as shown in Figure 8. The heat flux was measured by a heat flux gauge located <strong>on</strong> the center<br />
line and at a distance <str<strong>on</strong>g>of</str<strong>on</strong>g> 91 cm from the edge that was ignited by the heaters. Results indicate that the<br />
measured flux was approximately zero until the flames reached the gauge. The heat flux then jumps<br />
abruptly to a value <str<strong>on</strong>g>of</str<strong>on</strong>g> 50-60 kW/m 2 . Peak value <str<strong>on</strong>g>of</str<strong>on</strong>g> 95 kW/m 2 was measured, and the sample was<br />
completely c<strong>on</strong>sumed in 400 s. Model predicti<strong>on</strong>s show qualitatively similar behavior, even though the
flame <str<strong>on</strong>g>spread</str<strong>on</strong>g> rates are significantly higher. Model predicti<strong>on</strong>s also indicate that the heat flux ranges<br />
between 60-120 kW/m 2 , but that the sample is completely c<strong>on</strong>sumed in 200 s. The higher heat flux might<br />
be resp<strong>on</strong>sible for the higher flame <str<strong>on</strong>g>spread</str<strong>on</strong>g> rates as predicted in the <str<strong>on</strong>g>simulati<strong>on</strong></str<strong>on</strong>g>s.<br />
CONCLUSIONS AND FUTURE WORK<br />
Modeling the flame <str<strong>on</strong>g>spread</str<strong>on</strong>g> <strong>on</strong> <strong>polyurethane</strong> <strong>foam</strong> <strong>slabs</strong> is difficult due to the highly complex<br />
process occurring during its decompositi<strong>on</strong> (phase change, shape change, charring, bubbling etc.). A<br />
simple model has been developed to approximately model this very difficult problem. Detailed<br />
understanding <str<strong>on</strong>g>of</str<strong>on</strong>g> the various physical and chemical processes that occur during the burning <str<strong>on</strong>g>of</str<strong>on</strong>g><br />
<strong>polyurethane</strong> <strong>foam</strong> <strong>slabs</strong> derived from small scale tests (TG, C<strong>on</strong>e Tests, Microcalorimeter) has been used<br />
to estimate material property data. Simulati<strong>on</strong>s results for flame <str<strong>on</strong>g>spread</str<strong>on</strong>g> behavior and heat release rates<br />
were found to compare qualitatively with measured experimental data.<br />
Attempts are underway to further improve the material property input data that is used in the models as<br />
well as the approach for representing the c<strong>on</strong>densed phase. Differential scanning calorimetry (DSC) and<br />
simultaneous TGA/DSC (SDT) tests are currently being performed <strong>on</strong> PUF to better estimate the heat <str<strong>on</strong>g>of</str<strong>on</strong>g><br />
reacti<strong>on</strong> for each stage. The flame <str<strong>on</strong>g>spread</str<strong>on</strong>g> rates were found to be very sensitive to the heat <str<strong>on</strong>g>of</str<strong>on</strong>g> reacti<strong>on</strong> and<br />
it is believed that incorporating the new test data will significantly increase the accuracy <str<strong>on</strong>g>of</str<strong>on</strong>g> the<br />
predicti<strong>on</strong>s. Simulati<strong>on</strong>s are also being performed <strong>on</strong> 2.5 cm, 5.1 cm and 20.3 cm thick slab samples and<br />
these results will be compared with experimental data. Further studies have been planned to investigate<br />
the effect <str<strong>on</strong>g>of</str<strong>on</strong>g> radial flame <str<strong>on</strong>g>spread</str<strong>on</strong>g> <strong>on</strong> <strong>foam</strong> <strong>slabs</strong> with pre-heating [21], impact <str<strong>on</strong>g>of</str<strong>on</strong>g> covering the <strong>foam</strong> with<br />
polypropylene or ray<strong>on</strong> face cloth, use <str<strong>on</strong>g>of</str<strong>on</strong>g> brominated <strong>foam</strong> samples (<str<strong>on</strong>g>fire</str<strong>on</strong>g> retardants) and orientati<strong>on</strong> <str<strong>on</strong>g>of</str<strong>on</strong>g> the<br />
<strong>foam</strong> <strong>slabs</strong> <strong>on</strong> predicted flame <str<strong>on</strong>g>spread</str<strong>on</strong>g> rates.<br />
ACKNOWLEDGEMENT<br />
The authors would like to thank Michael Smith for performing the c<strong>on</strong>e calorimeter experiments;<br />
Matt Bundy for providing technical support in the Large Fire Laboratory; Jeff Gillman, Kevin McGrattan<br />
and Anth<strong>on</strong>y Hamins for their c<strong>on</strong>tinued support <str<strong>on</strong>g>of</str<strong>on</strong>g> this internally funded study at NIST; and Lucas<br />
Bustamante, Simo Hostikka, Chris Lautenberger and Guillermo Rein for useful discussi<strong>on</strong>s.
REFERENCES<br />
1. “Extended Abstracts and Presentati<strong>on</strong>s from the Workshop <strong>on</strong> Fire Growth and Spread <strong>on</strong><br />
Objects,” http://www.<str<strong>on</strong>g>fire</str<strong>on</strong>g>.nist.gov/bfrlpubs/flame<str<strong>on</strong>g>spread</str<strong>on</strong>g>/, March 4-6, 2002.<br />
2. “Polyurethane handbook: chemistry, raw materials, processing, applicati<strong>on</strong>, properties,” Oertel,<br />
Gunter, Hanser Publishers, New York, 1985.<br />
3. “Materials Bank Compendium <str<strong>on</strong>g>of</str<strong>on</strong>g> Fire Property Data,” Products Research Committee, February<br />
1980.<br />
4. “Aspects <str<strong>on</strong>g>of</str<strong>on</strong>g> the Fire Behavior <str<strong>on</strong>g>of</str<strong>on</strong>g> Thermoplastic Materials,” Ohlemiller, T. J., Shields, J. R., NIST<br />
Technical Note 1493, 2008.<br />
5. “Flexible Polyurethane Foam 1. Thermal Decompositi<strong>on</strong> <str<strong>on</strong>g>of</str<strong>on</strong>g> a Polyether-based, Water-Blown<br />
Commerical Type <str<strong>on</strong>g>of</str<strong>on</strong>g> Flexible Polyurethane Foam,” Ravey, M. and Pearce, E., J. Appl. Poly. Sci.<br />
63, (1997) p.47<br />
6. “Studies <strong>on</strong> the Thermal Behavior <str<strong>on</strong>g>of</str<strong>on</strong>g> Polyurethanes,” Shufen, Li, Zhi Jiang, Kaijun Yuan, Shuqin<br />
Yu, Chow, W. K., Polymer-Plastics Technology and Engineering, 45: 95-108, 2006.<br />
7. On Heat Release and Pool Fires <str<strong>on</strong>g>of</str<strong>on</strong>g> Flexible Polyurethane Foams, Part I – Experimental,” Kramer,<br />
R. H., Zammarano, M., Gedde, U. W., Gilman, J. W., submitted, J. <str<strong>on</strong>g>of</str<strong>on</strong>g> Polymer Science, 2008.<br />
8. “Applicati<strong>on</strong> <str<strong>on</strong>g>of</str<strong>on</strong>g> Genetic Algorithms and Thermogravimetry to Determine the Kinetics <str<strong>on</strong>g>of</str<strong>on</strong>g><br />
Polyurethane Foam in Smoldering Combusti<strong>on</strong>,” Rein, G., Lautenberger, C., Fernandez-Pello, C.,<br />
Torero, J., Urban, D., University <str<strong>on</strong>g>of</str<strong>on</strong>g> California Postprints, Paper 1154, 2006.<br />
9. “A Generalized Pyrolysis Model for Combustible Solids,” Chris Lautenberger, PhD. Thesis,<br />
University <str<strong>on</strong>g>of</str<strong>on</strong>g> California, Berkeley, 2007.<br />
10. “Fire Dynamics Simulator (Versi<strong>on</strong> 5) Technical Reference Guide,” Kevin McGrattan, Simo<br />
Hostikka, Jas<strong>on</strong> Floyd, Howard Baum, R<strong>on</strong>ald Rehm, Randall McDermott, NIST Special<br />
Publicati<strong>on</strong> 1018-5, 2008.<br />
11. “Material Property Estimati<strong>on</strong> Method using a Thermoplastic Pyrolysis Model,” Seung Han Lee,<br />
Thesis Worcester Polytechnic Institute, 2006.<br />
12. “Determinati<strong>on</strong> <str<strong>on</strong>g>of</str<strong>on</strong>g> Properties and the Predicti<strong>on</strong> <str<strong>on</strong>g>of</str<strong>on</strong>g> the Energy Release Rate <str<strong>on</strong>g>of</str<strong>on</strong>g> Materials in the<br />
ISO 9705 Room-Corner Test,” Dill<strong>on</strong>, S. E., Kim, W. H. and Quintiere, J. G., Nati<strong>on</strong>al Institute<br />
<str<strong>on</strong>g>of</str<strong>on</strong>g> Standards and Technology, Gaithersburg, MD NIST-GCR-98-753, 1998.<br />
13. “Computer Tools to Determine Material Properties for Fire Growth Modeling From C<strong>on</strong>e<br />
Calorimeter Data,” Janssens, M. L., Kimble, J., Murphy, D., Proceedings <str<strong>on</strong>g>of</str<strong>on</strong>g> Fire and Materials,<br />
2003, pp 377-387, 2003.<br />
14. “Thermal characteristics <str<strong>on</strong>g>of</str<strong>on</strong>g> <strong>polyurethane</strong> <strong>foam</strong>s incorporated with phase change materials,”<br />
Sarier, N., Onder, E., Thermochemica Acta 454 (2007) 90-98.<br />
15. “Thermal C<strong>on</strong>ductivity <str<strong>on</strong>g>of</str<strong>on</strong>g> Selected Foams and Systems from 100 to 300 K,” Sparks, Larry, L.,<br />
U.S. Dept <str<strong>on</strong>g>of</str<strong>on</strong>g> Commerce, NBSIR 88-3086, 1988.<br />
16. VORANOL 235-056, Dow Plastics Product Informati<strong>on</strong>, The Dow Chemical Company, 2001<br />
17. “Polymer surface reflectance-absorptance characteristics,” Hallman, J. R., Ph. D., Dissertati<strong>on</strong>,<br />
University <str<strong>on</strong>g>of</str<strong>on</strong>g> Oklahoma, 1971.<br />
18. “Using c<strong>on</strong>e calorimeter data for the predicti<strong>on</strong> <str<strong>on</strong>g>of</str<strong>on</strong>g> <str<strong>on</strong>g>fire</str<strong>on</strong>g> hazard,” Tsai, K. C. and Drysdale, D., D.,<br />
Fire Safety Journal, 27:697-706 (2002).<br />
19. “Fire Dynamics Simulator (Versi<strong>on</strong> 5) User’s Guide,” Kevin McGrattan, Bryan Klein, Simo<br />
Hostikka, Jas<strong>on</strong> Floyd, NIST Special Publicati<strong>on</strong> 1019-5, 2008.<br />
20. William Pitts, Private communicati<strong>on</strong>, 2008.<br />
21. “A Study <str<strong>on</strong>g>of</str<strong>on</strong>g> Transient Horiz<strong>on</strong>tal Fire Spread Over Cellular Plastics,” Tan, Seng, Chuan, Ph.D.<br />
Dissertati<strong>on</strong>, Harvard University, 1983.