YEAR END REPORT 2012 - Lundin Petroleum
YEAR END REPORT 2012 - Lundin Petroleum
YEAR END REPORT 2012 - Lundin Petroleum

Create successful ePaper yourself
Turn your PDF publications into a flip-book with our unique Google optimized e-Paper software.
4<br />
› 1 ‹<br />
<strong>Lundin</strong> <strong>Petroleum</strong> AB (publ)<br />
company registration number 556610-8055<br />
<strong>YEAR</strong> <strong>END</strong> <strong>REPORT</strong><br />
<strong>2012</strong>
HIGHLIGHTS<br />
Twelve months ended 31 December <strong>2012</strong> (31 December 2011)<br />
• Production of 35.7 Mboepd (33.3 Mboepd)<br />
• Operating income of MUSD 1,345.1 (MUSD 1,269.5)<br />
• EBITDA of MUSD 1,144.1 (MUSD 1,012.1)<br />
• Operating cash flow of MUSD 831.4 (MUSD 676.2)<br />
• Net result of MUSD 103.9 (MUSD 155.2)<br />
• New USD 2.5 billion seven year secured revolving borrowing base facility signed on 25 June <strong>2012</strong><br />
• PDOs approved for the Edvard Grieg and Bøyla fields, Norway<br />
• Pre-Unit agreement signed for the Johan Sverdrup field<br />
• Extensive appraisal drilling on the Johan Sverdrup field<br />
• Geitungen oil discovery of between an estimated 140 and 270 MMboe gross recoverable resources 1 located north of the Johan Sverdrup<br />
field within PL265<br />
Fourth quarter ended 31 December <strong>2012</strong> (31 December 2011)<br />
• Production of 35.9 Mboepd (34.7 Mboepd)<br />
• EBITDA of MUSD 289.8 (MUSD 244.8)<br />
• Operating cash flow of MUSD 237.4 (MUSD 89.4)<br />
• Net result of MUSD -52.7 (MUSD -14.0)<br />
• Tembakau-1 gas discovery of 306 bcf on Block PM307, offshore Peninsular Malaysia<br />
• New Block PM319 awarded offshore Peninsular Malaysia<br />
• Acquisition of an additional 20 percent interest in the Brynhild field, offshore Norway<br />
1 Estimated by PL265 operator, Statoil<br />
1 Jan <strong>2012</strong>-<br />
31 Dec <strong>2012</strong><br />
12 months<br />
› 2 ‹<br />
1 Oct <strong>2012</strong>-<br />
31 Dec <strong>2012</strong><br />
3 months<br />
1 Jan 2011-<br />
31 Dec 2011<br />
12 months<br />
1 Oct 2011-<br />
31 Dec 2011<br />
3 months<br />
Production in Mboepd 35.7 35.9 33.3 34.7<br />
Operating income in MUSD 1,345.1 342.6 1,269.5 323.0<br />
Net result in MUSD 103.9 -52.7 155.2 -14.0<br />
Net result attributable to shareholders of the<br />
Parent Company in MUSD 108.2 -51.5 160.1 -12.5<br />
Earnings/share in USD 1 0.35 -0.16 0.51 -0.05<br />
Diluted earnings/share in USD 1 0.35 -0.16 0.51 -0.05<br />
EBITDA in MUSD 1,144.1 289.8 1,012.1 244.8<br />
Operating cash flow in MUSD 831.4 237.4 676.2 89.4<br />
1 Based on net result attributable to shareholders of the Parent Company<br />
Definitions<br />
An extensive list of definitions can be found on the <strong>Lundin</strong> <strong>Petroleum</strong> website www.lundin-petroleum.com under the heading“Definitions”.<br />
Abbreviations<br />
EBITDA Earnings Before Interest, Tax,<br />
Depreciation and Amortisation<br />
CAD Canadian dollar<br />
CHF Swiss franc<br />
EUR Euro<br />
NOK Norwegian Krona<br />
RUR Russian Rouble<br />
SEK SwedishKrona<br />
USD US Dollar<br />
TSEK Thousand SEK<br />
TUSD Thousand USD<br />
MSEK Million SEK<br />
MUSD Million USD<br />
Oil related terms and measurements<br />
boe Barrels of oil equivalents<br />
boepd Barrels of oil equivalents per day<br />
bopd Barrels of oil per day<br />
Mbbl Thousand barrels (in Latin mille)<br />
Mboe Thousand barrels of oil equivalents<br />
Mboepd Thousand barrels of oil equivalents per day<br />
Mbopd Thousand barrels of oil per day<br />
Mcf Thousand cubic feet<br />
bcf Billion cubic feet
› 3 ‹<br />
LETTER TO SHAREHOLDERS<br />
Dear fellow shareholders,<br />
<strong>2012</strong> was yet another successful year for our Company. We have exceeded our production forecasts once again and this, coupled with our low<br />
operating costs and cash taxes, has resulted in a record operating cash flow of more than MUSD 830 for the year.<br />
Since the end of 2001, we have increased our share price by over 50 times to a current market capitalisation exceeding USD 8 billion. This has been<br />
done without any issuance of new cash equity other than employee stock options. Our strong operating cash flow coupled with the availability<br />
of a new USD 2.5 billion bank facility means that we will be able to grow our business without further dilution to our shareholders. We have the<br />
ability to quadruple our existing production to over 150,000 boepd over the next seven years through the development of our existing Norwegian<br />
discoveries Brynhild, Bøyla, Edvard Grieg and Johan Sverdrup. This growth in production will have a major positive impact on our future financial<br />
performance. At the same time we will continue to concentrate on increasing our resource base through a major exploration drilling programme<br />
focused predominantly on Norway and South East Asia.<br />
Financial Performance<br />
For the twelve months ending 31 December <strong>2012</strong>, we generated record operating cash flow of MUSD 831.4 and EBITDA of MUSD 1,144.1 which<br />
represent increases of 23 percent and 13 percent respectively when compared to the previous year. Profit after tax for the period was MUSD 103.9<br />
and was negatively impacted by non-cash exploration and asset impairment costs incurred in the fourth quarter. The nature of our business<br />
involves the drilling of successful exploration wells, such as Johan Sverdrup where the asset continues to be valued in our balance sheet based<br />
upon historical costs, as well as unsuccessful wells where the costs are immediately expensed. We have increased the exploration budget as our<br />
business has grown and this will likely mean that our profitability will continue to be negatively impacted by unsuccessful wells. However the<br />
valuation of our business will continue to be driven by our ability to discover new resources through our exploration drilling programmes - even<br />
though this will not immediately be reflected in the profitability of the Company.<br />
Reserves and Resources<br />
<strong>Lundin</strong> <strong>Petroleum</strong>’s success has been due to our ability to increase our resource base. Today we have net resources, including 2P reserves and 2C<br />
contingent resources of over 1 billion barrels recoverable. These resources are predominantly oil. Our 2P recoverable reserves at the end of <strong>2012</strong><br />
were 201.5 million barrels of oil equivalent. Whilst last year’s reserve replacement ratio was lower than in previous years, I think everyone would<br />
agree that this will change when the contingent resources from the Johan Sverdrup field in Norway are booked as reserves. There is little doubt<br />
that the Johan Sverdrup field is commercial but reserves will not be booked until the signing of a unitisation agreement and the submission of the<br />
field development plan both scheduled for the end of 2014.<br />
The Johan Sverdrup appraisal programme is ongoing and will continue throughout 2013 with at least four more appraisal wells. Johan Sverdrup is<br />
the largest discovery in the North Sea since the mid 1980’s covering a large area. 12 appraisal wells, including the discovery well, have already been<br />
drilled or are currently drilling and the preparation of a geological and reservoir model to incorporate all the acquired data is ongoing. Statoil as<br />
a working operator for the Johan Sverdrup field development has decided to delay the release of updated resource numbers until later this year<br />
when the appraisal programme and a conceptual development plan will be completed.<br />
Production<br />
Production for <strong>2012</strong> was 35,700 boepd which was again in the upper half of our original 32,000 - 38,000 boepd production guidance. Strong<br />
performance from the Alvheim and Volund fields, offshore Norway more than made up for lower production than forecast from the Gaupe field,<br />
offshore Norway and the early termination of production from the Oudna field, offshore Tunisia. I am pleased that we have consistently achieved<br />
our production forecasts over recent years despite the uncertainties and risks in our business.<br />
In 2013 we expect our net production to average between 33,000 boepd and 38,000 boepd for the year and to exit the year at in excess of 40,000<br />
boepd when the Brynhild field reaches plateau production.<br />
We reiterate our guidance of production in excess of 70,000 boepd by the end of 2015 following first production from the Edvard Grieg field.<br />
Development<br />
Our three development projects in Norway are all progressing satisfactorily.<br />
We have increased our equity interest in the Brynhild field to 90 percent. Brynhild is a subsea tieback to Shell’s Pierce FPSO facility in the United<br />
Kingdom with a forecast gross plateau production of 12,000 boepd. The Maersk Guardian rig which is currently drilling exploration wells for us<br />
will commence the four Brynhild development wells during the second quarter of 2013. The Edvard Grieg development project is also progressing<br />
satisfactorily as we progress through the execution phase. It is very encouraging to see recent photographs of the Kværner Verdal yard on the west<br />
coast of Norway where the Edvard Grieg jacket is starting to take shape. The Edvard Grieg project remains on budget and on schedule for first oil<br />
in late 2015.<br />
We are in the process of awarding a front end engineering (FEED) contract for the Bertam field development project, offshore Malaysia and still plan<br />
to make a field investment decision in 2013.
LETTER TO SHAREHOLDERS<br />
Appraisal<br />
Five new appraisal wells were drilled on Johan Sverdrup in <strong>2012</strong> by <strong>Lundin</strong> <strong>Petroleum</strong> and Statoil. Each of the new wells provides important<br />
information for development planning as well as an understanding of the size of the resource. The resource estimates are primarily influenced by<br />
depth conversion, reservoir thickness and quality and oil/water contact assumptions. One additional well is ongoing and <strong>Lundin</strong> <strong>Petroleum</strong> will<br />
drill at least a further two appraisal wells in PL501 this year and Statoil will drill two wells in PL265 and one in PL502.<br />
The forward plan still remains for Statoil as “working operator” of Johan Sverdrup to complete a conceptual development plan by the end of 2013<br />
and a development plan submission by the end of 2014.<br />
Exploration<br />
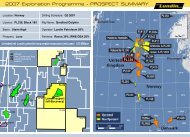
We are very excited about our 2013 exploration programme which involves the drilling of 18 exploration wells in Norway, South East Asia, France<br />
and the Netherlands. The budget of over USD 460 million will be the largest in the Company’s history and will be predominantly focused on Norway<br />
which will account for about 75 percent of the expenditure.<br />
In Norway, we will concentrate on three core exploration themes being:<br />
1. To find further resources in the Utsira High Area close to the existing Edvard Grieg and Johan Sverdrup discoveries<br />
2. To explore in the frontier Barents Sea area where we believe there is excellent potential for additional oil discoveries<br />
3. To unearth a new core area<br />
We are drilling six exploration wells in the Utsira High area with high expectations for the Luno II (PL359), Kopervik (PL625) and Torvastad (PL501)<br />
prospects which all individually have the potential to be material discoveries. In the Barents Sea we continue to increase our acreage in the ongoing<br />
licensing rounds and are today one of the largest players in the region. Our exploration drilling programme will continue in 2013 with the drilling of<br />
the Gotha prospect in PL492. We have acquired a large acreage position in the northern Norwegian Sea targeting an underexplored Jurassic high<br />
area where we will drill a large prospect in 2013 in PL330. I hope this will result in the opening up of the area which contains numerous prospects<br />
and leads in both PL330 and adjoining licences which we have secured.<br />
We continue to make good progress with our exploration programme in Malaysia. Following the successful appraisal of the Bertam discovery<br />
in PM307 we acquired new 3D seismic on trend with the discovery. This led to the discovery of the 300 bcf Tembakau gas discovery in <strong>2012</strong> also<br />
located in PM307. I believe Tembakau which is a material discovery close to existing gas infrastructure has the potential to be commercialised. It is<br />
clear that the key to exploration success in Malaysia is to have access to modern 3D seismic data and we plan to continue our proactive exploration<br />
of the area in 2013.<br />
Oil Market and <strong>Lundin</strong> <strong>Petroleum</strong><br />
The markets have begun 2013 with oil prices increasing. There is a growing realisation that the world economy is slowly recovering and if this<br />
continues will result in an increase in oil demand. China is the largest growth market for oil and with its growth rates appearing to bottom out<br />
I think we can expect this to further support demand. The geopolitical climate remains an issue with increasing instability in North Africa and<br />
little signs of improvement in the Middle East. This will put further pressure on forecasts of oil supply which I believe are already over estimated.<br />
Unconventional oil production in North America is certainly increasing but I believe the increased supply will be easily accommodated through<br />
growing demand from the developing world and supply declines from mature production areas. As a result I believe oil prices will remain firm.<br />
There is no new information to report in respect of the allegations regarding our historical operations in Sudan and Ethiopia. We have and will<br />
continue to assist the Swedish prosecutor as requested in relation to his investigation.<br />
In respect of our ongoing commitment to Corporate Social Responsibility we have re-affirmed our engagement towards transparency by becoming<br />
an Extractive Industries Transparency Initiative (EITI) Supporting Company. As an EITI Supporting Company, <strong>Lundin</strong> <strong>Petroleum</strong> will continue to<br />
report in accordance with EITI requirements in Norway and will promote transparency especially within the oil and gas industry and contribute to<br />
the fight against corruption.<br />
Yours Sincerely,<br />
C. Ashley Heppenstall<br />
President and CEO<br />
Stockholm, 6 February 2013<br />
› 4 ‹
OPERATIONAL REVIEW<br />
Production<br />
Production for the twelve month period ended 31 December <strong>2012</strong> (reporting period) amounted to 35.7 thousand barrels of oil equivalents per<br />
day (Mboepd) and was comprised as follows:<br />
Production<br />
in Mboepd<br />
Crude oil<br />
1 Jan <strong>2012</strong>-<br />
31 Dec <strong>2012</strong><br />
12 months<br />
› 5 ‹<br />
1 Oct <strong>2012</strong>-<br />
31 Dec <strong>2012</strong><br />
3 months<br />
1 Jan 2011-<br />
31 Dec 2011<br />
12 months<br />
1 Oct 2011-<br />
31 Dec 2011<br />
3 months<br />
Norway 23.3 22.9 21.1 22.3<br />
France 2.8 2.8 3.1 3.0<br />
Russia 2.7 2.5 3.1 3.0<br />
Tunisia 0.1 – 0.7 0.6<br />
Total crude oil production 28.9 28.2 28.0 28.9<br />
Gas<br />
Norway 3.9 4.3 2.1 2.4<br />
Netherlands 1.9 1.8 2.0 2.0<br />
Indonesia 1.0 1.6 1.2 1.4<br />
Total gas production 6.8 7.7 5.3 5.8<br />
Total production<br />
Quantity in Mboe 13,050.4 3,300.8 12,151.5 3,188.2<br />
Quantity in Mboepd 35.7 35.9 33.3 34.7<br />
EUROPE<br />
Norway<br />
Production<br />
Production<br />
in Mboepd<br />
<strong>Lundin</strong> <strong>Petroleum</strong><br />
Working Interest (WI)<br />
<strong>YEAR</strong> <strong>END</strong> <strong>REPORT</strong> <strong>2012</strong><br />
1 Jan <strong>2012</strong>-<br />
31 Dec <strong>2012</strong><br />
12 months<br />
1 Oct <strong>2012</strong>-<br />
31 Dec <strong>2012</strong><br />
3 months<br />
Alvheim 15% 11.8 11.9<br />
Volund 35% 13.1 12.5<br />
Gaupe 40% 2.3 2.8<br />
27.2 27.2<br />
The net production in Norway to <strong>Lundin</strong> <strong>Petroleum</strong> for the reporting period was 27,200 barrels of oil equivalent per day (boepd).<br />
The net production from the Alvheim field during the reporting period exceeded expectations due to the excellent uptime performance of the<br />
FPSO at over 95 percent and the cancellation of the anticipated second quarter shut down of the SAGE system. An Alvheim development well was<br />
drilled during the first half of <strong>2012</strong> and was tied in and put on production in October <strong>2012</strong>. In January 2013 the Alvheim partnership was awarded<br />
additional acreage to the north of the Alvheim field through the <strong>2012</strong> APA licensing round. The work programme for this new acreage involves 3D<br />
seismic reprocessing with the objective of identifying potential new drilling targets in the Alvheim area. The cost of operations for the Alvheim<br />
field for the reporting period was below USD 5 per barrel excluding certain planned well intervention work during the third quarter of <strong>2012</strong>.<br />
Volund field production during the reporting period exceeded expectations due to better than expected reservoir performance and the Alvheim<br />
FPSO uptime. An additional Volund development well has been drilled and is expected to come on production in the first quarter of 2013. The<br />
cost of operations for the Volund field for the reporting period was below USD 2 per barrel driven by lower than expected production costs and<br />
better than expected production.<br />
First production from the Gaupe field in PL292 was achieved on 31 March <strong>2012</strong>. Production from the Gaupe field has been below forecast since<br />
the commencement of production. Technical analysis indicates that the two production wells are connected to lower hydrocarbon volumes<br />
than was forecast prior to production startup. Consequently the reserves have been reduced based on the conservative assumption that no<br />
additional production wells will be drilled.
<strong>YEAR</strong> <strong>END</strong> <strong>REPORT</strong> <strong>2012</strong><br />
Development<br />
The Norwegian Parliament approved the Edvard Grieg (WI 50%) plan of development in June <strong>2012</strong>. The development plan incorporates the<br />
provision for the coordinated development solution of the Edvard Grieg field with the nearby Ivar Aasen field (formerly Draupne) located in<br />
PL001B and operated by Det norske oljeselskap ASA. A plan of development was submitted for the Ivar Aasen field in December <strong>2012</strong>.<br />
The Edvard Grieg field is estimated to contain 186 million barrels of oil equivalents (MMboe) of gross reserves with first production expected<br />
in late 2015 and forecast gross peak production of approximately 100.0 Mboepd. The gross capital cost of the Edvard Grieg field development<br />
is estimated at USD 4 billion to include platform, pipelines and 15 wells. Contracts have been awarded to Kværner covering engineering,<br />
procurement and construction of the jacket and the topsides for the platform and to Rowan Companies for a jack up rig to drill the development<br />
wells. Saipem has been awarded the contract for marine installation. The development is progressing well and construction work on the jacket<br />
is ongoing. Construction and engineering work on the jacket, topside and export pipelines will continue throughout 2013. An appraisal well is<br />
planned to be drilled in the south eastern part of the Edvard Grieg reservoir in 2013 to target additional resources.<br />
A plan of development of the Brynhild field in PL148 (WI 90%) was approved by the Norwegian Ministry of <strong>Petroleum</strong> and Energy in November<br />
2011. The Brynhild field contains gross reserves of 23.1 MMboe and is expected to produce at an estimated gross plateau production rate of<br />
12.0 Mboepd with first oil forecast in late 2013. The development involves the drilling of four wells tied back to the existing Shell operated<br />
Pierce field infrastructure in the United Kingdom sector of the North Sea. The development is well advanced in respect of engineering and<br />
construction work and the Maersk Guardian jack-up rig will commence development drilling in the second quarter of 2013. In December <strong>2012</strong>,<br />
<strong>Lundin</strong> <strong>Petroleum</strong> announced that it had completed a transaction with Talisman Energy to acquire an additional 20 percent interest in PL148,<br />
taking <strong>Lundin</strong> <strong>Petroleum</strong>’s interest in the field to 90 percent.<br />
A plan of development for the Bøyla field in PL340 (WI 15%) was submitted in June <strong>2012</strong> and approved by the Ministry of <strong>Petroleum</strong> and Energy<br />
in October <strong>2012</strong>. The Bøyla field contains gross reserves of 21 MMboe and will be developed as a 28 km subsea tieback to the Alvheim FPSO. First<br />
oil from the Bøyla field is expected in the fourth quarter of 2014 at a gross plateau production rate of 19.0 Mboepd.<br />
Appraisal<br />
<strong>Lundin</strong> <strong>Petroleum</strong> discovered the Avaldsnes field in PL501 (WI 40%) in 2010. In 2011, Statoil made the Aldous Major South discovery on the<br />
neighboring PL265 (WI 10%). Following appraisal drilling, it was determined that the discoveries were connected and in January <strong>2012</strong> the<br />
combined discovery was renamed Johan Sverdrup. An appraisal programme is ongoing to define the recoverable resource and assist with the<br />
development planning strategy.<br />
During the reporting period, a total of four appraisal wells and two side-tracks on PL501 have been drilled and a further two appraisal wells on<br />
PL265 have also been completed.<br />
In January <strong>2012</strong>, a third appraisal well, 16/5-2S, located on PL501 was completed. The objective of the well was to delineate the southern flank of<br />
the Johan Sverdrup, PL501 discovery. The well, despite encountering good Jurassic sandstone reservoir, was deep to prognosis and as a result<br />
the reservoir was below the oil water contact.<br />
In March <strong>2012</strong>, a further appraisal well, 16/2-11, was completed on PL501 which encountered a 54 metre gross oil column in Upper and Middle<br />
Jurassic sandstone reservoir in an oil-down-to situation. The reservoir was encountered at depth prognosis. A sidetrack of the well was successfully<br />
completed encountering a 35 metre gross oil column confirming similar excellent reservoir thickness and quality.<br />
In the third quarter of <strong>2012</strong>, the drilling of the appraisal well 16/2-13S on the north eastern part of the Johan Sverdrup discovery and a side-track<br />
well 16/2-13A were successfully completed. The results from the wells were excellent in respect of reservoir quality and thickness, validating<br />
the field geological model and confirming a deeper oil water contact at this location. Well 16/2-13S encountered a 25 metre gross oil column in<br />
Upper and Middle Jurassic sandstone reservoir in an oil-down-to situation. The side-track well 16/2-13A encountered a gross reservoir column<br />
of approximately 22 metres, of which 12 metres were above the oil water contact. The oil water contact was established at approximately 1,925<br />
metres below Mean Sea Level (MSL) which is approximately 3 metres deeper than observed in earlier PL501 wells.<br />
In December <strong>2012</strong> the drilling of appraisal well 16/2-16 in the north eastern flank of the discovery was successfully completed. The well<br />
encountered a total of 15 metres of sand within a 60 metre Jurassic sequence. The oil water contact was encountered at the same depth as for<br />
well 16/2-13A to the east at 1,925 metres below MSL, resulting in an oil bearing reservoir column at this location of approximately 1 metre. A<br />
further side-track 16/2-16AT2 was drilled to the west of well 16/2-16 with a step-out of approximately 1,000 metres. The side-track, which was<br />
successfully completed in January 2013, encountered a gross oil column of 30 metres with largely excellent reservoir qualities within the Jurassic<br />
reservoir sequence. Oil was encountered at the same depth as at well 16/2-10 on PL265 which is the deepest oil water contact encountered in<br />
Johan Sverdrup so far.<br />
Appraisal well 16/3-5 in the south eastern part of Johan Sverdrup in PL501 is currently drilling with results expected in the first quarter of 2013.<br />
In November <strong>2012</strong>, Statoil announced the successful completion of appraisal well 16/2-14 on Johan Sverdrup in PL265. Well 16/2-14 was drilled<br />
in a northwestern segment of Johan Sverdrup approximately 6 km northwest of the discovery well 16/2-6 drilled by <strong>Lundin</strong> <strong>Petroleum</strong>. The well<br />
16/2-14 encountered an approximately 30 metre reservoir section saturated with oil. The well confirmed good reservoir quality at this location.<br />
In early January 2013, the Norwegian <strong>Petroleum</strong> Directorate announced the successful completion of appraisal well 16/2-15 drilled in the<br />
southwestern part of Johan Sverdrup in PL265. The well was drilled 5 km southeast of the discovery well 16/2-6 and encountered a gross oil<br />
column of 30 metres of which 20 metres contained excellent reservoir quality.<br />
It is likely that at least two further appraisal wells will be drilled in both PL501 and PL265 in 2013.<br />
› 6 ‹
› 7 ‹<br />
<strong>YEAR</strong> <strong>END</strong> <strong>REPORT</strong> <strong>2012</strong><br />
<strong>Lundin</strong> <strong>Petroleum</strong>, as operator of PL501, has signed a Pre-Unit agreement with the partners within PL501 and PL265 for the joint field development<br />
of the Johan Sverdrup field. Statoil has been elected as working operator for the pre-unit phase. All parties in PL501 and PL265 have agreed a<br />
timetable for the Johan Sverdrup field with development concept selection to be made by the fourth quarter of 2013, a plan of development to<br />
be submitted by the fourth quarter of 2014 and first oil production by the end of 2018.<br />
Exploration<br />
During the reporting period a total of five exploration wells have been completed in Norway.<br />
In June <strong>2012</strong>, the drilling of exploration well 2/8-18S targeting the Clapton prospect on PL440s (WI 18%) was completed by the operator Faroe<br />
<strong>Petroleum</strong>. The well, which is located in the southern North Sea, did not encounter hydrocarbons. The well was drilled to a depth of 2,619 metres<br />
below MSL and was plugged and abandoned.<br />
In August <strong>2012</strong>, the exploration well 16/2-12 targeting the Geitungen structure in PL265 (WI 10%) was successfully completed as an oil discovery.<br />
The well, which was located to the north of the Johan Sverdrup discovery and to the south of 16/2-9S Aldous Major North discovery, has proved<br />
a gross oil column of 35 metres in high quality sandstone of Jurassic age. Oil was also proven in the basement rock. Data acquisition in the well,<br />
including coring, wireline logging and fluid sampling, indicates that the Geitungen structure is in communication with the Johan Sverdrup<br />
discovery made by <strong>Lundin</strong> Norway in 2010. Preliminary calculations indicate that the size of the Geitungen discovery is between 140 and 270<br />
million barrels of gross recoverable oil 1 . Geitungen will be developed as part of the Johan Sverdrup development.<br />
In October <strong>2012</strong>, <strong>Lundin</strong> <strong>Petroleum</strong> announced the results of the Albert well in PL519 (WI 40%). The main objective of well 6201/11-3 was to test<br />
Cretaceous and Triassic age sandstones of a multiple target structure. The well encountered oil in thin Cretaceous reservoir sequence at the<br />
predicted level for the primary target. The thin thickness and uncertain distribution of the reservoir do not give a basis for resource estimation at<br />
this stage and as such the discovery is currently deemed uncommercial. Further potential exists within the Albert structure if thicker Cretaceous<br />
reservoir section in this large structure can be identified. The Triassic secondary reservoir was tight without movable hydrocarbons. A minor<br />
column of movable hydrocarbons were also encountered in a Paleocene secondary target. Further exploration activity is planned in this area in<br />
2014 with the drilling of the Storm prospect in PL555 where <strong>Lundin</strong> <strong>Petroleum</strong> holds a 60 percent interest and is operator.<br />
In October <strong>2012</strong>, <strong>Lundin</strong> <strong>Petroleum</strong> announced that exploration well 7220/10-1 in PL533 (WI 20%) had discovered gas/condensate in the Salina<br />
structure located on the west flank of the Loppa High in the Barents Sea. The well has proved two gas columns in sandstone of Cretaceous<br />
and Jurassic age. Data acquisition in the well, including coring, wireline logging and fluid sampling, has proven good reservoir quality in the<br />
sandstone. Preliminary calculations, made by the Norwegian <strong>Petroleum</strong> Directorate, give a range of gross discovered volume in the Salina<br />
structure of between 174 and 246 billion cubic feet (bcf) (29 and 41 MMboe) of recoverable gas/condensate. Further resource upside exists in<br />
fault compartments associated with the Salina structure.<br />
In November <strong>2012</strong>, <strong>Lundin</strong> <strong>Petroleum</strong> successfully completed the exploration well 7120/6-3 S in PL490 (WI 50%) in the Barents Sea. The well was<br />
located 10 km to the north west of the Snøhvit field and was targeting stacked targets Snurrevad and Juksa at the lower Cretaceous and upper<br />
Jurassic reservoirs The preliminary analysis of a cored section of the reservoir indicate thin oil bearing sands in a 8 to 9 metres zone at the top of a<br />
25 metre lower Cretaceous sand sequence. No reservoir was found to be present in the Snurrevad target at the Jurassic level. The thin oil bearing<br />
sands in the Juksa discovery are unlikely to be commercial however it is encouraging that the well encountered oil bearing sands as opposed to<br />
gas.<br />
<strong>Lundin</strong> <strong>Petroleum</strong> announced in July <strong>2012</strong> that it had entered into farm-out agreements to reduce its holdings in a number of licences. Spring<br />
Energy Norway AS has acquired a 10 percent interest in PL490, with <strong>Lundin</strong> <strong>Petroleum</strong> retaining 50 percent and Norwegian Energy Company ASA<br />
has acquired a 10 percent interest in PL492, with <strong>Lundin</strong> <strong>Petroleum</strong> retaining 40 percent; both licences are located in the Barents Sea. Explora<br />
<strong>Petroleum</strong> AS has acquired a 30 percent interest in PL544 and <strong>Lundin</strong> <strong>Petroleum</strong> retains 40 percent; the licence is located in the North Sea. The<br />
Norwegian authorities have approved these farm-out agreements. In January <strong>2012</strong>, <strong>Lundin</strong> <strong>Petroleum</strong> was awarded ten exploration licences in<br />
the APA 2011 licensing round of which four are operated by <strong>Lundin</strong> <strong>Petroleum</strong>. In January 2013, <strong>Lundin</strong> <strong>Petroleum</strong> was awarded a further seven<br />
exploration licences in the APA <strong>2012</strong> licensing round of which two are operated by <strong>Lundin</strong> <strong>Petroleum</strong>. Four of the seven licences awarded are in<br />
the North Sea, two in the Norwegian Sea and one in the Barents Sea. <strong>Lundin</strong> <strong>Petroleum</strong> has submitted several licence applications for the 22nd<br />
Norwegian licensing round with awards expected to be announced by the Ministry of <strong>Petroleum</strong> and Energy in the first half of 2013.<br />
<strong>Lundin</strong> <strong>Petroleum</strong>’s exploration programme in Norway for 2013 will consist of 10 exploration wells with a continued focus on the Utsira High area<br />
with six exploration wells targeting similar play concepts as Johan Sverdrup and Edvard Grieg. In addition, two exploration wells will be drilled in<br />
the southern North Sea, one of which is currently drilling, one well will be drilled in the Barents Sea and one well will be drilled on PL330 (WI 30%)<br />
in the northern Norwegian Sea. Rigs have been secured for all of the 2013 exploration wells.<br />
France<br />
Production<br />
in Mboepd<br />
<strong>Lundin</strong> <strong>Petroleum</strong><br />
Working Interest (WI)<br />
1 Jan <strong>2012</strong>-<br />
31 Dec <strong>2012</strong><br />
12 months<br />
1 Oct <strong>2012</strong>-<br />
31 Dec <strong>2012</strong><br />
3 months<br />
Paris Basin 100% 2.3 2.3<br />
Aquitaine Basin 50% 0.5 0.5<br />
1 Estimated by PL265 operator, Statoil<br />
2.8 2.8
<strong>YEAR</strong> <strong>END</strong> <strong>REPORT</strong> <strong>2012</strong><br />
The redevelopment of the Grandville field in the Paris Basin was substantially completed during the reporting period with the development wells<br />
brought onstream during the fourth quarter of <strong>2012</strong>.<br />
Two exploration wells were drilled in the reporting period. The Amaltheus exploration well in the Paris Basin on the Val des Marais concession (WI<br />
100%) was successfully completed in the fourth quarter of <strong>2012</strong> as an oil discovery. The well has been put on long-term production test. A second<br />
exploration well targeting the Contault prospect in the Paris Basin on the Est Champagne concession (WI 100%) was completed during the fourth<br />
quarter of <strong>2012</strong> as a dry hole. <strong>Lundin</strong> <strong>Petroleum</strong> is drilling one exploration well in the Paris Basin in 2013. The Hoplites-1 well will be drilled on the<br />
Est Champagne concession (WI 100%) targeting the Nettancourt prospect.<br />
The Netherlands<br />
The net gas production to <strong>Lundin</strong> <strong>Petroleum</strong> from the Netherlands averaged 1.9 Mboepd for the reporting period. Development drilling on<br />
existing production assets is ongoing to optimise field recovery. The Vinkega-2 exploration well in the Gorredijk concession (WI 7.75%) was a gas<br />
discovery in the third quarter of <strong>2012</strong> and is currently planned to commence production in the first quarter of 2013.<br />
<strong>Lundin</strong> <strong>Petroleum</strong> is participating in two exploration wells onshore Netherlands in 2013.<br />
Ireland<br />
Following the completion of seismic studies on the Slyne Basin licence 04/06 (WI 50%), the licence partners are considering the way forward.<br />
SOUTH EAST ASIA<br />
Indonesia<br />
Lematang (South Sumatra)<br />
The net production to <strong>Lundin</strong> <strong>Petroleum</strong> from the Singa gas field (WI 25.9%) during the reporting period amounted to 1.0 Mboepd. Production<br />
in the reporting period has been negatively affected by well maintenance work which was completed in September <strong>2012</strong>. Production during the<br />
fourth quarter averaged 1.6 Mboepd.<br />
Baronang/Cakalang (Natuna Sea)<br />
Exploration drilling on the Baronang Block (WI 100%) will commence in 2013.<br />
South Sokang (Natuna Sea)<br />
A 3D seismic acquisition programme is planned to be completed in 2013 on South Sokang (WI 60%).<br />
Gurita (Natuna Sea)<br />
A 3D seismic acquisition programme of 950 km² has been completed in <strong>2012</strong> on the Gurita Block (WI 100%) and an exploration well will be drilled<br />
in 2013.<br />
Malaysia<br />
East Malaysia, offshore Sabah<br />
<strong>Lundin</strong> <strong>Petroleum</strong> holds two licences offshore Sabah in east Malaysia. SB303 (WI 75%) contains the Tarap, Cempulut and Titik Terang gas discoveries<br />
with an estimated gross contingent resource of more than 270 bcf. <strong>Lundin</strong> <strong>Petroleum</strong> continues to evaluate the potential for commercialisation<br />
of these gas discoveries, most likely through a cluster development.<br />
In September <strong>2012</strong>, the Berangan-1 exploration well in SB303 was successfully completed as a gas discovery. The well penetrated a gross gas<br />
column of over 165 metres in the target mid-Miocene aged sands 10 km to the southeast of the Tarap gas discovery made by <strong>Lundin</strong> <strong>Petroleum</strong> in<br />
2011, and 15 km to the south of the Cempulut gas discovery also made in 2011. The Baronang discovery is estimated to contain 69 bcf (11.5 MMboe)<br />
of gross contingent gas resources and it is likely that it will be included in a cluster development with the other SB303 gas discoveries.<br />
In July <strong>2012</strong>, the Tiga Papan 5 well in SB307/308 (WI 42.5%) targeting mid-Miocene aged sands of the Tiga Papan Unit was plugged and abandoned<br />
as a dry hole.<br />
One exploration well will be drilled offshore Sabah in 2013.<br />
Offshore Peninsular Malaysia<br />
<strong>Lundin</strong> <strong>Petroleum</strong> holds four licences offshore Peninsular Malaysia.<br />
In June 2011, <strong>Lundin</strong> <strong>Petroleum</strong> acquired a 75 percent working interest in Block PM307. A 2,100 km² 3D seismic acquisition programme was<br />
completed in 2011. In January <strong>2012</strong>, the Bertam-2 appraisal well was successfully completed proving the continuity and quality of the K10 oil<br />
reservoir sandstone. Conceptual development studies are substantially complete in relation to a potential development of the Bertam field and<br />
a decision will be taken in 2013. In November <strong>2012</strong>, <strong>Lundin</strong> <strong>Petroleum</strong> announced the Tembakau-1 well, drilled on Block PM307, as a gas discovery.<br />
The Tembakau-1 well was drilled to a total depth of 1,565 metres and encountered a series of stacked gas pay sands at the Miocene level. The<br />
net pay was 60 metres over five high quality sand intervals. Given the relatively close proximity to existing gas infrastructure coupled with the<br />
forecast strong demand for gas on Peninsular Malaysia the building blocks for a commercial development are present and further studies, will<br />
be undertaken to assess the commerciality of this discovery. It is estimated that the Tembakau discovery contains 306 bcf (51 MMboe) of gross<br />
› 8 ‹
contingent gas resources. A 3D seismic acquisition programme over the northern part of Block PM307 is currently ongoing. The 3D seismic<br />
acquisition is also stretching into the recently awarded Block PM319 (WI 75%).<br />
Block PM308A (WI 35%) contains the Janglau and Rhu oil discoveries. A further exploration well targeting the Ara prospect on Block PM308A is<br />
currently drilling. The well is targeting the Oligocene intra-rift sands discovered by the Janglau exploration well drilled in 2011. An acquisition of<br />
1,450 km² of new 3D seismic in PM308A was completed during the reporting period.<br />
In Block PM308B (WI 75%) the Merawan Batu-1 exploration well was completed in October <strong>2012</strong> and plugged and abandoned as a dry hole.<br />
In December <strong>2012</strong> <strong>Lundin</strong> <strong>Petroleum</strong> announced the award of a new block offshore Peninsular Malaysia. Block PM319 is operated by <strong>Lundin</strong><br />
<strong>Petroleum</strong> with a 85 percent working interest with Petronas holding a 15 percent working interest. The block covers an area of approximately<br />
8,400 km² and is located west of Block PM307 where <strong>Lundin</strong> <strong>Petroleum</strong> and Petronas have achieved success during <strong>2012</strong> with the appraisal of the<br />
Bertam oil field and the discovery of gas with the Tembakau-1 well. The area has very limited 3D coverage and work commitments include a full<br />
tensor gravity survey, 550 km² of 3D seismic and one wildcat exploration well.<br />
Two exploration wells offshore Peninsular Malaysia will be drilled in 2013.<br />
RUSSIA<br />
The net production to <strong>Lundin</strong> <strong>Petroleum</strong> from onshore assets located in the Komi Republic, Russia for the reporting period was 2.7 Mboepd.<br />
Production has been below expectations through the reporting period and consequently the remaining reserves as of 31 December <strong>2012</strong> have<br />
been reduced.<br />
In the Lagansky Block (WI 70%) in the northern Caspian a major oil discovery was made on the Morskaya discovery in 2008. The discovery is<br />
deemed to be strategic, due to its offshore location, by the Russian Government under the Foreign Strategic Investment Law (FSIL). As a result a<br />
50 percent ownership by a state owned company is required prior to appraisal and development. Discussions continue with third parties to meet<br />
the requirements of the FSIL.<br />
AFRICA<br />
Tunisia<br />
The production from the Oudna field (WI 40%) for the first quarter of <strong>2012</strong> was 0.4 Mboepd and 0.1 Mboepd for the reporting period. Following<br />
storm damage to a flowline in March <strong>2012</strong>, the Oudna field was shut-in. An assessment of repair solutions to the flowline was carried out and it was<br />
determined to be uneconomic to repair. During <strong>2012</strong>, the Ikdam FPSO was disconnected from the Oudna field and the wells were permanently<br />
abandoned. During the reporting period <strong>Lundin</strong> <strong>Petroleum</strong> has increased its ownership in the Ikdam FPSO to 100 percent and will now seek new<br />
opportunities for the vessel.<br />
Congo (Brazzaville)<br />
With the relinquishment of its interest in the Block Marine XI licence (WI 18.75%) in June <strong>2012</strong> and the expiry of the Block Marine XIV licence<br />
(WI 21.55%) in October <strong>2012</strong>, <strong>Lundin</strong> <strong>Petroleum</strong> has exited Congo (Brazzaville).<br />
FINANCIAL REVIEW<br />
Result<br />
The net result for the twelve month period ended 31 December <strong>2012</strong> (reporting period) amounted to MUSD 103.9 (MUSD 155.2). The net result<br />
attributable to shareholders of the Parent Company for the reporting period amounted to MUSD 108.2 (MUSD 160.1) representing earnings per<br />
share on a fully diluted basis of USD 0.35 (USD 0.51).<br />
Earnings before interest, tax, depletion and amortisation (EBITDA) for the reporting period amounted to MUSD 1,144.1 (MUSD 1,012.1)<br />
representing EBITDA per share on a fully diluted basis of USD 3.68 (USD 3.25). Operating cash flow for the reporting period amounted to<br />
MUSD 831.4 (MUSD 676.2) representing operating cash flow per share on a fully diluted basis of USD 2.68 (USD 2.17).<br />
Changes in the Group<br />
On 27 August <strong>2012</strong>, <strong>Lundin</strong> <strong>Petroleum</strong> acquired a further 60 percent equity in Ikdam Production SA, a company which owns the Ikdam FPSO,<br />
bringing its total ownership to 100 percent. The financial results of Ikdam Production SA are fully consolidated in the Group’s financial statements<br />
from the end of August <strong>2012</strong>.<br />
Operating income<br />
Net sales of oil and gas for the reporting period amounted to MUSD 1,319.5 (MUSD 1,257.7) and are detailed in Note 1. The average price achieved<br />
by <strong>Lundin</strong> <strong>Petroleum</strong> for a barrel of oil equivalent amounted to USD 100.89 (USD 101.04) and is detailed in the following table. The average Dated<br />
Brent price for the reporting period amounted to USD 111.67 (USD 111.26) per barrel. The Alvheim and Volund field crude cargoes sold during the<br />
reporting period averaged USD 3.53 (USD 3.87) per barrel over Dated Brent for the pricing period for each lifting.<br />
› 9 ‹<br />
<strong>YEAR</strong> <strong>END</strong> <strong>REPORT</strong> <strong>2012</strong>
<strong>YEAR</strong> <strong>END</strong> <strong>REPORT</strong> <strong>2012</strong><br />
Sales of oil and gas for the reporting period were comprised as follows:<br />
Sales<br />
Average price per boe expressed in USD<br />
› 10 ‹<br />
1 Jan <strong>2012</strong>-<br />
31 Dec <strong>2012</strong><br />
12 months<br />
1 Oct <strong>2012</strong>-<br />
31 Dec <strong>2012</strong><br />
3 months<br />
1 Jan 2011-<br />
31 Dec 2011<br />
12 months<br />
1 Oct 2011-<br />
31 Dec 2011<br />
3 months<br />
Crude oil sales<br />
Norway<br />
- Quantity in Mboe 8,270.1 2,059.4 7,896.0 2,085.7<br />
- Average price per boe<br />
France<br />
115.29 114.35 115.38 113.36<br />
- Quantity in Mboe 1,041.1 337.9 1,155.5 283.3<br />
- Average price per boe<br />
Netherlands<br />
110.44 108.79 110.59 110.68<br />
- Quantity in Mboe 1.7 0.5 2.2 0.6<br />
- Average price per boe<br />
Russia<br />
100.09 101.45 103.87 95.74<br />
- Quantity in Mboe 981.6 225.4 1,138.4 271.2<br />
- Average price per boe<br />
Tunisia<br />
77.23 79.00 69.85 70.34<br />
- Quantity in Mboe 227.5 – 198.2 –<br />
- Average price per boe<br />
Total crude oil sales<br />
108.14 – 125.12 –<br />
- Quantity in Mboe 10,522.0 2,623.2 10,390.3 2,640.8<br />
- Average price per boe<br />
Gas and NGL sales<br />
Norway<br />
110.90 109.80 110.25 109.46<br />
- Quantity in Mboe 1,513.9 467.5 947.2 268.0<br />
- Average price per boe<br />
Netherlands<br />
64.18 70.35 61.14 60.94<br />
- Quantity in Mboe 704.2 169.4 722.8 184.1<br />
- Average price per boe<br />
Indonesia<br />
60.18 62.92 60.61 64.04<br />
- Quantity in Mboe 338.1 113.4 387.7 117.0<br />
- Average price per boe<br />
Total gas and NGL sales<br />
32.43 31.73 32.43 32.19<br />
- Quantity in Mboe 2,556.2 750.3 2,057.7 569.1<br />
- Average price per boe<br />
Total sales<br />
59.69 65.59 54.50 52.26<br />
- Quantity in Mboe 13,078.2 3,373.5 12,448.0 3,209.9<br />
- Average price per boe 100.89 99.97 101.04 99.32<br />
Sales quantities in a period can differ from production quantities as a result of permanent and timing differences. Timing differences can arise due<br />
to inventory, storage and pipeline balances effects. Permanent differences arise as a result of paying royalties in kind as well as the effects from<br />
production sharing agreements.<br />
The oil produced in Russia is sold on either the Russian domestic market or exported into the international market. 45 percent (37 percent) of<br />
Russian sales for the reporting period were on the international market at an average price of USD 109.93 per barrel (USD 109.92 per barrel) with<br />
the remaining 55 percent (63 percent) of Russian sales being sold on the domestic market at an average price of USD 49.98 per barrel (USD 46.45<br />
per barrel).<br />
Other operating income amounted to MUSD 25.7 (MUSD 11.8) for the reporting period and includes MUSD 11.0 (MUSD -) relating to a pre-tax<br />
settlement of an equity redetermination that was agreed between the parties in Blocks K4a, K4b/K5a and K5b, offshore Netherlands, and MUSD 6.5<br />
(MUSD 5.8) of income relating to a quality differential compensation payable from the Vilje field owners to the Alvheim and Volund field owners in<br />
Norway. The quality compensation adjustment in Norway arises as all three fields produce to the Alvheim FPSO vessel and the oil is commingled to
› 11 ‹<br />
<strong>YEAR</strong> <strong>END</strong> <strong>REPORT</strong> <strong>2012</strong><br />
produce an Alvheim crude blend which is then sold. Also included in other operating income is tariff income from France and the Netherlands and<br />
income for maintaining strategic inventory levels in France.<br />
Production costs<br />
Production costs including inventory movements for the reporting period amounted to MUSD 172.5 (MUSD 193.1) and are detailed in Note 2.<br />
The production costs in the reporting period includes a MUSD 15.9 credit for inventory movements compared to a MUSD 13.1 charge in the<br />
comparative period as explained below. The production and depletion costs per barrel of oil equivalent produced are detailed in the table below.<br />
Production cost and depletion<br />
in USD per boe<br />
1 Jan <strong>2012</strong>-<br />
31 Dec <strong>2012</strong><br />
12 months<br />
1 Oct <strong>2012</strong>-<br />
31 Dec <strong>2012</strong><br />
3 months<br />
1 Jan 2011-<br />
31 Dec 2011<br />
12 months<br />
1 Oct 2011-<br />
31 Dec 2011<br />
3 months<br />
Cost of operations 8.09 8.86 8.43 8.89<br />
Tariff and transportation expenses 2.27 2.63 1.88 1.64<br />
Royalty and direct taxes 3.93 3.73 4.31 4.03<br />
Changes in inventory/lifting position -1.22 -0.61 1.08 -0.01<br />
Other 0.14 – 0.18 0.17<br />
Total production costs 13.21 14.61 15.88 14.72<br />
Depletion 1 14.26 14.64 13.59 13.72<br />
Total cost per boe 27.47 29.25 29.47 28.44<br />
1 excludes decommissioning costs<br />
The total cost of operations for the reporting period was MUSD 105.6 compared to MUSD 102.5 for the comparative period and includes cost of<br />
operations of MUSD 12.0 associated with the Gaupe field, Norway which came onstream on 31 March <strong>2012</strong>. The cost of operations for the Oudna<br />
field, Tunisia was MUSD 8.6 for the reporting period compared to MUSD 17.0 for the comparative period following the shut-in of production in<br />
March <strong>2012</strong>. The cost of operations per barrel for the reporting period was lower than the comparative period due mainly to the higher production.<br />
The cost of operations per barrel for the fourth quarter of <strong>2012</strong> amounted to USD 8.86 per barrel and was higher than the previous quarters of <strong>2012</strong><br />
due primarily to a planned well intervention campaign on fields in the Paris Basin, France. For <strong>2012</strong>, the average cost of operations per barrel for the<br />
year was USD 8.09 per barrel which is in line with the prior guidance given at the end of the third quarter of USD 8.25 per barrel.<br />
The tariff and transportation expenses for the reporting period amounted to MUSD 29.7 compared to MUSD 22.9 for the comparative period.<br />
Included in the reporting period are costs associated with the Gaupe field of MUSD 7.4.<br />
Royalty and direct taxes includes Russian Mineral Resource Extraction Tax (MRET) and Russian Export Duties. The rate of MRET is levied on the<br />
volume of Russian production and varies in relation to the international market price of Urals blend and the Rouble exchange rate. MRET averaged<br />
USD 22.92 (USD 21.21) per barrel of Russian production for the reporting period. The rate of export duty on Russian oil is revised monthly by the<br />
Russian Federation and is dependent on the average price obtained for Urals Blend for the preceding one month period. The export duty is levied<br />
on the volume of oil exported from Russia and averaged USD 57.08 (USD 57.52) per barrel for the reporting period.<br />
There are both permanent and timing differences that result in sales volumes not being equal to production volumes during a period. Changes to<br />
the hydrocarbon inventory and under or overlift positions result from these timing differences and an amount of MUSD 15.9 was credited to the<br />
income statement for the reporting period compared to a MUSD 13.1 charge for the comparative period. There was a net underlift movement of<br />
MUSD 18.5 on the Alvheim/Volund fields, Norway, where crude sales volumes during the reporting period were lower than production volumes<br />
compared to a MUSD 18.7 net overlift movement for the comparative period. In addition, the Gaupe field, Norway, was underlifted during the<br />
reporting period resulting in a MUSD 12.9 (MUSD -) credit to production costs.The Gaupe field hydrocarbons are processed across the non-operated<br />
Armada host platform and there is an allocation agreement whereby new fields compensate existing fields through volume for production deferred<br />
by the new production stream. The resultant underlift position is repaid by the existing fields in future periods. There were also liftings of inventory<br />
from the Ikdam FPSO on the Oudna field, Tunisia, resulting in a MUSD 14.6 (MUSD -6.2) charge to production costs in the reporting period.<br />
Depletion and decommissioning costs<br />
Depletion charges amounted to MUSD 186.2 (MUSD 165.1) and are detailed in Note 3. Norway contributed 83 percent of the total depletion charge<br />
for the reporting period at an average rate of USD 15.54 per barrel. The increase in depletion charges over the comparative period is mainly a result<br />
of the inclusion of the Gaupe field, Norway.<br />
Decommissioning costs charged to the income statement in the reporting period amounted to MUSD 5.3 (MUSD -) and represent the costs of<br />
decommissioning the Oudna field, Tunisia, in excess of the provision for this work. The Oudna field was fully decommissioned in <strong>2012</strong>.<br />
Exploration costs<br />
Exploration costs for the reporting period amounted to MUSD 168.5 (MUSD 140.0) and are detailed in Note 4. Exploration and appraisal costs are<br />
capitalised as they are incurred. When exploration drilling is unsuccessful, the capitalised costs are expensed. All capitalised exploration costs are<br />
reviewed on a regular basis and are expensed where there is uncertainty regarding their recoverability.
<strong>YEAR</strong> <strong>END</strong> <strong>REPORT</strong> <strong>2012</strong><br />
During the fourth quarter of <strong>2012</strong>, in Norway, the costs of the Albert well on PL519 and the Juksa well and associated licence costs on PL490 were<br />
expensed for amounts of MUSD 36.6 and MUSD 50.1 respectively. In Malaysia, the costs of drilling the Merawan Batu prospect and associated<br />
licence costs on PM308B of MUSD 36.1 were expensed. Other exploration costs amounting to MUSD 12.1 have also been expensed in the quarter.<br />
In the third quarter of <strong>2012</strong>, the Tiga Papan 5 well in SB307/308, offshore Sabah, east Malaysia was plugged and abandoned as a dry hole. The cost<br />
of the well and associated licence costs amounting to MUSD 9.2 were expensed.<br />
During the first half of <strong>2012</strong>, costs associated with the Clapton well on PL440S, Norway and the Rangkas Block, Indonesia were expensed.<br />
Impairment costs<br />
Impairment costs for the reporting period amounted to MUSD 237.5 (MUSD -) and are detailed in Note 5. Following poor performance since<br />
the start of production from the Gaupe field, Norway, the reserves have been reduced based on the conservative assumption that no further<br />
production wells will be drilled resulting in an impairment charge of MUSD 205.8. In addition, poor reservoir performance from the onshore Russian<br />
assets has led to an impairment charge of MUSD 31.7.<br />
General, administrative and depreciation expenses<br />
The general, administrative and depreciation expenses for the reporting period amounted to MUSD 31.7 (MUSD 67.0) of which MUSD 9.1<br />
(MUSD 44.9) related to non-cash charges in relation to the Group’s Long-term Incentive Plan (LTIP) scheme.<br />
The provision for the LTIP is calculated based on <strong>Lundin</strong> <strong>Petroleum</strong>’s share price at the balance sheet date. The value of the awards, calculated using<br />
the Black and Scholes method, is applied to the vested portion of the outstanding LTIP awards including that of previous periods with the change in<br />
the provision being reflected in the income statement. The <strong>Lundin</strong> <strong>Petroleum</strong> share price decreased in the first half of <strong>2012</strong> and the reversal of part<br />
of the provision reported at 31 December 2011 resulted in a credit to the income statement in the reporting period up to 30 June <strong>2012</strong>. The share<br />
price increased by approximately 24 percent as at 30 September <strong>2012</strong> compared to 30 June <strong>2012</strong>, which resulted in an increase in the provision for<br />
LTIP at the balance sheet date and a corresponding charge to the income statement for the third quarter <strong>2012</strong>. During the fourth quarter of <strong>2012</strong>,<br />
the share price decreased by approximately 7 percent as at 31 December <strong>2012</strong> compared to 30 September <strong>2012</strong>. <strong>Lundin</strong> <strong>Petroleum</strong> has mitigated<br />
the exposure of the LTIP by purchasing its own shares. For more detail refer to the remuneration section below.<br />
Depreciation charges for the reporting period amounted to MUSD 3.1 (MUSD 2.6).<br />
Financial income<br />
Financial income for the reporting period amounted to MUSD 27.2 (MUSD 46.5) and is detailed in Note 7.<br />
Interest income for the reporting period amounted to MUSD 5.1 (MUSD 4.1). The interest income in the fourth quarter of <strong>2012</strong> includes MUSD 1.3<br />
in relation to the Brynhild transaction with Talisman Energy.<br />
Net foreign exchange gains for the reporting period amounted to MUSD 6.2 (MUSD 8.9). During the reporting period, there was an exchange loss<br />
of MUSD 5.5 (MUSD -8.9) on the non-USD denominated intercompany loans and working capital balances and this loss was offset by a realised<br />
exchange gain of MUSD 11.7 (MUSD -) on settled foreign exchange hedges.<br />
A gain on consolidation of a subsidiary of MUSD 13.4 (MUSD -) was reported in the third quarter of <strong>2012</strong> and relates to the accounting for the full<br />
consolidation of Ikdam Production SA (IPSA) following the acquisition of the outstanding 60 percent of the shares of the company at the end of<br />
August <strong>2012</strong>. <strong>Lundin</strong> <strong>Petroleum</strong> already held 40 percent of the shares in IPSA which was acquired as part the Coparex acquisition in 2002. At the<br />
time of the Coparex acquisition, no value was assigned to the shares of IPSA and a provision was made against a loan to IPSA from the Group.<br />
Following the acquisition of the remaining 60 percent equity, a step-up in the carrying value of the existing 40 percent interest based on the fair<br />
value of the assets and liabilities of the company at the end of August <strong>2012</strong> was recorded and the provision made against the original loan was<br />
released.<br />
An amount of MUSD 30.0 relating to the gain on sale of Africa Oil Corporation shares is included in financial income for the comparative period.<br />
Financial expenses<br />
Financial expenses for the reporting period amounted to MUSD 48.5 (MUSD 21.0) and are detailed in Note 8.<br />
Interest expenses for the reporting period amounted to MUSD 6.8 (MUSD 5.4). An additional amount of interest of MUSD 3.4 (MUSD 1.4) associated<br />
with the funding of the Norwegian development projects was capitalised in the reporting period.<br />
A provision for the costs of site restoration is recorded in the balance sheet at the discounted value of the estimated future cost. The effect of<br />
the discount is unwound each year and charged to the income statement. An amount of MUSD 5.1 (MUSD 4.5) has been charged to the income<br />
statement for the reporting period.<br />
The amortisation of the deferred financing fees for the reporting period amounted to MUSD 6.6 (MUSD 2.1) and relates to the expensing of the fees<br />
incurred in establishing the loan facility over the period of usage of that facility. <strong>Lundin</strong> <strong>Petroleum</strong> arranged a new USD 2.5 billion financing facility<br />
which was signed on the 25 June <strong>2012</strong> and the fees associated with this facility are being amortised on a going forward basis.<br />
Loan facility commitment fees for the reporting period amounted to MUSD 10.3 (MUSD 1.0). The increase over the comparative period relates to<br />
the commitment fees on the undrawn portion of the larger USD 2.5 billion financing facility entered into in June <strong>2012</strong>.<br />
› 12 ‹
<strong>Lundin</strong> <strong>Petroleum</strong> owns 50 million shares in ShaMaran <strong>Petroleum</strong> which were acquired in 2009 in a non-cash transaction. The investment was<br />
booked at the fair value of the shares at the date of acquisition and under accounting rules, subsequent movements in the fair value of the shares<br />
were being recognised in other comprehensive income. In January <strong>2012</strong>, ShaMaran <strong>Petroleum</strong> announced that it had relinquished its working<br />
interests in its operated Production Sharing Contract licences and, as such, it was considered that there had been a permanent diminution in the<br />
fair value of the shares of ShaMaran <strong>Petroleum</strong> held by <strong>Lundin</strong> <strong>Petroleum</strong>. As a result of the permanent diminution in the fair value of the shares,<br />
the cumulative loss recognised in other comprehensive income of MUSD 18.6 was reclassified from equity and recognised in the income statement<br />
in the first quarter of <strong>2012</strong>. The subsequent gain on the shares since the impairment has been recognised in other comprehensive income.<br />
Tax<br />
The tax charge for the reporting period amounted to MUSD 418.4 (MUSD 574.4) and is detailed in Note 9.<br />
The current tax charge for the reporting period amounted to MUSD 341.3 (MUSD 400.2) of which MUSD 311.8 (MUSD 365.6) relates to Norway.<br />
The Norwegian current tax charge for the reporting period is lower than the comparative period primarily as a result of higher development and<br />
exploration expenditure.<br />
The deferred tax charge for the reporting period amounted to MUSD 77.1 (MUSD 174.2) and arises primarily where there is a difference in<br />
depreciation for tax and accounting purposes. In Norway, there is a net deferred tax charge for the reporting period of MUSD 80.4 (MUSD 166.2)<br />
which is net of a deferred tax release on the impairment of the Gaupe field amounting to MUSD 160.6 in the fourth quarter of <strong>2012</strong>.<br />
The Group operates in various countries and fiscal regimes where corporate income tax rates are different from the regulations in Sweden.<br />
Corporate income tax rates for the Group vary between 20 percent and 78 percent. The effective tax rate for the Group for the reporting period<br />
amounted to 80 percent. This effective rate is calculated from the face of the income statement and does not reflect the effective rate of tax paid<br />
within each country of operation. The overall effective rate of tax is driven by Norway where the tax rate is 78 percent reduced by the effect of uplift<br />
on development expenditure for tax purposes. The effective rate is increased due to a number of non-tax adjusted items in the reporting period<br />
including the impairment of the ShaMaran shares, the Malaysian expensed exploration costs and certain general and administrative costs, as well<br />
as a lower tax credit on the exploration costs relating to the Rangkas Block, Indonesia. There is no tax expense associated with the financial income<br />
booked on full consolidation of Ikdam Production SA.<br />
Non-controlling interest<br />
The net result attributable to non-controlling interest for the reporting period amounted to MUSD -4.3 (MUSD -4.9) and relates mainly to the noncontrolling<br />
interest’s share in a Russian subsidiary which is fully consolidated.<br />
BALANCE SHEET<br />
Non-current assets<br />
Oil and gas properties amounted to MUSD 2,864.4 (MUSD 2,329.3) and are detailed in Note 10.<br />
Development and exploration expenditure incurred for the reporting period was as follows:<br />
Development expenditure<br />
in MUSD<br />
› 13 ‹<br />
1 Jan <strong>2012</strong>-<br />
31 Dec <strong>2012</strong><br />
12 months<br />
1 Oct <strong>2012</strong>-<br />
31 Dec <strong>2012</strong><br />
3 months<br />
<strong>YEAR</strong> <strong>END</strong> <strong>REPORT</strong> <strong>2012</strong><br />
1 Jan 2011-<br />
31 Dec 2011<br />
12 months<br />
1 Oct 2011-<br />
31 Dec 2011<br />
3 months<br />
Norway 369.0 133.1 186.8 30.8<br />
France 29.2 2.9 30.9 10.2<br />
Netherlands 8.5 1.7 4.1 1.7<br />
Indonesia -0.4 -0.4 6.4 2.3<br />
Russia 7.5 1.8 4.2 0.7<br />
413.8 139.1 232.4 45.7<br />
During the reporting period, an amount of MUSD 369.0 of development expenditure was incurred in Norway, primarily on the Brynhild and Edvard<br />
Grieg field developments. In the comparative period, MUSD 186.8 was spent on the development of the Gaupe and Alvheim fields. In the reporting<br />
period, MUSD 29.2 was incurred in France, primarily on the Grandville field redevelopment.
<strong>YEAR</strong> <strong>END</strong> <strong>REPORT</strong> <strong>2012</strong><br />
Exploration and appraisal expenditure<br />
in MUSD<br />
› 14 ‹<br />
1 Jan <strong>2012</strong>-<br />
31 Dec <strong>2012</strong><br />
12 months<br />
1 Oct <strong>2012</strong>-<br />
31 Dec <strong>2012</strong><br />
3 months<br />
1 Jan 2011-<br />
31 Dec 2011<br />
12 months<br />
1 Oct 2011-<br />
31 Dec 2011<br />
3 months<br />
Norway 323.2 113.0 288.6 51.6<br />
France 9.8 5.7 1.7 0.7<br />
Indonesia 16.4 3.0 16.4 4.4<br />
Russia 3.6 1.8 10.0 3.1<br />
Malaysia 100.5 40.2 98.7 38.4<br />
Congo (Brazzaville) 1.3 -0.5 19.0 11.4<br />
Other 2.5 0.0 3.1 0.9<br />
457.3 163.2 437.5 110.5<br />
During the reporting period, exploration and appraisal expenditure of MUSD 323.2 was incurred in Norway mainly on the appraisal drilling of the<br />
Johan Sverdrup field and exploration drilling of the Clapton prospect on PL440S, the Albert prospect on PL519, the Salinas prospect on PL533<br />
and the Juksa well on PL490. In the comparative period, MUSD 288.6 was spent in Norway on the Johan Sverdrup field appraisal drilling and four<br />
exploration wells. MUSD 100.5 (MUSD 98.7) was spent in Malaysia primarily on drilling five wells and the acquisition of seismic data.<br />
Tangible fixed assets amounted to MUSD 49.4 (MUSD 16.1) and represent office fixed assets and real estate, as well as the Ikdam FPSO which was<br />
consolidated for the first time in August <strong>2012</strong>.<br />
Financial assets amounted to MUSD 44.1 (MUSD 44.1) and are detailed in Note 11. Other shares and participations amounted to MUSD 20.0<br />
(MUSD 17.8) and predominantly relate to the shares held in ShaMaran <strong>Petroleum</strong> which are reported at market value.<br />
Current assets<br />
Receivables and inventories amounted to MUSD 238.4 (MUSD 224.4) and are detailed in Note 12.<br />
Inventories amounted to MUSD 18.7 (MUSD 31.6) and include both hydrocarbon inventories and well supplies. The reduction compared to<br />
31 December 2011 is mainly due to the lifting of the Oudna field, Tunisia hydrocarbon inventory during the reporting period.<br />
Underlift amounted to MUSD 26.4 (MUSD -) of which MUSD 24.5 related to the Norwegian producing fields, including the Gaupe field. At<br />
31 December 2011, there was an overlift position of MUSD 7.7 shown under current liabilities which related to the Alvheim and Volund fields in<br />
Norway.<br />
Prepaid expenses and accrued income amounted to MUSD 32.9 (MUSD 4.5) and includes prepaid insurance on the Edvard Grieg development<br />
project, Norway and 2013 Norwegian licence fees.<br />
Cash and cash equivalents amounted to MUSD 97.4 (MUSD 73.6). Cash balances are held to meet operational and investment requirements.<br />
Non-current liabilities<br />
The non-current part of provisions amounted to MUSD 1,204.6 (MUSD 988.0) and is detailed in Note 13.<br />
The provision for site restoration amounted to MUSD 190.5 (MUSD 119.3) and relates to future decommissioning obligations.The increase compared<br />
to 31 December 2011 mainly results from updated estimates for decommissioning costs and the use of a lower discount factor to calculate the<br />
present value of the decommissioning liabilities.<br />
The provision for deferred taxes amounted to MUSD 942.2 (MUSD 803.5) and is arising on the excess of book value over the tax value of oil and gas<br />
properties. Deferred tax assets are netted off against deferred tax liabilities where they relate to the same jurisdiction.<br />
The non-current portion of the provision for <strong>Lundin</strong> <strong>Petroleum</strong>’s LTIP scheme amounted to MUSD 67.1 (MUSD 58.1).<br />
Financial liabilities amounted to MUSD 384.2 (MUSD 204.5) and are detailed in Note 14. Bank loans amounted to MUSD 432.0 (MUSD 207.0)<br />
and relates to the outstanding loan under the Group’s USD 2.5 billion revolving borrowing base facility. Capitalised financing fees amounted to<br />
MUSD 47.8 (MUSD 2.5) and relate to the new seven year USD 2.5 billion financing facility entered into in June <strong>2012</strong>. The capitalised fees are being<br />
amortised over the expected life of the financing facility. The comparative amount relates to the balance of the capitalised financing fees for the<br />
previous financing facility which were fully expensed during the reporting period. Under reporting standards, the capitalised financing fees have<br />
been offset against the bank loan.<br />
Other non-current liabilities amounted to MUSD 22.6 (MUSD 21.8) and mainly arises from the full consolidation of a subsidiary in which the noncontrolling<br />
interest entity has made funding advances in relation to LLC PetroResurs, Russia.<br />
Current liabilities<br />
Other current liabilities amounted to MUSD 423.5 (MUSD 390.6) and are detailed in Note 15.
Tax liabilities amounted to MUSD 170.0 (MUSD 240.1) of which MUSD 163.6 (MUSD 223.0) relates to Norway.<br />
Joint venture creditors amounted to MUSD 213.9 (MUSD 88.4) and relates to the high level of development and drilling activity in Norway and<br />
Malaysia.<br />
PARENT COMPANY<br />
The business of the Parent Company is investment in and management of oil and gas assets. The net result for the Parent Company amounted to<br />
MSEK 762.2 (MSEK -182.4) for the reporting period.<br />
The operating income includes service income received from Group companies. The result includes general and administrative expenses of<br />
MSEK 84.5 (MSEK 206.1), intra-group interest expense of MSEK 31.3 (MSEK 25.5) and a dividend received from a subsidiary of MSEK 804.7 (MSEK -).<br />
The general and administrative expenses in the reporting period are impacted by the variation in the provision for the Group’s LTIP. The high cost<br />
in the comparative period was a result of a significant increase in the <strong>Lundin</strong> <strong>Petroleum</strong> share price during 2011. The comparative period includes<br />
financial income of MSEK 6.5 for supporting certain financial obligations for ShaMaran <strong>Petroleum</strong>.<br />
Pledged assets of MSEK 11,911.6 (MSEK 12,333.2) relate to the accounting value of the pledge of the shares in respect of the new financing facility<br />
entered into by its fully-owned subsidiary <strong>Lundin</strong> <strong>Petroleum</strong> BV. (See also the liquidity section.)<br />
RELATED PARTY TRANSACTIONS<br />
During the reporting period, the Group has entered into transactions with related parties on a commercial basis as described below:<br />
The Group received MUSD 0.4 (MUSD 0.4) from ShaMaran <strong>Petroleum</strong> for the provision of office and other services and MUSD – (MUSD 0.9) for<br />
supporting certain financial obligations.<br />
The Group paid MUSD 0.8 (MUSD 0.7) to other related parties in respect of aviation services received.<br />
LIQUIDITY<br />
<strong>Lundin</strong> <strong>Petroleum</strong> had a secured revolving borrowing base facility of MUSD 850 with a seven year term expiring in 2014. On 25 June <strong>2012</strong>, <strong>Lundin</strong><br />
<strong>Petroleum</strong> entered into a new seven year senior secured revolving borrowing base facility of USD 2.5 billion. The facility is with a group of 25 banks<br />
including many of the banks providing the USD 850 million facility. The USD 2.5 billion financing facility is a revolving borrowing base facility<br />
secured against certain cash flows generated by the Group. The amount available under the facility is recalculated every six months based upon the<br />
calculated cash flow generated by certain producing fields at an oil price and economic assumptions agreed with the banking syndicate providing<br />
the facility. The facility is secured by a pledge over the shares of certain Group companies and a charge over some of the bank accounts of the<br />
pledged companies. For accounting purposes, the pledged amount at 31 December <strong>2012</strong> is MUSD 1,831.3 (MUSD 1,791.0) and is the accounting<br />
value of net assets of the Group companies whose shares are pledged.<br />
The new facility has been completed to provide funding for <strong>Lundin</strong> <strong>Petroleum</strong>’s ongoing exploration expenditure and development costs,<br />
particularly in Norway.<br />
<strong>Lundin</strong> <strong>Petroleum</strong> has, through its subsidiary <strong>Lundin</strong> Malaysia BV, entered into five Production Sharing Contracts (PSC) with Petroliam Nasional<br />
Berhad, the oil and gas company of the Government of Malaysia (Petronas), in respect of the six operated Blocks in Malaysia. Bank guarantees have<br />
been issued in support of the work commitments in relation to these PSCs amounting to MUSD 75.4. In addition, bank guarantees have been issued<br />
to cover work commitments in Indonesia amounting to MUSD 2.4 and in Tunisia for MUSD 1.5 relating to a tax dispute.<br />
During the second quarter of <strong>2012</strong>, <strong>Lundin</strong> <strong>Petroleum</strong> purchased 485,647 of its own shares at an average share price of SEK 128 per share.<br />
SUBSEQUENT EVENTS<br />
No significant events have occurred after the end of the reporting period that are expected to have a substantial effect on this financial report.<br />
SHARE DATA<br />
<strong>Lundin</strong> <strong>Petroleum</strong> AB’s issued share capital amounted to SEK 3,179,106 represented by 317,910,580 shares with a quota value of SEK 0.01 each.<br />
Under the authorisation of the Board granted at the AGM held on 10 May <strong>2012</strong>, <strong>Lundin</strong> <strong>Petroleum</strong> purchased 485,647 of its own shares during the<br />
second quarter of <strong>2012</strong>. As at 31 December <strong>2012</strong>, <strong>Lundin</strong> <strong>Petroleum</strong> held 7,368,285 of its own shares.<br />
The Board of directors will propose to the AGM that no dividend will be paid to the shareholders for the financial year <strong>2012</strong>.<br />
REMUNERATION<br />
<strong>Lundin</strong> <strong>Petroleum</strong>’s principles for remuneration are provided in the Company’s 2011 Annual Report.<br />
Unit Bonus Plan<br />
In 2008, <strong>Lundin</strong> <strong>Petroleum</strong> implemented a LTIP scheme consisting of a Unit Bonus Plan which provides for an annual grant of units that will lead<br />
to a cash payment at vesting. The LTIP has a three year duration whereby the initial grant of units vests equally in three tranches: one third after<br />
one year; one third after two years; and the final third after three years. The cash payment is conditional upon the holder of the units remaining an<br />
employee of the Group at the time of payment. The share price for determining the cash payment at the end of each vesting period will be the five<br />
trading day average closing <strong>Lundin</strong> <strong>Petroleum</strong> share price prior to and following the actual vesting date.<br />
An LTIP that follows the same principles as the 2008 LTIP has been implemented annually for employees other than Executive Management.<br />
› 15 ‹<br />
<strong>YEAR</strong> <strong>END</strong> <strong>REPORT</strong> <strong>2012</strong>
<strong>YEAR</strong> <strong>END</strong> <strong>REPORT</strong> <strong>2012</strong><br />
The number of units relating to the 2010, 2011 and <strong>2012</strong> Unit Bonus Plans outstanding as at 31 December <strong>2012</strong> were 209,162, 250,625 and 361,158<br />
respectively.<br />
Phantom Option Plan<br />
At the AGM on 13 May 2009, the shareholders of <strong>Lundin</strong> <strong>Petroleum</strong> approved the implementation of an LTIP for Executive Management (being the<br />
President and Chief Executive Officer, the Chief Operating Officer, the Chief Financial Officer and the Senior Vice President Operations) consisting<br />
of a grant of phantom options exercisable after five years from the date of grant. The exercise of these options entitles the recipient to receive a<br />
cash payment based on the appreciation of the market value of the <strong>Lundin</strong> <strong>Petroleum</strong> share. Payment of the award under these phantom options<br />
will occur in two equal installments: (i) first on the date immediately following the fifth anniversary of the date of grant and (ii) second on the date<br />
which is one year following the date of the first payment.<br />
The LTIP for Executive Management includes 5,500,928 phantom options with an exercise price of SEK 52.91. The phantom options will vest in May<br />
2014 being the fifth anniversary of the date of grant. The recipients will be entitled to receive a cash payment equal to the average closing price of<br />
the Company’s shares during the fifth year following grant, less the exercise price, multiplied by the number of phantom options. The participants<br />
of the phantom option plan are not entitled to receive new awards under the Unit Bonus Plan whilst the phantom options are still outstanding.<br />
<strong>Lundin</strong> <strong>Petroleum</strong> purchased 6,882,638 of its own shares up to 31 December 2010 at an average cost of SEK 46.51 per share to mitigate against<br />
the exposure of the LTIP. The <strong>Lundin</strong> <strong>Petroleum</strong> share price at 31 December <strong>2012</strong> was SEK 149.50. The provision for LTIP amounted to MUSD 64.0<br />
including social charges as at 31 December <strong>2012</strong> and the market value of these shares held at 31 December <strong>2012</strong> was MUSD 158.2. The gain in the<br />
value of the own shares held cannot be offset against the cost for the LTIP in the financial statements in accordance with accounting rules.<br />
ACCOUNTING POLICIES<br />
This interim report has been prepared in accordance with International Accounting Standard (IAS) 34, Interim Financial Reporting, and the Swedish<br />
Annual Accounts Act (1995:1554). The accounting policies adopted are consistent with those followed in the preparation of the Group’s annual<br />
financial statements for the year ended 31 December 2011.<br />
The financial reporting of the Parent Company has been prepared in accordance with accounting principles generally accepted in Sweden, applying<br />
RFR 2 Reporting for legal entities, issued by the Swedish Financial Reporting Board and the Annual Accounts Act (1995:1554).<br />
Under Swedish company regulations it is not allowed to report the Parent Company results in any other currency than SEK and consequently the<br />
Parent Company’s financial information is reported in SEK and not in USD.<br />
RISKS AND RISK MANAGEMENT<br />
The objective of Business Risk Management is to identify, understand and manage threats and opportunities within the business on a continual<br />
basis. This objective is achieved by creating a mandate and commitment to risk management at all levels of the business. This approach actively<br />
addresses risk as an integral and continual part of decision making within the Group and is designed to ensure that all risks are identified, fully<br />
acknowledged, understood and communicated well in advance. The ability to manage and or mitigate these risks represents a key component<br />
in ensuring that the business aim of the Company is achieved. Nevertheless, oil and gas exploration, development and production involve high<br />
operational and financial risks, which even a combination of experience, knowledge and careful evaluation may not be able to fully eliminate or<br />
which are beyond the Company’s control.<br />
A detailed analysis of <strong>Lundin</strong> <strong>Petroleum</strong>’s strategic, operational, financial and external risks and mitigation of those risks through risk management<br />
is described in <strong>Lundin</strong> <strong>Petroleum</strong>’s 2011 Annual Report.<br />
Derivative financial instruments<br />
During the second quarter of <strong>2012</strong>, the Group entered into currency hedging contracts fixing the rate of exchange from USD into NOK to meet NOK<br />
operational and tax requirements as summarised in the table below. Under IAS 39, subject to hedge effectiveness testing, these hedges are treated<br />
as effective and changes to the fair value are reflected in other comprehensive income. At 31 December <strong>2012</strong>, a current asset has been recognised<br />
amounting to MUSD 9.1 (MUSD -) representing the short-term portion of the fair value of the outstanding currency hedging contracts.<br />
Buy Sell<br />
› 16 ‹<br />
Average contractual<br />
exchange rate Settlement period<br />
MNOK 1,580.7 MUSD 261.6 NOK 6.04: 1 USD 1 Jun <strong>2012</strong> – 20 Dec <strong>2012</strong><br />
MNOK 670.7 MUSD 110.4 NOK 6.07: 1 USD 2 Jan 2013 – 20 Dec 2013<br />
EXCHANGE RATES<br />
For the preparation of the financial statements for the reporting period, the following currency exchange rates have been used.<br />
31 Dec <strong>2012</strong> 31 Dec 2011<br />
Average Period end Average Period end<br />
1 USD equals NOK 5.8148 5.5639 5.5998 5.9927<br />
1 USD equals Euro 0.7778 0.7579 0.7185 0.7729<br />
1 USD equals Rouble 31.0546 30.5665 29.3738 32.2784<br />
1 USD equals SEK 6.7725 6.5045 6.4867 6.8877
Expressed in TUSD Note<br />
Operating income<br />
CONSOLIDATED INCOME STATEMENT IN SUMMARY<br />
› 17 ‹<br />
1 Jan <strong>2012</strong>-<br />
31 Dec <strong>2012</strong><br />
12 months<br />
1 Oct <strong>2012</strong>-<br />
31 Dec <strong>2012</strong><br />
3 months<br />
1 Jan 2011-<br />
31 Dec 2011<br />
12 months<br />
1 Oct 2011-<br />
31 Dec 2011<br />
3 months<br />
Net sales of oil and gas 1 1,319,490 337,258 1,257,691 318,810<br />
Other operating income 25,652 5,342 11,824 4,193<br />
Cost of sales<br />
1,345,142 342,600 1,269,515 323,003<br />
Production costs 2 -172,474 -48,243 -193,104 -46,935<br />
Depletion and decommissioning costs 3 -191,444 -50,051 -165,138 -43,757<br />
Exploration costs 4 -168,480 -134,920 -140,027 -59,800<br />
Impairment costs of oil and gas properties 5 -237,490 -237,490 – –<br />
Gross profit 575,254 -128,104 771,246 172,511<br />
General, administration and depreciation expenses -31,722 -5,336 -67,022 -31,903<br />
Operating profit 6 543,532 -133,440 704,224 140,608<br />
Result from financial investments<br />
Financial income 7 27,241 10,486 46,455 7,305<br />
Financial expenses 8 -48,522 -10,428 -21,022 -4,790<br />
-21,281 58 25,433 2,515<br />
Profit before tax 522,251 -133,382 729,657 143,123<br />
Income tax expense 9 -418,401 80,639 -574,413 -157,158<br />
Net result 103,850 -52,743 155,244 -14,035<br />
Net result attributable to the shareholders of the Parent<br />
Company: 108,161 -51,545 160,137 -12,500<br />
Net result attributable to non-controlling interest: -4,311 -1,198 -4,893 -1,535<br />
Net result 103,850 -55,743 155,244 -14,035<br />
Earnings per share – USD 1 0.35 -0.16 0.51 -0.05<br />
Diluted earnings per share – USD 1 0.35 -0.16 0.51 -0.05<br />
1 Based on net result attributable to shareholders of the Parent Company.
CONSOLIDATED STATEMENT OF COMPREHENSIVE INCOME IN SUMMARY<br />
Expressed in TUSD<br />
1 Jan <strong>2012</strong>-<br />
31 Dec <strong>2012</strong><br />
12 months<br />
› 18 ‹<br />
1 Oct <strong>2012</strong>-<br />
31 Dec <strong>2012</strong><br />
3 months<br />
1 Jan 2011-<br />
31 Dec 2011<br />
12 months<br />
1 Oct 2011-<br />
31 Dec 2011<br />
3 months<br />
Net result 103,850 -52,743 155,244 -14,035<br />
Other comprehensive income<br />
Exchange differences foreign operations 61,661 25,482 -37,525 -25,193<br />
Cash flow hedges 9,222 -4,779 6,971 1,708<br />
Available-for-sale financial assets 16,053 -2,984 -50,210 -1,583<br />
Income tax relating to other comprehensive income -2,306 1,194 -1,743 -427<br />
Other comprehensive income, net of tax 84,630 18,913 -82,507 -25,495<br />
Total comprehensive income 188,480 -33,830 72,737 -39,530<br />
Total comprehensive income attributable to:<br />
Shareholders of the Parent Company 190,233 -33,362 80,466 -37,732<br />
Non-controlling interest -1,753 -468 -7,729 -1,798<br />
188,480 -33,830 72,737 -39,530
CONSOLIDATED BALANCE SHEET IN SUMMARY<br />
Expressed in TUSD Note 31 December <strong>2012</strong> 31 December 2011<br />
ASSETS<br />
Non-current assets<br />
Oil and gas properties 10 2,864,395 2,329,270<br />
Other tangible assets 49,418 16,084<br />
Financial assets 11 44,105 44,080<br />
Total non-current assets 2,957,918 2,389,434<br />
Current assets<br />
Receivables and inventories 12 238,383 224,407<br />
Cash and cash equivalents 97,425 73,597<br />
Total current assets 335,808 298,004<br />
TOTAL ASSETS 3,293,726 2,687,438<br />
EQUITY AND LIABILITIES<br />
Equity<br />
Shareholders´ equity 1,182,405 1,000,882<br />
Non-controlling interest 67,648 69,424<br />
Total equity 1,250,053 1,070,306<br />
Non-current liabilities<br />
Provisions 13 1,204,625 987,993<br />
Financial liabilities 14 384,188 204,494<br />
Other non-current liabilities 22,556 21,830<br />
Total non-current liabilities 1,611,369 1,214,317<br />
Current liabilities<br />
Other current liabilities 15 423,479 390,600<br />
Provisions 13 8,825 12,215<br />
Total current liabilities 432,304 402,815<br />
TOTAL EQUITY AND LIABILITIES 3,293,726 2,687,438<br />
› 19 ‹
CONSOLIDATED STATEMENT OF CASH FLOW IN SUMMARY<br />
Expressed in TUSD Note<br />
Cash flow from operations<br />
› 20 ‹<br />
1 Jan <strong>2012</strong>-<br />
31 Dec <strong>2012</strong><br />
12 months<br />
1 Oct <strong>2012</strong>-<br />
31 Dec <strong>2012</strong><br />
3 months<br />
1 Jan 2011-<br />
31 Dec 2011<br />
12 months<br />
1 Oct 2011-<br />
31 Dec 2011<br />
3 months<br />
Net result 103,850 -52,743 155,244 -14,035<br />
Adjustments for non-cash related items 16 1,056,898 350,574 915,174 291,974<br />
Gain on sale of asset -1,117 -1,117 – –<br />
Interest received 3,489 2,234 1,457 41<br />
Interest paid -8,871 -3,252 -1,597 2,335<br />
Income taxes paid -428,842 -121,595 -183,870 -119,547<br />
Changes in working capital 93,547 23,636 10,528 -26,957<br />
Total cash flow from operations 818,954 197,737 896,936 133,811<br />
Cash flow from investments<br />
Investment in oil and gas properties -919,356 -352,182 -670,032 -156,305<br />
Investment in office equipment and other assets -9,702 -4,906 -3,786 -673<br />
Investment in subsidiaries -11,000 – – –<br />
Change in other financial fixed assets – – 1,908 12,168<br />
Proceeds from sale of other shares and participations – – 53,938 –<br />
Decommissioning costs paid -18,550 -9,816 – –<br />
Other payments -3,188 -302 -1,168 -293<br />
Total cash flow from investments -961,796 -367,206 -619,140 -145,103<br />
Cash flow from financing<br />
Changes in long-term liabilities 225,726 111,169 -252,238 -13,616<br />
Financing fees paid -49,225 -445 – –<br />
Purchase of own shares -8,710 – – –<br />
Dividend to non-controlling interest paid -23 – -212 –<br />
Total cash flow from financing 167,768 110,724 -252,450 -13,616<br />
Change in cash and cash equivalents 24,926 -58,745 25,346 -24,908<br />
Cash and cash equivalents at the beginning of the period 73,597 156,918 48,703 98,075<br />
Cash acquired on consolidation of subsidiary 815 – – –<br />
Currency exchange difference in cash and cash equivalents -1,913 -748 -452 430<br />
Cash and cash equivalents at the end of the period 97,425 97,425 73,597 73,597
CONSOLIDATED STATEMENT OF CHANGES IN EQUITY IN SUMMARY<br />
Additional<br />
Non-<br />
paid-in capital/ Retained<br />
controlling<br />
Expressed in TUSD Share capital Other reserves earnings Net result interest Total equity<br />
Balance at 1 January 2011 463 417,430 -9,352 511,875 77,365 997,781<br />
Transfer of prior year net result – – 511,875 -511,875 – –<br />
Total comprehensive income – -79,671 – 160,137 -7,729 72,737<br />
Transactions with owners<br />
Distributions – – – – -212 -212<br />
Total transactions with owners – – – – -212 -212<br />
Balance at 31 December 2011 463 337,759 502,523 160,137 69,424 1,070,306<br />
Transfer of prior year net result – – 160,137 -160,137 – –<br />
Total comprehensive income – 82,072 – 108,161 -1,753 188,480<br />
Transactions with owners<br />
Distributions – – – – -23 -23<br />
Purchase of own shares – -8,710 – – – -8,710<br />
Total transactions with owners – -8,710 – – -23 -8,733<br />
Balance at 31 December <strong>2012</strong> 463 411,121 662,660 108,161 67,648 1,250,053<br />
› 21 ‹
NOTES TO THE CONSOLIDATED FINANCIAL STATEMENTS<br />
Note 1. Net sales of oil and gas,<br />
TUSD<br />
Net sales of:<br />
Crude oil<br />
› 22 ‹<br />
1 Jan <strong>2012</strong>-<br />
31 Dec <strong>2012</strong><br />
12 months<br />
1 Oct <strong>2012</strong>-<br />
31 Dec <strong>2012</strong><br />
3 months<br />
1 Jan 2011-<br />
31 Dec 2011<br />
12 months<br />
1 Oct 2011-<br />
31 Dec 2011<br />
3 months<br />
Norway 953,432 235,485 911,072 236,431<br />
France 114,974 36,763 127,789 31,359<br />
Netherlands 170 53 231 57<br />
Russia 75,806 17,806 79,515 19,078<br />
Tunisia 24,597 – 24,795 –<br />
Condensate<br />
1,168,979 290,107 1,143,402 286,925<br />
Norway 2,312 2,312 – –<br />
Netherlands 999 269 1,314 343<br />
Gas<br />
3,311 2,581 1,314 343<br />
Norway 94,851 30,579 57,909 16,329<br />
Netherlands 41,385 10,393 42,496 11,448<br />
Indonesia 10,964 3,598 12,570 3,765<br />
147,200 44,570 112,975 31,542<br />
1,319,490 337,258 1,257,691 318,810<br />
Note 2. Production costs,<br />
TUSD<br />
1 Jan <strong>2012</strong>-<br />
31 Dec <strong>2012</strong><br />
12 months<br />
1 Oct <strong>2012</strong>-<br />
31 Dec <strong>2012</strong><br />
3 months<br />
1 Jan 2011-<br />
31 Dec 2011<br />
12 months<br />
1 Oct 2011-<br />
31 Dec 2011<br />
3 months<br />
Cost of operations 105,612 29,244 102,476 28,338<br />
Tariff and transportation expenses 29,684 8,681 22,863 5,228<br />
Direct production taxes 51,328 12,315 52,390 12,843<br />
Change in inventory/lifting position -15,918 -1,997 13,129 -17<br />
Other 1,768 – 2,246 543<br />
172,474 48,243 193,104 46,935<br />
Note 3. Depletion and decommissioning costs,<br />
TUSD<br />
Depletion charges<br />
1 Jan <strong>2012</strong>-<br />
31 Dec <strong>2012</strong><br />
12 months<br />
1 Oct <strong>2012</strong>-<br />
31 Dec <strong>2012</strong><br />
3 months<br />
1 Jan 2011-<br />
31 Dec 2011<br />
12 months<br />
1 Oct 2011-<br />
31 Dec 2011<br />
3 months<br />
Norway 154,140 39,625 130,011 34,622<br />
France 11,668 2,954 12,174 3,056<br />
Netherlands 10,437 2,499 11,939 2,985<br />
Indonesia 5,612 2,225 6,250 1,932<br />
Russia 4,320 1,023 4,764 1,162<br />
Decommissioning costs<br />
186,177 48,326 165,138 43,757<br />
Tunisia 5,267 1,725 – –<br />
5,267 1,725 – –<br />
191,444 50,051 165,138 43,757
Note 4. Exploration costs,<br />
TUSD<br />
› 23 ‹<br />
1 Jan <strong>2012</strong>-<br />
31 Dec <strong>2012</strong><br />
12 months<br />
1 Oct <strong>2012</strong>-<br />
31 Dec <strong>2012</strong><br />
3 months<br />
1 Jan 2011-<br />
31 Dec 2011<br />
12 months<br />
1 Oct 2011-<br />
31 Dec 2011<br />
3 months<br />
Norway 103,052 89,371 74,060 7,333<br />
Indonesia 7,432 332 967 401<br />
Malaysia 46,683 37,502 11,015 –<br />
Congo (Brazzaville) 1,298 -456 51,263 51,263<br />
Other 10,015 8,171 2,722 803<br />
168,480 134,920 140,027 59,800<br />
Note 5. Impairment costs of oil and gas properties,<br />
TUSD<br />
1 Jan <strong>2012</strong>-<br />
31 Dec <strong>2012</strong><br />
12 months<br />
1 Oct <strong>2012</strong>-<br />
31 Dec <strong>2012</strong><br />
3 months<br />
1 Jan 2011-<br />
31 Dec 2011<br />
12 months<br />
1 Oct 2011-<br />
31 Dec 2011<br />
3 months<br />
Norway 205,835 205,835 – –<br />
Russia 31,655 31,655 – –<br />
237,490 237,490 – –<br />
Note 6. Operating profit,<br />
TUSD<br />
Operating profit<br />
1 Jan <strong>2012</strong>-<br />
31 Dec <strong>2012</strong><br />
12 months<br />
1 Oct <strong>2012</strong>-<br />
31 Dec <strong>2012</strong><br />
3 months<br />
1 Jan 2011-<br />
31 Dec 2011<br />
12 months<br />
1 Oct 2011-<br />
31 Dec 2011<br />
3 months<br />
Norway 558,646 -80,566 703,711 196,175<br />
France 70,429 18,222 85,334 19,888<br />
Netherlands 29,908 4,370 18,868 4,786<br />
Indonesia -7,511 -23 168 -267<br />
Russia -26,304 -31,077 7,715 1,191<br />
Tunisia -4,297 -2,290 13,476 -197<br />
Malaysia -47,554 -36,753 -11,010 –<br />
Congo (Brazzaville) -1,309 445 -51,273 -51,273<br />
Other -28,476 -5,768 -62,765 -29,695<br />
543,532 -133,440 704,224 140,608<br />
Note 7. Financial income,<br />
TUSD<br />
NOTES TO THE CONSOLIDATED FINANCIAL STATEMENTS<br />
1 Jan <strong>2012</strong>-<br />
31 Dec <strong>2012</strong><br />
12 months<br />
1 Oct <strong>2012</strong>-<br />
31 Dec <strong>2012</strong><br />
3 months<br />
1 Jan 2011-<br />
31 Dec 2011<br />
12 months<br />
1 Oct 2011-<br />
31 Dec 2011<br />
3 months<br />
Interest income 5,050 2,545 4,138 815<br />
Foreign currency exchange gain, net 6,154 5,473 8,945 6,291<br />
Guarantee fees 233 233 998 294<br />
Gain on sale of shares – – 29,974 –<br />
Gain on consolidation of subsidiary 13,409 – – –<br />
Other 2,395 2,235 2,400 -95<br />
27,241 10,486 46,455 7,305
NOTES TO THE CONSOLIDATED FINANCIAL STATEMENTS<br />
Note 8. Financial expenses,<br />
TUSD<br />
› 24 ‹<br />
1 Jan <strong>2012</strong>-<br />
31 Dec <strong>2012</strong><br />
12 months<br />
1 Oct <strong>2012</strong>-<br />
31 Dec <strong>2012</strong><br />
3 months<br />
1 Jan 2011-<br />
31 Dec 2011<br />
12 months<br />
1 Oct 2011-<br />
31 Dec 2011<br />
3 months<br />
Interest expense 6,819 2,029 5,390 1,093<br />
Foreign currency exchange loss, net – – – –<br />
Result on interest rate hedge settlement 198 – 6,995 1,761<br />
Unwinding of site restoration discount 5,073 1,311 4,494 1,091<br />
Amortisation of deferred financing fees 6,634 2,050 2,181 459<br />
Loan facility commitment fees 10,315 4,667 1,005 205<br />
Impairment of other shares 18,631 – – –<br />
Other 852 371 957 180<br />
48,522 10,428 21,022 4,790<br />
Note 9. Income tax expense,<br />
TUSD<br />
1 Jan <strong>2012</strong>-<br />
31 Dec <strong>2012</strong><br />
12 months<br />
1 Oct <strong>2012</strong>-<br />
31 Dec <strong>2012</strong><br />
3 months<br />
1 Jan 2011-<br />
31 Dec 2011<br />
12 months<br />
1 Oct 2011-<br />
31 Dec 2011<br />
3 months<br />
Current tax 341,301 56,947 400,210 186,701<br />
Deferred tax 77,100 -137,586 174,203 -29,543<br />
418,401 -80,639 574,413 157,158<br />
Note 10. Oil and gas properties,<br />
TUSD 31 Dec <strong>2012</strong> 31 Dec 2011<br />
Norway 1,702,319 1,269,746<br />
France 216,812 172,467<br />
Netherlands 65,796 43,739<br />
Indonesia 96,878 93,610<br />
Russia 599,221 615,015<br />
Malaysia 183,369 129,830<br />
Other – 4,863<br />
2,864,395 2,329,270<br />
Note 11. Financial assets,<br />
TUSD 31 Dec <strong>2012</strong> 31 Dec 2011<br />
Other shares and participations 19,983 17,775<br />
Bonds 9,526 9,588<br />
Deferred tax 13,270 15,345<br />
Other 1,326 1,372<br />
44,105 44,080<br />
Note 12. Receivables and inventories,<br />
TUSD 31 Dec <strong>2012</strong> 31 Dec 2011<br />
Inventories 18,700 31,589<br />
Trade receivables 125,905 144,954<br />
Underlift 26,439 1,851<br />
Corporate tax 3,986 –<br />
Joint venture debtors 11,539 20,252<br />
Derivative instruments 9,056 –<br />
Prepaid expenses and accrued income 32,906 4,522<br />
Other 9,852 21,239<br />
238,383 224,407
Note 13. Provisions,<br />
TUSD<br />
Non-current:<br />
31 Dec <strong>2012</strong> 31 Dec 2011<br />
Site restoration 190,470 119,341<br />
Deferred tax 942,235 803,493<br />
Long-term incentive plan 67,135 58,079<br />
Pension 1,510 1,460<br />
Other 3,275 5,620<br />
Current:<br />
1,204,625 987,993<br />
Long-term incentive plan 8,825 12,215<br />
8,825 12,215<br />
1,213,450 1,000,208<br />
Note 14. Financial liabilities,<br />
TUSD 31 Dec <strong>2012</strong> 31 Dec 2011<br />
Bank loans 432,000 207,000<br />
Capitalised financing fees -47,812 -2,506<br />
384,188 204,494<br />
Note 15. Other current liabilities,<br />
TUSD 31 Dec <strong>2012</strong> 31 Dec 2011<br />
Trade payables 15,718 16,546<br />
Overlift 490 7,670<br />
Tax liabilities 170,007 240,052<br />
Accrued expenses and deferred income 8,337 16,227<br />
Joint venture creditors 213,944 88,417<br />
Derivative instruments – 168<br />
Other 14,983 21,520<br />
423,479 390,600<br />
Note 16. Adjustment for non-cash related items,<br />
TUSD<br />
PARENT COMPANY INCOME STATEMENT IN SUMMARY<br />
1 Jan <strong>2012</strong>-<br />
31 Dec <strong>2012</strong><br />
12 months<br />
› 25 ‹<br />
1 Oct <strong>2012</strong>-<br />
31 Dec <strong>2012</strong><br />
3 months<br />
1 Jan 2011-<br />
31 Dec 2011<br />
12 months<br />
1 Oct 2011-<br />
31 Dec 2011<br />
3 months<br />
Exploration costs 168,480 134,920 140,027 59,800<br />
Depletion, depreciation and amortisation 189,293 49,086 167,812 44,344<br />
Current tax 341,301 56,947 400,210 186,701<br />
Deferred tax 77,100 -137,586 174,203 -29,543<br />
Gain on sale of shares – – -29,974 –<br />
Impairment of oil and gas properties 237,490 237,490 – –<br />
Impairment of other shares 18,631 – – –<br />
Long-term incentive plan 12,988 -1,210 63,443 35,179<br />
Other 11,615 10,927 -547 -4,507<br />
1,056,898 350,574 915,174 291,974
PARENT COMPANY INCOME STATEMENT IN SUMMARY<br />
Expressed in TSEK<br />
Operating income<br />
› 26 ‹<br />
1 Jan <strong>2012</strong>-<br />
31 Dec <strong>2012</strong><br />
12 months<br />
1 Oct <strong>2012</strong>-<br />
31 Dec <strong>2012</strong><br />
3 months<br />
1 Jan 2011-<br />
31 Dec 2011<br />
12 months<br />
1 Oct 2011-<br />
31 Dec 2011<br />
3 months<br />
Other operating income 70,956 26,914 42,644 13,599<br />
Gross profit 70,956 26,914 42,644 13,599<br />
General and administration expenses -84,533 -7,005 -206,108 -94,157<br />
Operating loss -13,577 19,909 -163,464 -80,558<br />
Result from financial investments<br />
Financial income 807,074 806,123 6,560 1,877<br />
Financial expenses -31,266 -5,513 -25,495 -7,181<br />
775,808 800,610 -18,935 -5,304<br />
Profit before tax 762,231 820,519 -182,399 -85,862<br />
Income tax expense – – – –<br />
Net result 762,231 820,519 -182,399 -85,862<br />
PARENT COMPANY COMPREHENSIVE INCOME STATEMENT IN SUMMARY<br />
Expressed in TSEK<br />
1 Jan <strong>2012</strong>-<br />
31 Dec <strong>2012</strong><br />
12 months<br />
1 Oct <strong>2012</strong>-<br />
31 Dec <strong>2012</strong><br />
3 months<br />
1 Jan 2011-<br />
31 Dec 2011<br />
12 months<br />
1 Oct 2011-<br />
31 Dec 2011<br />
3 months<br />
Net result 762,231 820,519 -182,399 -85,862<br />
Other comprehensive income – – – –<br />
Total comprehensive income 762,231 820,519 -182,399 -85,862<br />
Total comprehensive income attributable to:<br />
Shareholders of the Parent Company 762,231 820,519 -182,399 -85,862<br />
762,231 820,519 -182,399 -85,862
PARENT COMPANY BALANCE SHEET IN SUMMARY<br />
Expressed in TSEK 31 December <strong>2012</strong> 31 December 2011<br />
ASSETS<br />
Non-current assets<br />
Shares in subsidiaries 7,871,847 7,871,947<br />
Receivables from group companies 21,370 –<br />
Total non-current assets 7,893,217 7,871,947<br />
Current assets<br />
Receivables 20,698 8,954<br />
Cash and cash equivalents 1,080 3,849<br />
Total current assets 21,778 12,803<br />
TOTAL ASSETS 7,914,995 7,884,750<br />
SHAREHOLDERS´EQUITY AND LIABILITIES<br />
Shareholders´ equity including net result for the period 7,869,783 7,169,977<br />
Non-current liabilities<br />
Provisions<br />
Payables to Group companies<br />
36,403 36,403<br />
Total non-current liabilities 36,403 710,391<br />
Current liabilities<br />
Current liabilities 8,809 4,382<br />
Total current liabilities 8,809 4,382<br />
TOTAL EQUITY AND LIABILITIES 7,914,995 7,884,750<br />
Pledged assets 11,911,649 12,333,233<br />
› 27 ‹
PARENT COMPANY CASH FLOW STATEMENT IN SUMMARY<br />
Expressed in TSEK<br />
Cash flow from operations<br />
› 28 ‹<br />
1 Jan <strong>2012</strong>-<br />
31 Dec <strong>2012</strong><br />
12 months<br />
1 Oct <strong>2012</strong>-<br />
31 Dec <strong>2012</strong><br />
3 months<br />
1 Jan 2011-<br />
31 Dec 2011<br />
12 months<br />
1 Oct 2011-<br />
31 Dec 2011<br />
3 months<br />
Net result 762,231 820,519 -182,399 -85,862<br />
Adjustment for non-cash related items -725,237 -810,779 207,811 94,494<br />
Changes in working capital -6,383 1,978 -12,492 -12,661<br />
Total cash flow from operations 30,611 11,718 12,920 -4,029<br />
Cash flow from investments<br />
Change in long term financial fixed assets 100 100 – –<br />
Total Cash flow from investments 100 100 – –<br />
Cash flow from financing<br />
Change in long-term liabilities 29,129 -17,717 -15,702 7,131<br />
Purchase of own shares -62,425 – – –<br />
Total cash flow from financing -33,296 -17,717 -15,702 7,131<br />
Change in cash and cash equivalents -2,585 -5,899 -2,782 3,102<br />
Cash and cash equivalents at the beginning of the period 3,849 6,985 6,735 894<br />
Currency exchange difference in cash and cash equivalents -184 -6 -104 -147<br />
Cash and cash equivalents at the end of the period 1,080 1,080 3,849 3,849<br />
PARENT COMPANY STATEMENT OF CHANGES IN EQUITY IN SUMMARY<br />
Expressed in TSEK<br />
Restricted equity Unrestricted equity<br />
Share<br />
capital<br />
Statutory<br />
reserve<br />
Other<br />
reserves<br />
Retained<br />
earnings Net result Total equity<br />
Balance at 1 January 2011 3,179 861,306 2,551,805 – 3,936,086 7,352,376<br />
Transfer of prior year net result – – – 3,936,086 -3,936,086 –<br />
Total comprehensive income – – – – -182,399 -182,399<br />
Balance at 31 December 2011 3,179 861,306 2,551,805 3,936,086 -182,399 7,169,977<br />
Transfer of prior year net result – – – -182,399 182,399 –<br />
Total comprehensive income – – – – 762,231 762,231<br />
Transactions with owners<br />
Purchase of own shares – – -62,425 – – -62,425<br />
Total transactions with owners – – -62,425 – – -62,425<br />
Balance at 31 December <strong>2012</strong> 3,179 861,306 2,489,380 3,753,687 762,231 7,869,783
Financial data (TUSD)<br />
› 29 ‹<br />
1 Jan <strong>2012</strong>-<br />
31 Dec <strong>2012</strong><br />
12 months<br />
1 Oct <strong>2012</strong>-<br />
31 Dec <strong>2012</strong><br />
3 months<br />
1 Jan 2011-<br />
31 Dec 2011<br />
12 months<br />
1 Oct 2011-<br />
31 Dec 2011<br />
3 months<br />
Operating income 1,345,142 342,600 1,269,515 323,003<br />
EBITDA 1,144,061 289,779 1,012,063 244,752<br />
Net result 103,850 -52,743 155,244 -14,035<br />
Operating cash flow 831,366 237,409 676,201 89,367<br />
Data per share (USD)<br />
Shareholders’ equity per share 3.81 3.81 3.22 3.22<br />
Operating cash flow per share 2.68 0.77 2.17 0.28<br />
Cash flow from operations per share 2.64 0.64 2.88 0.43<br />
Earnings per share 0.35 -0.16 0.51 -0.05<br />
Earnings per share fully diluted 0.35 -0.16 0.51 -0.05<br />
EBITDA per share fully diluted 3.68 0.93 3.25 0.78<br />
Dividend per share – – – –<br />
Number of shares issued at period end 317,910,580 317,910,580 317,910,580 317,910,580<br />
Number of shares in circulation at period end 310,542,295 310,542,295 311,027,942 311,027,942<br />
Weighted average number of shares for the period 310,735,227 310,542,295 311,027,942 311,027,942<br />
Weighted average number of shares for the period (fully diluted) 310,735,227 310,542,295 311,027,942 311,027,942<br />
Share price<br />
Quoted price at period end (SEK) 149.50 149.50 169.20 169.20<br />
Quoted price at period end (CAD) 22.87 22.87 24.54 24.54<br />
Key ratios<br />
Return on equity (%) 9 -4 15 -1<br />
Return on capital employed (%) 35 -10 53 12<br />
Net debt/equity ratio (%) 30 30 15 15<br />
Equity ratio (%) 38 38 40 40<br />
Share of risk capital (%) 66 66 69 69<br />
Interest coverage ratio 75 -67 59 49<br />
Operating cash flow/interest ratio 119 117 55 31<br />
Yield – – – –<br />
KEY RATIO DEFINITIONS<br />
KEY FINANCIAL DATA<br />
Shareholders’ equity per share: Shareholders’ equity divided by the number of shares in circulation at period end.<br />
Operating cash flow per share: Operating income less production costs and less current taxes divided by the weighted average number of<br />
shares for the period.<br />
Cash flow from operations per share: Cash flow from operations in accordance with the consolidated statement of cash flow divided by the<br />
weighted average number of shares for the period.<br />
Earnings per share: Net result attributable to shareholders of the Parent Company divided by the weighted average number of shares for the<br />
period.<br />
Earnings per share fully diluted: Net result attributable to shareholders of the Parent Company divided by the weighted average number of<br />
shares for the period after considering the dilution effect of outstanding warrants.<br />
EBITDA per share fully diluted: EBITDA divided by the weighted average number of shares for the period after considering the dilution effect<br />
of outstanding warrants. EBITDA is defined as operating profit before depletion of oil and gas properties, exploration costs, impairment costs,<br />
depreciation of other assets and gain on sale of assets.<br />
Weighted average number of shares for the period: The number of shares at the beginning of the period with changes in the number of<br />
shares weighted for the proportion of the period they are in issue.<br />
Return on equity: Net result divided by average total equity.<br />
Return on capital employed: Income before tax plus interest expenses plus/less exchange differences on financial loans divided by the average<br />
capital employed (the average balance sheet total less non-interest bearing liabilities).<br />
Net debt/equity ratio: Net interest bearing liabilities divided by shareholders’ equity.<br />
Equity ratio: Total equity divided by the balance sheet total.<br />
Share of risk capital: The sum of the total equity and the deferred tax provision divided by the balance sheet total.<br />
Interest coverage ratio: Result after financial items plus interest expenses plus/less exchange differences on financial loans divided by interest<br />
expenses.<br />
Operating cash flow/interest ratio: Operating income less production costs and less current taxes divided by the interest charge for the period.<br />
Yield: dividend per share in relation to quoted share price at the end of the financial period.
FINANCIAL INFORMATION<br />
Ian H. <strong>Lundin</strong><br />
Chairman<br />
Stockholm, 6 February 2013<br />
C. Ashley Heppenstall<br />
President and CEO<br />
› 30 ‹<br />
William A. Rand<br />
Asbjørn Larsen Lukas H. <strong>Lundin</strong> Magnus Unger Kristin Færøvik<br />
FINANCIAL INFORMATION<br />
The Company will publish the following reports:<br />
• The three month report (January – March 2013) will be published on 7 May 2013.<br />
• The six month report (January – June 2013) will be published on 7 August 2013.<br />
• The nine month report (January – September 2013) will be published on 6 November 2013.<br />
The AGM will be held on 8 May 2013 in Stockholm, Sweden.<br />
For further information, please contact:<br />
Teitur Poulsen Maria Hamilton<br />
VP Corporate Planning & Investor Relations Head of Corporate Communications<br />
Tel: + 41 22 595 10 00 Tel: +46 8 440 54 50<br />
Tel: +41 79 63 53 641
DISCLOSURE<br />
This information has been made public in accordance with the Securities Market Act (SFS 2007:528) and/or the Financial Instruments Trading Act (SFS 1991:980).<br />
FORWARD-LOOKING STATEMENTS<br />
Certain statements made and information contained herein constitute “forward-looking information” (within the meaning of applicable securities legislation). Such<br />
statements and information (together, “forward-looking statements”) relate to future events, including the Company’s future performance, business prospects or<br />
opportunities. Forward-looking statements include, but are not limited to, statements with respect to estimates of reserves and/or resources, future production levels,<br />
future capital expenditures and their allocation to exploration and development activities, future drilling and other exploration and development activities. Ultimate<br />
recovery of reserves or resources are based on forecasts of future results, estimates of amounts not yet determinable and assumptions of management.<br />
All statements other than statements of historical fact may be forward-looking statements. Statements concerning proven and probable reserves and resource<br />
estimates may also be deemed to constitute forward-looking statements and reflect conclusions that are based on certain assumptions that the reserves and resources<br />
can be economically exploited. Any statements that express or involve discussions with respect to predictions, expectations, beliefs, plans, projections, objectives,<br />
assumptions or future events or performance (often, but not always, using words or phrases such as“seek”,“anticipate”,“plan”,“continue”,“estimate”,“expect”,“may”,“will”,<br />
“project”, “predict”, “potential”, “targeting”, “intend”, “could”, “might”, “should”, “believe” and similar expressions) are not statements of historical fact and may be “forwardlooking<br />
statements”. Forward-looking statements involve known and unknown risks, uncertainties and other factors that may cause actual results or events to differ<br />
materially from those anticipated in such forward-looking statements. No assurance can be given that these expectations and assumptions will prove to be correct and<br />
such forward-looking statements should not be relied upon. These statements speak only as on the date of the information and the Company does not intend, and<br />
does not assume any obligation, to update these forward-looking statements, except as required by applicable laws. These forward-looking statements involve risks<br />
and uncertainties relating to, among other things, operational risks (including exploration and development risks), productions costs, availability of drilling equipment,<br />
reliance on key personnel, reserve estimates, health, safety and environmental issues, legal risks and regulatory changes, competition, geopolitical risk, and financial<br />
risks. These risks and uncertainties are described in more detail under the heading“Risks and Risk Management”and elsewhere in the Company’s annual report. Readers<br />
are cautioned that the foregoing list of risk factors should not be construed as exhaustive. Actual results may differ materially from those expressed or implied by such<br />
forward-looking statements. Forward-looking statements are expressly qualified by this cautionary statement.<br />
RESERVES AND RESOURCES<br />
Unless otherwise stated, <strong>Lundin</strong> <strong>Petroleum</strong>’s reserve and resource estimates are as at 31 December 2011, and have been prepared and audited in accordance with<br />
National Instrument 51-101 Standards of Disclosure for Oil and Gas Activities (“NI 51-101”) and the Canadian Oil and Gas Evaluation Handbook (“COGE Handbook”).<br />
Unless otherwise stated, all reserves estimates contained herein are the aggregate of “Proved Reserves” and “Probable Reserves”, together also known as “2P Reserves”.<br />
For further information on reserve and resource classifications, see “Reserves and Resources” in the Company’s annual report.<br />
CONTINGENT RESOURCES<br />
Contingent Resources are those quantities of petroleum estimated, as of a given date, to be potentially recoverable from known accumulations using established<br />
technology or technology under development, but are not currently considered to be commercially recoverable due to one or more contingencies. Contingencies may<br />
include factors such as economic, legal, environmental, political and regulatory matters or a lack of markets. There is no certainty that it will be commercially viable for<br />
the Company to produce any portion of the Contingent Resources.<br />
PROSPECTIVE RESOURCES<br />
Prospective Resources are those quantities of petroleum estimated, as of a given date, to be potentially recoverable from undiscovered accumulations by application<br />
of future development projects. Prospective Resources have both a chance of discovery and a chance of development. There is no certainty that any portion of the<br />
Prospective Resources will be discovered. If discovered, there is no certainty that it will be commercially viable to produce any portion of the Prospective Resources.<br />
BOEs<br />
BOEs may be misleading, particularly if used in isolation. A BOE conversion ratio of 6 Mcf: 1 Bbl is based on an energy equivalency conversion method primarily<br />
applicable at the burner tip and does not represent a value equivalency at the wellhead.<br />
› 31 ‹
Corporate Head Oce<br />
<strong>Lundin</strong> <strong>Petroleum</strong> AB (publ)<br />
Hovslagargatan 5<br />
SE-111 48 Stockholm<br />
Sweden<br />
Telephone: 46-8-440 54 50<br />
Telefax: 46-8-440 54 59<br />
E-mail: info@lundin.ch<br />
www.lundin-petroleum.com<br />
› 32 ‹