

Income, Poverty, and Health Insurance Coverage ... - Census Bureau
Income, Poverty, and Health Insurance Coverage ... - Census Bureau
Income, Poverty, and Health Insurance Coverage ... - Census Bureau

You also want an ePaper? Increase the reach of your titles
YUMPU automatically turns print PDFs into web optimized ePapers that Google loves.
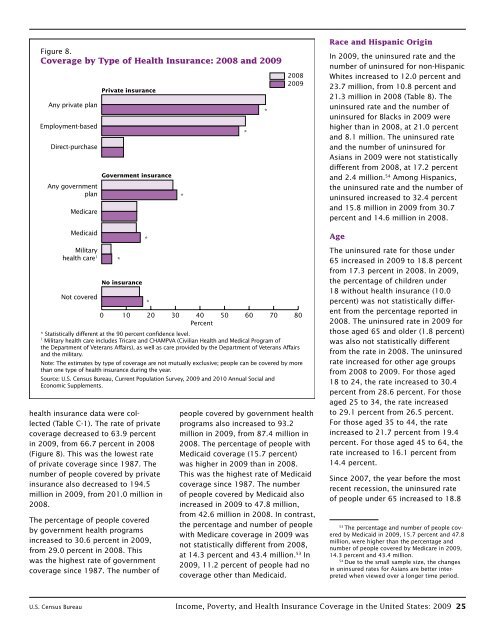
Figure 8.<br />
<strong>Coverage</strong> by Type of <strong>Health</strong> <strong>Insurance</strong>: 2008 <strong>and</strong> 2009<br />
Any private plan<br />
Employment-based<br />
Direct-purchase<br />
Private insurance<br />
Government insurance<br />
Any government<br />
plan<br />
Medicare<br />
Medicaid<br />
Military<br />
health care 1<br />
Not covered<br />
*<br />
No insurance<br />
*<br />
*<br />
* Statistically different at the 90 percent confidence level.<br />
1<br />
Military health care includes Tricare <strong>and</strong> CHAMPVA (Civilian <strong>Health</strong> <strong>and</strong> Medical Program of<br />
the Department of Veterans Affairs), as well as care provided by the Department of Veterans Affairs<br />
<strong>and</strong> the military.<br />
Note: The estimates by type of coverage are not mutually exclusive; people can be covered by more<br />
than one type of health insurance during the year.<br />
Source: U.S. <strong>Census</strong> <strong>Bureau</strong>, Current Population Survey, 2009 <strong>and</strong> 2010 Annual Social <strong>and</strong><br />
Economic Supplements.<br />
health insurance data were col- people covered by government health<br />
lected (Table C-1). The rate of private programs also increased to 93.2<br />
coverage decreased to 63.9 percent million in 2009, from 87.4 million in<br />
in 2009, from 66.7 percent in 2008 2008. The percentage of people with<br />
(Figure 8). This was the lowest rate Medicaid coverage (15.7 percent)<br />
of private coverage since 1987. The was higher in 2009 than in 2008.<br />
number of people covered by private This was the highest rate of Medicaid<br />
insurance also decreased to 194.5 coverage since 1987. The number<br />
million in 2009, from 201.0 million in of people covered by Medicaid also<br />
2008. increased in 2009 to 47.8 million,<br />
The percentage of people covered<br />
by government health programs<br />
increased to 30.6 percent in 2009,<br />
from 29.0 percent in 2008. This<br />
from 42.6 million in 2008. In contrast,<br />
the percentage <strong>and</strong> number of people<br />
with Medicare coverage in 2009 was<br />
not statistically different from 2008,<br />
at 14.3 percent <strong>and</strong> 43.4 million. 53 was the highest rate of government<br />
coverage since 1987. The number of<br />
In<br />
2009, 11.2 percent of people had no<br />
coverage other than Medicaid.<br />
*<br />
Race <strong>and</strong> Hispanic Origin<br />
In 2009, the uninsured rate <strong>and</strong> the<br />
number of uninsured for non-Hispanic<br />
Whites increased to 12.0 percent <strong>and</strong><br />
23.7 million, from 10.8 percent <strong>and</strong><br />
21.3 million in 2008 (Table 8). The<br />
uninsured rate <strong>and</strong> the number of<br />
uninsured for Blacks in 2009 were<br />
higher than in 2008, at 21.0 percent<br />
<strong>and</strong> 8.1 million. The uninsured rate<br />
<strong>and</strong> the number of uninsured for<br />
Asians in 2009 were not statistically<br />
different from 2008, at 17.2 percent<br />
<strong>and</strong> 2.4 million. 54 Among Hispanics,<br />
the uninsured rate <strong>and</strong> the number of<br />
uninsured increased to 32.4 percent<br />
<strong>and</strong> 15.8 million in 2009 from 30.7<br />
percent <strong>and</strong> 14.6 million in 2008.<br />
U.S. <strong>Census</strong> <strong>Bureau</strong> <strong>Income</strong>, <strong>Poverty</strong>, <strong>and</strong> <strong>Health</strong> <strong>Insurance</strong> <strong>Coverage</strong> in the United States: 2009 25<br />
2008<br />
2009<br />
0 10 20 30 40<br />
Percent<br />
50 60 70 80<br />
*<br />
*<br />
Age<br />
The uninsured rate for those under<br />
65 increased in 2009 to 18.8 percent<br />
from 17.3 percent in 2008. In 2009,<br />
the percentage of children under<br />
18 without health insurance (10.0<br />
percent) was not statistically different<br />
from the percentage reported in<br />
2008. The uninsured rate in 2009 for<br />
those aged 65 <strong>and</strong> older (1.8 percent)<br />
was also not statistically different<br />
from the rate in 2008. The uninsured<br />
rate increased for other age groups<br />
from 2008 to 2009. For those aged<br />
18 to 24, the rate increased to 30.4<br />
percent from 28.6 percent. For those<br />
aged 25 to 34, the rate increased<br />
to 29.1 percent from 26.5 percent.<br />
For those aged 35 to 44, the rate<br />
increased to 21.7 percent from 19.4<br />
percent. For those aged 45 to 64, the<br />
rate increased to 16.1 percent from<br />
14.4 percent.<br />
Since 2007, the year before the most<br />
recent recession, the uninsured rate<br />
of people under 65 increased to 18.8<br />
53 The percentage <strong>and</strong> number of people covered<br />
by Medicaid in 2009, 15.7 percent <strong>and</strong> 47.8<br />
million, were higher than the percentage <strong>and</strong><br />
number of people covered by Medicare in 2009,<br />
14.3 percent <strong>and</strong> 43.4 million.<br />
54 Due to the small sample size, the changes<br />
in uninsured rates for Asians are better interpreted<br />
when viewed over a longer time period.


