- Page 1 and 2:
Sniffer ® Portable Professional Us
- Page 3 and 4:
"This product includes software dev
- Page 5:
Related Information Resources NetSc
- Page 8 and 9:
5 Monitoring Your Network . . . . .
- Page 10 and 11:
10 Sniffer Portable Professional
- Page 12 and 13:
Chapter 1 Product Comparison Table
- Page 14 and 15:
Chapter 1 Major Components of Sniff
- Page 16 and 17:
Chapter 1 Table 1-2. Features for W
- Page 18 and 19:
Chapter 2 System Requirements 18 Sn
- Page 20 and 21:
Chapter 2 20 Sniffer Portable Profe
- Page 22 and 23:
Chapter 2 Installing the Sniffer Po
- Page 24 and 25:
Chapter 2 24 Sniffer Portable Profe
- Page 26 and 27:
Chapter 2 Native Atheros Driver Upd
- Page 28 and 29:
Chapter 2 28 Sniffer Portable Profe
- Page 30 and 31:
Chapter 2 Authorizing Sniffer Porta
- Page 32 and 33:
Chapter 2 Entering Licensing Inform
- Page 34 and 35:
Chapter 2 Starting Sniffer Portable
- Page 36 and 37:
Chapter 2 Tuning Settings for Sniff
- Page 38 and 39:
Chapter 2 38 Sniffer Portable Profe
- Page 40 and 41:
Chapter 2 40 Sniffer Portable Profe
- Page 42 and 43:
Chapter 3 a b c 42 Sniffer Portable
- Page 44 and 45:
Chapter 3 Sniffer Window Menus 44 S
- Page 46 and 47:
Chapter 3 46 Sniffer Portable Profe
- Page 48 and 49:
Chapter 4 Setting the General Tab O
- Page 50 and 51:
Chapter 4 50 Sniffer Portable Profe
- Page 52 and 53:
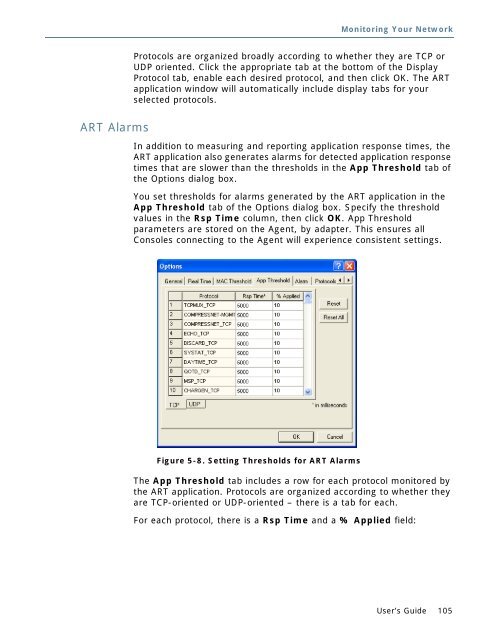
Chapter 4 Setting the App Threshold
- Page 54 and 55: Chapter 4 Setting Tools > Wireless
- Page 56 and 57: Chapter 4 Configuring Wireless Encr
- Page 58 and 59: Chapter 4 58 Sniffer Portable Profe
- Page 60 and 61: Chapter 4 60 Sniffer Portable Profe
- Page 62 and 63: Chapter 4 62 Sniffer Portable Profe
- Page 64 and 65: Chapter 4 Adding Tools to the Tools
- Page 66 and 67: Chapter 4 66 Sniffer Portable Profe
- Page 68 and 69: Chapter 5 Monitoring Wireless Netwo
- Page 70 and 71: Chapter 5 Applying Monitor Filters
- Page 72 and 73: Chapter 5 Dashboard 72 Sniffer Port
- Page 74 and 75: Chapter 5 74 Sniffer Portable Profe
- Page 76 and 77: Chapter 5 The Dashboard Gauge Tab 7
- Page 78 and 79: Chapter 5 78 Sniffer Portable Profe
- Page 80 and 81: Chapter 5 80 Sniffer Portable Profe
- Page 82 and 83: Chapter 5 Host Table 82 Sniffer Por
- Page 84 and 85: Chapter 5 84 Sniffer Portable Profe
- Page 86 and 87: Chapter 5 86 Sniffer Portable Profe
- Page 88 and 89: Chapter 5 Viewing Access Points Onl
- Page 90 and 91: Chapter 5 90 Sniffer Portable Profe
- Page 92 and 93: Chapter 5 Selecting Wireless Host T
- Page 94 and 95: Chapter 5 94 Sniffer Portable Profe
- Page 96 and 97: Chapter 5 Setting Capture Filters f
- Page 98 and 99: Chapter 5 98 Sniffer Portable Profe
- Page 100 and 101: Chapter 5 ART - The Server-Client R
- Page 102 and 103: Chapter 5 Show Options 102 Sniffer
- Page 106 and 107: Chapter 5 106 Sniffer Portable Prof
- Page 108 and 109: Chapter 5 Adding Custom Protocols t
- Page 110 and 111: Chapter 5 History Samples Click to
- Page 112 and 113: Chapter 5 112 Sniffer Portable Prof
- Page 114 and 115: Chapter 5 Protocol Distribution 114
- Page 116 and 117: Chapter 5 Global Statistics 116 Sni
- Page 118 and 119: Chapter 5 118 Sniffer Portable Prof
- Page 120 and 121: Chapter 5 Monitor Alarms 120 Sniffe
- Page 122 and 123: Chapter 6 Capture Controls 122 Snif
- Page 124 and 125: Chapter 6 Capture Buffer 124 Sniffe
- Page 126 and 127: Chapter 6 Tips: 126 Sniffer Portabl
- Page 128 and 129: Chapter 6 Capturing from Specific S
- Page 130 and 131: Chapter 6 130 Sniffer Portable Prof
- Page 132 and 133: Chapter 7 132 Sniffer Portable Prof
- Page 134 and 135: Chapter 7 Setting Expert Options 13
- Page 136 and 137: Chapter 7 136 Sniffer Portable Prof
- Page 138 and 139: Chapter 7 Expert Subnet Mask Settin
- Page 140 and 141: Chapter 7 140 Sniffer Portable Prof
- Page 142 and 143: Chapter 7 142 Sniffer Portable Prof
- Page 144 and 145: Chapter 7 Discovered access points
- Page 146 and 147: Chapter 7 146 Sniffer Portable Prof
- Page 148 and 149: Chapter 7 148 Sniffer Portable Prof
- Page 150 and 151: Chapter 7 Expert Oracle Options 150
- Page 152 and 153: Chapter 7 Limitations of the Expert
- Page 154 and 155:
Chapter 7 Click to show the packet
- Page 156 and 157:
Chapter 7 156 Sniffer Portable Prof
- Page 158 and 159:
Chapter 8 Displaying Captured Packe
- Page 160 and 161:
Chapter 8 Postcapture Views for Wir
- Page 162 and 163:
Chapter 8 162 Sniffer Portable Prof
- Page 164 and 165:
Chapter 8 164 Sniffer Portable Prof
- Page 166 and 167:
Chapter 8 Table 8-3. Decode Tab Too
- Page 168 and 169:
Chapter 8 168 Sniffer Portable Prof
- Page 170 and 171:
Chapter 8 b 170 Sniffer Portable Pr
- Page 172 and 173:
Chapter 8 a 172 Sniffer Portable Pr
- Page 174 and 175:
Chapter 8 174 Sniffer Portable Prof
- Page 176 and 177:
Chapter 8 176 Sniffer Portable Prof
- Page 178 and 179:
Chapter 8 178 Sniffer Portable Prof
- Page 180 and 181:
Chapter 8 Display Setup > Summary D
- Page 182 and 183:
Chapter 8 182 Sniffer Portable Prof
- Page 184 and 185:
Chapter 8 184 Sniffer Portable Prof
- Page 186 and 187:
Chapter 8 Searching for Frames in t
- Page 188 and 189:
Chapter 8 Searching for Frames Matc
- Page 190 and 191:
Chapter 8 Searching for Frames Matc
- Page 192 and 193:
Chapter 8 Searching for Data Patter
- Page 194 and 195:
Chapter 8 194 Sniffer Portable Prof
- Page 196 and 197:
Chapter 8 Printing Decoded Packets
- Page 198 and 199:
Chapter 8 Using Protocol Forcing Yo
- Page 200 and 201:
Chapter 8 Sniffer Portable Professi
- Page 202 and 203:
Chapter 8 Postcapture Matrix Tab 20
- Page 204 and 205:
Chapter 8 More about the Matrix Tra
- Page 206 and 207:
Chapter 8 Postcapture Host Table Ta
- Page 208 and 209:
Chapter 8 Postcapture Protocol Dist
- Page 210 and 211:
Chapter 8 Postcapture Statistics Ta
- Page 212 and 213:
Chapter 8 212 Sniffer Portable Prof
- Page 214 and 215:
Chapter 9 4 Click OK. 214 Sniffer P
- Page 216 and 217:
Chapter 9 216 Sniffer Portable Prof
- Page 218 and 219:
Chapter 9 218 Sniffer Portable Prof
- Page 220 and 221:
Chapter 10 220 Sniffer Portable Pro
- Page 222 and 223:
Chapter 10 Using a Defined Filter U
- Page 224 and 225:
Chapter 10 224 Sniffer Portable Pro
- Page 226 and 227:
Chapter 10 Drag and drop a symbolic
- Page 228 and 229:
Chapter 10 Setting Filter Options i
- Page 230 and 231:
Chapter 10 Setting Filter Options i
- Page 232 and 233:
Chapter 10 Add or Edit Pattern Dial
- Page 234 and 235:
Chapter 10 234 Sniffer Portable Pro
- Page 236 and 237:
Chapter 10 Specify one or more netw
- Page 238 and 239:
Chapter 10 Setting Filter Options i
- Page 240 and 241:
Chapter 10 240 Sniffer Portable Pro
- Page 242 and 243:
Chapter 10 242 Sniffer Portable Pro
- Page 244 and 245:
Chapter 10 244 Sniffer Portable Pro
- Page 246 and 247:
Chapter 10 5 Click OK. 246 Sniffer
- Page 248 and 249:
Chapter 10 248 Sniffer Portable Pro
- Page 250 and 251:
Chapter 11 Description 250 Sniffer
- Page 252 and 253:
Chapter 11 Entering Names Manually
- Page 254 and 255:
Chapter 11 Click to resolve the Dom
- Page 256 and 257:
Chapter 11 256 Sniffer Portable Pro
- Page 258 and 259:
Chapter 12 Type of node triggering
- Page 260 and 261:
Chapter 12 Setting Alarm Severity L
- Page 262 and 263:
Chapter 12 Logging and Severities f
- Page 264 and 265:
Chapter 12 Setting Alarm Notificati
- Page 266 and 267:
Chapter 12 266 Sniffer Portable Pro
- Page 268 and 269:
Chapter 13 268 Sniffer Portable Pro
- Page 270 and 271:
Chapter 13 Creating Sniffer Monitor
- Page 272 and 273:
Chapter 13 272 Sniffer Portable Pro
- Page 274 and 275:
Capture panel, 123 Capture triggers
- Page 276 and 277:
zooming, Host Table 111 display tab
- Page 278 and 279:
Resolve name on Network address, Re
- Page 280:
280 Sniffer Portable Professional