Sniffer Adaptive Application Analyzer: Adaptive Mode ... - NetScout
Sniffer Adaptive Application Analyzer: Adaptive Mode ... - NetScout Sniffer Adaptive Application Analyzer: Adaptive Mode ... - NetScout
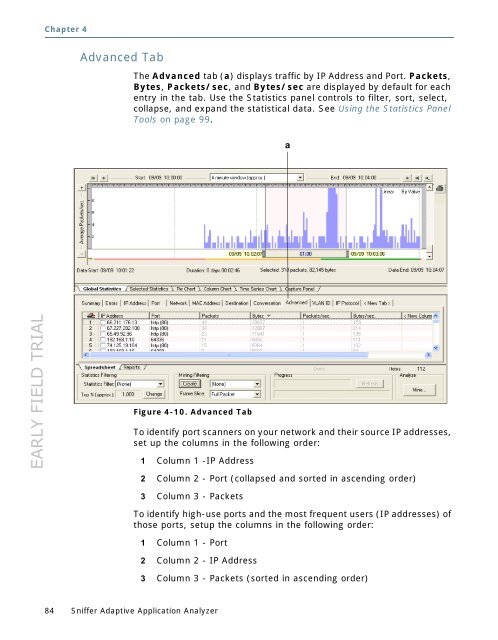
EARLY FIELD TRIAL Chapter 4 Advanced Tab 84 Sniffer Adaptive Application Analyzer The Advanced tab (a) displays traffic by IP Address and Port. Packets, Bytes, Packets/sec, and Bytes/sec are displayed by default for each entry in the tab. Use the Statistics panel controls to filter, sort, select, collapse, and expand the statistical data. See Using the Statistics Panel Tools on page 99. Figure 4-10. Advanced Tab To identify port scanners on your network and their source IP addresses, set up the columns in the following order: 1 Column 1 -IP Address 2 Column 2 - Port (collapsed and sorted in ascending order) 3 Column 3 - Packets To identify high-use ports and the most frequent users (IP addresses) of those ports, setup the columns in the following order: 1 Column 1 - Port 2 Column 2 - IP Address 3 Column 3 - Packets (sorted in ascending order) a
EARLY FIELD TRIAL VLAN ID Tab Using the Statistics Panel The VLAN tab (a) provides statistics for individual VLAN IDs on your network. Packets, Bytes, Packets/sec, and Bytes/sec are displayed by default for each entry in the tab. Use the Statistics panel controls to filter, sort, select, collapse, and expand the statistical data. See Using the Statistics Panel Tools on page 99. NOTE: If Sniffer Adaptive Application Analyzer is connected to a switch SPAN port, make sure you enable VLAN data collection on the network interface card to prevent VLAN IDs from being stripped before the application sees them. Refer to the Sniffer Adaptive Application Analyzer Installation Guide for details on usin g the sniffer_vlan_edit.exe tool included with the product to enable VLAN data collection for adapters using Intel and Broadcom chipsets. Figure 4-11. VLAN Tab a User’s Guide 85
- Page 33 and 34: EARLY FIELD TRIAL Step 4 - Capturin
- Page 35 and 36: EARLY FIELD TRIAL Capture Mode Adap
- Page 37 and 38: EARLY FIELD TRIAL Step 5 - Mining P
- Page 39 and 40: EARLY FIELD TRIAL Adaptive Postcapt
- Page 41 and 42: EARLY FIELD TRIAL Table 2-1. Postca
- Page 43 and 44: EARLY FIELD TRIAL SECTION 2 Getting
- Page 45 and 46: EARLY FIELD TRIAL Working with the
- Page 47 and 48: EARLY FIELD TRIAL Introducing the N
- Page 49 and 50: EARLY FIELD TRIAL Other Navigation
- Page 51 and 52: EARLY FIELD TRIAL Using the Time Se
- Page 53 and 54: EARLY FIELD TRIAL Working with the
- Page 55 and 56: EARLY FIELD TRIAL Zoom Menu Working
- Page 57 and 58: EARLY FIELD TRIAL Introducing the G
- Page 59 and 60: EARLY FIELD TRIAL Selected Statisti
- Page 61 and 62: EARLY FIELD TRIAL Pie Chart Working
- Page 63 and 64: EARLY FIELD TRIAL Column Chart Work
- Page 65 and 66: EARLY FIELD TRIAL Time Series Chart
- Page 67 and 68: EARLY FIELD TRIAL Working with the
- Page 69 and 70: EARLY FIELD TRIAL Working with the
- Page 71 and 72: EARLY FIELD TRIAL Using the Statist
- Page 73 and 74: EARLY FIELD TRIAL Summary Tab a Usi
- Page 75 and 76: EARLY FIELD TRIAL Using the Statist
- Page 77 and 78: EARLY FIELD TRIAL Port Tab Using th
- Page 79 and 80: EARLY FIELD TRIAL Network Tab Using
- Page 81 and 82: EARLY FIELD TRIAL Destination Tab U
- Page 83: EARLY FIELD TRIAL Using the Statist
- Page 87 and 88: EARLY FIELD TRIAL Reports Tabs Usi
- Page 89 and 90: EARLY FIELD TRIAL Top Conversations
- Page 91 and 92: EARLY FIELD TRIAL Multicast Protoco
- Page 93 and 94: EARLY FIELD TRIAL Working with the
- Page 95 and 96: EARLY FIELD TRIAL Using the Statist
- Page 97 and 98: EARLY FIELD TRIAL Refreshing Statis
- Page 99 and 100: EARLY FIELD TRIAL Using the Statist
- Page 101 and 102: EARLY FIELD TRIAL Showing and Hidin
- Page 103 and 104: EARLY FIELD TRIAL Resolving DNS Nam
- Page 105 and 106: EARLY FIELD TRIAL Table 4-1. New Co
- Page 107 and 108: EARLY FIELD TRIAL SECTION 2 Capturi
- Page 109 and 110: EARLY FIELD TRIAL Capturing and Min
- Page 111 and 112: EARLY FIELD TRIAL Configuring and S
- Page 113 and 114: EARLY FIELD TRIAL Capture Mode Adap
- Page 115 and 116: EARLY FIELD TRIAL Mining Packet Dat
- Page 117 and 118: EARLY FIELD TRIAL Capturing and Min
- Page 119 and 120: EARLY FIELD TRIAL Using Filters in
- Page 121 and 122: EARLY FIELD TRIAL Reusable Filters
- Page 123 and 124: EARLY FIELD TRIAL Figure 6-2. Apply
- Page 125 and 126: EARLY FIELD TRIAL Working with Auto
- Page 127 and 128: EARLY FIELD TRIAL Table 6-3. Filter
- Page 129 and 130: EARLY FIELD TRIAL Using Filters in
- Page 131 and 132: EARLY FIELD TRIAL Using Pattern Mat
- Page 133 and 134: EARLY FIELD TRIAL Applying Mining F
EARLY FIELD TRIAL Chapter 4<br />
Advanced Tab<br />
84 <strong>Sniffer</strong> <strong>Adaptive</strong> <strong>Application</strong> <strong>Analyzer</strong><br />
The Advanced tab (a) displays traffic by IP Address and Port. Packets,<br />
Bytes, Packets/sec, and Bytes/sec are displayed by default for each<br />
entry in the tab. Use the Statistics panel controls to filter, sort, select,<br />
collapse, and expand the statistical data. See Using the Statistics Panel<br />
Tools on page 99.<br />
Figure 4-10. Advanced Tab<br />
To identify port scanners on your network and their source IP addresses,<br />
set up the columns in the following order:<br />
1 Column 1 -IP Address<br />
2 Column 2 - Port (collapsed and sorted in ascending order)<br />
3 Column 3 - Packets<br />
To identify high-use ports and the most frequent users (IP addresses) of<br />
those ports, setup the columns in the following order:<br />
1 Column 1 - Port<br />
2 Column 2 - IP Address<br />
3 Column 3 - Packets (sorted in ascending order)<br />
a


