Sniffer Adaptive Application Analyzer: Adaptive Mode ... - NetScout
Sniffer Adaptive Application Analyzer: Adaptive Mode ... - NetScout
Sniffer Adaptive Application Analyzer: Adaptive Mode ... - NetScout

Create successful ePaper yourself
Turn your PDF publications into a flip-book with our unique Google optimized e-Paper software.
EARLY FIELD TRIAL<br />
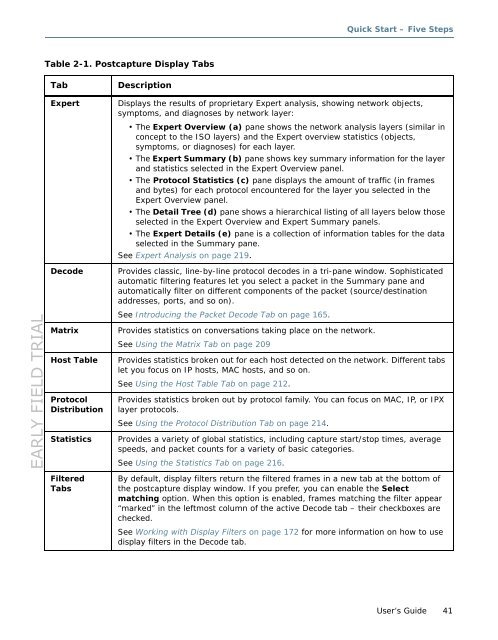
Table 2-1. Postcapture Display Tabs<br />
Tab Description<br />
Quick Start – Five Steps<br />
Expert Displays the results of proprietary Expert analysis, showing network objects,<br />
symptoms, and diagnoses by network layer:<br />
•The Expert Overview (a) pane shows the network analysis layers (similar in<br />
concept to the ISO layers) and the Expert overview statistics (objects,<br />
symptoms, or diagnoses) for each layer.<br />
•The Expert Summary (b) pane shows key summary information for the layer<br />
and statistics selected in the Expert Overview panel.<br />
•The Protocol Statistics (c) pane displays the amount of traffic (in frames<br />
and bytes) for each protocol encountered for the layer you selected in the<br />
Expert Overview panel.<br />
•The Detail Tree (d) pane shows a hierarchical listing of all layers below those<br />
selected in the Expert Overview and Expert Summary panels.<br />
•The Expert Details (e) pane is a collection of information tables for the data<br />
selected in the Summary pane.<br />
See Expert Analysis on page 219.<br />
Decode Provides classic, line-by-line protocol decodes in a tri-pane window. Sophisticated<br />
automatic filtering features let you select a packet in the Summary pane and<br />
automatically filter on different components of the packet (source/destination<br />
addresses, ports, and so on).<br />
See Introducing the Packet Decode Tab on page 165.<br />
Matrix Provides statistics on conversations taking place on the network.<br />
See Using the Matrix Tab on page 209<br />
Host Table Provides statistics broken out for each host detected on the network. Different tabs<br />
let you focus on IP hosts, MAC hosts, and so on.<br />
See Using the Host Table Tab on page 212.<br />
Protocol<br />
Distribution<br />
Provides statistics broken out by protocol family. You can focus on MAC, IP, or IPX<br />
layer protocols.<br />
See Using the Protocol Distribution Tab on page 214.<br />
Statistics Provides a variety of global statistics, including capture start/stop times, average<br />
speeds, and packet counts for a variety of basic categories.<br />
See Using the Statistics Tab on page 216.<br />
Filtered<br />
Tabs<br />
By default, display filters return the filtered frames in a new tab at the bottom of<br />
the postcapture display window. If you prefer, you can enable the Select<br />
matching option. When this option is enabled, frames matching the filter appear<br />
“marked” in the leftmost column of the active Decode tab – their checkboxes are<br />
checked.<br />
See Working with Display Filters on page 172 for more information on how to use<br />
display filters in the Decode tab.<br />
User’s Guide 41