- Page 1 and 2:
EARLY FIELD TRIAL Sniffer ® Adapti
- Page 3 and 4:
EARLY FIELD TRIAL "This product inc
- Page 5 and 6:
EARLY FIELD TRIAL Contents Section
- Page 7 and 8:
EARLY FIELD TRIAL Contents Overview
- Page 9 and 10:
EARLY FIELD TRIAL Contents Setting
- Page 11 and 12:
EARLY FIELD TRIAL SECTION 1 Introdu
- Page 13 and 14:
EARLY FIELD TRIAL Sniffer Adaptive
- Page 15 and 16:
EARLY FIELD TRIAL Figure 1-2. Adapt
- Page 17 and 18:
EARLY FIELD TRIAL Sniffer Adaptive
- Page 19 and 20:
EARLY FIELD TRIAL Sample Trace File
- Page 21 and 22:
EARLY FIELD TRIAL Sniffer Adaptive
- Page 23 and 24:
EARLY FIELD TRIAL Key Terms Table 1
- Page 25 and 26:
EARLY FIELD TRIAL Table 1-3. Key Te
- Page 27 and 28:
EARLY FIELD TRIAL Quick Start - Fiv
- Page 29 and 30:
EARLY FIELD TRIAL Double-click the
- Page 31 and 32:
EARLY FIELD TRIAL Quick Start - Fiv
- Page 33 and 34:
EARLY FIELD TRIAL Step 4 - Capturin
- Page 35 and 36:
EARLY FIELD TRIAL Capture Mode Adap
- Page 37 and 38:
EARLY FIELD TRIAL Step 5 - Mining P
- Page 39 and 40:
EARLY FIELD TRIAL Adaptive Postcapt
- Page 41 and 42:
EARLY FIELD TRIAL Table 2-1. Postca
- Page 43 and 44:
EARLY FIELD TRIAL SECTION 2 Getting
- Page 45 and 46:
EARLY FIELD TRIAL Working with the
- Page 47 and 48:
EARLY FIELD TRIAL Introducing the N
- Page 49 and 50:
EARLY FIELD TRIAL Other Navigation
- Page 51 and 52:
EARLY FIELD TRIAL Using the Time Se
- Page 53 and 54:
EARLY FIELD TRIAL Working with the
- Page 55 and 56:
EARLY FIELD TRIAL Zoom Menu Working
- Page 57 and 58:
EARLY FIELD TRIAL Introducing the G
- Page 59 and 60:
EARLY FIELD TRIAL Selected Statisti
- Page 61 and 62:
EARLY FIELD TRIAL Pie Chart Working
- Page 63 and 64:
EARLY FIELD TRIAL Column Chart Work
- Page 65 and 66:
EARLY FIELD TRIAL Time Series Chart
- Page 67 and 68:
EARLY FIELD TRIAL Working with the
- Page 69 and 70:
EARLY FIELD TRIAL Working with the
- Page 71 and 72:
EARLY FIELD TRIAL Using the Statist
- Page 73 and 74:
EARLY FIELD TRIAL Summary Tab a Usi
- Page 75 and 76:
EARLY FIELD TRIAL Using the Statist
- Page 77 and 78:
EARLY FIELD TRIAL Port Tab Using th
- Page 79 and 80:
EARLY FIELD TRIAL Network Tab Using
- Page 81 and 82:
EARLY FIELD TRIAL Destination Tab U
- Page 83 and 84:
EARLY FIELD TRIAL Using the Statist
- Page 85 and 86:
EARLY FIELD TRIAL VLAN ID Tab Using
- Page 87 and 88:
EARLY FIELD TRIAL Reports Tabs Usi
- Page 89 and 90:
EARLY FIELD TRIAL Top Conversations
- Page 91 and 92:
EARLY FIELD TRIAL Multicast Protoco
- Page 93 and 94:
EARLY FIELD TRIAL Working with the
- Page 95 and 96:
EARLY FIELD TRIAL Using the Statist
- Page 97 and 98:
EARLY FIELD TRIAL Refreshing Statis
- Page 99 and 100:
EARLY FIELD TRIAL Using the Statist
- Page 101 and 102:
EARLY FIELD TRIAL Showing and Hidin
- Page 103 and 104:
EARLY FIELD TRIAL Resolving DNS Nam
- Page 105 and 106:
EARLY FIELD TRIAL Table 4-1. New Co
- Page 107 and 108:
EARLY FIELD TRIAL SECTION 2 Capturi
- Page 109 and 110:
EARLY FIELD TRIAL Capturing and Min
- Page 111 and 112:
EARLY FIELD TRIAL Configuring and S
- Page 113 and 114:
EARLY FIELD TRIAL Capture Mode Adap
- Page 115 and 116:
EARLY FIELD TRIAL Mining Packet Dat
- Page 117 and 118:
EARLY FIELD TRIAL Capturing and Min
- Page 119 and 120:
EARLY FIELD TRIAL Using Filters in
- Page 121 and 122:
EARLY FIELD TRIAL Reusable Filters
- Page 123 and 124:
EARLY FIELD TRIAL Figure 6-2. Apply
- Page 125 and 126:
EARLY FIELD TRIAL Working with Auto
- Page 127 and 128:
EARLY FIELD TRIAL Table 6-3. Filter
- Page 129 and 130:
EARLY FIELD TRIAL Using Filters in
- Page 131 and 132:
EARLY FIELD TRIAL Using Pattern Mat
- Page 133 and 134:
EARLY FIELD TRIAL Applying Mining F
- Page 135 and 136:
EARLY FIELD TRIAL Using Filters in
- Page 137 and 138:
EARLY FIELD TRIAL Adaptive Display
- Page 139 and 140:
EARLY FIELD TRIAL SECTION 3 Analyzi
- Page 141 and 142:
EARLY FIELD TRIAL Adaptive Session
- Page 143 and 144:
EARLY FIELD TRIAL Adaptive Mode Pos
- Page 145 and 146:
EARLY FIELD TRIAL Adaptive Session
- Page 147 and 148:
EARLY FIELD TRIAL Adaptive Session
- Page 149 and 150:
EARLY FIELD TRIAL Session Overview
- Page 151 and 152:
EARLY FIELD TRIAL Drilling Down to
- Page 153 and 154:
EARLY FIELD TRIAL Adaptive Decode V
- Page 155 and 156:
EARLY FIELD TRIAL Opening ASP Files
- Page 157 and 158:
EARLY FIELD TRIAL Figure 7-9. Openi
- Page 159 and 160:
EARLY FIELD TRIAL Using Filters wit
- Page 161 and 162:
EARLY FIELD TRIAL Raw Capture Mode
- Page 163 and 164:
EARLY FIELD TRIAL Table 8-1. Postca
- Page 165 and 166:
EARLY FIELD TRIAL Introducing the P
- Page 167 and 168:
EARLY FIELD TRIAL Granularity in De
- Page 169 and 170:
EARLY FIELD TRIAL Packet Status Fla
- Page 171 and 172:
EARLY FIELD TRIAL Table 8-5. Decode
- Page 173 and 174:
EARLY FIELD TRIAL Types of Display
- Page 175 and 176:
EARLY FIELD TRIAL Raw Capture Mode
- Page 177 and 178:
EARLY FIELD TRIAL a The “Apply on
- Page 179 and 180:
EARLY FIELD TRIAL Raw Capture Mode
- Page 181 and 182:
EARLY FIELD TRIAL Raw Capture Mode
- Page 183 and 184:
EARLY FIELD TRIAL Raw Capture Mode
- Page 185 and 186:
EARLY FIELD TRIAL Using the Manual
- Page 187 and 188:
EARLY FIELD TRIAL 5 Click OK. Figur
- Page 189 and 190:
EARLY FIELD TRIAL Raw Capture Mode
- Page 191 and 192:
EARLY FIELD TRIAL Setting Display S
- Page 193 and 194:
EARLY FIELD TRIAL Raw Capture Mode
- Page 195 and 196:
EARLY FIELD TRIAL Table 8-9. Summar
- Page 197 and 198:
EARLY FIELD TRIAL Raw Capture Mode
- Page 199 and 200:
EARLY FIELD TRIAL Searching for Fra
- Page 201 and 202:
EARLY FIELD TRIAL Raw Capture Mode
- Page 203 and 204:
EARLY FIELD TRIAL Raw Capture Mode
- Page 205 and 206:
EARLY FIELD TRIAL Raw Capture Mode
- Page 207 and 208:
EARLY FIELD TRIAL Printing Decoded
- Page 209 and 210:
EARLY FIELD TRIAL Using the Matrix
- Page 211 and 212: EARLY FIELD TRIAL Raw Capture Mode
- Page 213 and 214: EARLY FIELD TRIAL Using the Host Ta
- Page 215 and 216: EARLY FIELD TRIAL Using the Protoco
- Page 217 and 218: EARLY FIELD TRIAL Enabling VLAN Dat
- Page 219 and 220: EARLY FIELD TRIAL Expert Analysis O
- Page 221 and 222: EARLY FIELD TRIAL Expert Tool Bar T
- Page 223 and 224: EARLY FIELD TRIAL Expert Analysis
- Page 225 and 226: EARLY FIELD TRIAL Setting Expert Op
- Page 227 and 228: EARLY FIELD TRIAL Analyze Expert An
- Page 229 and 230: EARLY FIELD TRIAL Alarms Expert Ana
- Page 231 and 232: EARLY FIELD TRIAL Protocols To conf
- Page 233 and 234: EARLY FIELD TRIAL Subnet Masks To d
- Page 235 and 236: EARLY FIELD TRIAL To configure or d
- Page 237 and 238: EARLY FIELD TRIAL Oracle Options Mo
- Page 239 and 240: EARLY FIELD TRIAL IP Options Expert
- Page 241 and 242: EARLY FIELD TRIAL SECTION 4 Additio
- Page 243 and 244: EARLY FIELD TRIAL Setting Quick Sel
- Page 245 and 246: EARLY FIELD TRIAL Setting Quick Sel
- Page 247 and 248: EARLY FIELD TRIAL Setting Graph Tab
- Page 249 and 250: EARLY FIELD TRIAL Setting Quick Sel
- Page 251 and 252: EARLY FIELD TRIAL Setting Quick Sel
- Page 253 and 254: EARLY FIELD TRIAL Figure 10-6. Addi
- Page 255 and 256: EARLY FIELD TRIAL Using the Address
- Page 257 and 258: EARLY FIELD TRIAL Using the Address
- Page 259 and 260: EARLY FIELD TRIAL SECTION 5 Reporti
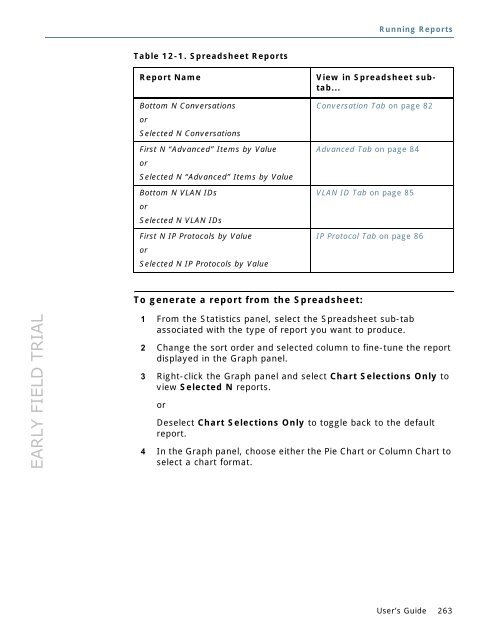
- Page 261: EARLY FIELD TRIAL Running Reports O
- Page 265 and 266: EARLY FIELD TRIAL Running Reports 4
- Page 267 and 268: EARLY FIELD TRIAL Index A About the
- Page 269 and 270: EARLY FIELD TRIAL Host Table, 212 m
- Page 271 and 272: EARLY FIELD TRIAL G General tab, 24
- Page 273 and 274: EARLY FIELD TRIAL option, 243 Mindi
- Page 275 and 276: EARLY FIELD TRIAL S S2DPalette.ini
- Page 277: EARLY FIELD TRIAL U Use Address Boo