Sniffer Adaptive Application Analyzer: Adaptive Mode ... - NetScout
Sniffer Adaptive Application Analyzer: Adaptive Mode ... - NetScout Sniffer Adaptive Application Analyzer: Adaptive Mode ... - NetScout
EARLY FIELD TRIAL Chapter 10 246 Sniffer Adaptive Application Analyzer The Connection Defaults options are not used in this release. The Capture Engine Display option lets you specify how to display capture device entries in the Navigation panel. Choose from the following: Display the IP Address only, Name only, or name with IP Address. NOTE: Sniffer Adaptive Application Analyzer uses local capture interfaces displayed with the loopback IP address of 127.0.0.1. NOTE: After enabling the Display the Capture Engine name only option, capture devices still appear in the Navigation panel with their IP addresses. To remove capture device IP addresses from the Navigation panel display entirely, deselect the Show IP Address With Name option in the Configure Connection dialog box, instead. You can access the Configure Connection dialog box by right-clicking a capture device in the Navigation panel and selecting the Configure Connection command.
EARLY FIELD TRIAL Setting Graph Tab Options Setting Quick Select Options Specify how to display newly opened streams in the Graph Panel: Figure 10-3. Graph Tab Data Type displays data in either Packets per second, Bytes per second, Bits per second, or Utilization. Graph Style displays the data in either a Stacked bars or Lines graph. Data Source displays either the data values you have selected or presents the Filtered Results. Graph Scale displays graphs in either a Linear or Logarithmic format. Zoom Level configures the default level in which to display data in the Graph panel. Monitor Update Frequency lets you select the time interval between data updates when operating in Active Monitor Mode. This mode displays new data on the Graph panel as it arrives from the stream. See Monitoring for Updates – Active Monitor Mode on page 54. User’s Guide 247
- Page 195 and 196: EARLY FIELD TRIAL Table 8-9. Summar
- Page 197 and 198: EARLY FIELD TRIAL Raw Capture Mode
- Page 199 and 200: EARLY FIELD TRIAL Searching for Fra
- Page 201 and 202: EARLY FIELD TRIAL Raw Capture Mode
- Page 203 and 204: EARLY FIELD TRIAL Raw Capture Mode
- Page 205 and 206: EARLY FIELD TRIAL Raw Capture Mode
- Page 207 and 208: EARLY FIELD TRIAL Printing Decoded
- Page 209 and 210: EARLY FIELD TRIAL Using the Matrix
- Page 211 and 212: EARLY FIELD TRIAL Raw Capture Mode
- Page 213 and 214: EARLY FIELD TRIAL Using the Host Ta
- Page 215 and 216: EARLY FIELD TRIAL Using the Protoco
- Page 217 and 218: EARLY FIELD TRIAL Enabling VLAN Dat
- Page 219 and 220: EARLY FIELD TRIAL Expert Analysis O
- Page 221 and 222: EARLY FIELD TRIAL Expert Tool Bar T
- Page 223 and 224: EARLY FIELD TRIAL Expert Analysis
- Page 225 and 226: EARLY FIELD TRIAL Setting Expert Op
- Page 227 and 228: EARLY FIELD TRIAL Analyze Expert An
- Page 229 and 230: EARLY FIELD TRIAL Alarms Expert Ana
- Page 231 and 232: EARLY FIELD TRIAL Protocols To conf
- Page 233 and 234: EARLY FIELD TRIAL Subnet Masks To d
- Page 235 and 236: EARLY FIELD TRIAL To configure or d
- Page 237 and 238: EARLY FIELD TRIAL Oracle Options Mo
- Page 239 and 240: EARLY FIELD TRIAL IP Options Expert
- Page 241 and 242: EARLY FIELD TRIAL SECTION 4 Additio
- Page 243 and 244: EARLY FIELD TRIAL Setting Quick Sel
- Page 245: EARLY FIELD TRIAL Setting Quick Sel
- Page 249 and 250: EARLY FIELD TRIAL Setting Quick Sel
- Page 251 and 252: EARLY FIELD TRIAL Setting Quick Sel
- Page 253 and 254: EARLY FIELD TRIAL Figure 10-6. Addi
- Page 255 and 256: EARLY FIELD TRIAL Using the Address
- Page 257 and 258: EARLY FIELD TRIAL Using the Address
- Page 259 and 260: EARLY FIELD TRIAL SECTION 5 Reporti
- Page 261 and 262: EARLY FIELD TRIAL Running Reports O
- Page 263 and 264: EARLY FIELD TRIAL Table 12-1. Sprea
- Page 265 and 266: EARLY FIELD TRIAL Running Reports 4
- Page 267 and 268: EARLY FIELD TRIAL Index A About the
- Page 269 and 270: EARLY FIELD TRIAL Host Table, 212 m
- Page 271 and 272: EARLY FIELD TRIAL G General tab, 24
- Page 273 and 274: EARLY FIELD TRIAL option, 243 Mindi
- Page 275 and 276: EARLY FIELD TRIAL S S2DPalette.ini
- Page 277: EARLY FIELD TRIAL U Use Address Boo
EARLY FIELD TRIAL<br />
Setting Graph Tab Options<br />
Setting Quick Select Options<br />
Specify how to display newly opened streams in the Graph Panel:<br />
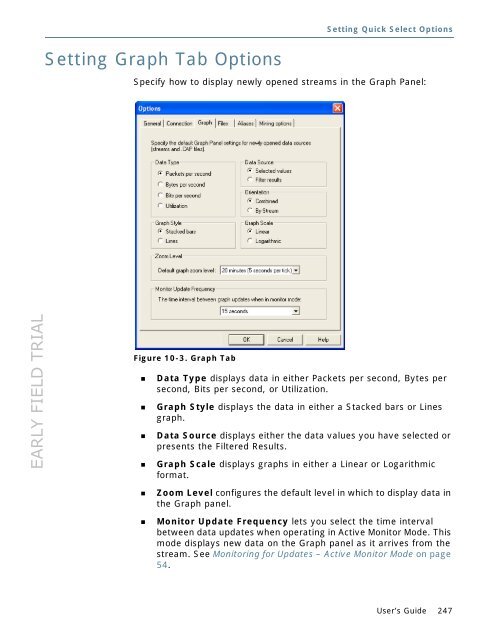
Figure 10-3. Graph Tab<br />
Data Type displays data in either Packets per second, Bytes per<br />
second, Bits per second, or Utilization.<br />
Graph Style displays the data in either a Stacked bars or Lines<br />
graph.<br />
Data Source displays either the data values you have selected or<br />
presents the Filtered Results.<br />
Graph Scale displays graphs in either a Linear or Logarithmic<br />
format.<br />
Zoom Level configures the default level in which to display data in<br />
the Graph panel.<br />
Monitor Update Frequency lets you select the time interval<br />
between data updates when operating in Active Monitor <strong>Mode</strong>. This<br />
mode displays new data on the Graph panel as it arrives from the<br />
stream. See Monitoring for Updates – Active Monitor <strong>Mode</strong> on page<br />
54.<br />
User’s Guide 247


