Sniffer Adaptive Application Analyzer: Adaptive Mode ... - NetScout
Sniffer Adaptive Application Analyzer: Adaptive Mode ... - NetScout Sniffer Adaptive Application Analyzer: Adaptive Mode ... - NetScout
EARLY FIELD TRIAL Chapter 9 Figure 9-1. The Expert Tab Panes 220 Sniffer Adaptive Application Analyzer a c d e The Expert Overview pane (a) shows the network analysis layers (similar in concept to the ISO layers) and the Expert overview statistics (objects, symptoms, or diagnoses) for each layer. By selecting a combination of layer and statistic type, you control the display of Expert analysis data in the other Expert panes. Click the arrow icon (a) to open/close this pane. The Expert Summary pane (b) shows key summary information for the layer and statistic selected in the Expert Overview pane. The column headings for the Expert Summary display will change, depending on what layer and statistic you have selected. The Protocol Statistics pane (c) shows the amount of traffic (in frames and bytes) for each protocol encountered for the layer you selected in the Expert Overview pane. (This pane is not displayed when the Expert Overview pane is narrow.) The Detail Tree pane (d) shows a hierarchical listing of all layers at or below those selected in the Expert Overview and Expert Summary panes. You can expand or collapse each layer in a manner similar to Windows Explorer. Click on any item in the Detail Tree to show its Expert detail data. The Expert Details pane (e) is a collection of information tables for the data selected by the other panes. The content of the Expert Detail pane will vary, depending on what items are selected in the various other panes. b
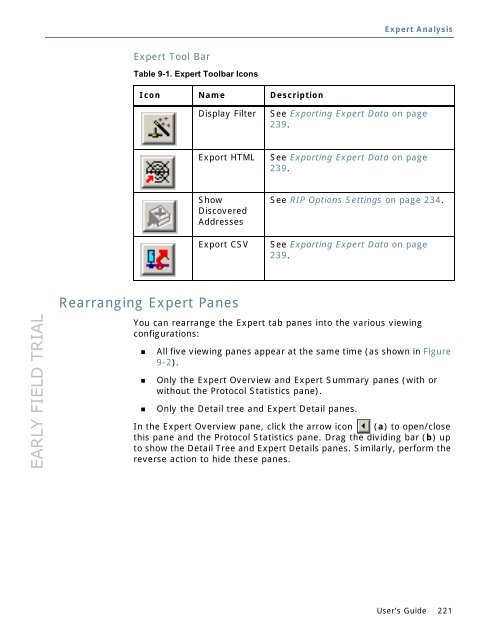
EARLY FIELD TRIAL Expert Tool Bar Table 9-1. Expert Toolbar Icons Icon Name Description Rearranging Expert Panes Expert Analysis Display Filter See Exporting Expert Data on page 239. Export HTML See Exporting Expert Data on page 239. Show Discovered Addresses See RIP Options Settings on page 234. Export CSV See Exporting Expert Data on page 239. You can rearrange the Expert tab panes into the various viewing configurations: All five viewing panes appear at the same time (as shown in Figure 9-2). Only the Expert Overview and Expert Summary panes (with or without the Protocol Statistics pane). Only the Detail tree and Expert Detail panes. In the Expert Overview pane, click the arrow icon (a) to open/close this pane and the Protocol Statistics pane. Drag the dividing bar (b) up to show the Detail Tree and Expert Details panes. Similarly, perform the reverse action to hide these panes. User’s Guide 221
- Page 169 and 170: EARLY FIELD TRIAL Packet Status Fla
- Page 171 and 172: EARLY FIELD TRIAL Table 8-5. Decode
- Page 173 and 174: EARLY FIELD TRIAL Types of Display
- Page 175 and 176: EARLY FIELD TRIAL Raw Capture Mode
- Page 177 and 178: EARLY FIELD TRIAL a The “Apply on
- Page 179 and 180: EARLY FIELD TRIAL Raw Capture Mode
- Page 181 and 182: EARLY FIELD TRIAL Raw Capture Mode
- Page 183 and 184: EARLY FIELD TRIAL Raw Capture Mode
- Page 185 and 186: EARLY FIELD TRIAL Using the Manual
- Page 187 and 188: EARLY FIELD TRIAL 5 Click OK. Figur
- Page 189 and 190: EARLY FIELD TRIAL Raw Capture Mode
- Page 191 and 192: EARLY FIELD TRIAL Setting Display S
- Page 193 and 194: EARLY FIELD TRIAL Raw Capture Mode
- Page 195 and 196: EARLY FIELD TRIAL Table 8-9. Summar
- Page 197 and 198: EARLY FIELD TRIAL Raw Capture Mode
- Page 199 and 200: EARLY FIELD TRIAL Searching for Fra
- Page 201 and 202: EARLY FIELD TRIAL Raw Capture Mode
- Page 203 and 204: EARLY FIELD TRIAL Raw Capture Mode
- Page 205 and 206: EARLY FIELD TRIAL Raw Capture Mode
- Page 207 and 208: EARLY FIELD TRIAL Printing Decoded
- Page 209 and 210: EARLY FIELD TRIAL Using the Matrix
- Page 211 and 212: EARLY FIELD TRIAL Raw Capture Mode
- Page 213 and 214: EARLY FIELD TRIAL Using the Host Ta
- Page 215 and 216: EARLY FIELD TRIAL Using the Protoco
- Page 217 and 218: EARLY FIELD TRIAL Enabling VLAN Dat
- Page 219: EARLY FIELD TRIAL Expert Analysis O
- Page 223 and 224: EARLY FIELD TRIAL Expert Analysis
- Page 225 and 226: EARLY FIELD TRIAL Setting Expert Op
- Page 227 and 228: EARLY FIELD TRIAL Analyze Expert An
- Page 229 and 230: EARLY FIELD TRIAL Alarms Expert Ana
- Page 231 and 232: EARLY FIELD TRIAL Protocols To conf
- Page 233 and 234: EARLY FIELD TRIAL Subnet Masks To d
- Page 235 and 236: EARLY FIELD TRIAL To configure or d
- Page 237 and 238: EARLY FIELD TRIAL Oracle Options Mo
- Page 239 and 240: EARLY FIELD TRIAL IP Options Expert
- Page 241 and 242: EARLY FIELD TRIAL SECTION 4 Additio
- Page 243 and 244: EARLY FIELD TRIAL Setting Quick Sel
- Page 245 and 246: EARLY FIELD TRIAL Setting Quick Sel
- Page 247 and 248: EARLY FIELD TRIAL Setting Graph Tab
- Page 249 and 250: EARLY FIELD TRIAL Setting Quick Sel
- Page 251 and 252: EARLY FIELD TRIAL Setting Quick Sel
- Page 253 and 254: EARLY FIELD TRIAL Figure 10-6. Addi
- Page 255 and 256: EARLY FIELD TRIAL Using the Address
- Page 257 and 258: EARLY FIELD TRIAL Using the Address
- Page 259 and 260: EARLY FIELD TRIAL SECTION 5 Reporti
- Page 261 and 262: EARLY FIELD TRIAL Running Reports O
- Page 263 and 264: EARLY FIELD TRIAL Table 12-1. Sprea
- Page 265 and 266: EARLY FIELD TRIAL Running Reports 4
- Page 267 and 268: EARLY FIELD TRIAL Index A About the
- Page 269 and 270: EARLY FIELD TRIAL Host Table, 212 m
EARLY FIELD TRIAL<br />
Expert Tool Bar<br />
Table 9-1. Expert Toolbar Icons<br />
Icon Name Description<br />
Rearranging Expert Panes<br />
Expert Analysis<br />
Display Filter See Exporting Expert Data on page<br />
239.<br />
Export HTML See Exporting Expert Data on page<br />
239.<br />
Show<br />
Discovered<br />
Addresses<br />
See RIP Options Settings on page 234.<br />
Export CSV See Exporting Expert Data on page<br />
239.<br />
You can rearrange the Expert tab panes into the various viewing<br />
configurations:<br />
All five viewing panes appear at the same time (as shown in Figure<br />
9-2).<br />
Only the Expert Overview and Expert Summary panes (with or<br />
without the Protocol Statistics pane).<br />
Only the Detail tree and Expert Detail panes.<br />
In the Expert Overview pane, click the arrow icon (a) to open/close<br />
this pane and the Protocol Statistics pane. Drag the dividing bar (b) up<br />
to show the Detail Tree and Expert Details panes. Similarly, perform the<br />
reverse action to hide these panes.<br />
User’s Guide 221


