Munich Re Group Changing Gear gg
Munich Re Group Changing Gear gg
Munich Re Group Changing Gear gg

Create successful ePaper yourself
Turn your PDF publications into a flip-book with our unique Google optimized e-Paper software.
Backup: <strong>Group</strong><br />
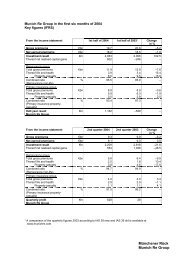
Key figures of <strong>Munich</strong> <strong>Re</strong> <strong>Group</strong><br />
<strong>Munich</strong> <strong>Re</strong> <strong>Group</strong> and our shares<br />
<strong>Munich</strong> <strong>Re</strong> <strong>Group</strong><br />
<strong>Munich</strong> <strong>Re</strong> <strong>Group</strong> 2007 20061 20051 2004 2003<br />
Gross premiums written €bn 37.3 37.4 38.2 38.1 40.4<br />
<strong>Re</strong>sult before amortisation of goodwill €m 5,078 5,477 4,143 3,025 1,284<br />
Taxes on income €m 808 1,648 1,014 712 1,752<br />
Consolidated result €m 3,937 3,519 2,751 1,887 –468<br />
Thereof attributable to minority interests €m 83 94 72 54 –34<br />
Investments €bn 176.2 176.9 177.2 178.1 171.9<br />
<strong>Re</strong>turn on equity % 15.3 14.1 12.5 9.5 –3.0<br />
Equity €bn 25.5 26.3 24.3 20.5 19.3<br />
Off-balance-sheet reserves2 €bn 0.6 1.9 2.6 3.2 1.8<br />
Net technical provisions €bn 152.4 153.9 154.0 154.3 147.5<br />
Staff at 31 December 38,634 37,210 37,953 40,962 41,431<br />
Our shares 2007 2006 2005 2004 2003<br />
Earnings per share € 17.90 15.051 11.70 8.01 –2.25<br />
Dividend per share € 5.50 4.50 3.10 2.00 1.25<br />
Amount distributed €m 1,124 988 707 457 286<br />
Share price at 31 December € 132.94 130.42 114.38 90.45 96.12<br />
Market capitalisation at 31 December €bn 29.0 29.9 26.3 20.8 22.1<br />
No. of shares at year-end (ex own shares) m 207.8 225.6 228.0 228.5 229.1<br />
1 Adjusted pursuant to IAS 8.<br />
2 Including amounts attributable to minority interests and policyholders.<br />
Backup: <strong>Group</strong><br />
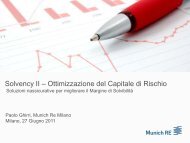
Dividend<br />
Sustainable growth for half a century<br />
0.368<br />
Main intention: Dividend continuity Dividends linked to earnings<br />
CAGR: 15.4% 1<br />
Sustainable dividend growth for half a century<br />
1969 was the only year with decreased dividend<br />
All other 50 years with stable or increased dividend<br />
0.8 1.9 3.4 5.1 9.6<br />
18<br />
30<br />
34<br />
72<br />
286<br />
221<br />
1952 1957 1962 1967 1972 1977 1982 1987 1992 1997 2002 2008<br />
Year of dividend payment 2<br />
1 Excl. realised €1bn share buy-back.<br />
2 1998 <strong>Munich</strong> <strong>Re</strong> aligned business year to calendar year.<br />
457<br />
988<br />
707<br />
1,124<br />
From flexible<br />
dividend policy<br />
towards holistic<br />
capital management<br />
philosophy<br />
<strong>Munich</strong> <strong>Re</strong> <strong>Group</strong> – October 2008<br />
16<br />
<strong>Munich</strong> <strong>Re</strong> <strong>Group</strong> – October 2008<br />
17