Driving Behaviour in Unexpected Situations - Universiteit Twente
Driving Behaviour in Unexpected Situations - Universiteit Twente
Driving Behaviour in Unexpected Situations - Universiteit Twente

You also want an ePaper? Increase the reach of your titles
YUMPU automatically turns print PDFs into web optimized ePapers that Google loves.
thesis series<br />
Trijntje Willemien Schaap<br />
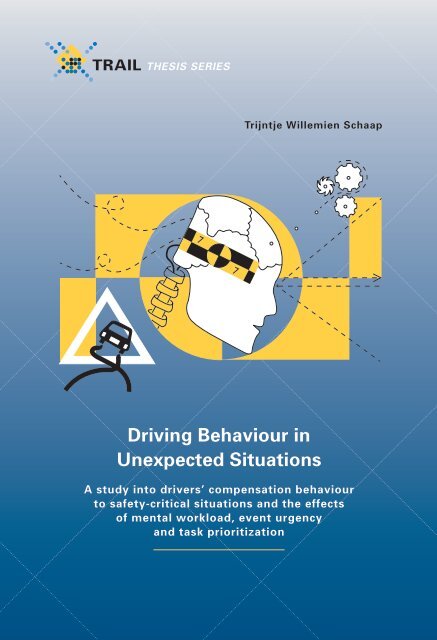
<strong>Driv<strong>in</strong>g</strong> <strong>Behaviour</strong> <strong>in</strong><br />
<strong>Unexpected</strong> <strong>Situations</strong><br />
A study <strong>in</strong>to drivers’ compensation behaviour<br />
to safety-critical situations and the effects<br />
of mental workload, event urgency<br />
and task prioritization
DRIVING BEHAVIOUR IN UNEXPECTED SITUATIONS<br />
A STUDY INTO DRIVERS’ COMPENSATION BEHAVIOUR TO SAFETY-CRITICAL<br />
SITUATIONS AND THE EFFECTS OF MENTAL WORKLOAD, EVENT URGENCY AND<br />
TASK PRIORITIZATION<br />
Trijntje Willemien Schaap
Dissertation committee:<br />
Prof. dr. ir. F. Eis<strong>in</strong>g University of <strong>Twente</strong> Chairman/ secretary<br />
Prof. dr. ir. B. van Arem University of <strong>Twente</strong>/<br />
Delft University of Technology<br />
Promotor<br />
Prof. dr. K.A. Brookhuis Delft University of Technology/<br />
University of Gron<strong>in</strong>gen<br />
Promotor<br />
Dr. ir. A.R.A. van der Horst TNO<br />
Prof. dr. ir. E.C. van Berkum University of <strong>Twente</strong><br />
Prof. P.A. Hancock, D.Sc., Ph.D. University of Central Florida<br />
Prof. O.M.J. Carsten, Ph.D. University of Leeds<br />
Dr. M.H. Martens University of <strong>Twente</strong>/ TNO<br />
TRAIL Thesis Series T2012/1, The Netherlands TRAIL Research School<br />
TRAIL Research School<br />
P.O. Box 5017<br />
2600 GA Delft<br />
The Netherlands<br />
T: +31 (0) 15 278 6046<br />
F: +31 (0) 15 278 4333<br />
E: <strong>in</strong>fo@rsTRAIL.nl<br />
CTIT Dissertation Series No. 11-210<br />
Centre for Telematics and Information Technology<br />
P.O. Box 217<br />
7500 AE Enschede<br />
The Netherlands<br />
ISBN: 978-90-5584-153-0<br />
ISSN: 1381-3617<br />
This thesis is the result of a Ph.D. study carried out between 2005 and 2011 with<strong>in</strong><br />
Knowledge centre AIDA (Applications of Integrated Driver Assistance), at the University of<br />
<strong>Twente</strong> (Centre for Transport Studies) <strong>in</strong> close cooperation with the Netherlands Organisation<br />
for Applied Scientific Research TNO. The study was funded by Transumo (TRANSition to<br />
SUsta<strong>in</strong>able MObility), a Dutch platform for companies, governments and knowledge<br />
<strong>in</strong>stitutes that cooperate <strong>in</strong> the development of knowledge with regard to susta<strong>in</strong>able mobility.<br />
Copyright © 2012 by T.W. Schaap, Den Haag, the Netherlands. All rights reserved.<br />
Cover illustration © 2012 by Rosal<strong>in</strong>de Schuil
DRIVING BEHAVIOUR IN UNEXPECTED SITUATIONS<br />
A STUDY INTO DRIVERS’ COMPENSATION BEHAVIOUR TO SAFETY-CRITICAL<br />
SITUATIONS AND THE EFFECTS OF MENTAL WORKLOAD, EVENT URGENCY AND<br />
TASK PRIORITIZATION<br />
PROEFSCHRIFT<br />
ter verkrijg<strong>in</strong>g van<br />
de graad van doctor aan de <strong>Universiteit</strong> <strong>Twente</strong>,<br />
op gezag van de rector magnificus,<br />
prof. dr. H. Br<strong>in</strong>ksma<br />
volgens besluit van het College voor Promoties<br />
<strong>in</strong> het openbaar te verdedigen<br />
op donderdag 2 februari 2012 om 12.45 uur<br />
door<br />
TRIJNTJE WILLEMIEN SCHAAP<br />
geboren op 3 augustus 1979<br />
te Leeuwarden
Dit proefschrift is goedgekeurd door de promotoren<br />
prof. dr. ir. B. van Arem<br />
prof. dr. K.A. Brookhuis
Contents<br />
INTRODUCTION................................................................................................................................. 1<br />
1.1 Context.......................................................................................................................................... 3<br />
1.2 Research questions and scope....................................................................................................... 5<br />
1.3 Scientific and societal relevance ................................................................................................... 8<br />
1.3.1 Scientific relevance................................................................................................................ 8<br />
1.3.2 Societal relevance ................................................................................................................ 10<br />
1.4 Outl<strong>in</strong>e of the thesis .................................................................................................................... 11<br />
THEORETICAL FRAMEWORK .................................................................................................... 13<br />
2.1 Complexity of the driv<strong>in</strong>g task.................................................................................................... 15<br />
2.2 Descriptions of driv<strong>in</strong>g and drivers............................................................................................. 17<br />
2.2.1 Hierarchical model of the driv<strong>in</strong>g task (Michon, 1971, 1985) ............................................ 19<br />
2.2.2 Models related to Michon’s (1971, 1985) hierarchical model of the driv<strong>in</strong>g task............... 22<br />
2.2.3 Switch<strong>in</strong>g between automatized driv<strong>in</strong>g and conscious control.......................................... 24<br />
2.2.4 Models of risk handl<strong>in</strong>g....................................................................................................... 27<br />
2.3 Traffic safety measures ............................................................................................................... 29<br />
2.4 Multi-task<strong>in</strong>g, distraction and mental workload while driv<strong>in</strong>g................................................... 32<br />
2.4.1 Multi-task<strong>in</strong>g ....................................................................................................................... 32<br />
2.4.2 Driver distraction................................................................................................................. 33<br />
2.4.3 Mental workload.................................................................................................................. 36<br />
2.4.4 Distraction and mental workload: bear<strong>in</strong>g resemblance but not the same........................... 39<br />
2.5 Situation awareness..................................................................................................................... 41<br />
2.6 Advanced Driver Assistance Systems and behavioural adaptation ............................................ 43<br />
2.6.1 Different types of ADA Systems......................................................................................... 43<br />
2.6.2 <strong>Behaviour</strong>al adaptation ........................................................................................................ 45<br />
2.6.3 Human-centred design and development of ADA Systems ................................................ 46<br />
2.7 Framework .................................................................................................................................. 47<br />
RESEARCH TOOLS.......................................................................................................................... 49<br />
3.1 Measur<strong>in</strong>g driv<strong>in</strong>g behaviour...................................................................................................... 51<br />
3.1.1 Instrumented vehicles: road and test tracks ......................................................................... 52<br />
3.1.2 <strong>Driv<strong>in</strong>g</strong> simulator................................................................................................................. 53<br />
3.1.3 Self-report measures ............................................................................................................ 54<br />
3.2 Mental workload measurements ................................................................................................. 55<br />
3.2.1 Primary task performance.................................................................................................... 55<br />
3.2.2 Secondary task performance................................................................................................ 57<br />
3.2.3 Subjective measures............................................................................................................. 59<br />
3.2.4 Physiological measures........................................................................................................ 59<br />
3.2.5 Comb<strong>in</strong><strong>in</strong>g measures of mental workload ........................................................................... 60<br />
3.3 Driver characteristics .................................................................................................................. 60<br />
3.4 Research tools used <strong>in</strong> this thesis................................................................................................ 61<br />
3.4.1 Experimental tools............................................................................................................... 62<br />
3.4.2 Calculation of variables from raw data................................................................................ 64<br />
3.4.3 Statistical analysis for both experiments ............................................................................. 65<br />
i
ii <strong>Driv<strong>in</strong>g</strong> <strong>Behaviour</strong> <strong>in</strong> <strong>Unexpected</strong> <strong>Situations</strong><br />
EXPERIMENT 1: DRIVERS’ REACTIONS TO UNEXPECTED EVENTS .............................. 67<br />
4.1 Research tools ............................................................................................................................. 69<br />
4.2 Participants.................................................................................................................................. 70<br />
4.3 Experimental design.................................................................................................................... 70<br />
4.4 Procedure .................................................................................................................................... 74<br />
4.5 Data registration and analysis ..................................................................................................... 75<br />
4.6 Results......................................................................................................................................... 75<br />
4.6.1 Validation of research construct and setup.......................................................................... 76<br />
4.6.2 Differences between trials: with<strong>in</strong>-subject effects on driv<strong>in</strong>g behaviour ............................ 84<br />
4.6.3 Effects of between-subjects factor: mental workload conditions ........................................ 86<br />
4.6.4 Effects of the unexpected events: a closer look................................................................... 88<br />
4.7 Interpretation of results and additional hypotheses..................................................................... 97<br />
4.7.1 Overview and <strong>in</strong>terpretation of results................................................................................. 97<br />
4.7.2 Hypotheses for f<strong>in</strong>al experiment.......................................................................................... 99<br />
4.8 Consequences of current experimental setup for results and lessons learned........................... 100<br />
4.8.1 Layout of virtual environment ........................................................................................... 100<br />
4.8.2 Programm<strong>in</strong>g of unexpected events................................................................................... 101<br />
4.8.3 Programm<strong>in</strong>g of lead car’s speed choice ........................................................................... 101<br />
4.8.4 Data record<strong>in</strong>g ................................................................................................................... 102<br />
4.8.5 Modifications on experimental setup for f<strong>in</strong>al experiment - lessons learned .................... 102<br />
EXPERIMENT 2: EFFECTS OF UNEXPECTED BRAKING EVENTS UNDER VARYING<br />
MENTAL WORKLOAD CONDITIONS ....................................................................................... 105<br />
5.1 Hypotheses................................................................................................................................ 107<br />
5.2 Research tools ........................................................................................................................... 107<br />
5.3 Participants................................................................................................................................ 108<br />
5.4 Experimental design.................................................................................................................. 109<br />
5.5 Procedure .................................................................................................................................. 112<br />
5.6 Results....................................................................................................................................... 113<br />
5.6.1 Construct validity and setup .............................................................................................. 114<br />
5.6.2 Effects of the brak<strong>in</strong>g event on driv<strong>in</strong>g behaviour ............................................................ 117<br />
5.6.3 Effects of vary<strong>in</strong>g mental workload on driv<strong>in</strong>g behaviour ................................................ 132<br />
5.6.4 Interaction effects: brak<strong>in</strong>g, urgency and level of mental workload ................................. 136<br />
5.7 Overview of results ................................................................................................................... 142<br />
5.8 Discussion of experimental setup ............................................................................................. 143<br />
5.8.1 Criticality levels and number of unexpected events .......................................................... 143<br />
5.8.2 Effect sizes......................................................................................................................... 143<br />
5.8.3 Motion sickness ................................................................................................................. 144<br />
DISCUSSION .................................................................................................................................... 145<br />
6.1 Recapitulation: an overview of relevant results........................................................................ 147<br />
6.1.1 Experiment 1: <strong>in</strong>itial hypotheses ....................................................................................... 147<br />
6.1.2 Experiment 2: additional hypotheses................................................................................. 148<br />
6.1.3 Possible under- or overestimation of results...................................................................... 151<br />
6.1.4 Differences expla<strong>in</strong>ed ........................................................................................................ 152<br />
6.2 Interpretation of results ............................................................................................................. 154<br />
6.2.1 Mental workload and the driv<strong>in</strong>g task: dynamic vs steady-state situations....................... 154<br />
6.2.2 Michon’s (1971, 1985) hierarchical model of the driv<strong>in</strong>g task ......................................... 156<br />
6.2.3 Task prioritization.............................................................................................................. 159<br />
6.2.4 Conscious control versus driv<strong>in</strong>g <strong>in</strong> an automatic fashion ................................................ 160<br />
6.2.5 Risk handl<strong>in</strong>g..................................................................................................................... 162<br />
6.3 Design considerations for ADA Systems.................................................................................. 163
Contents iii<br />
CONCLUSIONS................................................................................................................................ 167<br />
7.1 Context and research questions................................................................................................. 169<br />
7.1.1 Research questions ............................................................................................................ 169<br />
7.1.2 Research approach............................................................................................................. 170<br />
7.2 F<strong>in</strong>d<strong>in</strong>gs: Reactions to unexpected, safety-critical events ........................................................ 170<br />
7.2.1 Compensation behaviour and driv<strong>in</strong>g style ....................................................................... 170<br />
7.2.2 Task prioritization.............................................................................................................. 171<br />
7.2.3 Automatized driv<strong>in</strong>g versus conscious control over the driv<strong>in</strong>g task................................ 172<br />
7.3 Reflections on theoretical framework ....................................................................................... 172<br />
7.3.1 Latent driver distraction and mental workload.................................................................. 172<br />
7.3.2 The hierarchical model of the driv<strong>in</strong>g task ........................................................................ 173<br />
7.4 Human-centred design of ADA Systems .................................................................................. 174<br />
7.5 Recommendations for further research ..................................................................................... 175<br />
REFERENCES .................................................................................................................................. 177<br />
APPENDICES ................................................................................................................................... 191<br />
A.1 Annotated code for the first experiment................................................................................... 193<br />
A.2 Annotated code for the f<strong>in</strong>al experiment.................................................................................. 195<br />
B.1 Instructions for the first driv<strong>in</strong>g simulator experiment (<strong>in</strong> Dutch) ........................................... 197<br />
B.2 Instructions for the f<strong>in</strong>al driv<strong>in</strong>g simulator experiment (<strong>in</strong> Dutch) .......................................... 198<br />
C.1 Questionnaire for the first driv<strong>in</strong>g simulator experiment (<strong>in</strong> Dutch)........................................ 200<br />
C.2 Questionnaire for the f<strong>in</strong>al driv<strong>in</strong>g simulator experiment (<strong>in</strong> Dutch)....................................... 202<br />
D.1 Detailed results for the first driv<strong>in</strong>g simulator experiment ...................................................... 205<br />
D.2 Detailed results for the f<strong>in</strong>al driv<strong>in</strong>g simulator experiment ..................................................... 207<br />
DRIVING BEHAVIOUR IN UNEXPECTED SITUATIONS: SUMMARY .............................. 209<br />
RIJGEDRAG IN ONVERWACHTE SITUATIES: SAMENVATTING .................................... 215<br />
DANKWOORD ................................................................................................................................. 221<br />
ABOUT THE AUTHOR................................................................................................................... 225<br />
TRAIL THESIS SERIES.................................................................................................................. 227
iv <strong>Driv<strong>in</strong>g</strong> <strong>Behaviour</strong> <strong>in</strong> <strong>Unexpected</strong> <strong>Situations</strong>
Chapter 1<br />
Introduction<br />
<strong>Driv<strong>in</strong>g</strong> <strong>in</strong> urban areas can be challeng<strong>in</strong>g for drivers, especially when they are engaged <strong>in</strong><br />
tasks outside their primary task of driv<strong>in</strong>g. The studies described <strong>in</strong> this thesis are concerned<br />
with drivers’ responses to safety-critical situations <strong>in</strong> these demand<strong>in</strong>g circumstances. The<br />
thesis relates switch<strong>in</strong>g from normal driv<strong>in</strong>g to compensat<strong>in</strong>g for a safety-critical event to the<br />
hierarchical model of the driv<strong>in</strong>g task, which was first presented by Michon <strong>in</strong> 1971. The<br />
current chapter describes the context of the research performed, po<strong>in</strong>ts out the relevance of<br />
the results <strong>in</strong> the light of exist<strong>in</strong>g theories and gives an outl<strong>in</strong>e of the rema<strong>in</strong>der of this thesis.<br />
1
2 <strong>Driv<strong>in</strong>g</strong> <strong>Behaviour</strong> <strong>in</strong> <strong>Unexpected</strong> <strong>Situations</strong>
Chapter 1 - Introduction 3<br />
1.1 Context<br />
S<br />
<strong>in</strong>ce cars were first <strong>in</strong>troduced, the number of vehicles on the road has dramatically<br />
<strong>in</strong>creased. In 1985 less than 4.5 million vehicles were registered <strong>in</strong> the Netherlands. By<br />
the beg<strong>in</strong>n<strong>in</strong>g of 2010 this number had risen to 7.6 million (CBS, 2010). With this<br />
grow<strong>in</strong>g number of vehicles on the road and the correspond<strong>in</strong>g <strong>in</strong>crease <strong>in</strong> vehicle <strong>in</strong>teraction,<br />
traffic safety has become an issue of grow<strong>in</strong>g concern. In addition to this concern with safety,<br />
we also want our transport system to be efficient, reliable and susta<strong>in</strong>able as well as hav<strong>in</strong>g a<br />
high throughput and mak<strong>in</strong>g both our cities and rural areas accessible. Whereas these<br />
characteristics may sometimes re<strong>in</strong>force each other, at other times they compete for policy<br />
priority.<br />
While researchers, governments and others concerned with transport systems are fac<strong>in</strong>g the<br />
challenge of deal<strong>in</strong>g with conflict<strong>in</strong>g goals and assign<strong>in</strong>g priority to different aims, so do the<br />
actual people driv<strong>in</strong>g the cars that make up the system. They can even have conflict<strong>in</strong>g roles<br />
to play while driv<strong>in</strong>g. For <strong>in</strong>stance, is a mother with a cry<strong>in</strong>g baby <strong>in</strong> the back seat of her car a<br />
driver, or firstly a mom? Is the man with a sudden heart attack a driver, or primarily a patient?<br />
And the entrepreneur who is on his way to a crucial meet<strong>in</strong>g on a huge merger, what is his<br />
primary role? An <strong>in</strong>terest<strong>in</strong>g discussion on a number of such philosophical questions related<br />
to drivers’ roles and responsibilities is presented by Hancock, Mouloua and Senders (2008).<br />
With <strong>in</strong>novation and technology advanc<strong>in</strong>g, a variety of Advanced Driver Assistance (ADA)<br />
Systems, such as collision avoidance systems, congestion assistants or curve speed warn<strong>in</strong>g<br />
systems, have been developed to assist <strong>in</strong> perform<strong>in</strong>g the complex driv<strong>in</strong>g task. Until these<br />
ADA Systems have developed <strong>in</strong>to fully automated Autonomous <strong>Driv<strong>in</strong>g</strong> Systems, the human<br />
driver rema<strong>in</strong>s the determ<strong>in</strong><strong>in</strong>g element <strong>in</strong> transport systems and with that an important topic<br />
<strong>in</strong> traffic research.<br />
As early as 1962 Sir Frederik Bartlett predicted that the <strong>in</strong>creas<strong>in</strong>g <strong>in</strong>fluence of Information<br />
Technology and development <strong>in</strong> human skills would greatly change our daily lives (Bartlett,<br />
1962). More recently, Brookhuis (2008) asserted that <strong>in</strong> the com<strong>in</strong>g years the <strong>in</strong>crease <strong>in</strong><br />
<strong>in</strong>formation availability will <strong>in</strong>creas<strong>in</strong>gly dom<strong>in</strong>ate and change our world, especially so <strong>in</strong> the<br />
transport system (Brookhuis, 2008). A thorough study of human drivers and the peculiarities<br />
of their driv<strong>in</strong>g behaviour is needed <strong>in</strong> support of further developments. This thesis focuses on<br />
a part of such a study. That is, the way <strong>in</strong> which drivers react to unexpected and risky<br />
situations and how various characteristics of the driver and the environment <strong>in</strong>fluence such<br />
reactions.<br />
This thesis is focused on the subject of driv<strong>in</strong>g behaviour and its l<strong>in</strong>k with traffic safety. For<br />
the purpose of this thesis an urban environment was chosen to study driver behaviour because<br />
of the complexity of the driv<strong>in</strong>g task <strong>in</strong> such an environment. Cities pose numerous<br />
challenges such as high traffic complexity, low air quality, <strong>in</strong>creas<strong>in</strong>g congestion and reduced<br />
safety, due to the complexity of the <strong>in</strong>frastructure and the large density and variety of road<br />
users and their vary<strong>in</strong>g speeds.<br />
Over the last few years, the development of ADA Systems has ga<strong>in</strong>ed strong momentum,<br />
partly due to the <strong>in</strong>creased availability of new technologies and the further development of<br />
exist<strong>in</strong>g systems, <strong>in</strong>clud<strong>in</strong>g more sensitive sensors, smaller and more powerful computer
4 <strong>Driv<strong>in</strong>g</strong> <strong>Behaviour</strong> <strong>in</strong> <strong>Unexpected</strong> <strong>Situations</strong><br />
chips and more advanced communication technology. The systems that are currently be<strong>in</strong>g<br />
developed range from fully autonomous to communicat<strong>in</strong>g and cooperat<strong>in</strong>g systems, such as<br />
automated highway systems (for automatically creat<strong>in</strong>g platoons on highways) to navigation<br />
for recreational routes or emissions reduction and warn<strong>in</strong>g systems for obstacles outside the<br />
driver’s direct l<strong>in</strong>e of sight. Whereas the development of ADA Systems is be<strong>in</strong>g pushed by<br />
rapid technological developments, it is very important to look at what the driver actually<br />
needs. Results from different studies <strong>in</strong>dicate that drivers do not always respond <strong>in</strong> a<br />
predictable way to the <strong>in</strong>troduction of new systems <strong>in</strong> their vehicles (e.g., Adell, Várhelyi &<br />
Dalla Fontana, 2011; Dragut<strong>in</strong>ovic, Brookhuis, Hagenzieker & Marchau, 2005). An expert<br />
group of the Organisation for Economic Cooperation and Development def<strong>in</strong>ed behavioural<br />
adaptation as “those behaviours which may occur follow<strong>in</strong>g the <strong>in</strong>troduction of changes to the<br />
road-vehicle-user system and which were not <strong>in</strong>tended by the <strong>in</strong>itiators of the change”<br />
(OECD, 1990, p.23). Drivers have <strong>in</strong>deed been shown to alter parts of their driv<strong>in</strong>g actions <strong>in</strong><br />
response to the changed driv<strong>in</strong>g task. The changes associated with this adaptation depend on<br />
the type of support given, the supported task, and the hierarchical level (strategic, tactical or<br />
operational) at which this task is situated (Saad, 2006). Among the concerns <strong>in</strong> research <strong>in</strong>to<br />
behavioural adaptation are drivers’ limited abilities to take control for the tasks that are not<br />
supported (Saad, 2006). This advocates an <strong>in</strong>tegrated design of ADA Systems. It is important<br />
to look at driver’s needs and normal driv<strong>in</strong>g behaviour to understand how ADA Systems can<br />
make driv<strong>in</strong>g safer, more comfortable and more environmentally friendly.<br />
This thesis studies the execution of the driv<strong>in</strong>g task <strong>in</strong> safety-critical situations <strong>in</strong> an urban<br />
environment. The model of the driv<strong>in</strong>g task that Michon developed <strong>in</strong> 1971 and elaborated<br />
upon <strong>in</strong> 1985 is used as basis for study<strong>in</strong>g and <strong>in</strong>terpret<strong>in</strong>g driv<strong>in</strong>g behaviour. The model<br />
breaks down the driv<strong>in</strong>g task <strong>in</strong>to three hierarchically ordered levels. At the highest level, the<br />
strategic level, the driver plans the trip <strong>in</strong> terms of it<strong>in</strong>erary, time of arrival, etc. One level<br />
below, the tactical level, deals with choices and actions related to the <strong>in</strong>teraction with the road<br />
and other road users, such as keep<strong>in</strong>g distance, tak<strong>in</strong>g a turn and chang<strong>in</strong>g lanes. The lowest<br />
operational level <strong>in</strong>volves the <strong>in</strong>teraction with the vehicle controls and the perception of the<br />
environment. Subtasks such as turn<strong>in</strong>g the steer<strong>in</strong>g wheel, push<strong>in</strong>g the throttle and look<strong>in</strong>g at<br />
a road sign are <strong>in</strong>cluded <strong>in</strong> this operational level. In Michon’s (1971) model the three task<br />
levels are strongly l<strong>in</strong>ked. Choices are made top-down <strong>in</strong> normal driv<strong>in</strong>g behaviour: actions at<br />
a higher level dictate the k<strong>in</strong>d of <strong>in</strong>formation that enters the adjacent lower level, and<br />
determ<strong>in</strong>e if and how the actions at that level should be undertaken.<br />
However, this top-down <strong>in</strong>teraction does not always dictate driv<strong>in</strong>g behaviour. In unexpected<br />
situations a driver sometimes needs to compensate <strong>in</strong> order to return to a safe or desired<br />
situation. Take the example of driv<strong>in</strong>g on a slippery road. In normal, top-down driver<br />
behaviour, the desired speed determ<strong>in</strong>es the angle at which the throttle is pushed downward.<br />
On a slippery road however, the direction of the vehicle might deviate from the desired<br />
direction. The driver has to act quickly to stay on the road, regardless of the it<strong>in</strong>erary, desired<br />
speed and other elements on the strategic level. This compensation behaviour is directed<br />
bottom-up, result<strong>in</strong>g <strong>in</strong> a temporary directional switch <strong>in</strong> task level <strong>in</strong>teraction.<br />
<strong>Driv<strong>in</strong>g</strong> behaviour is determ<strong>in</strong>ed by the characteristics of the driv<strong>in</strong>g task and by a variety of<br />
external factors. One important factor is mental workload. A number of different def<strong>in</strong>itions<br />
of mental workload exist, some of which will be discussed <strong>in</strong> more detail <strong>in</strong> Chapter 2.<br />
Throughout this thesis the def<strong>in</strong>ition as proposed by De Waard (1996) is used. This def<strong>in</strong>ition<br />
reads: “Mental workload is the specification of the amount of <strong>in</strong>formation process<strong>in</strong>g capacity<br />
that is used for task performance”. De Waard (1996) describes how mental workload depends
Chapter 1 - Introduction 5<br />
on the comb<strong>in</strong>ation of task demands (what does the driver need to do), the available<br />
<strong>in</strong>formation process<strong>in</strong>g capacities (how much can the driver handle), and the effort <strong>in</strong>vested<br />
(how much energy is the driver will<strong>in</strong>g to <strong>in</strong>vest <strong>in</strong> task performance). Mental workload is<br />
highly related to driv<strong>in</strong>g behaviour and the driv<strong>in</strong>g task through these aspects. Firstly, task<br />
demands can <strong>in</strong>crease or decrease accord<strong>in</strong>g to the situation and the pursued goals, and this<br />
change can even present itself <strong>in</strong> a time frame of milliseconds. Or as others have put it:<br />
“<strong>Driv<strong>in</strong>g</strong> is hours and hours of boredom <strong>in</strong>termixed with moments of terror” (Boudreau,<br />
2009). Although this statement is a somewhat exaggerated representation of reality, it does<br />
illustrate how quickly task demands can change. Dur<strong>in</strong>g long stretches of time, driv<strong>in</strong>g can<br />
consist of sequences of well-learned actions that can be performed almost automatically. But<br />
these situations can suddenly, sometimes without warn<strong>in</strong>g, turn <strong>in</strong>to events that require the<br />
driver’s full attention and quick compensation <strong>in</strong> order to avoid serious conflicts or even<br />
accidents. Whereas the latter situation can br<strong>in</strong>g about a high level of mental workload,<br />
automatically performed action patterns may have very low task demands, lead<strong>in</strong>g to<br />
situations <strong>in</strong> which it may be difficult to susta<strong>in</strong> a high level of attention. This is related to the<br />
second aspect determ<strong>in</strong><strong>in</strong>g mental workload: human <strong>in</strong>formation process<strong>in</strong>g capacities. These<br />
capacities are different accord<strong>in</strong>g to the driver’s state. For example, after a good night of sleep<br />
drivers are generally more alert with the capability of handl<strong>in</strong>g a higher task load than after a<br />
night of danc<strong>in</strong>g and dr<strong>in</strong>k<strong>in</strong>g. F<strong>in</strong>ally, the driver can <strong>in</strong>vest more energy <strong>in</strong> perform<strong>in</strong>g the<br />
task at hand, lead<strong>in</strong>g to a susta<strong>in</strong>ed task performance at the cost of <strong>in</strong>creased workload.<br />
1.2 Research questions and scope<br />
This thesis deals with driv<strong>in</strong>g <strong>in</strong> unexpected, safety-critical situations and the related possible<br />
switch from normal top-down <strong>in</strong>fluence to bottom-up <strong>in</strong>fluence between driv<strong>in</strong>g task levels. It<br />
also exam<strong>in</strong>es whether and how the severity of the situation <strong>in</strong>fluences this directional change<br />
<strong>in</strong> task level <strong>in</strong>teraction. Does a more severe situation for <strong>in</strong>stance lead to faster, stronger or<br />
more prolonged compensational behaviour? This research furthermore aims to determ<strong>in</strong>e to<br />
what extent the hierarchical model of the driv<strong>in</strong>g task (Michon, 1971, 1985) could also be<br />
used as a predictive tool, describ<strong>in</strong>g the actions of drivers <strong>in</strong> specific situations. For practical<br />
reasons, related to the discrepancy between study<strong>in</strong>g naturalistic choices regard<strong>in</strong>g trips goals,<br />
trip mode and route on the one hand, and controll<strong>in</strong>g or even repeat<strong>in</strong>g certa<strong>in</strong> safety-critical<br />
events that may occur dur<strong>in</strong>g driv<strong>in</strong>g on the other hand, we focus only on the operational and<br />
tactical levels of Michon’s model. Chapters 3 and 4 will elaborate on these decisions<br />
regard<strong>in</strong>g research tools and experimental setup.<br />
Moreover, the <strong>in</strong>fluence of elevated mental workload on driv<strong>in</strong>g behaviour <strong>in</strong> these<br />
unexpected situations is exam<strong>in</strong>ed. Will an <strong>in</strong>crease <strong>in</strong> mental workload br<strong>in</strong>g along a more<br />
<strong>in</strong>tense or a longer-last<strong>in</strong>g reaction of the compensatory behaviour after such an event? Or<br />
could there be a threshold above which br<strong>in</strong>g<strong>in</strong>g the situation to a safe end demands so much<br />
attention that attentive compensation decreases? The effects of drivers’ basic demographic<br />
characteristics (age, gender) and driv<strong>in</strong>g experience on the aforementioned results are also<br />
exam<strong>in</strong>ed.<br />
F<strong>in</strong>ally, some ambiguity sometimes occurs <strong>in</strong> studies focuss<strong>in</strong>g on mental workload and/ or<br />
driver distraction, two dist<strong>in</strong>ct concepts that appear to have some resembl<strong>in</strong>g features. This<br />
thesis describes the similarities and dist<strong>in</strong>ctions between the two concepts <strong>in</strong> an attempt to<br />
clarify the relationship between driver distraction and mental workload.
6 <strong>Driv<strong>in</strong>g</strong> <strong>Behaviour</strong> <strong>in</strong> <strong>Unexpected</strong> <strong>Situations</strong><br />
The hypotheses which are at the basis of the studies described <strong>in</strong> this thesis are derived from<br />
the hierarchical model of the driv<strong>in</strong>g task as was first described by Michon (1971), and later<br />
adapted by the same author (Michon, 1985). This hierarchical model states that the driv<strong>in</strong>g<br />
task is comprised of multiple subtasks which can be categorized <strong>in</strong>to three task levels. When a<br />
journey is planned and executed, drivers execute subtasks of driv<strong>in</strong>g at the different task<br />
levels from the upper, strategic level, through the middle tactical level down to the operational<br />
level, successively. Figure 1.1 shows this hierarchical <strong>in</strong>teraction, which is presumed to take<br />
place <strong>in</strong> normal driv<strong>in</strong>g.<br />
Figure 1.1 Hierarchical model of the driv<strong>in</strong>g task, as proposed by Michon (1971); the<br />
three levels of the driv<strong>in</strong>g task are hierarchically ordered with top-down level<br />
<strong>in</strong>teractions<br />
In 1985, Michon hypothesized that not only the top-down <strong>in</strong>teraction between the<br />
hierarchically ordered levels could be present <strong>in</strong> driv<strong>in</strong>g, but that bottom-up <strong>in</strong>fluence might<br />
also be possible, as “goals may occasionally be adapted to fit the outcome of certa<strong>in</strong><br />
maneuvers” (Michon, 1985, p. 490). In other words, bottom-up <strong>in</strong>fluence between task levels<br />
is an option <strong>in</strong> unexpected situations requir<strong>in</strong>g compensation. Such situations could for<br />
<strong>in</strong>stance be: driv<strong>in</strong>g on a slippery road (compensation needed on operational level); a road<br />
block (compensation needed on tactical level); or an unexpected manoeuvre from another<br />
road user (compensation needed on either the tactical or the operational level, depend<strong>in</strong>g on<br />
the type of compensation needed). Figure 1.2 shows the hierarchical model with the extension<br />
of bottom-up <strong>in</strong>teraction between the three levels. It should be noted here that task levels also
Chapter 1 - Introduction 7<br />
have <strong>in</strong>ternal feedback loops: tasks at the three levels are cont<strong>in</strong>uously adjusted and controlled<br />
accord<strong>in</strong>g to cues from the environment.<br />
Figure 1.2 Directional change from top-down to bottom-up <strong>in</strong>fluence between the<br />
operational and tactical level of the driv<strong>in</strong>g task - it is presumed that this directional<br />
change happens <strong>in</strong> unexpected situations requir<strong>in</strong>g compensation (adapted from<br />
Michon, 1985)<br />
The research described here aims to <strong>in</strong>crease the understand<strong>in</strong>g of driv<strong>in</strong>g <strong>in</strong> safety-critical<br />
situations <strong>in</strong> an urban environment. The research questions are as follows:<br />
How do drivers respond to unexpected, safety-critical events while driv<strong>in</strong>g <strong>in</strong> an urban<br />
environment?<br />
How do the results relate to the framework presented by the hierarchical model of the<br />
driv<strong>in</strong>g task (Michon, 1971, 1985)?<br />
To what extent does the urgency of the event <strong>in</strong>fluence this response?<br />
To what extent does the level of mental workload exert an <strong>in</strong>fluence on this reaction?<br />
To what extent do drivers’ basic demographic characteristics, such as gender or age,<br />
<strong>in</strong>fluence this reaction?<br />
What is the relationship between the f<strong>in</strong>d<strong>in</strong>gs <strong>in</strong> our studies and previous studies done <strong>in</strong>to<br />
driver distraction, mental workload, risk handl<strong>in</strong>g and other human factors <strong>in</strong> driv<strong>in</strong>g?<br />
What is the relationship between mental workload and driver distraction?<br />
Which recommendations can be made for the development of safe ADA Systems?
8 <strong>Driv<strong>in</strong>g</strong> <strong>Behaviour</strong> <strong>in</strong> <strong>Unexpected</strong> <strong>Situations</strong><br />
As with any other study, the scope of this research is limited:<br />
Only passenger cars were studied. Passenger cars make up for the largest part of the traffic<br />
population, with 7.6 million Dutch passenger cars (CBS, 2010) account<strong>in</strong>g for almost<br />
75% of all vehicle kilometres driven on Dutch roads <strong>in</strong> 2010 (KiM, 2011). Furthermore,<br />
passenger cars were <strong>in</strong>volved <strong>in</strong> 81% of the accidents on Dutch roads <strong>in</strong> 2005 (SWOV,<br />
2010).<br />
The scope of our research is furthermore limited by the fact that the drivers were not<br />
supported by any support system while driv<strong>in</strong>g. We focus on unsupported driv<strong>in</strong>g<br />
behaviour, and will discuss the implications of the f<strong>in</strong>d<strong>in</strong>gs for the development of driver<br />
support systems at the conclusion of this work.<br />
The focus of the research is on driv<strong>in</strong>g at urban <strong>in</strong>tersections. These are complex<br />
situations which are very demand<strong>in</strong>g for drivers, and at which all three levels of the<br />
driv<strong>in</strong>g task are relevant simultaneously (see also Sections 2.1 and 2.2.1). We imposed a<br />
simplified set of traffic rules for the experimental sett<strong>in</strong>g, <strong>in</strong>clud<strong>in</strong>g a speed limit of 50<br />
km/h for all urban areas and right of way for traffic com<strong>in</strong>g from the right.<br />
We studied driv<strong>in</strong>g behaviour of experienced, regular drivers. This excludes drivers who<br />
had their driver’s licence for less than five years (novice drivers), drivers over 60 years of<br />
age (elderly drivers), and drivers without an appropriate share of on-road experience<br />
(<strong>in</strong>experienced drivers). These groups have their own characteristics, challenges and<br />
behaviours, and <strong>in</strong>clud<strong>in</strong>g these characteristics does not necessarily comply with<br />
answer<strong>in</strong>g our research questions.<br />
1.3 Scientific and societal relevance<br />
The research presented <strong>in</strong> this thesis contributes to the exist<strong>in</strong>g knowledge of driv<strong>in</strong>g<br />
behaviour <strong>in</strong> risky situations, and the <strong>in</strong>fluence of mental workload and event circumstances.<br />
The ma<strong>in</strong> contributions can be summarized as follows.<br />
1.3.1 Scientific relevance<br />
This thesis describes driv<strong>in</strong>g behaviour <strong>in</strong> risky situations <strong>in</strong> urban environments. It relates<br />
drivers’ behaviour <strong>in</strong> these situations to the hierarchical model of the driv<strong>in</strong>g task by Michon<br />
(1971, 1985). This l<strong>in</strong>k between (theoretical) task description and (practical) task execution<br />
gives <strong>in</strong>sight <strong>in</strong>to both theoretical and actual goal management of drivers, and <strong>in</strong>to task<br />
execution <strong>in</strong> different circumstances.<br />
The hierarchical model of the driv<strong>in</strong>g task has been presented a few decades ago and has been<br />
adopted widely among human factors researchers and modellers s<strong>in</strong>ce to represent the driv<strong>in</strong>g<br />
task (e.g., Bekiaris, Amiditis & Panou, 2003; Fuller, 2005; Van der Molen & Botticher, 1988;<br />
Ranney, 1994). Michon (1985) proposed to use the model as a framework for a<br />
comprehensive driver model that would <strong>in</strong>corporate cognition through knowledge and rules<br />
and would be capable of deal<strong>in</strong>g with a wide variety of realistic, complex situations (Michon,<br />
1985). Few researchers have tried to test the implications of this framework for human task<br />
execution <strong>in</strong> real driv<strong>in</strong>g situations. Specifically the supposed switch between top-down task<br />
level <strong>in</strong>teractions to bottom-up <strong>in</strong>teractions has rema<strong>in</strong>ed underexposed <strong>in</strong> both literature and<br />
experimental sett<strong>in</strong>gs. Some researchers suggest that there is no such th<strong>in</strong>g as a directional<br />
switch between top-down and bottom-up <strong>in</strong>teraction but more so a dist<strong>in</strong>ction between
Chapter 1 - Introduction 9<br />
feedback and feed-forward control, and that goals and <strong>in</strong>tentions are cont<strong>in</strong>uously revised<br />
(e.g., Hollnagel & Woods, 2005). However, the overall framework and the proposed switch<br />
between the two directions of <strong>in</strong>fluence between task levels has, to our knowledge, not been<br />
put to the test of actual driv<strong>in</strong>g behaviour.<br />
On the one hand, this thesis tries to explore the boundaries of the possible applications of the<br />
hierarchical model of the driv<strong>in</strong>g task. On the other hand, it also aims to broaden the<br />
knowledge of driv<strong>in</strong>g behaviour and the ways <strong>in</strong> which different circumstances <strong>in</strong>fluence goal<br />
management <strong>in</strong> drivers.<br />
The research specifically focuses on driv<strong>in</strong>g at urban <strong>in</strong>tersections. <strong>Driv<strong>in</strong>g</strong> <strong>in</strong> this demand<strong>in</strong>g<br />
and complex traffic situation is different from highway driv<strong>in</strong>g <strong>in</strong> a number of ways. First,<br />
multiple task levels are relevant simultaneously, lead<strong>in</strong>g to a complex situation of compet<strong>in</strong>g<br />
tasks and goals. Second, certa<strong>in</strong> aspects of urban <strong>in</strong>frastructure are more complex than <strong>in</strong><br />
highway situations, add<strong>in</strong>g to task demands. For <strong>in</strong>stance, there are <strong>in</strong>tersections, at which<br />
different roads cross each other, different traffic lanes for different types of road users (e.g.,<br />
bike lanes, bus lanes), and the many side streets lead to more options for route choice than on<br />
most highways. And f<strong>in</strong>ally, rural roads and especially motorways carry rather homogenous<br />
traffic flows consist<strong>in</strong>g ma<strong>in</strong>ly of motor vehicles. However, urban roads have a large variety<br />
of road users such as cars, trucks, cyclists, motorcyclists, and pedestrians, all shar<strong>in</strong>g the road<br />
especially at <strong>in</strong>tersections. This mixed equipage and mixed user group demands focussed<br />
attention, anticipation and a high level of situation awareness. To add to these demand<strong>in</strong>g<br />
circumstances, we presented safety-critical situations to drivers, and measured their driv<strong>in</strong>g<br />
performance and behavioural reactions to these situations. Insight <strong>in</strong>to drivers’ reactions <strong>in</strong><br />
these especially demand<strong>in</strong>g situations gives <strong>in</strong>sight <strong>in</strong>to task prioritization, goal management,<br />
effort <strong>in</strong>vestment, and risk handl<strong>in</strong>g. These are all abstract but highly relevant concepts, which<br />
need to be considered when study<strong>in</strong>g driv<strong>in</strong>g behaviour. The results from the present study<br />
provide new <strong>in</strong>sights <strong>in</strong>to task prioritization <strong>in</strong> demand<strong>in</strong>g circumstances. They furthermore<br />
add to the exist<strong>in</strong>g theories of risk handl<strong>in</strong>g by determ<strong>in</strong><strong>in</strong>g how drivers respond to chang<strong>in</strong>g<br />
risk levels <strong>in</strong> multi-task conditions.<br />
Moreover, the thesis reflects on the relationship between driver distraction and mental<br />
workload. These are two constructs that are closely related, but that are affected by different<br />
aspects of the driv<strong>in</strong>g situation and may also have different effects on driv<strong>in</strong>g performance.<br />
S<strong>in</strong>ce their effects on driv<strong>in</strong>g performance are potentially very different, it is important to<br />
know what to measure when, and how to expla<strong>in</strong> the effects found. We contribute to this<br />
debate with a discussion of the differences and similarities between the two concepts of driver<br />
distraction and mental workload. The thesis <strong>in</strong>troduces the concept of latent driver distraction,<br />
a form of driver distraction that does not materialize <strong>in</strong> measurably unsafe driv<strong>in</strong>g behaviour,<br />
but that does impair be<strong>in</strong>g able to respond adequately to upcom<strong>in</strong>g safety-critical situations. It<br />
furthermore br<strong>in</strong>gs up the practice that evidence for <strong>in</strong>creased mental workload is often used<br />
as a direct <strong>in</strong>dication of all types of driver distraction. However, measurements should focus<br />
on the type of driver distraction that is measured, <strong>in</strong>stead of translat<strong>in</strong>g an <strong>in</strong>crease <strong>in</strong> one of<br />
the constructs <strong>in</strong>to a supposed <strong>in</strong>crease <strong>in</strong> the other construct. Therefore, the relationship<br />
between mental workload and driver distraction is also made explicit.<br />
F<strong>in</strong>ally, the research presented <strong>in</strong> this thesis is related to the human centred design of<br />
Advanced Driver Assistance (ADA) Systems. ADA Systems represent a promis<strong>in</strong>g way to<br />
support drivers <strong>in</strong> their task, and might br<strong>in</strong>g about important changes <strong>in</strong> the approach to<br />
traffic safety issues. They can furthermore relieve the driver of parts of the relevant tasks from
10 <strong>Driv<strong>in</strong>g</strong> <strong>Behaviour</strong> <strong>in</strong> <strong>Unexpected</strong> <strong>Situations</strong><br />
the driver, <strong>in</strong>creas<strong>in</strong>g comfort or safety. The development process of ADA Systems can have<br />
different start<strong>in</strong>g po<strong>in</strong>ts. One could start from available technology, from what drivers want,<br />
or from what drivers need. This study focuses on the latter start<strong>in</strong>g po<strong>in</strong>t, the human-centred,<br />
behaviour based design of ADA Systems. Such behaviour based design not only entails<br />
comply<strong>in</strong>g with ergonomic design pr<strong>in</strong>ciples, it also means keep<strong>in</strong>g track of the relevant<br />
issues that drivers encounter while driv<strong>in</strong>g, and thus of driver needs. This study seeks to<br />
bridge the knowledge of cognitive and psychological processes and technological<br />
advancements. Before truly human-centred design is a viable option, more knowledge and<br />
understand<strong>in</strong>g of driver needs and the effects of cognitive aspects of driv<strong>in</strong>g on task<br />
performance is needed. This thesis adds new knowledge to this develop<strong>in</strong>g field of research<br />
by giv<strong>in</strong>g <strong>in</strong>sight <strong>in</strong>to task prioritization, driver distraction effects and risk handl<strong>in</strong>g <strong>in</strong><br />
situations when ADA Systems are most needed: safety-critical driv<strong>in</strong>g situations.<br />
1.3.2 Societal relevance<br />
This thesis adds new knowledge to human factors research, specifically on the topic of driver<br />
distraction and mental workload. In 2004 nearly 600 serious <strong>in</strong>juries or fatalities could have<br />
been prevented on Dutch roads if the traffic participants <strong>in</strong>volved would not have used their<br />
mobile phones while driv<strong>in</strong>g (Dragut<strong>in</strong>ovic & Twisk, 2005). This shows the relative risk of<br />
distracted driv<strong>in</strong>g. Understand<strong>in</strong>g and quantify<strong>in</strong>g the risks <strong>in</strong>volved with distracted driv<strong>in</strong>g<br />
are important steps <strong>in</strong> counter<strong>in</strong>g these risks.<br />
Furthermore, the driv<strong>in</strong>g simulator studies were concerned with driv<strong>in</strong>g behaviour <strong>in</strong> risky<br />
situations. Normal driv<strong>in</strong>g situations can easily turn <strong>in</strong>to conflict situations, as multiple actors<br />
have multiple, possibly conflict<strong>in</strong>g goals <strong>in</strong> difficult situations <strong>in</strong> which task demands often<br />
fluctuate. And as easily as normal situations can turn <strong>in</strong>to conflicts, so easily can these<br />
conflicts also turn <strong>in</strong>to accidents, result<strong>in</strong>g <strong>in</strong> damage, <strong>in</strong>jury or even death. Knowledge about<br />
ways to counter drivers’ unsafe reactions to conflict situations can help prevent the occurrence<br />
of those situations which might turn <strong>in</strong>to accidents.<br />
Moreover, this thesis focuses specifically on urban driv<strong>in</strong>g behaviour. Not only did more than<br />
30% of all traffic accidents <strong>in</strong> the Netherlands <strong>in</strong> 2010 lead<strong>in</strong>g to <strong>in</strong>juries occur at urban<br />
<strong>in</strong>tersections (SWOV, 2011), but these <strong>in</strong>tersections are also the bottlenecks of the urban road<br />
network when focus<strong>in</strong>g on capacity and traffic flow. Congestion <strong>in</strong> turn leads to <strong>in</strong>creased<br />
emissions and reduces the local air quality. Knowledge of driv<strong>in</strong>g behaviour <strong>in</strong> these<br />
situations may be a first step <strong>in</strong> counter<strong>in</strong>g these challenges.<br />
F<strong>in</strong>ally, the development of ADA Systems has burgeoned over the past years. ADA Systems<br />
can support the driver <strong>in</strong> demand<strong>in</strong>g situations and can <strong>in</strong>crease driver comfort, traffic safety<br />
or reduce congestion or emissions. Based on our results, recommendations for the<br />
development of a new promis<strong>in</strong>g direction for ADA Systems are made. A new type of system<br />
could monitor the driver’s state, ma<strong>in</strong>ta<strong>in</strong> safe marg<strong>in</strong>s around the vehicle, and adaptively<br />
change these marg<strong>in</strong>s based on the driver’s state. This proposed group of systems could have<br />
the generic name DAISy (Distraction Avoidance Integrated System). With the guidel<strong>in</strong>es <strong>in</strong><br />
this thesis taken <strong>in</strong>to account, DAISy could adaptively assist the driver <strong>in</strong> one of the most<br />
demand<strong>in</strong>g driv<strong>in</strong>g situations: distracted driv<strong>in</strong>g <strong>in</strong> an urban sett<strong>in</strong>g.
Chapter 1 - Introduction 11<br />
1.4 Outl<strong>in</strong>e of the thesis<br />
This thesis is structured such that Chapter 2 describes the theoretical framework of the<br />
research. The topics discussed <strong>in</strong> this theoretical framework <strong>in</strong>clude the structure of the<br />
driv<strong>in</strong>g task, models of risk handl<strong>in</strong>g, situation awareness, mental workload and distraction<br />
dur<strong>in</strong>g driv<strong>in</strong>g. The structure of the driv<strong>in</strong>g task is used as a frame for the studies described <strong>in</strong><br />
this thesis. We specifically focus on the change from top-down <strong>in</strong>teraction to bottom-up<br />
<strong>in</strong>teraction between the levels of the driv<strong>in</strong>g task. Mental workload, driver distraction and<br />
situation awareness are topics that are all closely related to multi-task<strong>in</strong>g, and as driv<strong>in</strong>g is a<br />
multi-task<strong>in</strong>g activity by nature, a number of sections elaborate this aspect of driv<strong>in</strong>g. The<br />
f<strong>in</strong>al section of Chapter 2 describes different aspects of ADA Systems for urban <strong>in</strong>tersection<br />
driv<strong>in</strong>g.<br />
Chapter 3 gives an overview of research tools that may be used to study driv<strong>in</strong>g behaviour.<br />
Among the tools described are driv<strong>in</strong>g simulators, Field Operational Tests (FOT’s),<br />
questionnaires, and measurements of mental workload dur<strong>in</strong>g driv<strong>in</strong>g. The f<strong>in</strong>al section of<br />
Chapter 3 describes the research tools that we used dur<strong>in</strong>g our studies.<br />
The first experiment, conducted to provide more <strong>in</strong>sight <strong>in</strong>to the directions of <strong>in</strong>teraction<br />
between the operational and tactical levels of the driv<strong>in</strong>g task, is described <strong>in</strong> Chapter 4. This<br />
experiment was conducted <strong>in</strong> a fixed-base driv<strong>in</strong>g simulator, and studied drivers’ reactions to<br />
unexpected and safety-critical situations. Chapter 4 describes the aim, setup, results and<br />
conclusions from this experiment. The chapter is concluded with the formulation of four<br />
hypotheses that have been used for the f<strong>in</strong>al experiment.<br />
This f<strong>in</strong>al experiment is described <strong>in</strong> Chapter 5. The four hypotheses that were formulated <strong>in</strong><br />
Chapter 4 are tested aga<strong>in</strong>st the data from the f<strong>in</strong>al experiment, and the generalizability and<br />
scope of the results are briefly discussed.<br />
Chapter 6 discusses the complete set of results and places them <strong>in</strong> the perspective of earlier<br />
research and exist<strong>in</strong>g theories of risk handl<strong>in</strong>g, task prioritization and driv<strong>in</strong>g <strong>in</strong> dual-task<br />
conditions. The f<strong>in</strong>d<strong>in</strong>gs of both experiments are compared and the most prom<strong>in</strong>ent<br />
differences expla<strong>in</strong>ed. Furthermore, the implications for the human-centred design of ADA<br />
Systems are discussed with respect to (avoid<strong>in</strong>g) distracted driv<strong>in</strong>g.<br />
F<strong>in</strong>ally, Chapter 7 concludes this thesis with an overview of conclusions and a number of<br />
recommendations for further research.
12 <strong>Driv<strong>in</strong>g</strong> <strong>Behaviour</strong> <strong>in</strong> <strong>Unexpected</strong> <strong>Situations</strong>
Chapter 2<br />
Theoretical framework<br />
Car driv<strong>in</strong>g is a complex task, comprised of many different subtasks which simultaneously<br />
demand attention from drivers. Besides gett<strong>in</strong>g safely from one location to another, drivers<br />
also want to accomplish other goals, such as feel<strong>in</strong>g comfortable and be<strong>in</strong>g time-efficient, and<br />
these goals are not always compatible. Among the most challeng<strong>in</strong>g driv<strong>in</strong>g situations are<br />
urban <strong>in</strong>tersections, at which different subtasks have to be executed simultaneously while<br />
<strong>in</strong>teract<strong>in</strong>g with different types of road users. In order to develop possible solutions for the<br />
many challenges that drivers face, an understand<strong>in</strong>g of the driv<strong>in</strong>g task and the <strong>in</strong>fluence of<br />
the most prom<strong>in</strong>ent <strong>in</strong>ternal and external factors is needed. This chapter describes the<br />
different factors <strong>in</strong>fluenc<strong>in</strong>g driv<strong>in</strong>g behaviour and performance, and the driver models which<br />
have been developed until now. It concludes by giv<strong>in</strong>g an overview of Advanced Driver<br />
Assistance (ADA) Systems with a specific focus on urban <strong>in</strong>tersection driv<strong>in</strong>g.<br />
13
14 <strong>Driv<strong>in</strong>g</strong> <strong>Behaviour</strong> <strong>in</strong> <strong>Unexpected</strong> <strong>Situations</strong>
Chapter 2 - Theoretical Framework 15<br />
2.1 Complexity of the driv<strong>in</strong>g task<br />
riv<strong>in</strong>g a car is a complex and safety-critical task (Groeger, 2000). The complexity of<br />
the driv<strong>in</strong>g task has three ma<strong>in</strong> causes. First of all, driv<strong>in</strong>g requires the driver to use a<br />
number of functional abilities simultaneously (Peters & Nillson, 2007): perceptual<br />
abilities, cognitive abilities, and motor abilities. Drivers need to see, hear and feel what’s<br />
go<strong>in</strong>g on <strong>in</strong> and around the vehicle, use their decision mak<strong>in</strong>g skills, attention and memory to<br />
make appropriate and timely decisions and supervise the driv<strong>in</strong>g task, and touch, press and<br />
control the vehicle’s physical <strong>in</strong>terfaces. Although most of these actions can be tra<strong>in</strong>ed <strong>in</strong>to<br />
well-developed skills, they still have to be performed simultaneously 1 D<br />
and <strong>in</strong> a timely and<br />
efficient manner. The match between the driver’s capabilities and the demands of the driv<strong>in</strong>g<br />
task largely determ<strong>in</strong>es the level of safety of the result<strong>in</strong>g behaviour. This is described by<br />
Fuller (2000, 2005) as the task-capability <strong>in</strong>terface, which will be elaborated upon later <strong>in</strong> this<br />
chapter. Second, drivers have to be able to adapt to quickly chang<strong>in</strong>g circumstances. Because<br />
situations can turn from safe to safety-critical with<strong>in</strong> (fractions of) seconds, either because of<br />
a personal error, or due to a situation occurr<strong>in</strong>g outside the driver’s control (e.g., Klauer,<br />
D<strong>in</strong>gus, Neale, Sudweeks & Ramsey, 2006; Staubach, 2009), drivers constantly need to be<br />
alert and ready to respond to chang<strong>in</strong>g situations. This means that the demands placed on the<br />
driver can change from very low to very high (and back) with<strong>in</strong> short time periods. Vary<strong>in</strong>g<br />
levels of alertness can have an <strong>in</strong>fluence on reaction times and the ability to assess the<br />
situation (e.g., Klauer et al, 2006; Mohebbi, Gray & Tan, 2009; Philip, Taillard, Quera-Salva,<br />
Bioulac & Åkerstedt, 1999) and therefore on the ability to make safe and efficient decisions <strong>in</strong><br />
real-time. And third, different goals underlie the driv<strong>in</strong>g task, and these goals can vary<br />
between drives, between <strong>in</strong>dividual drivers, and with<strong>in</strong> <strong>in</strong>dividual drivers over time. The ma<strong>in</strong><br />
goal for driv<strong>in</strong>g is generally gett<strong>in</strong>g from one location to another <strong>in</strong> a safe manner with<strong>in</strong><br />
given time constra<strong>in</strong>ts. In addition, other goals such as feel<strong>in</strong>g comfortable, enjoy<strong>in</strong>g the<br />
landscape, and be<strong>in</strong>g cost-efficient can be important to drivers (e.g., Rumar, 1990; Cnossen,<br />
Meijman & Rothengatter, 2004). Dur<strong>in</strong>g driv<strong>in</strong>g, these goals have to be monitored and<br />
balanced <strong>in</strong> real-time, although different goals may conflict or require different actions. Goal<br />
management is therefore an important but complicat<strong>in</strong>g aspect of the driv<strong>in</strong>g task.<br />
Besides these aspects which complicate the driv<strong>in</strong>g task, characteristics of <strong>in</strong>dividual drivers<br />
also play an important role <strong>in</strong> driv<strong>in</strong>g. <strong>Driv<strong>in</strong>g</strong> style, age and gender may <strong>in</strong>fluence how<br />
drivers perceive their world, their task and the risk of their actions. This leads to many<br />
differences between and with<strong>in</strong> drivers and driv<strong>in</strong>g situations, complicat<strong>in</strong>g studies of driv<strong>in</strong>g<br />
behaviour. Hole (2007) gives an overview of studies report<strong>in</strong>g differences between men and<br />
women and between different age groups for driv<strong>in</strong>g.<br />
One situation <strong>in</strong> particular is both complex and safety-critical for drivers: urban <strong>in</strong>tersections.<br />
This thesis focuses on driv<strong>in</strong>g behaviour <strong>in</strong> these demand<strong>in</strong>g situations. Not only did more<br />
than 30% of all Dutch <strong>in</strong>jury traffic accidents <strong>in</strong> the year 2010 occur at urban <strong>in</strong>tersections<br />
(SWOV, 2011), but these <strong>in</strong>tersections are also the bottlenecks of the urban road network<br />
1 Although there is <strong>in</strong>deed a simultaneous demand for attention from multiple subtasks when driv<strong>in</strong>g <strong>in</strong><br />
demand<strong>in</strong>g situations, people actually switch the focus of their attention between different tasks <strong>in</strong> the practice of<br />
multi-task<strong>in</strong>g. Delbridge def<strong>in</strong>es multi-task<strong>in</strong>g as perform<strong>in</strong>g “multiple task goals <strong>in</strong> the same time period by<br />
engag<strong>in</strong>g <strong>in</strong> frequent switches between <strong>in</strong>dividual tasks” (Delbridge, 2000). Obviously, certa<strong>in</strong> tasks do not<br />
require cont<strong>in</strong>uous active attention, specifically rout<strong>in</strong>e tasks where are automatized, such as stand<strong>in</strong>g or<br />
walk<strong>in</strong>g. A high number of control level tasks is often automatized <strong>in</strong> experienced drivers. Section 2.2 elaborates<br />
on driv<strong>in</strong>g task automation and driv<strong>in</strong>g experience.
16 <strong>Driv<strong>in</strong>g</strong> <strong>Behaviour</strong> <strong>in</strong> <strong>Unexpected</strong> <strong>Situations</strong><br />
when focus<strong>in</strong>g on capacity and traffic flow. Congestion <strong>in</strong> turn leads to <strong>in</strong>creased emissions,<br />
reduc<strong>in</strong>g the local air quality. Drivers face many concurrent decisions <strong>in</strong> this situation,<br />
<strong>in</strong>volv<strong>in</strong>g route choice, speed choice, <strong>in</strong>teraction with other road users, and complex road<br />
designs. F<strong>in</strong>ally, traffic is composed of more categories of road users with mixed equipage <strong>in</strong><br />
urban areas than <strong>in</strong> other areas, and this also poses challenges for drivers.<br />
The ma<strong>in</strong> driv<strong>in</strong>g challenges which are relevant at a certa<strong>in</strong> po<strong>in</strong>t <strong>in</strong> time are determ<strong>in</strong>ed by<br />
three factors: the driver, the vehicle, and the road environment (<strong>in</strong>clud<strong>in</strong>g other road users,<br />
rules and regulations), together mak<strong>in</strong>g up the (dynamic) DVE <strong>in</strong>teraction (DVE for Driver,<br />
Vehicle, and Environment). For <strong>in</strong>stance, drivers might become distracted by an event<br />
occurr<strong>in</strong>g outside the vehicle, they can temporarily be impaired due to fatigue, or they may<br />
experience a malfunction<strong>in</strong>g car. Intentions can change for <strong>in</strong>dividual drivers and over time,<br />
as a result of chang<strong>in</strong>g subjective norms, emotions or beliefs. Drivers can be highly alert or<br />
become drowsy or distracted, which has its <strong>in</strong>fluence on their <strong>in</strong>formation process<strong>in</strong>g and<br />
decision mak<strong>in</strong>g capacities. Both the vehicle and the systems built <strong>in</strong>to it can be designed <strong>in</strong> a<br />
way that <strong>in</strong>fluences the driv<strong>in</strong>g task demands and can have different characteristics, such as<br />
maximum possible speed. Infrastructural aspects can also <strong>in</strong>fluence driv<strong>in</strong>g behaviour and the<br />
DVE <strong>in</strong>teraction. On the one hand, drivers might understand directly what to do if the road<br />
environment is designed <strong>in</strong> a ‘self-expla<strong>in</strong><strong>in</strong>g’ manner (Theeuwes & Godthelp, 1995; Matena<br />
et al., 2008). On the other hand, they might become confused <strong>in</strong> situations where other road<br />
users behave unexpectedly or where the physical road environment is distract<strong>in</strong>g <strong>in</strong> itself due<br />
to distract<strong>in</strong>g objects on the road side (e.g., Hoedemaeker, Hogema & Pauwelussen, 2010).<br />
This distraction <strong>in</strong> turn might have an effect on the driver’s decisions and actions. These<br />
factors are summarized <strong>in</strong> a comb<strong>in</strong>ed behavioural model of the factors that <strong>in</strong>fluence driv<strong>in</strong>g<br />
behaviour, given <strong>in</strong> Figure 2.1 (after Van der Horst, 1998).<br />
Figure 2.1 Comb<strong>in</strong>ed behavioural model to <strong>in</strong>dicate factors that <strong>in</strong>fluence driver<br />
behaviour (after Van der Horst, 1998)<br />
Each of these factors (driver, vehicle and road environment) can be supported or simplified by<br />
means of support systems or <strong>in</strong>frastructural changes. For urban <strong>in</strong>tersections, a number of<br />
<strong>in</strong>telligent transport systems have been studied. Advanced Driver Assistance (ADA) Systems<br />
specifically support drivers <strong>in</strong> perform<strong>in</strong>g their driv<strong>in</strong>g task, either by <strong>in</strong>form<strong>in</strong>g the driver, by<br />
support<strong>in</strong>g part of the driv<strong>in</strong>g task, or by tak<strong>in</strong>g over (part of) the driv<strong>in</strong>g task completely.<br />
Unfortunately, many technological developments do not result from a study of drivers’ task<br />
performance, but from a comb<strong>in</strong>ation of available technology and deducted user needs based
Chapter 2 - Theoretical Framework 17<br />
on accident statistics. As will be expla<strong>in</strong>ed later <strong>in</strong> this chapter, accident statistics give only<br />
limited <strong>in</strong>sight <strong>in</strong>to the actual conflicts that happen on the road, let alone with<strong>in</strong> driv<strong>in</strong>g tasks<br />
that drivers need support for. This means that rely<strong>in</strong>g on accident statistics for <strong>in</strong>sight <strong>in</strong>to<br />
driver needs can leave many aspects of the driv<strong>in</strong>g task and the driver unexposed.<br />
The development of ADA Systems should be based on driver needs also for another reason. A<br />
change <strong>in</strong> task demands will most probably lead to behavioural adaptation (Verwey,<br />
Brookhuis & Janssen, 1996). <strong>Behaviour</strong>al adaptation is an important factor <strong>in</strong> the overall<br />
effects of ADA Systems, and is therefore not to be ignored <strong>in</strong> studies concern<strong>in</strong>g ADA<br />
Systems development. The development of ADA Systems, and behavioural adaptation to<br />
these support systems, is discussed <strong>in</strong> Section 2.6. But before anyth<strong>in</strong>g can be said about<br />
behavioural adaptation <strong>in</strong> specific situations, or even about the execution of the driv<strong>in</strong>g task <strong>in</strong><br />
normal circumstances, we have to understand what the structure of the driv<strong>in</strong>g task is, how<br />
subtasks are executed and prioritized, and which factors <strong>in</strong>fluence the execution of the driv<strong>in</strong>g<br />
task, <strong>in</strong> general and for specific driver types. The first step is therefore to take a look at the<br />
exist<strong>in</strong>g descriptions of drivers, the driv<strong>in</strong>g task, and the <strong>in</strong>tentions drivers have <strong>in</strong> tak<strong>in</strong>g up<br />
this complex task.<br />
The follow<strong>in</strong>g sections focus on different aspects of <strong>in</strong>formation process<strong>in</strong>g <strong>in</strong> general, as well<br />
as dur<strong>in</strong>g driv<strong>in</strong>g. In the first case, the text will refer to the human <strong>in</strong>formation processor as<br />
the operator, whereas where the text concerns driv<strong>in</strong>g specifically, it will read driver. This<br />
dist<strong>in</strong>ction will be used throughout the rema<strong>in</strong>der of this thesis.<br />
2.2 Descriptions of driv<strong>in</strong>g and drivers<br />
In order to ga<strong>in</strong> <strong>in</strong>sight <strong>in</strong>to driv<strong>in</strong>g behaviour <strong>in</strong> certa<strong>in</strong> circumstances, it is necessary to have<br />
a description of the driver, driv<strong>in</strong>g performance and the different goals and factors underly<strong>in</strong>g<br />
driv<strong>in</strong>g. A number of models have been developed <strong>in</strong> the past with this aim, but so far, no allpurpose<br />
and comprehensive model of driv<strong>in</strong>g behaviour has been developed (Ranney, 1994;<br />
Cody & Gordon, 2007; Lewis-Evans & Rothengatter, 2009). This is, among other th<strong>in</strong>gs, due<br />
to the fact that different driver models are often designed with different applications and<br />
different aims <strong>in</strong> m<strong>in</strong>d. Different models can focus on specific aspects of driver behaviour, for<br />
example, on classify<strong>in</strong>g driver characteristics for accident causation, on predict<strong>in</strong>g or<br />
describ<strong>in</strong>g behavioural adaptation, or on normative task descriptions. Michon (1985)<br />
proposed a generic classification of driver models, us<strong>in</strong>g a two-dimensional classification (see<br />
Table 2.1). He dist<strong>in</strong>guished between <strong>in</strong>put-output (behavioural) models and psychological<br />
models <strong>in</strong> the first dimension, and between functional and taxonomic models <strong>in</strong> the second.<br />
Accord<strong>in</strong>g to Michon, <strong>in</strong>put-output models (or stimulus-response models, or behavioural<br />
models) describe the relationships between actions (either desired or actual behaviour) and the<br />
driv<strong>in</strong>g situation, without referenc<strong>in</strong>g to the driver’s <strong>in</strong>ternal state. Psychological models, on<br />
the other hand, describe driv<strong>in</strong>g behaviour as a result of psychological variables and driver<br />
state. This latter category is oriented towards drivers’ “motivations for mov<strong>in</strong>g” (Michon,<br />
1985). Michon’s second dist<strong>in</strong>ction is between taxonomic models and functional models. The<br />
ma<strong>in</strong> difference between these two categories of models is the presence or absence of<br />
dynamic <strong>in</strong>teractions between components. Taxonomic models conta<strong>in</strong> <strong>in</strong>ventories of facts or<br />
data, which have static relationships that can be described <strong>in</strong> terms of order and hierarchy and<br />
which are def<strong>in</strong>ed by their frequencies or probabilities (Michon, 1985, 1989). This type of
18 <strong>Driv<strong>in</strong>g</strong> <strong>Behaviour</strong> <strong>in</strong> <strong>Unexpected</strong> <strong>Situations</strong><br />
model does not describe dynamic relations. Functional models, on the other hand, are more<br />
dynamic models that describe behavioural and/ or cognitive processes.<br />
Table 2.1 Two-dimensional classification of driver models (after Michon, 1985)<br />
Input-output models<br />
(behavioural)<br />
Psychological models<br />
(<strong>in</strong>ternal state)<br />
Taxonomic models Functional models<br />
Task analysis<br />
Trait models<br />
Mechanistic models<br />
Adaptive control models<br />
Motivational models<br />
Cognitive process models<br />
We will give a general description and some examples of at least one of the model types <strong>in</strong><br />
each cell of the matrix.<br />
i. Taxonomic behavioural models<br />
The ma<strong>in</strong> type of model of the driv<strong>in</strong>g task <strong>in</strong> the taxonomic and <strong>in</strong>put-output-based cell of<br />
the model matrix is task analysis. As the name already reveals, this model provides an<br />
analysis of the subtasks which make up driv<strong>in</strong>g and the performance objectives of those tasks.<br />
A well-known task analysis was published by McKnight and Adams (1970). They made an<br />
exhaustive overview of requirements and objectives, which <strong>in</strong>cluded 45 subtasks consist<strong>in</strong>g of<br />
more than 1,700 elementary actions <strong>in</strong> total. Although the analysis is very complete and gives<br />
a good overview of the different subtasks which are <strong>in</strong>cluded <strong>in</strong> the driv<strong>in</strong>g task, it does not<br />
<strong>in</strong>clude temporal relationships or cognitive or psychological aspects of driv<strong>in</strong>g. For this<br />
reason, the task analysis does not provide a suitable way to get <strong>in</strong>sight <strong>in</strong>to actual driv<strong>in</strong>g<br />
behaviour <strong>in</strong> dynamic circumstances.<br />
ii. Taxonomic psychological models<br />
Trait models are taxonomic <strong>in</strong>ventories which are related to the psychological, <strong>in</strong>ternal state<br />
of drivers. They describe psychological aspects of the driver with a relation to driv<strong>in</strong>g<br />
behaviour or the execution of the driv<strong>in</strong>g task. A trait model can predict driv<strong>in</strong>g skills or<br />
attitudes but does not give <strong>in</strong>sight <strong>in</strong>to actual driv<strong>in</strong>g behaviour <strong>in</strong> specific situations, and<br />
does not <strong>in</strong>clude the dynamic character of the driv<strong>in</strong>g task. Michon (1985) mentions two<br />
dist<strong>in</strong>ct types of trait models. The first is the factorial model for perceptual, cognitive and<br />
motor skills developed by Fleischman (1967, 1975). This model describes how skills arise<br />
from basic operator traits such as reaction speed, and how practice changes the level of<br />
performance from ‘know<strong>in</strong>g that’, at which level the operator can verbalize the actions, to<br />
‘know<strong>in</strong>g how’, at which po<strong>in</strong>t automaticity can be reached for certa<strong>in</strong> skills (Fleischman,<br />
1967, <strong>in</strong> Michon, 1985). Although this approach offers no <strong>in</strong>sight <strong>in</strong>to the actual process<strong>in</strong>g<br />
that takes place when driv<strong>in</strong>g or perform<strong>in</strong>g another complex task, it does give some <strong>in</strong>sight<br />
<strong>in</strong>to the factors <strong>in</strong>volved <strong>in</strong> learn<strong>in</strong>g processes. The second type of trait model discussed by<br />
Michon consists of observations of accident frequencies for different driver groups. These<br />
types of observations l<strong>in</strong>k personal traits, such as level of stress, driv<strong>in</strong>g style or other factors<br />
to <strong>in</strong>tervals between successive <strong>in</strong>cidents. These observations can help to give some <strong>in</strong>sight<br />
<strong>in</strong>to driver characteristics and their <strong>in</strong>fluence of drivers’ accident-proneness.
Chapter 2 - Theoretical Framework 19<br />
iii. Functional behavioural models<br />
As opposed to taxonomic models, functional models describe processes which take place<br />
with<strong>in</strong> the driver or dur<strong>in</strong>g driv<strong>in</strong>g. There are two ma<strong>in</strong> types of functional <strong>in</strong>put-output<br />
models. On the one hand, mechanistic models describe the actions of drivers based on the<br />
functions of the driv<strong>in</strong>g task. An example could be a model which describes the driver as a<br />
part of a traffic system and does not <strong>in</strong>corporate any motives or psychological aspects, such as<br />
a car-follow<strong>in</strong>g model without an (<strong>in</strong>ternal or motivational) explanation for the behaviour<br />
shown. These types of models are not very <strong>in</strong>telligible with regard to drivers’ <strong>in</strong>tentions and<br />
motives, nor do they deal with the (adaptive) prioritiz<strong>in</strong>g of subtasks. When assumptions<br />
about motivational aspects of driv<strong>in</strong>g are <strong>in</strong>troduced, models no longer fit <strong>in</strong> the category of<br />
mechanistic models (Michon, 1985). On the other hand, adaptive control models deal with<br />
<strong>in</strong>formation flow and decision mak<strong>in</strong>g. Accord<strong>in</strong>g to these models, the driv<strong>in</strong>g task can be<br />
seen as a cont<strong>in</strong>uous task requir<strong>in</strong>g visual track<strong>in</strong>g, <strong>in</strong>formation process<strong>in</strong>g, basic skills such<br />
as lane keep<strong>in</strong>g and ma<strong>in</strong>ta<strong>in</strong><strong>in</strong>g an appropriate speed, and object avoidance. Adaptive control<br />
models describe the way <strong>in</strong> which <strong>in</strong>formation flows are used <strong>in</strong> these subtasks and/ or <strong>in</strong> the<br />
execution of the overall driv<strong>in</strong>g task. Subtask prioritization, <strong>in</strong>formation process<strong>in</strong>g from<br />
perception to action, and <strong>in</strong>ternal factors can therefore be <strong>in</strong>cluded <strong>in</strong> this type of model.<br />
iv. Functional psychological models<br />
Functional psychological models are related to mental abilities, beliefs, motivations, emotions<br />
and other cognitive processes that play a part <strong>in</strong> driv<strong>in</strong>g. There are two ma<strong>in</strong> types of<br />
functional psychological models: motivational models and cognitive process models.<br />
Cognitive process models represent the processes underly<strong>in</strong>g driv<strong>in</strong>g behaviour and choices.<br />
They relate actions with cognitive processes such as perception, stimulus selection, decision<br />
mak<strong>in</strong>g, and goal management. Motivational models deal with beliefs, attitudes and their<br />
relationship with actual (driv<strong>in</strong>g) behaviour, such as the theory of planned behaviour (Ajzen,<br />
1985). A large proportion of these motivational models describe drivers’ risk handl<strong>in</strong>g and<br />
risk avoidance behaviour, such as Näätänen and Summala’s (1976) zero-risk theory, Wilde’s<br />
(1982) risk homeostasis theory, and Fuller’s Task-Capability-Interface (Fuller, 2000; Fuller,<br />
McHugh & Pender, 2008). These types of motivational models are elaborated <strong>in</strong> a separate<br />
section, as it is highly related to the way <strong>in</strong> which drivers handle safety-critical situations.<br />
First we present Michon’s (1971, 1985) hierarchical model, provid<strong>in</strong>g a description of the<br />
driv<strong>in</strong>g task which embraces normal driv<strong>in</strong>g and unexpected circumstances, and the<br />
prioritization of subtasks. Michon presented this model, a description of subtask types, their<br />
hierarchical classification and their (hierarchical) <strong>in</strong>teraction, as a framework for the<br />
development of a comprehensive driver model (Michon, 1985). Such a comprehensive model<br />
of driv<strong>in</strong>g, which <strong>in</strong>cludes cognition and motivations as well as dynamic relations between<br />
(the handl<strong>in</strong>g of) subtasks, transcends the classification scheme as proposed by Michon<br />
himself, s<strong>in</strong>ce multiple aspects of both dimensions are part of the f<strong>in</strong>al model. In the current<br />
state, the proposed framework fits best <strong>in</strong> the category of functional behavioural models, s<strong>in</strong>ce<br />
it describes dynamic relations, but does not (yet) <strong>in</strong>clude motivations or cognition.<br />
2.2.1 Hierarchical model of the driv<strong>in</strong>g task (Michon, 1971, 1985)<br />
The driv<strong>in</strong>g task can be seen as a three-layered hierarchical task with a strategic, a tactical,<br />
and an operational level (Michon, 1971, 1985; Janssen, 1979). At the strategic (navigation)<br />
level, the journey is planned, tak<strong>in</strong>g <strong>in</strong>to account current location and proposed dest<strong>in</strong>ation.<br />
Subtasks at this level are for <strong>in</strong>stance determ<strong>in</strong><strong>in</strong>g dest<strong>in</strong>ation and desired arrival time,
20 <strong>Driv<strong>in</strong>g</strong> <strong>Behaviour</strong> <strong>in</strong> <strong>Unexpected</strong> <strong>Situations</strong><br />
choos<strong>in</strong>g the mode of transport that best fits the wishes for the trip, and determ<strong>in</strong><strong>in</strong>g the route<br />
to be taken. The strategic level is also where the driver sets his/ her overall goals for the trip,<br />
such as hurry<strong>in</strong>g or enjoy<strong>in</strong>g the ride. The tactical (manoeuvr<strong>in</strong>g) level is where the driver<br />
tries to atta<strong>in</strong> these goals by manoeuvr<strong>in</strong>g the vehicle. Here, <strong>in</strong>teraction with other road users<br />
and the road layout takes place – for example, when pass<strong>in</strong>g a vehicle. The tactical level<br />
conta<strong>in</strong>s subtasks such as tak<strong>in</strong>g a turn, keep<strong>in</strong>g the appropriate distance to the surround<strong>in</strong>g<br />
vehicles, and keep<strong>in</strong>g the correct position on the road. On the operational (control) level, the<br />
driver directly controls the vehicle. This <strong>in</strong>cludes subtasks such as steer<strong>in</strong>g, handl<strong>in</strong>g the<br />
clutch and other <strong>in</strong>teractions with the vehicle controls. The three task levels also have <strong>in</strong>ternal<br />
feedback loops: tasks at the three levels are cont<strong>in</strong>uously adjusted and controlled accord<strong>in</strong>g to<br />
cues from the environment. The three task levels (strategic, tactical and operational) are<br />
hierarchical <strong>in</strong> the sense that they <strong>in</strong>fluence each other <strong>in</strong> a top-down way; however, control<br />
mechanisms have not been specified. The hierarchical model of the driv<strong>in</strong>g task (Michon,<br />
1971) is depicted <strong>in</strong> Figure 2.2.<br />
Figure 2.2 Hierarchical model of the driv<strong>in</strong>g task (based on Michon, 1971)<br />
The <strong>in</strong>teraction between task levels is especially present at urban <strong>in</strong>tersections, where all three<br />
levels simultaneously become active. A graphical representation of top-down task level<br />
<strong>in</strong>fluence dur<strong>in</strong>g normal driv<strong>in</strong>g at urban <strong>in</strong>tersections is given <strong>in</strong> Figure 2.3 (after Van der<br />
Horst, 1977). At the strategic level, drivers decide on their route choice based on<br />
<strong>in</strong>frastructural aspects and route <strong>in</strong>formation. Choices about the route directly <strong>in</strong>fluence lane<br />
choice, <strong>in</strong>teraction with other road users, speed choice, and which way the driver turns at an
Chapter 2 - Theoretical Framework 21<br />
<strong>in</strong>tersection, and this f<strong>in</strong>ally dictates the angle of the steer<strong>in</strong>g wheel and the pressure put on<br />
the gas pedal.<br />
Figure 2.3 Interaction of the three levels of the driv<strong>in</strong>g task when negotiat<strong>in</strong>g an<br />
<strong>in</strong>tersection (after Van der Horst, 1977)<br />
The hierarchy <strong>in</strong> this control model therefore lies <strong>in</strong> the fact that the outcome of behaviour at<br />
certa<strong>in</strong> task levels almost always dictates the tasks at the nearest lower level, at least <strong>in</strong> normal<br />
driv<strong>in</strong>g behaviour conditions. However, it is expected that bottom-up <strong>in</strong>fluence is also<br />
possible <strong>in</strong> specific circumstances. When an <strong>in</strong>terruption of the normal driv<strong>in</strong>g task changes<br />
the driv<strong>in</strong>g situation unexpectedly, lower task levels could dictate that someth<strong>in</strong>g should be<br />
done or decided and prioritized at higher task levels. An example might help here. Drivers<br />
want<strong>in</strong>g to turn left at a blocked <strong>in</strong>tersection will notice the road block and register the
22 <strong>Driv<strong>in</strong>g</strong> <strong>Behaviour</strong> <strong>in</strong> <strong>Unexpected</strong> <strong>Situations</strong><br />
situation as requir<strong>in</strong>g a change <strong>in</strong> behaviour. They will change their route accord<strong>in</strong>gly. The<br />
tactical task level is concerned with the action of turn<strong>in</strong>g left and the <strong>in</strong>teraction with the road,<br />
and compensation behaviour at this level now dictates that different choices regard<strong>in</strong>g route<br />
need to be made at a higher level. At the operational level, this type of compensation and<br />
bottom-up <strong>in</strong>fluence could for <strong>in</strong>stance occur when the road is slippery and the car does not<br />
react to the steer<strong>in</strong>g wheel movements normally. The <strong>in</strong>fluence (goals, <strong>in</strong>tentions, chosen<br />
route, desired speed) from the higher levels is then neglected, and tasks at the operational<br />
level take over <strong>in</strong> rega<strong>in</strong><strong>in</strong>g control over the vehicle. To our knowledge, research <strong>in</strong>to this<br />
bottom-up <strong>in</strong>fluence between levels of the driv<strong>in</strong>g task is <strong>in</strong>frequent. Figure 2.4 depicts the<br />
complete <strong>in</strong>teraction between the three levels of the driv<strong>in</strong>g tasks, as is hypothesized based on<br />
Michon (1971, 1985).<br />
Figure 2.4 Interaction between the three levels of the driv<strong>in</strong>g task, <strong>in</strong>clud<strong>in</strong>g types of<br />
situations which could <strong>in</strong>voke bottom-up <strong>in</strong>fluence (after Michon, 1985)<br />
2.2.2 Models related to Michon’s (1971, 1985) hierarchical model of the driv<strong>in</strong>g task<br />
Rasmussen (1987) describes structural aspects of human performance <strong>in</strong> another hierarchical<br />
behaviour model, which can also be applied to driv<strong>in</strong>g behaviour. His taxonomy dist<strong>in</strong>guishes<br />
skill-based, rule-based and knowledge-based behaviour. This refers to the level of skill and<br />
automatic execution (or conscious control) with which the task is performed. Skill-based<br />
performance means that the task is fully learned, and that human operators no longer need to<br />
th<strong>in</strong>k consciously about task execution. <strong>Behaviour</strong> at the rule-based level is executed by<br />
consciously select<strong>in</strong>g a set of rules relat<strong>in</strong>g to a specific subtask, after which this subtask is<br />
performed automatically. In knowledge-based behaviour, every action is thought about <strong>in</strong> a
Chapter 2 - Theoretical Framework 23<br />
conscious manner. After a certa<strong>in</strong> amount of practice, performance on tasks moves from the<br />
knowledge-based level to the rule-based level, and possibly on to the skill-based level.<br />
Together, these two hierarchies of the driv<strong>in</strong>g task have been put <strong>in</strong>to a matrix by Hale, Stoop<br />
and Hommels (1990), with an example of related driv<strong>in</strong>g behaviour for each cell. This matrix<br />
is reproduced <strong>in</strong> Figure 2.5.<br />
Strategic Tactical<br />
Operational<br />
(Manoeuvr<strong>in</strong>g) (Control)<br />
Knowledge-based Navigat<strong>in</strong>g <strong>in</strong><br />
unfamiliar area<br />
Controll<strong>in</strong>g skid Novice on first lesson<br />
Rule-based Choice between Pass<strong>in</strong>g other <strong>Driv<strong>in</strong>g</strong> unfamiliar<br />
familiar routes<br />
vehicles<br />
vehicle<br />
Skill-based Route used for daily Negotiat<strong>in</strong>g familiar Vehicle handl<strong>in</strong>g on<br />
commute<br />
<strong>in</strong>tersection<br />
curves<br />
Figure 2.5 Classification of selected driv<strong>in</strong>g tasks by Michon’s (1971, 1985) control<br />
hierarchy and Rasmussen’s (1987) skill-rule-knowledge framework<br />
(after Hale et al., 1990, Figure 1, p. 1383)<br />
F<strong>in</strong>ally, three stages of <strong>in</strong>formation process<strong>in</strong>g can be dist<strong>in</strong>guished for the driv<strong>in</strong>g task:<br />
selection, process<strong>in</strong>g and action (Theeuwes, 1993). Wickens’ (1984) multiple resource theory<br />
(MRT) model of <strong>in</strong>formation process<strong>in</strong>g furthermore states that human operators do not have<br />
one s<strong>in</strong>gle resource for <strong>in</strong>formation process<strong>in</strong>g, but rather multiple resources that can be used<br />
simultaneously. These three stages of <strong>in</strong>formation process<strong>in</strong>g also <strong>in</strong>teract with the other level<br />
dist<strong>in</strong>ctions mentioned earlier. The level of automation changes the importance and type of<br />
<strong>in</strong>formation process<strong>in</strong>g, because a more automatically executed task does not need as much<br />
conscious thought as a task performed at the knowledge-based level. On the other hand, all<br />
three stages of <strong>in</strong>formation process<strong>in</strong>g do occur at all the hierarchical levels of the driv<strong>in</strong>g<br />
task, and the type of task def<strong>in</strong>es the type of <strong>in</strong>formation process<strong>in</strong>g required. This further<br />
shows the complexity of the task of driv<strong>in</strong>g on urban <strong>in</strong>tersections: all three task and<br />
performance dimensions are relevant and <strong>in</strong>fluence each other <strong>in</strong> this situation. Figure 2.6<br />
shows a 3-dimensional matrix of the road user task (after Theeuwes, 1993).<br />
The levels of each dimension <strong>in</strong>teract frequently and the l<strong>in</strong>ks between cells at the three<br />
dimensions are not strictly fixed (Cody & Gordon, 2007). For <strong>in</strong>stance, tactical tasks can be<br />
performed at either skill, rule, or knowledge based performance level, depend<strong>in</strong>g on the exact<br />
task and the level of experience. However, tasks at the operational level, such as press<strong>in</strong>g the<br />
gas pedal or turn<strong>in</strong>g the steer<strong>in</strong>g wheel, will often be performed <strong>in</strong> a skill-based manner by<br />
experienced drivers. Furthermore, most regular situations <strong>in</strong> normal driv<strong>in</strong>g <strong>in</strong> which tasks at<br />
different levels <strong>in</strong>teract, such as translat<strong>in</strong>g a route <strong>in</strong>to a left turn at a specific location, will<br />
be executed at a rule-based level by most experienced drivers. After all, the more frequent the<br />
execution of a subtask, and the easier it is, the sooner its execution will move to a more<br />
efficient performance level, to rule-based and f<strong>in</strong>ally skill-based execution. On the other hand,<br />
when an unexpected situation occurs, disrupt<strong>in</strong>g the normal rule-based behaviour and topdown<br />
<strong>in</strong>teraction between the task levels, bottom-up compensation on task control is required.<br />
In these cases, knowledge-based task performance is needed to handle the situation. As most<br />
of the driv<strong>in</strong>g actions are performed <strong>in</strong> a skill-based or rule-based manner for experienced<br />
drivers, average drivers will not even be conscious of their actions until they need to solve<br />
problems at a knowledge-based level (Wagenaar, 1992).
24 <strong>Driv<strong>in</strong>g</strong> <strong>Behaviour</strong> <strong>in</strong> <strong>Unexpected</strong> <strong>Situations</strong><br />
Task hierarchy<br />
Strategic<br />
Tactical<br />
Operational<br />
Perception Process<strong>in</strong>g Action<br />
Stages of <strong>in</strong>formation process<strong>in</strong>g<br />
Skill<br />
Rule<br />
Knowledge<br />
Task performance<br />
Figure 2.6 Structure of the road user task <strong>in</strong> three dimensions (after Theeuwes, 1993)<br />
2.2.3 Switch<strong>in</strong>g between automatized driv<strong>in</strong>g and conscious control<br />
As was mentioned <strong>in</strong> the previous paragraph, Rasmussen’s hierarchical SRK-model describes<br />
the three levels (skill-based, rule-based and knowledge-based) at which tasks can be executed<br />
(Rasmussen, 1987). The terms skill-, rule- and knowledge-based <strong>in</strong>formation process<strong>in</strong>g refer<br />
to the degree of conscious control of the operator over the activities performed. With<br />
experience, operators can move from one level of task execution to the next; knowledgebased<br />
performance can thus grow <strong>in</strong>to rule-based and f<strong>in</strong>ally skill-based performance. The<br />
level of conscious control over the tasks performed can decrease with grow<strong>in</strong>g automation<br />
and skill-level, and execution may become <strong>in</strong>creas<strong>in</strong>gly effortless. Many tasks can become<br />
automatic with enough practice. Shiffr<strong>in</strong> and Schneider (1977) showed that the process of<br />
look<strong>in</strong>g for a specific group of letters <strong>in</strong> a set of other distracter letters could be tra<strong>in</strong>ed <strong>in</strong>to<br />
automatic performance with sufficient practice if the target letters and distracters were <strong>in</strong> the<br />
same groups consistently. However, if letters were switched from be<strong>in</strong>g targets to distracters,<br />
automaticity did not occur despite much practice. In other words, many tasks can be tra<strong>in</strong>ed<br />
<strong>in</strong>to becom<strong>in</strong>g automatic, and relearn<strong>in</strong>g these tasks with the aim of chang<strong>in</strong>g them <strong>in</strong>to a<br />
different habit is very difficult. A similar effect was found <strong>in</strong> highly learned components of<br />
the driv<strong>in</strong>g task. Kortel<strong>in</strong>g (1994) performed an experiment <strong>in</strong> which drivers had to reverse<br />
the polarity of their actions (i.e. turn the wheel right when they wanted to go left and vice<br />
versa). Steer<strong>in</strong>g was so strongly automatic that the participants could not unlearn it <strong>in</strong> the<br />
course of the experiment, and kept go<strong>in</strong>g ‘off road’ <strong>in</strong> the driv<strong>in</strong>g simulator.<br />
Automaticity can be decomposed <strong>in</strong>to many different aspects, such as the operator’s level of<br />
attention, control and awareness; the goal dependency of the task; and the level of efficiency<br />
of task performance (for an extensive overview of automaticity features, please refer to Moors<br />
& De Houwer, 2006). These authors suggest that most of the features are relative, i.e. they can<br />
be compared to a relative standard (Moors & De Houwer, 2006). Research on driv<strong>in</strong>g<br />
behaviour and automaticity (Young & Stanton, 2007) supports this suggestion that<br />
automaticity lies on a cont<strong>in</strong>uum. Young and Stanton (2007) furthermore state that<br />
automaticity is resource-based, s<strong>in</strong>ce it was found that driv<strong>in</strong>g performance of skill-based<br />
subtasks for highly skilled drivers was still affected by mental workload levels.
Chapter 2 - Theoretical Framework 25<br />
Tra<strong>in</strong><strong>in</strong>g and experience are not the only factors that determ<strong>in</strong>e the level of conscious control<br />
an operator needs to exert. The situation that the operator encounters also determ<strong>in</strong>es the way<br />
<strong>in</strong> which the operator needs to act. Reason (1990) proposed the Generic Error Modell<strong>in</strong>g<br />
System (GEMS) as an extension of the SRK-framework (Rasmussen, 1987). The system<br />
describes how the performance level (skill-based, rule-based or knowledge-based) is partly<br />
determ<strong>in</strong>ed by the situation encountered. For <strong>in</strong>stance, when an operator encounters an<br />
unexpected situation while perform<strong>in</strong>g a task <strong>in</strong> an automatic fashion, s/he enters <strong>in</strong>to rulebased<br />
performance <strong>in</strong> order to return to the normal situation. In this case, the optimal response<br />
to the unexpected situation is not part of the task which is performed at the skill-based<br />
performance level, and the task is thus executed at the nearest lower level possible, i.e. rulebased.<br />
<strong>Driv<strong>in</strong>g</strong> is a task <strong>in</strong> which both automatic performance of subtasks and conscious task<br />
execution play a role. Such learned automatic (sub)tasks can allow drivers to save attentional<br />
resources, as skill-level and mental workload are <strong>in</strong>versely related (Young & Stanton, 2007).<br />
Skill-level and the level of conscious control, or automaticity (Anderson, 1995), are related, as<br />
the SKR-framework by Rasmussen (1987) also implies. When fewer resources are <strong>in</strong>vested,<br />
less conscious control will be exerted, and tasks will be executed <strong>in</strong> a more automatized or<br />
habitual fashion. The time needed to move from one skill-level to the next depends on the task<br />
difficulty and the amount of practice; operational driv<strong>in</strong>g tasks can be performed on a skillbased<br />
level after as little as one month practice (Young & Stanton, 2007). It has been found<br />
that even with very little driv<strong>in</strong>g experience (as can be seen <strong>in</strong> novice or <strong>in</strong>experienced<br />
drivers), mental workload can decrease when the operational levels of the driv<strong>in</strong>g task<br />
become more and more automatized (Verwey, 2000).<br />
When drivers drive <strong>in</strong> an automatic fashion and thus do not exert conscious control over every<br />
s<strong>in</strong>gle subtask, their ‘habitual’ behaviour can show <strong>in</strong> different ways. On the operational level,<br />
for <strong>in</strong>stance, drivers can approach an <strong>in</strong>tersection or bend without decelerat<strong>in</strong>g at the normal<br />
level, which po<strong>in</strong>ts to a less active pedal control. Other tasks at the operational level, such as<br />
steer<strong>in</strong>g (lane keep<strong>in</strong>g) and check<strong>in</strong>g the mirror, can also be performed <strong>in</strong> an automatized<br />
fashion. Automatized performance of tactical level subtasks can also occur, for <strong>in</strong>stance when<br />
drivers come nearer to a decelerat<strong>in</strong>g lead vehicle by postpon<strong>in</strong>g their response or by<br />
compensat<strong>in</strong>g. In a situation where the safety marg<strong>in</strong>s around the vehicle are large enough and<br />
the other road user behaves as expected, this could lead to an efficient use of cognitive<br />
resources without compromis<strong>in</strong>g safety. S<strong>in</strong>ce high levels of mental workload can have<br />
adverse effects on driv<strong>in</strong>g performance and a certa<strong>in</strong> amount of automaticity can reduce these<br />
levels of mental workload, this can <strong>in</strong> certa<strong>in</strong> cases be beneficiary to safety.<br />
As was already described, the change from knowledge- and rule-based performance to skillbased<br />
performance (or from conscious driv<strong>in</strong>g performance to a more automatic driv<strong>in</strong>g<br />
mode) is based on experience and tra<strong>in</strong><strong>in</strong>g. <strong>Driv<strong>in</strong>g</strong> modes can also change back from a state<br />
of driv<strong>in</strong>g <strong>in</strong> an automatic fashion to a state of conscious control over the driv<strong>in</strong>g task. This<br />
mode switch can have a number of causes or reasons. Drivers may switch from automatic to<br />
conscious task execution when an unexpected situation occurs that needs to be countered by<br />
the driver (for <strong>in</strong>stance when counter<strong>in</strong>g a risky situation by brak<strong>in</strong>g or steer<strong>in</strong>g away), they<br />
can actively choose to switch to driv<strong>in</strong>g <strong>in</strong> a conscious manner (for <strong>in</strong>stance when tak<strong>in</strong>g an<br />
unusual route home), or they can be startled by a situation. In all three situations, the driv<strong>in</strong>g<br />
mode switches from habitual, automatic driv<strong>in</strong>g <strong>in</strong>to conscious, attentive driv<strong>in</strong>g. For<br />
example, when a child suddenly runs <strong>in</strong>to the road <strong>in</strong> front of a car, the driver has to apply<br />
emergency brak<strong>in</strong>g immediately <strong>in</strong> order to come to a full stop. Not only will this task itself
26 <strong>Driv<strong>in</strong>g</strong> <strong>Behaviour</strong> <strong>in</strong> <strong>Unexpected</strong> <strong>Situations</strong><br />
be performed consciously, the driver might also be more conscious of the complete driv<strong>in</strong>g<br />
task or the environment for some time after this event. Even when a startl<strong>in</strong>g situation is not<br />
safety-critical and/ or does not require a conscious response from the driver (for <strong>in</strong>stance<br />
when a vehicle creat<strong>in</strong>g the startl<strong>in</strong>g situation responds adequately), it can still cause the<br />
driver to drive <strong>in</strong> a more conscious fashion for a certa<strong>in</strong> amount of time.<br />
Habitual performance can become subject to error <strong>in</strong> situations that do not comply with the<br />
orig<strong>in</strong>al (tra<strong>in</strong>ed) scenario. A classic (but usually not safety-critical) example is when drivers<br />
plan to take an unusual route home so that they can pick up someth<strong>in</strong>g from a shop on the<br />
way (Trick, Enns, Mills & Vavrik, 2004). When they get <strong>in</strong>attentive or distracted, they might<br />
f<strong>in</strong>d themselves driv<strong>in</strong>g their usual route despite their <strong>in</strong>itial <strong>in</strong>tentions: the well-tra<strong>in</strong>ed<br />
subtask of f<strong>in</strong>d<strong>in</strong>g the usual route has taken over. In the situation described, the goal (pick up<br />
someth<strong>in</strong>g from the shop) would have been reached if the drivers would have adaptively<br />
switched from automatic driv<strong>in</strong>g mode to a mode of conscious control. Habits can <strong>in</strong>deed<br />
even create risky situations. For <strong>in</strong>stance, when drivers do not get feedback from their<br />
environment that ma<strong>in</strong>ta<strong>in</strong><strong>in</strong>g an appropriate distance to a lead vehicle is necessary, they<br />
might omit to create this safe habit and <strong>in</strong>stead create a new habit of driv<strong>in</strong>g (too) close to<br />
another vehicle. Duncan, Williams and Brown (1991) compared the driv<strong>in</strong>g performance of<br />
three groups: novice drivers (less than one year experience), experienced drivers (at least 5<br />
years experience), and expert drivers (veteran drivers who had passed a very difficult driv<strong>in</strong>g<br />
course). Novices, still not experienced enough to have developed many habits or to be driv<strong>in</strong>g<br />
<strong>in</strong> an automatic driv<strong>in</strong>g mode, were more likely to brake at a safe distance from an<br />
<strong>in</strong>tersection than the other groups, and were also better <strong>in</strong> leav<strong>in</strong>g an appropriate distance<br />
when follow<strong>in</strong>g another car. Duncan, Williams and Brown (1991) concluded that the driv<strong>in</strong>g<br />
environment is too forgiv<strong>in</strong>g to give good feedback <strong>in</strong> the form of reward and punishment,<br />
thus tra<strong>in</strong><strong>in</strong>g drivers <strong>in</strong> the differences between correct and <strong>in</strong>correct behaviour. Drivers may<br />
speed and drive too close to another vehicle on a daily basis and still avoid collisions. If there<br />
are no negative consequences, the <strong>in</strong>correct actions could be repeated and may become<br />
automatic. They may even suppress and override correct habits (for <strong>in</strong>stance, those taught <strong>in</strong><br />
driver tra<strong>in</strong><strong>in</strong>g) when practiced more often.<br />
Overreliance and complacency on <strong>in</strong>telligent systems support<strong>in</strong>g the driver <strong>in</strong> part of the<br />
driv<strong>in</strong>g task can also br<strong>in</strong>g about an automatic driv<strong>in</strong>g state that is not always appropriate for<br />
the situation (for more <strong>in</strong>formation on behavioural adaptation to Advanced Driver Assistance<br />
Systems, please refer to Section 2.6). Some of these systems still require active and conscious<br />
control <strong>in</strong> the form of supervision, and, <strong>in</strong> certa<strong>in</strong> cases, even active <strong>in</strong>volvement of the driver.<br />
However, drivers do not always respond adequately <strong>in</strong> these situations, even when it is clearly<br />
their task to control the vehicle <strong>in</strong> these situations (e.g., De Waard, Brookhuis, Fabriek & Van<br />
Wolffelaar, 2004; De Waard, Van der Hulst, Hoedemaeker & Brookhuis, 1999). In these<br />
cases, it seems as though they drive <strong>in</strong> an automatic manner, <strong>in</strong>stead of consciously pay<strong>in</strong>g<br />
attention to the state of the device and the driv<strong>in</strong>g situation.<br />
When handl<strong>in</strong>g the driv<strong>in</strong>g task as an automatic, almost supervisory task, performance<br />
deterioration is a risk. If the need to respond to environmental stimuli decreases and actively<br />
us<strong>in</strong>g the available attentional resources is not required, these resources might be allocated<br />
elsewhere and drivers can become <strong>in</strong>attentive. On the rare occasions when drivers then do<br />
need to respond or compensate for a safety-critical situation, they will experience<br />
impoverished situational awareness, the disorientation that has been called the “out of the<br />
loop” effect (Endsley, 1995). Section 2.5 discusses Situation Awareness <strong>in</strong> more detail.
Chapter 2 - Theoretical Framework 27<br />
The hierarchical model of the driv<strong>in</strong>g task, as proposed by Michon (1971, 1985), and<br />
specifically the directional change of task level <strong>in</strong>teraction from top-down (normal driv<strong>in</strong>g<br />
behaviour) to bottom-up (compensation to an unexpected situation), will be a key concept <strong>in</strong><br />
this research. The research will also focus on the behavioural adaptation and compensation to<br />
unexpected events, either by switch<strong>in</strong>g to conscious control or by chang<strong>in</strong>g driv<strong>in</strong>g behaviour<br />
to accommodate for a change <strong>in</strong> external situations. This behavioural compensation could be<br />
related to the way <strong>in</strong> which drivers handle risky situations. The follow<strong>in</strong>g section describes<br />
four motivational models deal<strong>in</strong>g with risk handl<strong>in</strong>g dur<strong>in</strong>g driv<strong>in</strong>g.<br />
2.2.4 Models of risk handl<strong>in</strong>g<br />
As mentioned earlier, a large proportion of the motivational models of driv<strong>in</strong>g behaviour<br />
focuses on drivers’ risk handl<strong>in</strong>g and the behavioural adaptation result<strong>in</strong>g from it. Lewis-<br />
Evans, de Waard and Brookhuis (2011) propose a dist<strong>in</strong>ction between two types of riskhandl<strong>in</strong>g<br />
theories: monitor<strong>in</strong>g theories and threshold theories. We use this dist<strong>in</strong>ction here.<br />
Four <strong>in</strong>fluential and well-known models of risk handl<strong>in</strong>g <strong>in</strong> human factors research are the<br />
Risk Homeostasis Theory by Wilde (1982), Näätänen and Summala’s (1976) zero-risk model,<br />
the Threat Avoidance Theory (Fuller, 1984) and the Task-Capability-Interface (Fuller, 2000).<br />
They describe the behavioural adaptation that drivers show to situations that they perceive as<br />
risky and the reasons for this behavioural adaptation. Risk Homeostasis (Wilde, 1982) is an<br />
example of a monitor<strong>in</strong>g theory whereas the zero-risk model (Näätänen & Summala, 1976)<br />
and the Threat Avoidance Theory (Fuller, 1984) are examples of threshold theories (Lewis-<br />
Evans, De Waard & Brookhuis, 2011). The Task-Capability Interface (Fuller, 2000) comb<strong>in</strong>es<br />
threshold theory and monitor<strong>in</strong>g theory.<br />
i. Risk Homeostasis Theory<br />
Homeostasis refers to a dynamic process which regulates a system’s <strong>in</strong>ternal environment and<br />
aims to ma<strong>in</strong>ta<strong>in</strong> a stable target level through regulation mechanisms and equilibrium<br />
adjustments. In 1982, Wilde presented the Risk Homeostasis Theory (RHT). This theory is<br />
based on two assumptions. The first assumption <strong>in</strong> RHT is that drivers have a personal<br />
acceptable level of risk which they try to atta<strong>in</strong> throughout all driv<strong>in</strong>g situations. In situations<br />
<strong>in</strong> which the perceived level of risk is different from their personal acceptable risk level,<br />
drivers will show a behavioural change, mode change or even trip decision change <strong>in</strong> the<br />
direction of their personal acceptable risk level. The level of risk that is accepted is based on<br />
the notion of utility, so on the costs and benefits of both risky and cautious behaviour. It is<br />
important to note here that the personal acceptable risk level is not completely fixed for one<br />
person, but can fluctuate based on either long term characteristics such as age and personality,<br />
or short-term aspects such as <strong>in</strong>dividual trips and goals. The second assumption Wilde (1982)<br />
makes is that this <strong>in</strong>dividual risk homeostasis, by which drivers ma<strong>in</strong>ta<strong>in</strong> a fixed risk level,<br />
leads to an aggregated risk homeostasis for the complete traffic system, so for all road users<br />
together.<br />
An implication of the first assumption is that drivers will show an <strong>in</strong>crease <strong>in</strong> risky behaviour<br />
when traffic safety measures are implemented; for <strong>in</strong>stance, drivers might adopt higher speeds<br />
after the <strong>in</strong>troduction of seatbelts (this specific example was <strong>in</strong>deed confirmed <strong>in</strong> an<br />
<strong>in</strong>strumented vehicle study performed by Janssen [1994]). The assumption furthermore<br />
implicate that both the personal and the aggregated risk level can be calculated; however, this<br />
is impossible, both conceptually and practically. F<strong>in</strong>ally, an implication of the comb<strong>in</strong>ation of<br />
the two assumptions is that the way to create safer traffic situations might not be by chang<strong>in</strong>g
28 <strong>Driv<strong>in</strong>g</strong> <strong>Behaviour</strong> <strong>in</strong> <strong>Unexpected</strong> <strong>Situations</strong><br />
the situation or circumstances, but by implement<strong>in</strong>g measures that decrease drivers’ personal<br />
acceptable risk level. Although the total effect of safety measures will not always be<br />
completely neutralized by behavioural adaptation to the safer circumstances, it has been<br />
shown that <strong>in</strong>terventions can sometimes lead to negative behavioural adaptation (OECD,<br />
1990).<br />
ii. Zero-risk model<br />
The plausibility of RHT has been challenged <strong>in</strong> many studies (for an overview of criticisms<br />
see Evans, 1991). Some authors do not believe that drivers are capable of calculat<strong>in</strong>g a realtime<br />
risk level (e.g., Wagenaar, 1992; Summala & Näätänen, 1988). Others state that drivers,<br />
<strong>in</strong>stead of adapt<strong>in</strong>g their behaviour to reach a largely fixed personal level of risk, seek to<br />
prefer situations which either objectively have zero risk, or which subjectively feel like safe<br />
situations. This is the ma<strong>in</strong> pr<strong>in</strong>ciple for the second risk-related theory, Näätänen and<br />
Summala’s Zero-risk theory (1976). A basic assumption <strong>in</strong> zero-risk theory is that drivers<br />
judge a traffic situation to have no risk at all as long as the perceived level of risk is below the<br />
threshold of the acceptable level of risk. This perception of zero-risk results from a feel<strong>in</strong>g of<br />
be<strong>in</strong>g <strong>in</strong> control and be<strong>in</strong>g able to respond adequately to a potentially upcom<strong>in</strong>g safety-critical<br />
situation. Accord<strong>in</strong>g to the theory, drivers’ self confidence <strong>in</strong>creases with their experience,<br />
and with this process the perceived level of risk dim<strong>in</strong>ishes to zero. Experienced drivers<br />
therefore generally do not perceive any risk dur<strong>in</strong>g driv<strong>in</strong>g, and <strong>in</strong>tend to travel <strong>in</strong> a way <strong>in</strong><br />
which this rema<strong>in</strong>s the case. Cont<strong>in</strong>uous monitor<strong>in</strong>g of both the situational risk and the<br />
subjective accepted level of risk is therefore not necessary.<br />
When the situation is perceived as be<strong>in</strong>g safety-critical, i.e. hav<strong>in</strong>g a risk larger than the<br />
threshold, drivers adjust their behaviour by means of control mechanisms. These mechanisms<br />
will lead to deceleration, thus decreas<strong>in</strong>g the risk level to below the threshold, and back to a<br />
zero-risk situation. In 1988, the authors elaborated on their theory (Summala & Näätänen,<br />
1988), putt<strong>in</strong>g the focus on ma<strong>in</strong>ta<strong>in</strong><strong>in</strong>g safety-marg<strong>in</strong>s, def<strong>in</strong>ed as the distance between the<br />
driver and a hazard. Drivers do not cont<strong>in</strong>uously make ongo<strong>in</strong>g risk assessments but operate<br />
under zero-risk circumstances by control of safety marg<strong>in</strong>s (Summala & Näätänen, 1988).<br />
Conclud<strong>in</strong>g, drivers do not adjust risk levels, but they adjust their safety marg<strong>in</strong>s when they<br />
perceive that a situation is safety-critical rather than conta<strong>in</strong> zero risk.<br />
iii. Threat Avoidance Theory<br />
In 1984, Fuller proposed another motivational approach to risk compensation and driv<strong>in</strong>g<br />
behaviour (Fuller, 1984). His Threat Avoidance Theory described how drivers have<br />
conflict<strong>in</strong>g aims: on the one hand gett<strong>in</strong>g to a chosen dest<strong>in</strong>ation and on the other avoid<strong>in</strong>g<br />
hazards on the way there. Accord<strong>in</strong>g to Fuller, drivers learn through experience how to avoid<br />
risks by anticipatory responses to upcom<strong>in</strong>g hazards <strong>in</strong>stead of react<strong>in</strong>g by delayed responses.<br />
They learn which (types of) situations are risk-prone, and only show behavioural adaptation <strong>in</strong><br />
these (types of) situations. So <strong>in</strong>stead of adjust<strong>in</strong>g their behaviour to risk reactively, they<br />
avoid the risk <strong>in</strong> an anticipatory or selective way. S<strong>in</strong>ce the road environment is forgiv<strong>in</strong>g and<br />
objectively risky driv<strong>in</strong>g (for <strong>in</strong>stance speed<strong>in</strong>g) does not always lead to safety-critical<br />
situations, traffic situations with objective risk and perceptions of subjective risk are not<br />
always connected.<br />
iv. Task-Capability Theory<br />
In 2000, Fuller presented an elaborate version of his theory, the Task-Capability-Interface<br />
(TCI; Fuller, 2000). In this paper, Fuller suggested that under typical circumstances, drivers<br />
perceive situations to be zero risk, but under pressure they may know<strong>in</strong>gly accept some
Chapter 2 - Theoretical Framework 29<br />
degree of a hazard because the comb<strong>in</strong>ed utility of cont<strong>in</strong>u<strong>in</strong>g the same driv<strong>in</strong>g style<br />
outweighs the alternative, slow<strong>in</strong>g down or compensat<strong>in</strong>g for their perceived risk. Fuller<br />
stressed that there is a difference between the notion of risk as perceived by drivers, and the<br />
determ<strong>in</strong>ation of risk level as made by statisticians. This level of perceived risk is def<strong>in</strong>ed by<br />
the comb<strong>in</strong>ation of the task difficulty and the driver’s capabilities, and can be either zero (the<br />
safe feel<strong>in</strong>g of be<strong>in</strong>g <strong>in</strong> control) or one (temporary loss of control). Task difficulty is<br />
determ<strong>in</strong>ed by - <strong>in</strong> descend<strong>in</strong>g importance - driv<strong>in</strong>g speed, road position and trajectory,<br />
whereas capability is determ<strong>in</strong>ed by a comb<strong>in</strong>ation of drivers’ competence and the temporary<br />
ability to use this competence. This ability can be constra<strong>in</strong>ed by variables such as distraction<br />
and motivation. The drivers’ ma<strong>in</strong> task is to manage task difficulty so that their capabilities<br />
can handle these demands, while also satisfy<strong>in</strong>g other goals. Drivers can counter a situation <strong>in</strong><br />
which task demands exceed capability either by decreas<strong>in</strong>g the task demands (e.g., lower<strong>in</strong>g<br />
speed) or by <strong>in</strong>creas<strong>in</strong>g capability (e.g., <strong>in</strong>creas<strong>in</strong>g the <strong>in</strong>vested effort) (Fuller, 2000). S<strong>in</strong>ce<br />
driv<strong>in</strong>g is mostly a self-paced task, lower<strong>in</strong>g speed gives the driver more time to perceive<br />
possible hazards and make adequate decisions, therefore decreas<strong>in</strong>g task difficulty. Invest<strong>in</strong>g<br />
more effort, on the other hand, allows the driver to handle the task at hand better by <strong>in</strong>creas<strong>in</strong>g<br />
the capability. A risky situation can arise through active sensation seek<strong>in</strong>g (test<strong>in</strong>g the limits)<br />
or through the prolonged absence of ‘negative feedback’ to aspects of their driv<strong>in</strong>g behaviour<br />
(giv<strong>in</strong>g drivers the idea that their capabilities are higher than they actually are as compared to<br />
the relative task difficulty) (Fuller, 2000). The ratio of task difficulty and ability can reach a<br />
limit as a result of unexpected changes <strong>in</strong> task demand, for <strong>in</strong>stance aris<strong>in</strong>g from the<br />
unexpected behaviour of other road users. The impact on safety of such a sudden <strong>in</strong>crease <strong>in</strong><br />
task demand will be the more significant the closer the driver is to the critical threshold of<br />
difficulty-capability ratio. F<strong>in</strong>ally, a limit also occurs where capability is overestimated.<br />
More recently, Fuller, McHugh and Pender (2008) tested three hypotheses aris<strong>in</strong>g from the<br />
TCI model <strong>in</strong> a series of experiments. Firstly, perceived difficulty should be systematically<br />
related to speed ceteris paribus (i.e. all other th<strong>in</strong>gs rema<strong>in</strong><strong>in</strong>g equal); secondly, rat<strong>in</strong>gs of risk<br />
would be <strong>in</strong>dependent of speed until the task demands approached the driver’s capability;<br />
thirdly, feel<strong>in</strong>gs of risk should be stable and around zero until a threshold level of speed<br />
pushed the task demands close enough to the driver’s capability. Although these hypotheses<br />
were <strong>in</strong>deed supported by the experimental results, the implicit assumption that risk rat<strong>in</strong>gs<br />
were similar to subjective estimates of collision was not met. Apparently, drivers focus more<br />
on ma<strong>in</strong>ta<strong>in</strong><strong>in</strong>g control than on possible consequences of the loss of control, such as a<br />
collision. Fuller, McHugh and Pender (2008) therefore stated that up to the speed at which<br />
drivers feel comfortable, the perceived risk is a direct expression of task difficulty and has no<br />
relationship with collision risk. Above a certa<strong>in</strong> threshold, i.e. above a certa<strong>in</strong> speed level,<br />
drivers appear to use feel<strong>in</strong>gs of task difficulty and risk as an <strong>in</strong>put of speed choice. The TCI<br />
model is therefore a comb<strong>in</strong>ation of the risk compensation part of Wilde’s (1982) RHT, and<br />
the zero-risk part of the zero-risk model by Summala and Näätänen (1988).<br />
2.3 Traffic safety measures<br />
For a discussion of risky situations or of traffic safety <strong>in</strong> general, it is important to understand<br />
how the level of traffic safety can be determ<strong>in</strong>ed. Measur<strong>in</strong>g the level of safety of a certa<strong>in</strong><br />
situation or system is of major importance for this topic, and when th<strong>in</strong>k<strong>in</strong>g about safety<br />
analysis, accident statistics are the first type of measure that come to m<strong>in</strong>d. However, accident<br />
records are not the best measure to support this type of conclusions.
30 <strong>Driv<strong>in</strong>g</strong> <strong>Behaviour</strong> <strong>in</strong> <strong>Unexpected</strong> <strong>Situations</strong><br />
Firstly, accidents are not always reported, leav<strong>in</strong>g analysts with an <strong>in</strong>complete set of data.<br />
Secondly, the registered <strong>in</strong>formation on the causes of accidents <strong>in</strong> these data is m<strong>in</strong>imal, with<br />
practically no <strong>in</strong>formation on external causes or preced<strong>in</strong>g driver actions. And thirdly, unlike<br />
conflict situations, accidents are relatively rare. However, the processes that result <strong>in</strong><br />
accidents are similar to the processes that lead to less severe conflict situations (near<br />
accidents, serious traffic conflicts, etc), with the major difference be<strong>in</strong>g the outcome of the<br />
situation (Van der Horst, 1990).<br />
Figure 2.7 Incident pyramid (Hydén, 1987; repr<strong>in</strong>ted with permission)<br />
Figure 2.7 depicts the <strong>in</strong>cident pyramid (Hydén, 1987), relat<strong>in</strong>g accidents at different severity<br />
levels to conflict situations and undisturbed passages. It shows that the number of occurred<br />
accidents is only a very small portion of the actual number of conflicts and near-accidents,<br />
and is built up from the same population of potential or actual conflicts.<br />
With the relatively high number of conflict situations as compared to actual accidents, it<br />
seems more useful to look at alternative measures for traffic safety. A large number of<br />
surrogate safety measures have been def<strong>in</strong>ed over the past years. Some describe the safety of<br />
certa<strong>in</strong> behaviours and can be obta<strong>in</strong>ed from a s<strong>in</strong>gle car, such as Time to L<strong>in</strong>e Cross<strong>in</strong>g<br />
(TLC), Deceleration Rate (DR), and the standard deviation of the Lateral Position (SDLP).<br />
The TLC denotes the number of seconds until the vehicle will cross a lane boundary with its<br />
current position, head<strong>in</strong>g, and (lateral and longitud<strong>in</strong>al) speed (e.g., Godthelp, Milgram &<br />
Blaauw, 1984). The severity of a l<strong>in</strong>e cross<strong>in</strong>g depends on the traffic situation and is therefore<br />
not <strong>in</strong>cluded <strong>in</strong> this measure. However, the (m<strong>in</strong>imum) time left to cross a boundary <strong>in</strong> a<br />
specific situation can give <strong>in</strong>sight <strong>in</strong>to (un)safe driv<strong>in</strong>g behaviour, especially <strong>in</strong> comb<strong>in</strong>ation<br />
with other measures (De Waard, 1996). The maximum Deceleration Rate may give an<br />
<strong>in</strong>dication of the severity of the deceleration situation, as it denotes the maximum speed slope<br />
dur<strong>in</strong>g deceleration. F<strong>in</strong>ally, the SDLP gives an <strong>in</strong>dication of vehicle control and is a measure<br />
of track<strong>in</strong>g capability. SDLP can not be used as a po<strong>in</strong>t measurement s<strong>in</strong>ce it has to be
Chapter 2 - Theoretical Framework 31<br />
computed over a number of samples, but it can give a clear representation of changes <strong>in</strong> level<br />
of control over time. The SDLP has also been used as a measure of performance, specifically<br />
<strong>in</strong> mental workload research (e.g., Blaauw, 1982; Green, L<strong>in</strong> & Bagian, 1994; Hicks &<br />
Wierwille, 1979).<br />
Other surrogate safety measures def<strong>in</strong>e the severity of conflicts between two road users.<br />
These surrogate safety measures <strong>in</strong>clude Time-To-Collision (TTC), time/ distance headway,<br />
and Post-Encroachment-Time (PET). The TTC was def<strong>in</strong>ed by Hayward (1971) as “The time<br />
required for two vehicles to collide if they cont<strong>in</strong>ue at their present speed and on the same<br />
path” and is only valid <strong>in</strong> an approach situation. The smaller this value becomes, the closer<br />
the two vehicles approach each other, and thus the more severe the conflict situation is (with a<br />
TTC of zero mean<strong>in</strong>g a collision of the two vehicles). The TTC value for two mov<strong>in</strong>g vehicles<br />
may change cont<strong>in</strong>uously, as they move closer or brake to avoid a collision. Distance<br />
headway and time headway represent the distance between two vehicles, and the difference<br />
between the time when the front of a vehicle arrives at a certa<strong>in</strong> po<strong>in</strong>t and the time the front of<br />
the next vehicle arrives at the same po<strong>in</strong>t, respectively. F<strong>in</strong>ally, Post-Encroachment-Time<br />
(PET), focussed specifically at cross<strong>in</strong>g situations, is def<strong>in</strong>ed as the time between the moment<br />
that the first vehicle leaves the area of <strong>in</strong>tersection (possible conflict location) and the moment<br />
the second vehicles reaches this area. Figure 2.8 gives a graphical representation of the<br />
calculation of the PET (after Van der Horst, 1990).<br />
Together these measures can provide a relative comprehensive picture of the safety of a<br />
certa<strong>in</strong> situation, without necessarily need<strong>in</strong>g accident statistics as a safety measure. They<br />
produce valid and highly accurate estimates of average accident rates (Miglez, Glanz &<br />
Bauer, 1985 <strong>in</strong> Van der Horst, 1990). A number of these surrogate safety measures will be<br />
used <strong>in</strong> the present experiments to understand how the level of traffic safety or objective risk<br />
<strong>in</strong>fluences drivers’ behavioural compensation to unexpected situations.<br />
Possible<br />
conflict<br />
location<br />
Situation t1 Situation t2<br />
PET = t2-t1<br />
Figure 2.8 Calculat<strong>in</strong>g Post-Encroachment Time
32 <strong>Driv<strong>in</strong>g</strong> <strong>Behaviour</strong> <strong>in</strong> <strong>Unexpected</strong> <strong>Situations</strong><br />
2.4 Multi-task<strong>in</strong>g, distraction and mental workload while driv<strong>in</strong>g<br />
Car driv<strong>in</strong>g is not just the consecutive execution of a number of subtasks, but also requires<br />
complex cognitive abilities on the part of the driver. This section focuses on multi-task<strong>in</strong>g and<br />
elaborates on a number of aspects which are connected with the notion of multi-task<strong>in</strong>g <strong>in</strong><br />
general, as well as dur<strong>in</strong>g driv<strong>in</strong>g. As was mentioned before, the text will refer to the human<br />
<strong>in</strong>formation processor as the operator <strong>in</strong> the first case, whereas the text will read driver where<br />
it concerns driv<strong>in</strong>g specifically.<br />
2.4.1 Multi-task<strong>in</strong>g<br />
<strong>Driv<strong>in</strong>g</strong> is a task which by nature requires switch<strong>in</strong>g between vary<strong>in</strong>g task goals, divid<strong>in</strong>g<br />
attention and time-shar<strong>in</strong>g between multiple tasks. Besides perceiv<strong>in</strong>g and <strong>in</strong>terpret<strong>in</strong>g the<br />
situation surround<strong>in</strong>g them, drivers are required to handle the steer<strong>in</strong>g wheel, the gas pedal<br />
and other car controls, while also keep<strong>in</strong>g track of their route and other goals. In most cases<br />
this does not pose a problem, but sometimes drivers are at risk to be overloaded by the task<br />
demands or secondary activities. Multi-task<strong>in</strong>g is a skill that human operators possess<br />
naturally; th<strong>in</strong>k of the ease with which people can talk while walk<strong>in</strong>g, or listen to music while<br />
work<strong>in</strong>g <strong>in</strong> the garden. But although some tasks are seem<strong>in</strong>gly executed simultaneously<br />
without dim<strong>in</strong>ish<strong>in</strong>g overall performance, this is not possible <strong>in</strong>def<strong>in</strong>itely. Furthermore, not all<br />
tasks can be comb<strong>in</strong>ed easily and without consequences. This is especially true for tasks<br />
which require conscious thought and decision mak<strong>in</strong>g, i.e. tasks which are executed at the<br />
knowledge-based level. So there are limits to the possibilities humans have <strong>in</strong> multi-task<strong>in</strong>g,<br />
and some tasks are comb<strong>in</strong>ed easier than others. Wickens’ (1984) human <strong>in</strong>formation<br />
process<strong>in</strong>g model describes how humans’ limited <strong>in</strong>formation process<strong>in</strong>g capacity and<br />
attention resources can result <strong>in</strong> a bottle-neck when execut<strong>in</strong>g tasks with high attentional<br />
demands. In the case of s<strong>in</strong>gle-task performance, task performance is limited by the operator’s<br />
capacity for that s<strong>in</strong>gle task, and therefore depends on the ratio between task demand and<br />
resource capacity. When perform<strong>in</strong>g multiple tasks, however, performance on either of the<br />
tasks was found not to depend only on the demands placed on the operator or on the<br />
operator’s task prioritization (favour<strong>in</strong>g one task over the other, or neglect<strong>in</strong>g some of the<br />
tasks). The level of task performance also depends on qualitative differences between the two<br />
tasks, specifically at the level of the demands placed on <strong>in</strong>formation process<strong>in</strong>g. These<br />
differences, or dimensions, are the process<strong>in</strong>g stages, perceptual modalities, types of<br />
responses required, and process<strong>in</strong>g codes. Tasks that share the same modality often lead to a<br />
lower level of performance than tasks that use different modalities (Wickens, Sandry &<br />
Vidulick, 1983). For example, drivers are better at listen<strong>in</strong>g to route <strong>in</strong>structions while driv<strong>in</strong>g<br />
than at read<strong>in</strong>g these <strong>in</strong>structions simultaneously, s<strong>in</strong>ce driv<strong>in</strong>g and read<strong>in</strong>g share the same<br />
visual modality.<br />
Overall performance for multiple (simultaneous) tasks is determ<strong>in</strong>ed by three factors related<br />
to the task characteristics: the level of confusion of task elements, competition for resources,<br />
and cooperation between processes (Wickens, 1991). When two or more tasks have very<br />
similar aspects, humans might become confused <strong>in</strong> the task execution. This may lead to<br />
poorer performance. However, cooperation between two tasks might also occur. This is the<br />
case when the execution of one task could help the execution of another task, due to high<br />
similarity <strong>in</strong> the process<strong>in</strong>g rout<strong>in</strong>es. F<strong>in</strong>ally, competition occurs when two different tasks<br />
compete for the same resources (Wickens, 1991).
Chapter 2 - Theoretical Framework 33<br />
Perform<strong>in</strong>g multiple complex tasks simultaneously is generally seen as challeng<strong>in</strong>g for human<br />
operators. Delbridge (2000) stated that when try<strong>in</strong>g to do two tasks simultaneously,<br />
performance on one task is generally detrimental to performance on a second, simultaneous<br />
task. She therefore dist<strong>in</strong>guished between simultaneous and sequential process<strong>in</strong>g. Waller<br />
(1997) also stated that humans switch between multiple tasks rather than perform them at<br />
exactly the same time, either as <strong>in</strong>dividuals or <strong>in</strong> groups. Due to this sequential process<strong>in</strong>g,<br />
there is the risk of dim<strong>in</strong>ished attention for the primary task if this primary task and a<br />
distract<strong>in</strong>g task both demand (and thus compete for) conscious attention from operators. In a<br />
traffic situation, this dim<strong>in</strong>ished level of attention can have severe consequences for task<br />
performance; the follow<strong>in</strong>g section elaborates this concept of driver distraction.<br />
As was stated before, driv<strong>in</strong>g is a multi-task<strong>in</strong>g activity by nature. This means that<br />
competition for conscious attention does not only occur with external tasks, but also between<br />
driv<strong>in</strong>g tasks. At urban <strong>in</strong>tersections, the three levels of the driv<strong>in</strong>g task (Michon, 1971, 1985)<br />
are relevant simultaneously, and thus need conscious attention from the driver. This might<br />
pose challenges on drivers, s<strong>in</strong>ce drivers need to sequentially divide their attention to the<br />
route, their surround<strong>in</strong>gs, and vehicle controls. However, the level of <strong>in</strong>terference depends<br />
both on the modality of the tasks and on their level of execution (Rasmussen, 1987). S<strong>in</strong>ce<br />
decisions <strong>in</strong> driv<strong>in</strong>g are often based on visual <strong>in</strong>formation, the visual aspects of multiple<br />
concurrent driv<strong>in</strong>g tasks can easily <strong>in</strong>terfere. Tasks which are performed at a knowledgebased<br />
level require conscious attention and us<strong>in</strong>g knowledge, and therefore pose a larger<br />
challenge than tasks at the rule-based or even skill-based levels. For tasks at the rule-based<br />
level, conscious attention is only needed for select<strong>in</strong>g the proper rule or programme, and this<br />
is a brief process. Tasks at the skill-based level hardly require any cognitive attention (Van<br />
der Horst, 2007).<br />
Conclud<strong>in</strong>g, the driv<strong>in</strong>g task requires sequential attention allocation, switch<strong>in</strong>g between<br />
different subtasks and adaptation to dynamically chang<strong>in</strong>g situations. The concepts of driver<br />
distraction and mental workload are closely related to these aspects of driv<strong>in</strong>g. The def<strong>in</strong>ition<br />
and operationalization of these terms, and how they are related, is the focus of the follow<strong>in</strong>g<br />
paragraphs.<br />
2.4.2 Driver distraction<br />
Driver distraction is a research topic that has been <strong>in</strong> the spotlight for many years, mostly<br />
because of its large impact on traffic safety conflicts. The American National Highway<br />
Traffic Safety Adm<strong>in</strong>istration (NHTSA) has estimated that <strong>in</strong> approximately 25-30% of traffic<br />
accidents, driver distraction is a contribut<strong>in</strong>g factor (Wang, Knipl<strong>in</strong>g & Goodman, 1996).<br />
Driver distraction manifests itself <strong>in</strong> many ways, such as eat<strong>in</strong>g and dr<strong>in</strong>k<strong>in</strong>g, tun<strong>in</strong>g the radio,<br />
engag<strong>in</strong>g <strong>in</strong> a conversation with a passenger or through a mobile phone, enter<strong>in</strong>g a dest<strong>in</strong>ation<br />
<strong>in</strong> a navigation system or diall<strong>in</strong>g a telephone number (Brookhuis, De Vries & De Waard,<br />
1991).<br />
The strong <strong>in</strong>crease <strong>in</strong> mobile phone use while driv<strong>in</strong>g has served as a catalyst to driver<br />
distraction research. Epidemiological studies showed that the likelihood of be<strong>in</strong>g <strong>in</strong>volved <strong>in</strong><br />
a conflict or accident while us<strong>in</strong>g a mobile telephone was four times as high compared to not<br />
us<strong>in</strong>g a mobile telephone (Redelmeier & Tibshirani, 1997, McEvoy et al., 2005). The Dutch<br />
Institute for Road Safety Research SWOV calculated that <strong>in</strong> 2004 nearly 600 victims of traffic<br />
accidents could have been saved <strong>in</strong> the Netherlands alone if mobile phone use while driv<strong>in</strong>g
34 <strong>Driv<strong>in</strong>g</strong> <strong>Behaviour</strong> <strong>in</strong> <strong>Unexpected</strong> <strong>Situations</strong><br />
were banned, i.e. approximately 8% of all registered hospitalized and fatally <strong>in</strong>jured <strong>in</strong> the<br />
Netherlands (Dragut<strong>in</strong>ovic & Twisk, 2005). Furthermore, some studies show that mobile<br />
phone users wear their seat belts significantly less than other drivers, lead<strong>in</strong>g to an <strong>in</strong>crease <strong>in</strong><br />
the seriousness of <strong>in</strong>juries as a consequence of traffic accidents (e.g., Eby & Vivoda, 2003). In<br />
other words, phon<strong>in</strong>g while driv<strong>in</strong>g poses a serious traffic safety risk.<br />
Whereas the aforementioned numbers focus merely on the risks of mobile phone use, driver<br />
distraction <strong>in</strong> the broader sense presents a general risk for traffic safety. The driv<strong>in</strong>g task is<br />
complex and demand<strong>in</strong>g <strong>in</strong> terms of visual and cognitive attention. Without focused attention<br />
on the primary task, drivers are at risk of respond<strong>in</strong>g more slowly or less appropriately to<br />
complex or chang<strong>in</strong>g situations that require their full attention (e.g., Anttila & Luoma, 2005;<br />
Hancock, Lesch & Simmons, 2003; Lamble, Kauranen, Laakso & Summala, 1999; Patten,<br />
Kircher, Ostlund & Nilsson, 2004). Furthermore, drivers have difficulty assess<strong>in</strong>g their own<br />
driv<strong>in</strong>g performance, especially while perform<strong>in</strong>g highly engag<strong>in</strong>g distract<strong>in</strong>g tasks (Horrey,<br />
Lesch & Garabet, 2008). As a result, they might not be <strong>in</strong>cl<strong>in</strong>ed to change their risky<br />
behaviour while be<strong>in</strong>g distracted, as they are not fully aware of the risk <strong>in</strong>volved with their<br />
actions. F<strong>in</strong>ally, even though many distract<strong>in</strong>g tasks with<strong>in</strong> the vehicle, such as diall<strong>in</strong>g a<br />
phone number or eat<strong>in</strong>g, are <strong>in</strong>itiated by drivers themselves, drivers do not strategically<br />
postpone these distractions (Horrey & Lesch, 2009).<br />
When study<strong>in</strong>g a complex concept such as driver distraction, stemm<strong>in</strong>g from many sources<br />
and manifest<strong>in</strong>g itself <strong>in</strong> many forms, uniformity <strong>in</strong> def<strong>in</strong>itions is an important constra<strong>in</strong>t for<br />
clear and unambiguous research results. Driver distraction is a subset of driver <strong>in</strong>attention, a<br />
situation <strong>in</strong> which the primary driv<strong>in</strong>g task is performed without complete, focused attention<br />
on that driv<strong>in</strong>g task. Whereas <strong>in</strong>attention can also occur without a specific distractor, just by<br />
no longer pay<strong>in</strong>g attention, distraction is related to someth<strong>in</strong>g (a task, object or person) that<br />
draws away the attention that is needed to perform the driv<strong>in</strong>g task adequately.<br />
Unfortunately, the research community has not until this po<strong>in</strong>t shown consensus on the<br />
precise def<strong>in</strong>ition of driver distraction. The def<strong>in</strong>itions used so far vary from “Diversion of<br />
attention from the driv<strong>in</strong>g task that is compelled by an activity or event <strong>in</strong>side the vehicle”<br />
(Treat, 1980), which is completely conf<strong>in</strong>ed to the cause of the distraction <strong>in</strong>side the vehicle,<br />
to “A disturbance imposed with<strong>in</strong> a lateral or longitud<strong>in</strong>al control vehicle loop” (Sheridan,<br />
2004), focus<strong>in</strong>g solely on the possible effects on vehicle control. An extensive overview of<br />
def<strong>in</strong>itions of driver distraction used <strong>in</strong> human factors research is given by Lee, Young and<br />
Regan (2008). This overview clearly shows the large variation between def<strong>in</strong>itions, and gives<br />
some <strong>in</strong>sight <strong>in</strong>to how long the research community has already been search<strong>in</strong>g for a uniform<br />
def<strong>in</strong>ition of the construct. This variation <strong>in</strong> theoretical def<strong>in</strong>itions <strong>in</strong>evitably leads to<br />
difficulties <strong>in</strong> the uniform operationalization of the construct of distraction. Is distraction<br />
determ<strong>in</strong>ed by the sole presence of a distract<strong>in</strong>g task, object or event that does not directly<br />
contribute to adequate driv<strong>in</strong>g, by the decrease <strong>in</strong> attention to the driv<strong>in</strong>g task, or by reduced<br />
performance on the primary driv<strong>in</strong>g task? Or is driver distraction the result of the comb<strong>in</strong>ation<br />
of these three questions? The answer to such questions is needed to operationalize the concept<br />
of distraction, which <strong>in</strong> turn is the key to compar<strong>in</strong>g the different studies and their results on<br />
this subject.<br />
Def<strong>in</strong><strong>in</strong>g distraction <strong>in</strong> a broad way creates a complete def<strong>in</strong>ition, but also one that is difficult<br />
to operationalize. But a def<strong>in</strong>ition which <strong>in</strong>corporates strictly def<strong>in</strong>ed behavioural effects is on<br />
the one hand very clear for all and easy to measure, but may on the other hand fail to capture<br />
important aspects of distraction (Lee, Young & Regan, 2008). The def<strong>in</strong>ition that is proposed
Chapter 2 - Theoretical Framework 35<br />
by Lee et al. (2008), based on their overview of def<strong>in</strong>itions is the follow<strong>in</strong>g: “Driver<br />
distraction is a diversion of attention away from activities critical for safe driv<strong>in</strong>g toward a<br />
compet<strong>in</strong>g activity.” This def<strong>in</strong>ition makes clear that safe driv<strong>in</strong>g performance deteriorates<br />
when the driver is distracted. Attention that is crucial for driv<strong>in</strong>g safely is diverted away by a<br />
distract<strong>in</strong>g task, leav<strong>in</strong>g too few resources available for adequate performance <strong>in</strong> the primary<br />
driv<strong>in</strong>g task.<br />
The measurable effect of driver distraction, based on the def<strong>in</strong>ition <strong>in</strong> Lee et al. (2008), is a<br />
decrease <strong>in</strong> driv<strong>in</strong>g performance, s<strong>in</strong>ce attention is diverted away from activities which are<br />
vital for safe driv<strong>in</strong>g. The most commonly used measures for driver distraction are<br />
longitud<strong>in</strong>al control (speed and headway measures), lateral control (TLC and SDLP), event<br />
detection and gap acceptance performance (Young, Regan & Hammer, 2003). Particularly if a<br />
negative effect is seen on more than one of these measures dur<strong>in</strong>g the performance of a<br />
secondary task, it can be concluded that driv<strong>in</strong>g performance deteriorates and that this<br />
performance deterioration might be attributable to distraction by the secondary task.<br />
However, safe driv<strong>in</strong>g can not always be determ<strong>in</strong>ed solely on the basis of directly observable<br />
measures. <strong>Driv<strong>in</strong>g</strong> safely also requires that the driver is ready to respond adequately to<br />
possible upcom<strong>in</strong>g safety-critical situations, and distraction can affect this read<strong>in</strong>ess. If this is<br />
the case, and a driver is <strong>in</strong> such a (distracted) state that his read<strong>in</strong>ess to respond to an<br />
upcom<strong>in</strong>g hazard is negatively affected, this form of decreased performance does not show <strong>in</strong><br />
measures of operational driv<strong>in</strong>g behaviour when the complexity of the driv<strong>in</strong>g environment is<br />
low. However, it can be argued that the driver is no longer driv<strong>in</strong>g optimally. In this way, the<br />
presence of a secondary task can lead to three possible situations, each with a different effect<br />
on driv<strong>in</strong>g performance. These situations will be briefly described below and it will be<br />
determ<strong>in</strong>ed whether and how distraction can be measured.<br />
i. No distraction<br />
The presence of a secondary task does not distract the driver from driv<strong>in</strong>g safely per se. The<br />
driver can choose to give first priority to the primary driv<strong>in</strong>g task without lett<strong>in</strong>g the<br />
secondary task affect the level of driver performance. Although this may lead to poor<br />
performance on the secondary task, distraction from the primary driv<strong>in</strong>g task does not occur.<br />
Even <strong>in</strong> safety-critical situations, the secondary task will not withhold the driver from<br />
respond<strong>in</strong>g appropriately and <strong>in</strong> a safe manner. It is important to note, however, that this does<br />
not mean that ‘undistracted’ drivers always drive safely; with an estimated 25-30% of crashes<br />
be<strong>in</strong>g related to distraction (Wang, Knipl<strong>in</strong>g & Goodman, 1996), the majority is not related to<br />
distracted driv<strong>in</strong>g. Task demands can outweigh drivers’ capabilities <strong>in</strong> certa<strong>in</strong> situations, and<br />
drivers can also make errors while fully focus<strong>in</strong>g on the driv<strong>in</strong>g task. Accord<strong>in</strong>g to several<br />
studies, drivers can typically show three types of risky or aberrant driv<strong>in</strong>g behaviour: lapses<br />
(absent-m<strong>in</strong>ded actions), errors (mistakes <strong>in</strong> perception and decision mak<strong>in</strong>g), and violations<br />
(deliberate actions which are not accord<strong>in</strong>g to traffic rules, or which are not constructive for<br />
traffic safety) (Parker, Reason, Manstead & Stradl<strong>in</strong>g, 1995; Reason, Manstead, Stradl<strong>in</strong>g,<br />
Baxter & Campbell, 1990). All of these actions can pose a risk for the driver and the<br />
surround<strong>in</strong>g road users, although their impact may vary largely accord<strong>in</strong>g to the<br />
characteristics and severity of the result<strong>in</strong>g situation.<br />
So although the s<strong>in</strong>gle fact that a driver can choose to focus on driv<strong>in</strong>g does not necessarily<br />
mean that there will be no conflicts or risky situations, drivers do have a choice to ‘ignore’<br />
possible distracters <strong>in</strong> favour of safe(r) or more attentive driv<strong>in</strong>g.
36 <strong>Driv<strong>in</strong>g</strong> <strong>Behaviour</strong> <strong>in</strong> <strong>Unexpected</strong> <strong>Situations</strong><br />
ii. Manifest distraction<br />
In the second situation the presence of a secondary task leads to such a distraction that a<br />
measurable decrease <strong>in</strong> driver performance can be observed directly. The driver makes suboptimal<br />
decisions and the number of conflicts <strong>in</strong>creases. In this situation, distraction can be<br />
assessed directly through measur<strong>in</strong>g its impact on driv<strong>in</strong>g behaviour <strong>in</strong> terms of operational<br />
driv<strong>in</strong>g tasks and conflict measures. Furthermore, by look<strong>in</strong>g at conflict situations, described<br />
<strong>in</strong> the previous section on safety measures, a statement can be made about the likelihood of an<br />
accident.<br />
iii. Latent distraction<br />
In the third situation, directly observable measures of driv<strong>in</strong>g performance such as operational<br />
driv<strong>in</strong>g measures or conflict measures seem to <strong>in</strong>dicate safe driv<strong>in</strong>g <strong>in</strong> the presence of a<br />
secondary task. However, this does not def<strong>in</strong>itely establish that the driver is not distracted.<br />
After all, driv<strong>in</strong>g safely does not simply mean that the driver is not <strong>in</strong> an unsafe situation, but<br />
also that s/he can adequately respond to upcom<strong>in</strong>g safety-critical situations <strong>in</strong> his current<br />
state. In a situation with latent distraction, a driver can manage the current situation, but at the<br />
limit of his/ her capacity, and would therefore struggle to respond to a suddenly upcom<strong>in</strong>g<br />
safety-critical situation. Consider for example a driver on the highway, ma<strong>in</strong>ta<strong>in</strong><strong>in</strong>g the<br />
appropriate speed and headway, and keep<strong>in</strong>g the correct lane. This driver seems to drive<br />
completely focussed, based on current distraction measures. However, this specific driver<br />
might actually be busy with a secondary task, which absorbs at least part of the necessary<br />
attention, such as programm<strong>in</strong>g a navigation device. Now consider the case where this<br />
driver’s lead vehicle suddenly brakes. Our driver might not respond quickly enough to avoid<br />
the imped<strong>in</strong>g hazard, due to the distract<strong>in</strong>g secondary task. Although the orig<strong>in</strong>al distraction<br />
measurements based on the low-demand<strong>in</strong>g driv<strong>in</strong>g situation would have resulted <strong>in</strong> the<br />
conclusion that the driver was completely focussed, this was not actually the case.<br />
Summariz<strong>in</strong>g, while distraction can <strong>in</strong>deed be present, the current assessment methods are<br />
unable to establish or measure it. It would be useful to identify a way of predict<strong>in</strong>g whether a<br />
driver is affected by this form of distraction. A tool that detects reaction times to cues <strong>in</strong> the<br />
environment, such as the Peripheral Detection Task (PDT), could be useful for assess<strong>in</strong>g the<br />
read<strong>in</strong>ess to respond. We propose to use the PDT as a tool <strong>in</strong> assess<strong>in</strong>g latent driver<br />
distraction (also refer to Schaap, Van der Horst, Van Arem and Brookhuis, 2012). For more<br />
<strong>in</strong>formation on the PDT, please refer to Chapter 3 (Research tools).<br />
2.4.3 Mental workload<br />
A concept closely related to distraction is mental workload. De Waard (1996) conducted<br />
extensive research regard<strong>in</strong>g the concept of mental workload and the measures that can be<br />
used for its assessment. He dist<strong>in</strong>guishes between task demands, task complexity, task<br />
difficulty, and mental workload. Task demands are determ<strong>in</strong>ed by the end goal of the task.<br />
Task complexity is related to a number of stages that have to be completed <strong>in</strong> order to<br />
successfully atta<strong>in</strong> the end goal. F<strong>in</strong>ally, task difficulty deals with the ability of the operator to<br />
execute the task, depend<strong>in</strong>g on the state of the operator. While <strong>in</strong> normal circumstances it<br />
might be easy for a driver to cover a certa<strong>in</strong> stretch of road, it may be more difficult to<br />
accomplish the same level of performance on the same route after a late night party. He<br />
def<strong>in</strong>es mental workload as follows: “Mental workload is the specification of the amount of<br />
<strong>in</strong>formation process<strong>in</strong>g capacity that is used for task performance” (De Waard, 1996).
Chapter 2 - Theoretical Framework 37<br />
De Waard shows that mental workload depends on a number of circumstances and can vary<br />
between <strong>in</strong>dividuals and over time (De Waard, 1996). Mental workload can be affected by<br />
<strong>in</strong>dividual and temporal characteristics of operators, such as personality traits and emotional<br />
state (for a summary of studies concerned with these aspects, please refer to Ganey, Koltko-<br />
Rivera, Murphy, Hancock & Dalton, 2004, and Szalma & Hancock, 2005). Other studies<br />
show that mental workload can be affected by the experience of failure <strong>in</strong> task performance,<br />
especially <strong>in</strong> women (Hancock, 1989), by previous mental workload circumstances (Hancock,<br />
Williams, Mann<strong>in</strong>g & Miyake, 1995), and by the effective time available to reach the goal set<br />
for the task at hand (Hancock & Caird, 1993).<br />
De Waard (1996) describes the effects of task demands on mental workload <strong>in</strong> a model.<br />
Figure 2.9 depicts the model of the overall relationship between workload, task demand, and<br />
performance, as presented <strong>in</strong> De Waard (1996). The model describes the relation between<br />
performance, task demands and mental workload <strong>in</strong> situations where the aim of the operator is<br />
to keep performance high over a longer period of time. The workload-performance relation<br />
has been separated <strong>in</strong>to six regions, each with its own characteristics. In the three A-regions<br />
(A1, A2 and A3), the demands of the task are at a level that allows the operator to achieve a<br />
high level of performance. In the A2-region, demand and workload are optimal, and<br />
performance can easily reach the desired level. In A1, performance rema<strong>in</strong>s adequate, but the<br />
operator has to exert state-related effort (i.e., computational effort through controlled<br />
<strong>in</strong>formation process<strong>in</strong>g) to keep performance high; <strong>in</strong> A3, the <strong>in</strong>vested effort <strong>in</strong>vested is taskrelated<br />
(i.e., compensatory effort). In the regions B, C and D, the operator is affected by the<br />
level of demand, lead<strong>in</strong>g to suboptimal performance. In region B, demand and workload are at<br />
a level that task-related effort no longer <strong>in</strong>creases performance, and performance decl<strong>in</strong>es.<br />
Region C depicts overload of the operator, lead<strong>in</strong>g to a low performance level. In region D (D<br />
for de-activation), the lack of task demand co<strong>in</strong>cides with a high workload level that the<br />
operator cannot cope with, so that performance deteriorates (De Waard, 1996). This concept<br />
of high workload <strong>in</strong> situations with very low task demands is supported by other authors (e.g.,<br />
Nachre<strong>in</strong>er, 1995); recent work by Warm, Parasuraman and Matthews (2008) also underl<strong>in</strong>es<br />
the same concept. The authors describe how vigilance tasks, which were traditionally seen as<br />
undemand<strong>in</strong>g and unstimulat<strong>in</strong>g, are actually related to high levels of distress and mental<br />
workload (Warm, Parasuraman & Matthews, 2008).
38 <strong>Driv<strong>in</strong>g</strong> <strong>Behaviour</strong> <strong>in</strong> <strong>Unexpected</strong> <strong>Situations</strong><br />
Figure 2.9 Workload and performance <strong>in</strong> 6 regions<br />
(De Waard, 1996, Figure 2, pp. 24; repr<strong>in</strong>ted with permission)<br />
There are a number of ways <strong>in</strong> which mental workload can be measured, and some of these<br />
measures might be useful for an <strong>in</strong>dication of distraction effects. The effects of <strong>in</strong>creased<br />
mental workload can differ from one situation to another and from one <strong>in</strong>dividual to another.<br />
These differences depend largely on <strong>in</strong>dividual strategies and the region of performance<br />
<strong>in</strong>volved, and measurements of the effects are best comb<strong>in</strong>ed for a valid assessment of mental<br />
workload (De Waard, 1996). Due to either <strong>in</strong>creased task demands or changes <strong>in</strong> driver state,<br />
drivers can feel a subjective <strong>in</strong>crease <strong>in</strong> mental workload, can show physiological signs that<br />
stem from <strong>in</strong>creased mental workload, and their task performance can be affected.<br />
Additionally, a decrease <strong>in</strong> performance of secondary tasks can occur. By comb<strong>in</strong><strong>in</strong>g the<br />
assessment results an overall <strong>in</strong>dication of mental workload and driver state can be<br />
determ<strong>in</strong>ed. Chapter 3 (Research tools) elaborates upon these mental workload measurements.<br />
Mental workload can affect execution of different k<strong>in</strong>ds of subtasks, from strategic tasks to<br />
operational tasks. It can therefore affect all three levels of the driv<strong>in</strong>g task. Figure 2.10 depicts<br />
this relationship between mental workload and the different levels of the driv<strong>in</strong>g task,<br />
<strong>in</strong>clud<strong>in</strong>g the <strong>in</strong>teraction between task levels.
Chapter 2 - Theoretical Framework 39<br />
Figure 2.10 Mental workload can affect driv<strong>in</strong>g at different subtasks and at different<br />
levels of the driv<strong>in</strong>g task<br />
2.4.4 Distraction and mental workload: bear<strong>in</strong>g resemblance but not the same<br />
Look<strong>in</strong>g at the similarity between the assessment methods of driver distraction and mental<br />
workload one would be <strong>in</strong>cl<strong>in</strong>ed to conclude that they are highly similar. Several studies<br />
actually equate an <strong>in</strong>crease <strong>in</strong> mental workload to distraction, or impaired driv<strong>in</strong>g to an<br />
<strong>in</strong>crease <strong>in</strong> mental workload. Some reservations about this are <strong>in</strong> order.<br />
Presence of secondary task<br />
The fact that distraction, by def<strong>in</strong>ition, can only exist <strong>in</strong> the presence of a compet<strong>in</strong>g activity,<br />
is not true for a change <strong>in</strong> mental workload. Hoedemaeker and her colleagues conducted a<br />
driv<strong>in</strong>g simulator study <strong>in</strong> which lane width and maximum speed were varied (Hoedemaeker,<br />
Janssen & Brouwer, 2002). S<strong>in</strong>ce no additional task was <strong>in</strong>troduced, any effect seen could<br />
only be a result of the primary driv<strong>in</strong>g task and not of any compet<strong>in</strong>g activity. They showed<br />
that the percentage of highly frequent steer<strong>in</strong>g movements, a measure of effort exerted and<br />
therefore a measure for adequate performance of the primary task was significantly higher <strong>in</strong><br />
the narrowest lane. Furthermore, subjective rat<strong>in</strong>gs (RSME, Rat<strong>in</strong>g Scale for Mental Effort,<br />
Zijlstra, 1993) confirm that driv<strong>in</strong>g was experienced to be more strenuous on narrow lanes<br />
and with <strong>in</strong>creas<strong>in</strong>g speed (Hoedemaeker et al., 2002). This is an example of a study <strong>in</strong> which<br />
mental workload was manipulated and measured, rather than distraction. This shows that
40 <strong>Driv<strong>in</strong>g</strong> <strong>Behaviour</strong> <strong>in</strong> <strong>Unexpected</strong> <strong>Situations</strong><br />
mental workload is not necessarily accompanied by a secondary task, and that distraction does<br />
not need to occur when mental workload <strong>in</strong>creases.<br />
Motivation, effort and engagement<br />
Although the sole presence of the secondary task may <strong>in</strong>crease task demands <strong>in</strong> itself, as the<br />
demands of the secondary task supplement the task demands of the primary task, this does not<br />
necessarily mean that drivers will always become negatively affected by this additional task.<br />
Drivers’ motivation to perform well <strong>in</strong> a certa<strong>in</strong> task (either the primary or the secondary task)<br />
can have great <strong>in</strong>fluence on the degree to which drivers ‘allow’ themselves to be distracted,<br />
by direct<strong>in</strong>g the focus of attention to that specific task. As De Waard (1996) asserts, the<br />
<strong>in</strong>structions that are given to the driver are of great <strong>in</strong>fluence on the execution of the<br />
secondary task. Task <strong>in</strong>structions, or the result<strong>in</strong>g motivation to perform well on a specific<br />
task, can therefore <strong>in</strong>fluence safe driv<strong>in</strong>g performance greatly. This is also supported by other<br />
studies. For <strong>in</strong>stance, Redenbo and Lee (2009) studied driv<strong>in</strong>g behaviour <strong>in</strong> comb<strong>in</strong>ation with<br />
secondary (arithmetic) tasks, and varied the <strong>in</strong>structions to <strong>in</strong>clude task prioritization. Primary<br />
task performance was measured by reaction times and accuracy. The authors found that a high<br />
prioritization of (aspects of) the ma<strong>in</strong> driv<strong>in</strong>g task led to similar task performance <strong>in</strong> dual-task<br />
conditions as <strong>in</strong> s<strong>in</strong>gle-task conditions. In other words, a possible distracter, an arithmetic<br />
task, did not actually distract drivers from their task <strong>in</strong> situations where they were motivated<br />
to not become distracted from their primary task, regardless of task demands. Because<br />
motivation and prioritization play a role <strong>in</strong> addition to task demands, it can therefore not be<br />
stated that an <strong>in</strong>crease <strong>in</strong> mental workload directly translates <strong>in</strong>to driver distraction. After all,<br />
distraction leads to decreased driv<strong>in</strong>g performance, and that is not necessarily the case <strong>in</strong> any<br />
situation where a secondary task is performed.<br />
As it turns out, drivers dist<strong>in</strong>guish between different types of secondary tasks, even without<br />
<strong>in</strong>structions, and safe driv<strong>in</strong>g is a key factor <strong>in</strong> mak<strong>in</strong>g this dist<strong>in</strong>ction. Cnossen, Meijman and<br />
Rothengatter (2004) hypothesized that the nature of the secondary task may be important, and<br />
that secondary tasks serv<strong>in</strong>g the driv<strong>in</strong>g task (e.g., map read<strong>in</strong>g) could receive higher priority<br />
than other secondary tasks (e.g., tun<strong>in</strong>g the radio). Participants <strong>in</strong> a driv<strong>in</strong>g simulator study<br />
were asked to perform a work<strong>in</strong>g memory task (irrelevant for driv<strong>in</strong>g) and a map read<strong>in</strong>g task<br />
(relevant for driv<strong>in</strong>g). In high demand conditions, the irrelevant task was <strong>in</strong>deed neglected,<br />
but the highly relevant map read<strong>in</strong>g task resulted <strong>in</strong> more swerv<strong>in</strong>g, <strong>in</strong>dicat<strong>in</strong>g that the<br />
subjects looked at the map despite the high task demands. Apparently, drivers protect highpriority<br />
task goals (safe driv<strong>in</strong>g) at the cost of lower-priority tasks, even if this results <strong>in</strong><br />
becom<strong>in</strong>g equally distracted (Cnossen et al., 2004).<br />
A recent meta-analysis of effects of mobile telephone use on driv<strong>in</strong>g performance (Horrey &<br />
Wickens, 2006) showed that relatively demand<strong>in</strong>g conversation tasks showed greater costs <strong>in</strong><br />
driv<strong>in</strong>g performance than did relatively easy <strong>in</strong>formation process<strong>in</strong>g tasks. This may be due to<br />
the greater ‘engagement’ associated with actual conversations (Horrey & Wickens, 2006).<br />
Furthermore, McKnight and McKnight (1993) compared concurrent driv<strong>in</strong>g and convers<strong>in</strong>g at<br />
two complexity levels. They found that <strong>in</strong>tense conversations were significantly more<br />
distract<strong>in</strong>g than casual conversations. The level of distraction was measured by the proportion<br />
of appropriate responses to situations that required a speed or direction alteration, such as<br />
decelerat<strong>in</strong>g lead vehicle. The authors suggest that this significant difference between the two<br />
types of conversations is due to stronger engagement of the drivers <strong>in</strong> this complex<br />
conversation task (McKnight & McKnight, 1993).
Chapter 2 - Theoretical Framework 41<br />
One could th<strong>in</strong>k that task-related effort (the compensatory effort <strong>in</strong>vested <strong>in</strong> the A3 region of<br />
the mental workload scheme, presented <strong>in</strong> Figure 2.9) is similar to engagement; they both<br />
represent focus<strong>in</strong>g on task performance and <strong>in</strong>vest<strong>in</strong>g energy <strong>in</strong> optimal performance on the<br />
primary task. However, the related effects are not the same for mental workload and driver<br />
distraction; <strong>in</strong> fact, they have opposite impacts on mental workload and distraction. When<br />
<strong>in</strong>vest<strong>in</strong>g task-related effort, mean<strong>in</strong>g that the driver focuses on <strong>in</strong>creas<strong>in</strong>g the performance of<br />
the ma<strong>in</strong> task at the cost of <strong>in</strong>vested energy, mental workload <strong>in</strong>creases. With distraction, the<br />
effects are opposite: as a stronger engagement leads to <strong>in</strong>creased performance, the distraction<br />
from the secondary task decreases. So while for both concepts the performance <strong>in</strong>creases as a<br />
result of the <strong>in</strong>vested energy, mental workload <strong>in</strong>creases and distraction decreases as a result<br />
of this task-related effort or task-engagement. It can be concluded that a driver’s motivation to<br />
perform well <strong>in</strong> a certa<strong>in</strong> task and the related engagement <strong>in</strong> the primary and secondary tasks<br />
<strong>in</strong>fluences whether or not the driver ‘allows’ him- or herself to be distracted. The primary task<br />
of safe driv<strong>in</strong>g can be protected by the driver, and this does not necessarily have to be<br />
connected to a certa<strong>in</strong> level of mental workload.<br />
It should therefore be noted that mental workload and distraction are not the same, and that<br />
manipulat<strong>in</strong>g mental workload does not necessarily lead to driver distraction. Therefore it is<br />
very important that the dist<strong>in</strong>ction between the two concepts is upheld, both <strong>in</strong> research<br />
question formulation, <strong>in</strong> experimental designs, and <strong>in</strong> measurement tools.<br />
It is clear that both (<strong>in</strong>)attention and mental workload play an important role <strong>in</strong> the way the<br />
driv<strong>in</strong>g task is executed and the level of alertness that drivers demonstrate. However, hav<strong>in</strong>g<br />
focussed attention on vital aspects of the driv<strong>in</strong>g task is not the sole determ<strong>in</strong>ant of the<br />
performance of the driver. Another vital aspect of good performance <strong>in</strong> complex traffic<br />
situations is the driver’s ability to assess and predict the situation, and determ<strong>in</strong>e the action<br />
which is the most appropriate for the situation at hand. Section 2.5 will reflect on this aspect<br />
of driv<strong>in</strong>g.<br />
2.5 Situation awareness<br />
In dynamic, complex and safety-critical systems such as traffic, it is of vital importance for<br />
operators to have a good perception and comprehension of the current situation and possible<br />
situational developments. In 1995, Endsley presented a theory on this concept of<br />
understand<strong>in</strong>g and foresee<strong>in</strong>g dynamic situation developments. She labelled this concept<br />
‘Situation Awareness’ (SA), and def<strong>in</strong>ed it as “the perception of elements <strong>in</strong> the environment<br />
with<strong>in</strong> a volume of time and space, the comprehension of their mean<strong>in</strong>g, and the projection of<br />
their status <strong>in</strong> the near future” (Endsley, p. 36). The theory beh<strong>in</strong>d this def<strong>in</strong>ition is that SA<br />
consists of three levels or hierarchical phases. At the first level, Level 1 SA, operators collect<br />
<strong>in</strong>formation about the current situation. This phase is also called ‘Perception of the elements<br />
<strong>in</strong> the environment’ (Endsley, 1995). The second level, Level 2 SA, is where operators<br />
<strong>in</strong>terpret the <strong>in</strong>formation perceived and form an image of the current situation <strong>in</strong> the light of<br />
their goals, hereby us<strong>in</strong>g their knowledge and experience. This level of SA is therefore also<br />
called ‘Comprehension of the current situation’. The third level (Level 3 SA), f<strong>in</strong>ally, consists<br />
of the prediction of future developments of the situation. To reach this level, a proper level of<br />
understand<strong>in</strong>g of the current situation is required. This phase is what Endsley calls ‘Projection<br />
of future status’.
42 <strong>Driv<strong>in</strong>g</strong> <strong>Behaviour</strong> <strong>in</strong> <strong>Unexpected</strong> <strong>Situations</strong><br />
Several factors can have an <strong>in</strong>fluence on situation assessment, the process of acquir<strong>in</strong>g SA:<br />
the operator’s abilities to acquire SA (experience, tra<strong>in</strong><strong>in</strong>g and <strong>in</strong>abilities); system design (the<br />
way <strong>in</strong> which <strong>in</strong>formation is provided and presented); and features of the environment, such<br />
as task complexity, workload, and stress. Evidence also exists for the assumption that the way<br />
a problem is framed (goals) <strong>in</strong>fluences the way <strong>in</strong> which SA is reached and the level of SA<br />
acquired (e.g., Gollwitzer & Moskowitz, 1996; Vicente & Wang, 1998). As task complexity<br />
<strong>in</strong>creases, SA becomes more important, s<strong>in</strong>ce the prediction of future events can have a larger<br />
role <strong>in</strong> decid<strong>in</strong>g which action to take next. F<strong>in</strong>ally, multiple studies have l<strong>in</strong>ked the levels of<br />
the driv<strong>in</strong>g task (Michon, 1971) to the levels of SA (e.g., Ma & Kaber, 2005; Matthews et al.,<br />
2001; Ward, 2000). They suggest that drivers are engaged <strong>in</strong> actions on vehicle controls for<br />
stable vehicle control, which is a semi-automatic process requir<strong>in</strong>g Level 1 SA to ensure that<br />
the operations have an appropriate outcome. At the tactical level, both Level 1 SA and Level<br />
2 SA are required for ensur<strong>in</strong>g that manoeuvr<strong>in</strong>g through the traffic are the environment are<br />
done appropriately (<strong>in</strong>clud<strong>in</strong>g a short span projection of future situations). Level 3 SA, f<strong>in</strong>ally,<br />
is related to longer term plann<strong>in</strong>g subtasks at the strategic level, which require the formulation<br />
of navigational plans and thus more extensive projection. The other two levels, Level 1 SA<br />
and Level 2 SA, are used <strong>in</strong> task execution when task comprehension and perceptual<br />
<strong>in</strong>tegration are <strong>in</strong>volved (Matthews et al., 2001).<br />
SA is highly temporal, mean<strong>in</strong>g that <strong>in</strong>formation has a short tenability and needs to be<br />
updated frequently. Van der Hulst (1999) stated that reach<strong>in</strong>g a high level of SA not only<br />
<strong>in</strong>volves cont<strong>in</strong>uous updat<strong>in</strong>g of <strong>in</strong>formation and knowledge, but also confidence <strong>in</strong> the<br />
correctness of both the content and the timel<strong>in</strong>ess of this knowledge. <strong>Driv<strong>in</strong>g</strong> SA has certa<strong>in</strong><br />
characteristics which are relevant for the driv<strong>in</strong>g task. First of all, recogniz<strong>in</strong>g and anticipat<strong>in</strong>g<br />
possibly hazardous situations are important subtasks of driv<strong>in</strong>g (e.g., Vlakveld, 2011), which<br />
can be <strong>in</strong>terpreted as the projection of the future status of the traffic environment. Pradhan,<br />
Pollatschek, Knodler and Fischer (2009) showed that tra<strong>in</strong><strong>in</strong>g can positively <strong>in</strong>fluence novice<br />
drivers’ hazard perception skills, even <strong>in</strong> situations which were not part of the tra<strong>in</strong><strong>in</strong>g.<br />
Furthermore, Jackson, Chapman and Crundall (2009) showed that process<strong>in</strong>g time is an<br />
important factor <strong>in</strong> SA, especially for novice drivers. Novice drivers take longer to process<br />
<strong>in</strong>formation <strong>in</strong> the first two levels of SA, but can reach the same level of SA when given<br />
enough time for these first two stages (perception and comprehension). S<strong>in</strong>ce driv<strong>in</strong>g is partly<br />
a self-paced task, novice drivers might benefit from adopt<strong>in</strong>g a lower speed, s<strong>in</strong>ce this allows<br />
for a longer process<strong>in</strong>g time of possibly hazardous situations and therefore creates the<br />
circumstances for a higher level of SA.<br />
SA was l<strong>in</strong>ked with expectations by Chauv<strong>in</strong> and Saad (2004). They stated that drivers (and<br />
especially experienced drivers) compare the acquired <strong>in</strong>formation to reference situations they<br />
have encountered before, and form expectations about the behaviour of other road users based<br />
on these typical situations. Whenever a roads user behaves differently from what was<br />
predicted, drivers <strong>in</strong>crease their level of “monitor<strong>in</strong>g” or take an anticipatory regulat<strong>in</strong>g<br />
action, such as speed reduction or lane change (Chauv<strong>in</strong> & Saad, 2004). <strong>Unexpected</strong> events<br />
might lead to a (feel<strong>in</strong>g of) decreased SA which drivers try to neutralize by compensatory<br />
behaviour. Conclud<strong>in</strong>g, SA plays an important role <strong>in</strong> driv<strong>in</strong>g, both <strong>in</strong> normal driv<strong>in</strong>g and<br />
when encounter<strong>in</strong>g unexpected, safety-critical situations on the road.
Chapter 2 - Theoretical Framework 43<br />
2.6 Advanced Driver Assistance Systems and behavioural adaptation<br />
As the matrix <strong>in</strong> Figure 2.4 showed, there are many levels at which drivers need to take<br />
decisions, take actions, or perceive their surround<strong>in</strong>gs. For each of these levels, there are ways<br />
of support<strong>in</strong>g drivers <strong>in</strong> hav<strong>in</strong>g a more comfortable, safe or time-efficient experience by<br />
means of <strong>in</strong>telligent <strong>in</strong>-vehicle systems. At the strategic level, a navigation system can help <strong>in</strong><br />
mak<strong>in</strong>g route choices by select<strong>in</strong>g the fastest, shortest, or perhaps the most scenic route<br />
possible, depend<strong>in</strong>g on the driver’s wishes. Technologies for the support of tactical or<br />
operational level driv<strong>in</strong>g tasks are also be<strong>in</strong>g developed. Drivers may for <strong>in</strong>stance be<br />
supported <strong>in</strong> ma<strong>in</strong>ta<strong>in</strong><strong>in</strong>g a constant speed or distance from a predecessor (ACC, Advanced<br />
Cruise Control), <strong>in</strong> the form<strong>in</strong>g of platoons with other vehicles on the road for safe and fuelefficient<br />
driv<strong>in</strong>g, or <strong>in</strong> brak<strong>in</strong>g <strong>in</strong> unexpected situations, such as when a pedestrian suddenly<br />
crosses the street (L<strong>in</strong>dner et al., 2009). These systems are called Intelligent Transport<br />
Systems (ITS). The group of ITS aimed at support<strong>in</strong>g the driv<strong>in</strong>g task at the tactical and<br />
operational level and that is located <strong>in</strong>side the vehicle is often called Advance Driver<br />
Assistance (ADA) Systems.<br />
2.6.1 Different types of ADA Systems<br />
ADA Systems come <strong>in</strong> many varieties, but their common denom<strong>in</strong>ator is that they support the<br />
driv<strong>in</strong>g task at either the tactical or the operational level, and that they are vehicle-based.<br />
ADA Systems can be categorized by means of many aspects, of which we will discuss three<br />
here.<br />
i. Level of support<br />
ADA Systems can differ <strong>in</strong> the level of support they give the driver. They can assist drivers at<br />
three levels: by <strong>in</strong>form<strong>in</strong>g, by support<strong>in</strong>g part of the driv<strong>in</strong>g task (for <strong>in</strong>stance by giv<strong>in</strong>g<br />
counter-pressure on the gas pedal), or by tak<strong>in</strong>g over (part of) the driv<strong>in</strong>g task. In-vehicle<br />
<strong>in</strong>formation systems (IVIS) can provide the driver with <strong>in</strong>formation about a certa<strong>in</strong> aspect of<br />
the driv<strong>in</strong>g task, the driv<strong>in</strong>g situation, or the driver’s current state. For <strong>in</strong>stance, drows<strong>in</strong>ess<br />
detection systems (e.g., Daimler’s [2010] Attention Assist) warn the driver if they detect that<br />
the driver is show<strong>in</strong>g signs of drows<strong>in</strong>ess or sleep<strong>in</strong>ess and <strong>in</strong>form them to take a break.<br />
Systems can also warn drivers <strong>in</strong> the case of speed<strong>in</strong>g (current navigation systems often<br />
<strong>in</strong>clude this feature), or <strong>in</strong> other risky situations. An example which can be useful <strong>in</strong> urban<br />
sett<strong>in</strong>gs is curve speed warn<strong>in</strong>g. These ADA Systems warn drivers when their speed is too<br />
high for an upcom<strong>in</strong>g curve. The system can be based either on a digital map conta<strong>in</strong><strong>in</strong>g road<br />
geometry <strong>in</strong>formation to enable a safe speed estimate, or on particular curves that are known<br />
to be hazardous for speed<strong>in</strong>g (Bishop, 2005, p. 106). Support<strong>in</strong>g systems help the driver by<br />
assist<strong>in</strong>g <strong>in</strong> part of the driv<strong>in</strong>g task, for <strong>in</strong>stance by start<strong>in</strong>g a certa<strong>in</strong> task or prepar<strong>in</strong>g the car<br />
for faster execution of a task. An active gas pedal, for example, can give counter pressure<br />
<strong>in</strong>dicat<strong>in</strong>g that drivers should release the gas pedal slightly (refer to Van Driel, Hoedemaeker<br />
& Van Arem [2007] for more <strong>in</strong>formation on the congestion assistant, an <strong>in</strong>tegrated<br />
application of an active gas pedal). Another application is a lane keep<strong>in</strong>g assistant, which can<br />
assist the driver <strong>in</strong> stay<strong>in</strong>g <strong>in</strong> the correct driv<strong>in</strong>g lane. One of the ways <strong>in</strong> which this system<br />
can assist the driver is by giv<strong>in</strong>g a short torque to the ‘wrong’ direction when drivers tend to<br />
cross their lane boundary (Kullack & Eggert, 2010). This system relies on drivers’ reflexes to<br />
react and execute the desired steer<strong>in</strong>g action <strong>in</strong> the correct direction, and can effectively<br />
prevent the cross<strong>in</strong>g of lane boundaries (Kullack & Eggert, 2010). In urban situations, this
44 <strong>Driv<strong>in</strong>g</strong> <strong>Behaviour</strong> <strong>in</strong> <strong>Unexpected</strong> <strong>Situations</strong><br />
support can take the form of park<strong>in</strong>g assistance, such as the Intelligent Park<strong>in</strong>g Assist, first<br />
<strong>in</strong>troduced by Toyota (Bishop, 2005, p. 112). This system can be used to assist the driver <strong>in</strong><br />
difficult park<strong>in</strong>g situations, although the driver always rema<strong>in</strong>s <strong>in</strong> charge and responsible for<br />
supervis<strong>in</strong>g. F<strong>in</strong>ally, ADA Systems can also take over the driv<strong>in</strong>g task, whether partially or<br />
completely. A well-known application tak<strong>in</strong>g over part of the driv<strong>in</strong>g task is Cruise Control,<br />
which has <strong>in</strong> the last decade been adapted to <strong>in</strong>clude (time) headway (Advanced Cruise<br />
Control, ACC). It does not only ma<strong>in</strong>ta<strong>in</strong> the driver’s own desired speed but also adapts the<br />
vehicle’s speed to the car <strong>in</strong> front, thus always ma<strong>in</strong>ta<strong>in</strong><strong>in</strong>g a m<strong>in</strong>imum distance or time<br />
headway between the two vehicles. ACC has been shown to have positive effects on traffic<br />
safety when used on highways <strong>in</strong> non-congested situations, <strong>in</strong> which cases it also reduces fuel<br />
consumption (SWOV, 2008). An application specifically designed for urban situations is a<br />
pedestrian detection and avoidance system, which brakes when pedestrians are close to the<br />
vehicle. Autonomous driv<strong>in</strong>g systems may also be feasible <strong>in</strong> the future, as the technology to<br />
accomplish autonomous driv<strong>in</strong>g already exists (e.g., Urmson et al., 2008).<br />
ii. <strong>Driv<strong>in</strong>g</strong> task<br />
ADA Systems can provide assistance for tasks at both the tactical and the operational level.<br />
Operational level tasks which can be supported by ADA Systems <strong>in</strong>clude collision avoidance,<br />
brak<strong>in</strong>g, or controll<strong>in</strong>g the steer<strong>in</strong>g wheel. ADA Systems for operational tasks help drivers to<br />
ma<strong>in</strong>ta<strong>in</strong> control over their vehicles. For example, by activat<strong>in</strong>g the brake pedal shortly before<br />
an imped<strong>in</strong>g collision, Brake Assistance can assist <strong>in</strong> immediately apply<strong>in</strong>g the maximum<br />
level of pressure to the brake, due to which a full stop can be reached faster than without this<br />
brake activation. Support for tactical tasks, on the other hand, can <strong>in</strong>clude assistance for<br />
choos<strong>in</strong>g the appropriate lane and ma<strong>in</strong>ta<strong>in</strong><strong>in</strong>g an appropriate distance to surround<strong>in</strong>g<br />
vehicles. Figure 2.11 depicts the relationship between ADA Systems and the tactical and<br />
operational levels of the driv<strong>in</strong>g task.<br />
iii. Level of cooperation<br />
Third, the level of cooperation with other vehicles is part of the classification we use for ADA<br />
Systems. The <strong>in</strong>formation ADA Systems use is gathered by on-board sensors. ADA Systems<br />
can support the driver us<strong>in</strong>g <strong>in</strong>formation from their own sensors (autonomous systems;<br />
Bishop, 2005), or can communicate with other vehicles or beacons <strong>in</strong> the <strong>in</strong>frastructure to<br />
gather <strong>in</strong>formation, <strong>in</strong> addition to us<strong>in</strong>g their own on-board sensors (cooperative systems;<br />
Bishop, 2005). The biggest advantage to communicat<strong>in</strong>g with other vehicles or the<br />
<strong>in</strong>frastructure lies <strong>in</strong> extend<strong>in</strong>g the vehicle’s ‘<strong>in</strong>formation horizon’, enabl<strong>in</strong>g ADA Systems to<br />
have <strong>in</strong>formation about locations beyond the vehicle’s own sensors. This gives opportunities<br />
for proactive support, such as <strong>in</strong>itiat<strong>in</strong>g a slower speed when an obstacle is detected beh<strong>in</strong>d an<br />
upcom<strong>in</strong>g curve, or adopt<strong>in</strong>g larger safety marg<strong>in</strong>s when <strong>in</strong>formation about upcom<strong>in</strong>g bad<br />
weather is transferred from vehicles downstream.
Chapter 2 - Theoretical Framework 45<br />
Figure 2.11 The relationship between ADA Systems and (the operational and tactical<br />
levels of) the driv<strong>in</strong>g task<br />
2.6.2 <strong>Behaviour</strong>al adaptation<br />
One difficulty with ADA Systems as the solutions to traffic problems is that the actual effects<br />
of these systems may rema<strong>in</strong> unknown until they have been implemented at a large scale. It is<br />
estimated by some that the number of collisions will decrease by as much as 69% when us<strong>in</strong>g<br />
an <strong>in</strong>tersection collision warn<strong>in</strong>g system (Liu, Özgüner & Ekicim, 2005). But some<br />
researchers dispute the extent of such positive effects of ADA Systems, especially at first<br />
<strong>in</strong>troduction. For example, Janssen, Wierda and Van der Horst (1995) predict that the<br />
<strong>in</strong>troduction of automated support systems will lead to counterproductive adaptations to the<br />
support system, such as more risk-tak<strong>in</strong>g behaviour and decreased alertness <strong>in</strong> drivers, and to<br />
<strong>in</strong>creased accident severity, before it could lead to the positive effects predicted by others. At<br />
least some of these predictions are supported by results from a driv<strong>in</strong>g simulator study with<br />
Intelligent Speed Adaptation (ISA), conducted by Comte (2000). She found that drivers<br />
showed riskier behaviour when the ISA system was operational. Another study <strong>in</strong>to multitask<strong>in</strong>g<br />
and partial automation (Harris et al., 2002) concludes that automat<strong>in</strong>g one task <strong>in</strong> a<br />
multi-task situation (such as driv<strong>in</strong>g) may decrease task demands and mental workload, but<br />
this does not necessarily lead to an <strong>in</strong>crease <strong>in</strong> performance for the rema<strong>in</strong><strong>in</strong>g subtasks.<br />
Furthermore, the authors suggest that, although operators may report that they experience<br />
lower mental workload when a task is partially automated, it cannot be concluded that task<br />
related fatigue is also decreased (Harris et al., 2002).
46 <strong>Driv<strong>in</strong>g</strong> <strong>Behaviour</strong> <strong>in</strong> <strong>Unexpected</strong> <strong>Situations</strong><br />
The follow<strong>in</strong>g def<strong>in</strong>ition of behavioural adaptation was given by the Organisation for<br />
Economic Cooperation and Development (OECD, 1990): “<strong>Behaviour</strong>al adaptations are those<br />
behaviours which may occur follow<strong>in</strong>g the <strong>in</strong>troduction of changes to the road-vehicle-user<br />
system and which were not <strong>in</strong>tended by the <strong>in</strong>itiators of the change.” (OECD, 1990; p.23).<br />
These adaptations may be either positive or negative. Generally, behavioural adaptation<br />
occurs at the (sub)task which is be<strong>in</strong>g supported by the assistance system. For <strong>in</strong>stance,<br />
Adaptive Cruise Control (ACC), an extension of a normal Cruise Control system that also<br />
helps the driver keep a fixed headway distance to the car <strong>in</strong> front, triggers a change <strong>in</strong> speed<br />
control. In the case of an <strong>in</strong>terven<strong>in</strong>g ACC, this leads to a shorter headway, higher speeds and<br />
lower driver workload assessment (for an overview of studies and a meta-analysis of<br />
behavioural adaptation to ACC, see Dragut<strong>in</strong>ovic, Brookhuis, Hagenzieker & Marchau,<br />
2005). Furthermore, <strong>in</strong> a study <strong>in</strong>to the acceptance of a Lane Departure Warn<strong>in</strong>g Assistance<br />
(LDWA) system, about half of the drivers <strong>in</strong>dicated do<strong>in</strong>g other, non-driv<strong>in</strong>g activities while<br />
driv<strong>in</strong>g with the LDWA system, because of lower levels of effort needed (Katteler, 2003). A<br />
cause for this may be that drivers cont<strong>in</strong>uously monitor their own driv<strong>in</strong>g performance, and<br />
compare the outcome of their actions to the expected results. If this leads to a positive<br />
evaluation of the drivers’ results, the control loop tends to get biased, lead<strong>in</strong>g to a persistently<br />
more positive view of their own performance (Kovordányi, 2005). Many ADA Systems have<br />
some type of effect on mental workload. In cases where mental workload is lowered from an<br />
unsafe high level to a normal level, this effect is positive. However, as was described earlier<br />
<strong>in</strong> this chapter, mental workload can also reach a threshold level below which it becomes too<br />
low to keep up high performance levels. In these cases, decreas<strong>in</strong>g mental workload by tak<strong>in</strong>g<br />
over subtasks from the driver might result <strong>in</strong> attention diversion or decreased vigilance.<br />
Kulmala et al. (2008) identified n<strong>in</strong>e mechanisms through which ITS can impact traffic safety,<br />
such as modification of the behaviour of both users and non-users, modification of exposure<br />
and modification of accident consequence. It is of the utmost importance to keep <strong>in</strong> m<strong>in</strong>d that<br />
behavioural adaptation can occur when develop<strong>in</strong>g new ITS. <strong>Behaviour</strong>al adaptation can also<br />
be def<strong>in</strong>ed as too high acceptance of the system - and thus, over-rely<strong>in</strong>g on it when this is not<br />
safe (Katteler, 2003). Katteler dist<strong>in</strong>guishes three <strong>in</strong>dicators for too high acceptance of a<br />
support system: relaxation, compensation, and substitution. These are <strong>in</strong>dicators that should<br />
be kept <strong>in</strong> m<strong>in</strong>d when evaluat<strong>in</strong>g the usability acceptance of an advanced driver assistance<br />
system.<br />
The level at which the change of behaviour occurs, is important for safety evaluation. A study<br />
conducted by Summala (2002) revealed that behavioural adaptation can occur both at a lower,<br />
perceptual-motor level and at a higher, cognitive level. Change at the first level is suggested<br />
to be more dangerous, because of the subconscious change and the lack of feedback<br />
mechanisms for this level of adaptation (Kovordányi, 2005).<br />
2.6.3 Human-centred design and development of ADA Systems<br />
Conclud<strong>in</strong>g, ADA Systems should be developed with drivers <strong>in</strong> m<strong>in</strong>d, and even more<br />
preferably based on their needs. Different ways exist to study drivers’ preferences, for<br />
example us<strong>in</strong>g questionnaires (Van Driel, 2007). This research tool can adequately give<br />
<strong>in</strong>sight <strong>in</strong>to drivers’ op<strong>in</strong>ions and attitudes, and this plays a major role <strong>in</strong> the understand<strong>in</strong>g of<br />
acceptance and market deployment. Another approach to <strong>in</strong>corporate driver’s preferences <strong>in</strong>to<br />
a human-centred design of ADA Systems was developed by Tideman, Van der Voort and Van<br />
Arem (2010). They used virtual reality simulation and gam<strong>in</strong>g pr<strong>in</strong>ciples <strong>in</strong> a design process<br />
that gave users an active role <strong>in</strong> select<strong>in</strong>g their preferred options for a lane-keep<strong>in</strong>g system.
Chapter 2 - Theoretical Framework 47<br />
Both approaches give a lot of <strong>in</strong>formation on drivers’ preferences. However, drivers are not<br />
always fully capable of formulat<strong>in</strong>g their own safety needs. This is related to a number of<br />
aspects of the driv<strong>in</strong>g task and the range of situations <strong>in</strong> which this task is executed. Only a<br />
very select number of errors, lapses and mistakes lead to safety conflicts, and <strong>in</strong> turn a very<br />
small portion of conflicts is so severe that it leads to an actual accident. Although conflicts<br />
and accidents orig<strong>in</strong>ate from similar situations, there are only a few moments that startle<br />
drivers and make them conscious of their (possibly risky) driv<strong>in</strong>g style. After all, if everyth<strong>in</strong>g<br />
seems to go right, there might not be a reason to start doubt<strong>in</strong>g ones own function<strong>in</strong>g.<br />
Furthermore, studies of drivers' assessments of their own driv<strong>in</strong>g performance show that most<br />
drivers believe they drive better than their peers (e.g., Goszczynska & Roslan, 1989; Lajunen,<br />
Corry, Summala & Hartley, 1998). Moreover, we described earlier how the different levels of<br />
task execution (Rasmussen, 1987) relate to levels of more or less automatic task execution.<br />
Experienced drivers are no longer consciously th<strong>in</strong>k<strong>in</strong>g about every move to make and every<br />
action to execute, but rather execute many tasks at the skill-based or rule-based level. This is<br />
very positive <strong>in</strong> the light of efficient use of attentional resources. However, it leads to<br />
situations <strong>in</strong> which drivers are no longer conscious of operational actions. Conclud<strong>in</strong>g,<br />
although drivers might be able to formulate their attitudes and desires, they are not always<br />
capable of identify<strong>in</strong>g their (safety) needs.<br />
This thesis describes a series of experiments with the aim of identify<strong>in</strong>g these needs, by<br />
means of determ<strong>in</strong><strong>in</strong>g actual driv<strong>in</strong>g behaviour <strong>in</strong> safety-critical situations. With this<br />
<strong>in</strong>formation, the development of ADA Systems can be based on driv<strong>in</strong>g behaviour safety<br />
needs, rather than on eng<strong>in</strong>eers’ <strong>in</strong>terpretations of drivers’ needs.<br />
2.7 Framework<br />
This thesis focuses on driv<strong>in</strong>g behaviour at urban <strong>in</strong>tersections, and specifically the bottom-up<br />
<strong>in</strong>teraction between operational and tactical driv<strong>in</strong>g task at this location. Bottom-up<br />
<strong>in</strong>teraction between driv<strong>in</strong>g tasks occurs when expectations are not met and a safe or efficient<br />
outcome of the situation requires compensation behaviour. Mental workload and the severity<br />
of these situations can have an effect on this bottom-up <strong>in</strong>teraction. This <strong>in</strong>teraction is<br />
depicted graphically <strong>in</strong> Figure 2.12. The solid, red l<strong>in</strong>e <strong>in</strong> Figure 2.12 encloses the focus of the<br />
experimental parts of this thesis.
48 <strong>Driv<strong>in</strong>g</strong> <strong>Behaviour</strong> <strong>in</strong> <strong>Unexpected</strong> <strong>Situations</strong><br />
Figure 2.12 Theoretical Framework. The ma<strong>in</strong> focus of this thesis is on the bottom-up<br />
<strong>in</strong>teraction between the operational and tactical level, and on the <strong>in</strong>fluence of mental<br />
workload and the severity of unexpected situations on this <strong>in</strong>teraction (solid red l<strong>in</strong>e)
Chapter 3<br />
Research tools<br />
This thesis is concerned with compensation behaviour dur<strong>in</strong>g and after safety-critical and<br />
unexpected events, and with the <strong>in</strong>fluence of mental workload, event urgency and driver<br />
characteristics on these compensatory actions. In order to determ<strong>in</strong>e this complex <strong>in</strong>teraction<br />
between the driv<strong>in</strong>g task, driver characteristics, expectancies, mental workload, and the<br />
situations encountered, a large number of measures need to be taken dur<strong>in</strong>g controlled<br />
experiments. All aspects of this complex <strong>in</strong>teraction have one or more <strong>in</strong>dicators which can be<br />
measured by different research tools. In this chapter we describe tools that can be used to<br />
record these <strong>in</strong>dicators, and give an overview of the research tools that we used for our<br />
experiments.<br />
49
50 <strong>Driv<strong>in</strong>g</strong> <strong>Behaviour</strong> <strong>in</strong> <strong>Unexpected</strong> <strong>Situations</strong>
Chapter 3 - Research Tools 51<br />
3.1 Measur<strong>in</strong>g driv<strong>in</strong>g behaviour<br />
D<br />
riv<strong>in</strong>g behaviour can be measured by us<strong>in</strong>g a number of different tools. Four of the<br />
most used research methods for driv<strong>in</strong>g behaviour research are Field Operational<br />
Tests (FOT’s), experiments with <strong>in</strong>strumented vehicles on test tracks, driv<strong>in</strong>g<br />
simulator experiments, and self report measures. They are different <strong>in</strong> external validity and<br />
controllability of the situations studied, and <strong>in</strong> the aggregation level of <strong>in</strong>vestigated driv<strong>in</strong>g<br />
behaviour for which their use is appropriate. In fact, there often is a trade-off between validity<br />
of the situations studied and controllability of these situations, which is graphically depicted<br />
<strong>in</strong> Figure 3.1. Self-report measures are not depicted <strong>in</strong> this figure, s<strong>in</strong>ce they measure<br />
attitudes, experience and/ or preferences rather than behaviour and actions related to certa<strong>in</strong><br />
traffic situations.<br />
Figure 3.1 External validity and controllability of situations studied <strong>in</strong> driv<strong>in</strong>g behaviour<br />
research (adapted from Anund & Kircher, 2009)<br />
External validity refers to level at which the methods and tools of a study approximate the real<br />
life situation that is be<strong>in</strong>g studied (Brewer, 2000); <strong>in</strong> other words, it describes the extent to<br />
which the ‘looks’ of a research tool represent reality. External validity is a specifically<br />
important constra<strong>in</strong>t <strong>in</strong> the case of simulator studies, and will therefore be discussed more<br />
deeply <strong>in</strong> the follow<strong>in</strong>g paragraph (3.1.3) on driv<strong>in</strong>g simulators. Controllability of a study<br />
refers to the degree of control that the researcher exerts or can exert over the study. This is not<br />
only related to the driv<strong>in</strong>g scenario but also to the selection of participants and their<br />
<strong>in</strong>formation and preparation.<br />
In this section, all three types of research tools will be described, as well as their advantages<br />
and drawbacks for different types of behavioural research.
52 <strong>Driv<strong>in</strong>g</strong> <strong>Behaviour</strong> <strong>in</strong> <strong>Unexpected</strong> <strong>Situations</strong><br />
3.1.1 Instrumented vehicles: road and test tracks<br />
In an <strong>in</strong>strumented vehicle, sensors record the actions undertaken by one driver. These records<br />
can also <strong>in</strong>clude characteristics of the driv<strong>in</strong>g situation, so that location on the road, steer<strong>in</strong>g<br />
wheel angle, speed, (time and distance) headway, performance on secondary tasks, video<br />
record<strong>in</strong>gs of participants’ expressions, eye movement data, vehicle environment and many<br />
other variables can be recorded simultaneously. Due to the fact that these variables can be<br />
comb<strong>in</strong>ed <strong>in</strong> analyses, it is possible to determ<strong>in</strong>e which factors lead to certa<strong>in</strong> situations, for<br />
<strong>in</strong>stance driver distraction or traffic conflicts.<br />
Instrumented vehicles can be used <strong>in</strong> two different sett<strong>in</strong>gs: on real roads and on test tracks.<br />
The controllability and validity of the studies differ between test tracks and real-world<br />
situations. The level of control that can be exerted over scenarios, events, driv<strong>in</strong>g<br />
circumstances and participant safety is higher on a test track, but this goes at the cost of<br />
external validity. External validity is higher when driv<strong>in</strong>g on real roads, especially if the test<br />
track has an unrealistic shape (for <strong>in</strong>stance, oval tracks). In both naturalistic driv<strong>in</strong>g studies<br />
and FOTs, drivers have free choice of routes and other aspects of driv<strong>in</strong>g behaviour, so<br />
researchers exert no control over the driv<strong>in</strong>g scenarios, so controllability is lower than <strong>in</strong><br />
strictly experimental sett<strong>in</strong>gs.<br />
Two types of studies can be performed with <strong>in</strong>strumented vehicles on the road: naturalistic<br />
driv<strong>in</strong>g studies or Field Operational Tests (FOTs). Naturalistic driv<strong>in</strong>g studies focus on<br />
normal driv<strong>in</strong>g behaviour <strong>in</strong> everyday (current) circumstances. These studies are large-scale<br />
tests <strong>in</strong> which participants use equipped vehicles for their daily lives and data from their<br />
driv<strong>in</strong>g behaviour are collected. The first large-scale naturalistic driv<strong>in</strong>g study was the 100-car<br />
study (e.g., Klauer, D<strong>in</strong>gus, Neale, Sudweeks & Ramsey, 2006; Neale, Klauer, Knipl<strong>in</strong>g,<br />
D<strong>in</strong>gus, Holbrook & Petersen, 2002). In this study, 109 primary drivers (241 drivers <strong>in</strong> total)<br />
drove 100 cars over a period of roughly one year <strong>in</strong> the DC/ Northern Virg<strong>in</strong>ia area. Data<br />
were recorded over approximately 3.5 million vehicle kilometres (2 million miles) with 761<br />
near-crashes and 8,295 <strong>in</strong>cidents, and <strong>in</strong>cluded <strong>in</strong>ter alia digital video, GPS, front and rear<br />
sensors and lane track<strong>in</strong>g data (VTTI, 2010).<br />
Field Operational Tests focus on the effects of equipp<strong>in</strong>g vehicles with ADA Systems or other<br />
Intelligent Transport Systems (ITS). Examples of recent FOT’s are euroFOT (2010) and<br />
Volvo’s Truck Field Operational Test (Volvo Trucks, 2005). The ITS tested <strong>in</strong> FOT’s range<br />
from safety systems to systems for more efficient driv<strong>in</strong>g and comfort <strong>in</strong>creas<strong>in</strong>g systems. For<br />
<strong>in</strong>stance, the trucks <strong>in</strong> the Volvo Trucks FOT were equipped with Advanced Cruise Control<br />
(ACC), a Rear-End Collision Warn<strong>in</strong>g System (CWS), an Electronically Controlled Brake<br />
System (ECBS) and new generation disk brakes; <strong>in</strong> euroFOT, 1,000 cars were equipped with<br />
eight different systems for safer and more efficient driv<strong>in</strong>g.<br />
Both <strong>in</strong> FOT’s and <strong>in</strong> naturalistic driv<strong>in</strong>g studies, subtasks at the tactical and operational task<br />
levels can be studied <strong>in</strong> a naturalistic environment. Strategic choices such as route plann<strong>in</strong>g<br />
can be <strong>in</strong>ferred <strong>in</strong>directly from the recorded data.<br />
Instrumented vehicles can also be used for experiments on closed-circuit test tracks. In this<br />
situation, strategic choices are not part of the task, but tactical and operational tasks can be<br />
recorded both from <strong>in</strong>side and from outside the vehicle. Furthermore, the situations<br />
encountered by the driver can be controlled and monitored more closely than on real roads,
Chapter 3 - Research Tools 53<br />
s<strong>in</strong>ce situations can be staged and repeated better than on real roads. However, this can go at<br />
the expense of external validity.<br />
3.1.2 <strong>Driv<strong>in</strong>g</strong> simulator<br />
The second tool described here is a driv<strong>in</strong>g simulator. A driv<strong>in</strong>g simulator is a mock-up of a<br />
vehicle, surrounded by screens on which a virtual environment is projected. By controll<strong>in</strong>g the<br />
vehicle actuators (steer<strong>in</strong>g wheel, brake pedal, throttle, gears) drivers can control the vehicle<br />
and thus ‘drive through’ the simulated environment. A driv<strong>in</strong>g simulator can easily be used to<br />
measure all types of tactical and operational driv<strong>in</strong>g behaviour, such as speed, lateral position,<br />
pressure on the gas pedal et cetera. While it is also possible to measure strategic behaviour, <strong>in</strong><br />
practice this is more difficult to realize. The strategic level describes higher level goals<br />
determ<strong>in</strong>ed by the driver, and goals of this type are difficult to <strong>in</strong>fluence and can only be<br />
<strong>in</strong>ferred <strong>in</strong>directly from the registered driv<strong>in</strong>g behaviour. Moreover, mak<strong>in</strong>g appropriate route<br />
choice decisions usually requires a certa<strong>in</strong> level of familiarity with an environment, and <strong>in</strong><br />
order to study this <strong>in</strong> an experimental sett<strong>in</strong>g all participants have to obta<strong>in</strong> the same level of<br />
familiarity before the study.<br />
<strong>Driv<strong>in</strong>g</strong> <strong>in</strong> a driv<strong>in</strong>g simulator is always safe from a traffic safety view, because a manoeuvre<br />
that would be considered unsafe <strong>in</strong> real life will never result <strong>in</strong> a real accident <strong>in</strong> the simulated<br />
environment. Furthermore, the environment and the behaviour of the other road users can be<br />
fully controlled, so situations are highly reproducible and controllable. Simulated situations<br />
can be repeated many times to set expectations on the side of the participants, and all<br />
participants can encounter exactly the same situations. Also, anyth<strong>in</strong>g can be simulated, as<br />
long as the software can calculate and visualize it. In other words, everyth<strong>in</strong>g, <strong>in</strong>clud<strong>in</strong>g<br />
situations which are non-exist<strong>in</strong>g or dangerous <strong>in</strong> real life, can be studied.<br />
On the other hand, this is also the ma<strong>in</strong> disadvantage of driv<strong>in</strong>g simulator experiments. S<strong>in</strong>ce<br />
safety is not a critical issue <strong>in</strong> driv<strong>in</strong>g simulator experiments, participants may behave <strong>in</strong> a<br />
different way <strong>in</strong> simulated situations than they would normally do <strong>in</strong> similar real-world<br />
situations. Moreover, most simulators, except for highly advanced driv<strong>in</strong>g simulators with<br />
mov<strong>in</strong>g bases, do not capture the movement of a driv<strong>in</strong>g vehicle correctly, and this might also<br />
<strong>in</strong>fluence the participants’ behaviour. Therefore, the validity of driv<strong>in</strong>g simulator research is<br />
an issue that needs close attention when design<strong>in</strong>g an experiment (Kapte<strong>in</strong>, Theeuwes & Van<br />
der Horst, 1996).<br />
Kapte<strong>in</strong> et al. (1996) describe two types of driv<strong>in</strong>g simulator validity that can be<br />
dist<strong>in</strong>guished. External validity refers to the looks of the simulator and relates to the<br />
simulator’s fidelity. The simulator sound and level of detail <strong>in</strong> the virtual environment also<br />
contribute to the simulator’s external validity. Internal validity, on the other hand, is the<br />
predictive value that the results from studies <strong>in</strong> the driv<strong>in</strong>g simulator have. This k<strong>in</strong>d of<br />
validity can be either relative (the type of driv<strong>in</strong>g behaviour and the directions of behavioural<br />
changes are similar to those <strong>in</strong> real life), or absolute (the behaviour shown by participants <strong>in</strong><br />
the driv<strong>in</strong>g simulator resembles the behaviour that people <strong>in</strong> real life would show <strong>in</strong> a similar<br />
situation). When design<strong>in</strong>g and experiment, one has to determ<strong>in</strong>e which type of validity is<br />
needed to get generable results.<br />
The aforementioned research tools differ <strong>in</strong> controllability and external validity, as well as <strong>in</strong><br />
other characteristics, such as participant safety, deployment possibilities, time frames and
54 <strong>Driv<strong>in</strong>g</strong> <strong>Behaviour</strong> <strong>in</strong> <strong>Unexpected</strong> <strong>Situations</strong><br />
other aspects of experimental setups. Table 3.1 gives an overview of the characteristics which<br />
are most relevant to our research for each research tool which was discussed.<br />
3.1.3 Self-report measures<br />
A third tool used for behavioural studies is a self-report measure, such as a questionnaire.<br />
Self-report measures can be used to study drivers’ op<strong>in</strong>ions or experiences as well as their<br />
(self-reported) driv<strong>in</strong>g styles, and reflections on aspects of the driv<strong>in</strong>g task. They record their<br />
measures on an aggregated level, mean<strong>in</strong>g that the measurements are not sensitive to shortterm<br />
changes but give <strong>in</strong>sight <strong>in</strong>to longer-term aspects of driv<strong>in</strong>g behaviour. Self-report<br />
measures are often used <strong>in</strong> conjunction with the previously mentioned tools, <strong>in</strong>strumented<br />
vehicles and driv<strong>in</strong>g simulators.<br />
Self-report measures can consist of questionnaires and/ or rat<strong>in</strong>g scales. A commonly used<br />
questionnaire on driv<strong>in</strong>g style is the <strong>Driv<strong>in</strong>g</strong> Style Questionnaire (DSQ), developed by<br />
French, West, Elander and Wild<strong>in</strong>g (1993). The type of driv<strong>in</strong>g style is determ<strong>in</strong>ed by<br />
questions about 6 dimensions related to driv<strong>in</strong>g style: speed, calmness, social resistance,<br />
hesitancy, focus, plann<strong>in</strong>g and deviance. Answers to questions related to, for <strong>in</strong>stance, choice<br />
of speed, headway, seat belt use and violations are related to these dimensions and give<br />
<strong>in</strong>sight <strong>in</strong>to the driv<strong>in</strong>g style adopted by the participant. Another well-known questionnaire is<br />
the Manchester <strong>Driv<strong>in</strong>g</strong> <strong>Behaviour</strong> Questionnaire (DBQ), developed by Reason, Manstead,<br />
Stradl<strong>in</strong>g, Baxter and Campbell (1990), and validated for <strong>in</strong>ternational use by Åberg and<br />
Rimmo (1998), Blockey and Hartley (1995), Lajunen, Parker and Summala (1999), and<br />
Mesken, Lajunen and Summala (2002), among others. The DBQ measures the concepts of<br />
errors, lapses and violations <strong>in</strong> driv<strong>in</strong>g behaviour by ask<strong>in</strong>g drivers several questions about the<br />
frequency of certa<strong>in</strong> types of behaviour, such as sound<strong>in</strong>g a horn out of annoyance, overtak<strong>in</strong>g<br />
on the <strong>in</strong>side or forgett<strong>in</strong>g the location of their parked car. Other self-report measures exist,<br />
for <strong>in</strong>stance on the subjective experience of mental workload (please refer to Section 3.2 for<br />
more <strong>in</strong>formation on these subjective measures for mental workload).<br />
Questionnaires are highly controllable and reproducible, if the validity and applicability to a<br />
certa<strong>in</strong> type of study and research question are guarded. However, a questionnaire can only<br />
reveal <strong>in</strong>formation about conscious decisions, actions and processes, s<strong>in</strong>ce participants need to<br />
verbalize decisions that might be made while driv<strong>in</strong>g. Operational actions are mostly<br />
performed <strong>in</strong> a rule-based manner, which often does not require conscious decision mak<strong>in</strong>g.<br />
Questionnaires are therefore very useful to study higher level variables such as personality,<br />
experiences, expectations or attitudes, but are less useful for determ<strong>in</strong><strong>in</strong>g the operational level<br />
behaviour that would be exhibited <strong>in</strong> a certa<strong>in</strong> situation, such as the level at which the gas<br />
pedal is pressed or the direction and duration of glances. Furthermore, questionnaires or<br />
surveys can convey correlations but not causal relations.<br />
Rat<strong>in</strong>g scales can have different dimensions. Some take the form of a s<strong>in</strong>gle dimension along<br />
which the respondent is asked to <strong>in</strong>dicate how they rate a particular aspect. Others <strong>in</strong>clude<br />
more dimensions. For <strong>in</strong>stance, <strong>in</strong> the NASA Task Load Index (NASA-TLX) rat<strong>in</strong>g scale<br />
(Hart & Staveland, 1988), drivers give a subjective rat<strong>in</strong>g of experienced workload on six<br />
rat<strong>in</strong>g scales: Mental Demands, Physical Demands, Temporal Demands, Own Performance,<br />
Effort, and Frustration (Hart & Staveland, 1988). These multi-dimensional rat<strong>in</strong>gs can be<br />
comb<strong>in</strong>ed to calculate an overall level of perceived mental workload. Oborne (1976)<br />
dist<strong>in</strong>guishes analogue and category rat<strong>in</strong>g scales. With analogue scales, respondents mark
Chapter 3 - Research Tools 55<br />
their rat<strong>in</strong>g of the <strong>in</strong>vestigated aspect on a straight l<strong>in</strong>e with a fixed length. Analogue scales<br />
can provide <strong>in</strong>formation on an <strong>in</strong>terval scale, but only if participants use both the scale<br />
extremes, and not just the centre of the scale. Category scales divide the one scale <strong>in</strong>to several<br />
categories from which participants choose the one which best describes their rat<strong>in</strong>g. This scale<br />
provides <strong>in</strong>formation on an ord<strong>in</strong>al scale rather than an <strong>in</strong>terval scale, which might complicate<br />
statistical comparison and <strong>in</strong>terpretation.<br />
3.2 Mental workload measurements<br />
In Chapter 2, we def<strong>in</strong>ed mental workload as “the specification of the amount of <strong>in</strong>formation<br />
process<strong>in</strong>g capacity that is used for task performance” (De Waard, 1996). Any task which<br />
requires a certa<strong>in</strong> amount of attention or concentration puts a certa<strong>in</strong> load on the available<br />
cognitive capacities of the driver; this is called mental workload. <strong>Driv<strong>in</strong>g</strong> <strong>in</strong> itself br<strong>in</strong>gs along<br />
with it a certa<strong>in</strong> level of workload, comprised of physical, visual and cognitive load.<br />
Secondary tasks can possibly <strong>in</strong>terfere with the ma<strong>in</strong> goal of driv<strong>in</strong>g safely, especially if the<br />
type of workload is similar to the type of workload placed on the driver by the driv<strong>in</strong>g task<br />
itself.<br />
There are four ma<strong>in</strong> methods for mental workload assessment (Meshkati, Hancock, Rahimi &<br />
Dawes, 1995). All measures are related to the ways <strong>in</strong> which operators can react to <strong>in</strong>creased<br />
mental workload. Operators can feel an <strong>in</strong>crease <strong>in</strong> mental workload, show physiological<br />
signs that stem from <strong>in</strong>creased mental workload, and/ or show decreased task performance.<br />
Also, performance on secondary tasks that do not <strong>in</strong>terfere with the primary task of safe<br />
driv<strong>in</strong>g can decrease. Chapter 2 described how effects can differ from one situation to another<br />
and from one person to another. These differences depend largely on <strong>in</strong>dividual strategies and<br />
the region of performance <strong>in</strong>volved, and measurements of the effects need to be comb<strong>in</strong>ed to<br />
complement each other (De Waard, 1996).<br />
3.2.1 Primary task performance<br />
Increased mental workload can impair driv<strong>in</strong>g performance <strong>in</strong> certa<strong>in</strong> situations. Measures<br />
sensitive to <strong>in</strong>creases <strong>in</strong> mental workload are the Standard Deviation of Lateral Position<br />
(SDLP), the Standard Deviation of Steer<strong>in</strong>g Wheel movements (SDSTW) (De Waard, 1996),<br />
and the Steer<strong>in</strong>g Wheel Reversal Rate (SRR) (Macdonald & Hoffmann, 1980); these are all<br />
measures of tasks at the operational level. SDLP is a measure for the amount of serv<strong>in</strong>g a<br />
driver shows and it often used for mental workload measurements, although <strong>in</strong>creas<strong>in</strong>g mental<br />
workload was not always found to lead to <strong>in</strong>creas<strong>in</strong>g SDLP (De Waard, 1996). SRR is<br />
calculated by the number of times per m<strong>in</strong>ute that the direction of the steer<strong>in</strong>g wheel changes<br />
(Macdonald & Hoffman, 1980). Both SRR and SDSTW is always measured at straight road<br />
sections, and an <strong>in</strong>crease <strong>in</strong> mental workload is usually found to lead to an <strong>in</strong>crease <strong>in</strong> the SD<br />
of movements of the steer<strong>in</strong>g wheel (De Waard, 1996). The duration of glances to the mirror<br />
(mirror check<strong>in</strong>g) is also sensitive to changes <strong>in</strong> mental workload (Fairclough, Ashby &<br />
Parkes, 1993).
Table 3.1 Advantages and disadvantages of different driv<strong>in</strong>g behaviour studies<br />
<strong>Driv<strong>in</strong>g</strong> simulator<br />
Instrumented vehicle -<br />
test track<br />
Instrumented vehicle -<br />
real road<br />
Research characteristic<br />
Low-moderate: virtual<br />
environment, participants<br />
know they are be<strong>in</strong>g observed,<br />
no actual safety-critical<br />
situations, but simulation of<br />
these situations can have high<br />
Moderate: participants know<br />
they are be<strong>in</strong>g observed; tracks<br />
not always realistic<br />
External validity* Very high<br />
validity<br />
Very high control over<br />
scenario, e.g. route, weather,<br />
sight, tim<strong>in</strong>g and events<br />
Moderate control over other<br />
road users and (staged) events<br />
No control over driv<strong>in</strong>g<br />
scenario, route or any other<br />
driv<strong>in</strong>g circumstance<br />
Control over driv<strong>in</strong>g<br />
scenario*<br />
Scenarios can be repeated<br />
Tactical and operational task<br />
levels<br />
All measurements possible,<br />
will probably not <strong>in</strong>fluence<br />
validity<br />
No safety-critical issues, other<br />
than possible simulator<br />
sickness<br />
Several m<strong>in</strong>utes to several<br />
hours<br />
due to safety restrictions<br />
Scenarios can not be repeated<br />
Repeatability of events No control over events exactly but repetition can be<br />
approximated<br />
Tactical and operational task<br />
levels; strategic choices can be Tactical and operational task<br />
Task levels<br />
<strong>in</strong>ferred <strong>in</strong>directly from levels<br />
recorded data<br />
No measurements other than<br />
Obtrusive measurements<br />
Use of mental workload driv<strong>in</strong>g performance possible<br />
possible but might <strong>in</strong>fluence<br />
measurements*<br />
(they rem<strong>in</strong>d participants of<br />
validity<br />
be<strong>in</strong>g observed)<br />
Participants responsible for<br />
Participant safety*<br />
their own safety, no<br />
Test track safety necessary<br />
precautions necessary<br />
Average time duration of<br />
Several m<strong>in</strong>utes to several<br />
Several months<br />
experiments<br />
hours<br />
* Information <strong>in</strong> these cells was obta<strong>in</strong>ed from (Anund & Kircher, 2009)
Chapter 3 - Research Tools 57<br />
F<strong>in</strong>ally, Brookhuis, De Waard and Mulder (1994) developed a measurement of mental<br />
workload by means of a car follow<strong>in</strong>g task. Participants were required to follow a lead<strong>in</strong>g<br />
vehicle at a safe and constant distance <strong>in</strong> real traffic. The lead<strong>in</strong>g vehicle’s speed was preset<br />
by the researchers, and would fluctuate with<strong>in</strong> a preset range of speeds. Reaction times and<br />
coherence and phase shift of the driver’s response to the lead vehicle’s chang<strong>in</strong>g speed were<br />
recorded and used as a measurement of impaired driv<strong>in</strong>g. Car-follow<strong>in</strong>g is a tactical subtask<br />
<strong>in</strong> the hierarchical model of the driv<strong>in</strong>g task (Michon, 1971). It is <strong>in</strong>cluded <strong>in</strong> a list of major<br />
mental workload measurement techniques by De Waard (1996), although one could argue that<br />
it is rather a measurement of driver distraction (through impaired driv<strong>in</strong>g) than of mental<br />
workload (for a discussion on the similarities and differences between mental workload and<br />
driver distraction, see Section 2.4).<br />
Compensatory driv<strong>in</strong>g behaviour can also be found, and is often seen as a way to reduce the<br />
demands of the driv<strong>in</strong>g task. When task demands <strong>in</strong>crease, a decrease <strong>in</strong> driv<strong>in</strong>g speed can be<br />
found (e.g., Alm & Nilsson, 1994; Lansdown, Brook-Carter & Kersloot, 2004). However, <strong>in</strong> a<br />
study described by Horrey and Simons (2007), no evidence was found that drivers adjust their<br />
safety marg<strong>in</strong>s dur<strong>in</strong>g tactical driv<strong>in</strong>g. In fact, the authors suggest that dur<strong>in</strong>g tactical driv<strong>in</strong>g,<br />
<strong>in</strong> which drivers accommodate multiple compet<strong>in</strong>g goals and monitor a dynamic driv<strong>in</strong>g<br />
situation, drivers expose themselves to greater risk <strong>in</strong> dual-task conditions than <strong>in</strong> s<strong>in</strong>gle-task<br />
conditions. The difference with earlier studies lies <strong>in</strong> the fact that those studies often ask<br />
drivers to perform steady-state follow<strong>in</strong>g tasks which are located at the operational level,<br />
rather than tactical driv<strong>in</strong>g tasks.<br />
3.2.2 Secondary task performance<br />
When mental workload <strong>in</strong>creases, task performance may decrease. This does not only occur<br />
for the primary task of driv<strong>in</strong>g, but also for secondary tasks. Any trade-off between driv<strong>in</strong>g<br />
performance and secondary task performance depends highly on the <strong>in</strong>structions given to the<br />
driver and the level of obtrusiveness of the secondary task. Embedded tasks are considered to<br />
be the best secondary tasks for assessment of the mental workload stemm<strong>in</strong>g from a certa<strong>in</strong><br />
driv<strong>in</strong>g situation, due to their low primary task <strong>in</strong>trusion (De Waard, 1996). Two examples of<br />
such embedded tasks are car-follow<strong>in</strong>g and mirror check<strong>in</strong>g, and an <strong>in</strong>crease <strong>in</strong> workload can<br />
be determ<strong>in</strong>ed by a delay <strong>in</strong> these tasks.<br />
There are however secondary tasks that are not obtrusive and are also not embedded <strong>in</strong> the<br />
driv<strong>in</strong>g task. A number of secondary tasks have been developed for mental workload<br />
assessment. We will describe four of them here: the Paced Auditory Serial Addition Task<br />
(PASAT), the Lane Change Task (LCT), the time perception task, and the Peripheral<br />
Detection Task (PDT).<br />
First, the Paced Auditory Serial Addition Task (PASAT), developed by Gronwall (1977) is a<br />
secondary task assess<strong>in</strong>g the speed of auditory <strong>in</strong>formation process<strong>in</strong>g and work<strong>in</strong>g memory.<br />
Participants listen to an audio record<strong>in</strong>g with s<strong>in</strong>gle digit numbers, which are presented at<br />
fixed time <strong>in</strong>tervals, and are asked to add the two most recently presented numbers. For<br />
<strong>in</strong>stance, if the sequence is 3 - 5 - 1 - 2 - 8, the correct response would be 8 (3 + 5), 6 (5 + 1),<br />
3 (1 + 2), and 10 (2 + 8). The PASAT requires use of work<strong>in</strong>g memory, attention and<br />
arithmetic capabilities. See Tombaugh (2006) for an overview of studies <strong>in</strong>to the PASAT.
58 <strong>Driv<strong>in</strong>g</strong> <strong>Behaviour</strong> <strong>in</strong> <strong>Unexpected</strong> <strong>Situations</strong><br />
Second, the Lane Change Test (LCT) (Mattes, 2003) is a quick and easy methodology that<br />
has been standardized by ISO standards (ISO, 2008), and that is <strong>in</strong>tended to assess task<br />
demand result<strong>in</strong>g from <strong>in</strong>-vehicle systems. Drivers repeatedly perform lane changes when<br />
prompted by signs at the side of the road. Participants’ lane change performance is determ<strong>in</strong>ed<br />
by compar<strong>in</strong>g the driven path from the (predeterm<strong>in</strong>ed) ideal lane change path. The extent to<br />
which the dual task condition results <strong>in</strong> <strong>in</strong>creased mental workload or driver distraction is<br />
supposedly reflected <strong>in</strong> the mean deviation between the actual driven course and the ideal<br />
path (mean deviation <strong>in</strong> lane change path, MDEV).<br />
Third, the time perception method was orig<strong>in</strong>ally developed for mental workload assessment<br />
<strong>in</strong> aviation research (Hart, 1978), and its application to simulated car driv<strong>in</strong>g has recently<br />
been validated <strong>in</strong> an experiment (Baldauf, Burgard & Wittmann, 2009). Participants are asked<br />
dur<strong>in</strong>g driv<strong>in</strong>g to estimate the duration of a time <strong>in</strong>terval, and to respond to an acoustic signal<br />
after the number of seconds <strong>in</strong> this time <strong>in</strong>terval has passed. By press<strong>in</strong>g a button mounted on<br />
the steer<strong>in</strong>g wheel, they can state when they th<strong>in</strong>k the time <strong>in</strong>terval has passed s<strong>in</strong>ce the<br />
acoustic signal. In the mean time, participants are asked distract<strong>in</strong>g questions to prevent them<br />
from directly count<strong>in</strong>g the seconds. Baldauf et al. (2009) chose a time <strong>in</strong>terval of 17 seconds.<br />
They found that the length of <strong>in</strong>tervals <strong>in</strong>crease with higher mental workload. Furthermore,<br />
the authors found that the time-production task was sensitive to workload level changes and<br />
did not <strong>in</strong>fluence the driv<strong>in</strong>g task (i.e., the measure is unobtrusive).<br />
F<strong>in</strong>ally, the Peripheral Detection Task (PDT) is based on the fact that visual attention narrows<br />
as workload <strong>in</strong>creases (Van W<strong>in</strong>sum, Martens & Herland, 1999). Orig<strong>in</strong>ally, the PDT was<br />
applied <strong>in</strong> a driv<strong>in</strong>g simulator sett<strong>in</strong>g with the stimulus presented on the simulator screen (Van<br />
W<strong>in</strong>sum et al., 1999). In later studies, drivers wear a headband with a LED <strong>in</strong> their peripheral<br />
field, so that the LED moves with the drivers’ head movements (Van der Horst & Martens,<br />
2009). The left part of Figure 3.2 shows the headband with the LED. The LED lights up<br />
randomly every 3 to 5 seconds. Drivers also wear a small switch attached to their <strong>in</strong>dex<br />
f<strong>in</strong>ger, which they are <strong>in</strong>structed to press every time they notice the LED light. In general, the<br />
<strong>in</strong>dex f<strong>in</strong>ger of the dom<strong>in</strong>ant hand is chosen for this, unless the experimental setup does not<br />
allow for this (e.g., with manual transmission). However, <strong>in</strong> certa<strong>in</strong> situations, such as <strong>in</strong> a<br />
simulator or vehicle with right-hand manual transmission, drivers cannot constantly have their<br />
right hand located on the steer<strong>in</strong>g wheel, due to which they cannot press their right <strong>in</strong>dex<br />
f<strong>in</strong>ger aga<strong>in</strong>st the steer<strong>in</strong>g wheel whenever they notice the LED light<strong>in</strong>g up. In order to<br />
register all reactions correctly, the switch is therefore placed on the <strong>in</strong>dex f<strong>in</strong>ger of the left<br />
hand <strong>in</strong> these cases (right part of Figure 3.2).<br />
Figure 3.2 Headband with LED <strong>in</strong> peripheral vision of participant (left); PDT switch on<br />
left <strong>in</strong>dex f<strong>in</strong>ger (right)
Chapter 3 - Research Tools 59<br />
Mental workload can be determ<strong>in</strong>ed with the PDT by analyz<strong>in</strong>g reaction times and the<br />
number of missed signals.<br />
The PDT has been shown to be reliable to the demands of the driv<strong>in</strong>g task (Van W<strong>in</strong>sum et<br />
al., 1999) and is also sensitive to peaks <strong>in</strong> workload (Jahn, Oehme, Krems & Gelau, 2005),<br />
which is important for driv<strong>in</strong>g safety research due to changes <strong>in</strong> task demands.<br />
3.2.3 Subjective measures<br />
Operators can experience their mental workload and give a subjective evaluation. These selfreport<br />
measures are questionnaires that were developed to measure workload <strong>in</strong> humancomputer<br />
<strong>in</strong>teraction, but can be used for many <strong>in</strong>teraction tasks as well, such as driv<strong>in</strong>g. One<br />
example, the NASA-Task Load Index (Hart & Staveland, 1988) was already discussed <strong>in</strong><br />
Section 3.1. Another example of a self-report measure is the RSME, the Rat<strong>in</strong>g Scale Mental<br />
Effort (Zijlstra, 1993). It is a s<strong>in</strong>gle-dimensional measurement of <strong>in</strong>vested mental effort, on<br />
which participants are asked to mark their subjective mental effort <strong>in</strong>vested. The marks on the<br />
scale take the form of “Absolutely no effort”, “Considerable effort”, to “Extreme effort”. The<br />
Activation scale (Bartenwerfer, 1969), orig<strong>in</strong>ally <strong>in</strong> German, is also a s<strong>in</strong>gle-dimensional<br />
scale; the marks on this scale are of a different type than the RSME’s, with statements such as<br />
“I am solv<strong>in</strong>g a crossword puzzle” and “I am try<strong>in</strong>g to cross a busy street”.<br />
The ma<strong>in</strong> disadvantage of self-report measures of mental workload is that they are no<br />
objective measurements (Van W<strong>in</strong>sum & Hoedemaeker, 2000), although their face validity is<br />
high (De Waard, 1996). Also, only an overall rat<strong>in</strong>g of workload over a whole ride can be<br />
given without disturb<strong>in</strong>g drivers <strong>in</strong> their primary task, so a focus on specific situations is not<br />
possible. However, self-report measures give a clear <strong>in</strong>dication of the level of workload<br />
perceived by drivers, and are cheap and easy to apply. They can therefore be useful to <strong>in</strong>clude<br />
<strong>in</strong> almost any workload-related research.<br />
3.2.4 Physiological measures<br />
When an operator experiences an <strong>in</strong>crease <strong>in</strong> mental workload, the response is also reflected<br />
<strong>in</strong> physiological measures. For example, operators with high workload can have more dilated<br />
pupils, start sweat<strong>in</strong>g, and show <strong>in</strong>creased blood pressure and decreased heart rate variability.<br />
An important advantage of determ<strong>in</strong><strong>in</strong>g the physiological effects of <strong>in</strong>creased mental<br />
workload is the unobtrusiveness of most of the measurements <strong>in</strong>volved (De Waard, 1996).<br />
However, physiological measurements require complex <strong>in</strong>terpretation of results, and may also<br />
reflect emotional stra<strong>in</strong> and physical activity <strong>in</strong> addition to mental workload (Jahn et al.,<br />
2005). An <strong>in</strong>crease <strong>in</strong> heart rate (HR) gives an <strong>in</strong>dication of an <strong>in</strong>crease <strong>in</strong> overall workload,<br />
whereas decreas<strong>in</strong>g heart rate variability is more useful for determ<strong>in</strong><strong>in</strong>g an <strong>in</strong>crease <strong>in</strong><br />
cognitive, mental workload (Eggemeier & Wilson, 1991). Three frequency bands were<br />
identified <strong>in</strong> heart rate measurements, of which the middle frequency band (0.10 Hz) has been<br />
found to be specifically related to blood-pressure regulation and mental workload (De Waard,<br />
1996).
60 <strong>Driv<strong>in</strong>g</strong> <strong>Behaviour</strong> <strong>in</strong> <strong>Unexpected</strong> <strong>Situations</strong><br />
3.2.5 Comb<strong>in</strong><strong>in</strong>g measures of mental workload<br />
In order to get a reliable assessment of mental workload, it is important to comb<strong>in</strong>e different<br />
workload measures, s<strong>in</strong>ce not all workload measures are sensitive to workload levels <strong>in</strong> the<br />
same regions (De Waard, 1996). Increased task demands and an <strong>in</strong>crease <strong>in</strong> complexity of the<br />
environment both have an effect on the self-report scale RSME, and on the physiological<br />
measure ECG. Secondary-task performance, <strong>in</strong> particular the embedded task of car-follow<strong>in</strong>g,<br />
is also sensitive to both sources of <strong>in</strong>creased workload. For primary-task measures, this effect<br />
is not the same. While additional tasks lead to a decrease <strong>in</strong> SDLP and SDSTW, an <strong>in</strong>crease <strong>in</strong><br />
complexity of the environment <strong>in</strong>creases both measures. F<strong>in</strong>ally, heart rate variability is<br />
mostly sensitive to an <strong>in</strong>crease <strong>in</strong> complexity (De Waard, 1996).<br />
As was discussed <strong>in</strong> Chapter 2, not every <strong>in</strong>crease <strong>in</strong> mental workload leads to the same<br />
effects for the same task <strong>in</strong> the same person, s<strong>in</strong>ce motivation and the difficulty of the task as<br />
perceived by the operator play an important role <strong>in</strong> the resources <strong>in</strong>vested. Also not every<br />
measure of mental workload is sensitive <strong>in</strong> the same performance area (De Waard, 1996).<br />
Figure 3.3 shows the measures and the performance areas <strong>in</strong> which they are sensitive.<br />
3.3 Driver characteristics<br />
Drivers’ personal traits, experiences and other characteristics may <strong>in</strong>fluence their driv<strong>in</strong>g style<br />
and types of (re)actions shown dur<strong>in</strong>g driv<strong>in</strong>g. For <strong>in</strong>stance, the level of risk drivers are<br />
will<strong>in</strong>g to take, their reaction speed, and the experiences they have had can be important<br />
factors <strong>in</strong> the way drivers <strong>in</strong>teract with other vehicles around them. There are four general<br />
types of driver characteristics: demographic characteristics, such as gender, age, and country<br />
of residence; personality traits, such as sensation seek<strong>in</strong>g and cognitive abilities; attitudes and<br />
<strong>in</strong>tentions; and driv<strong>in</strong>g experience.<br />
Different types of driver characteristics can be recorded <strong>in</strong> different ways. Whereas drivers<br />
can be asked directly about their driv<strong>in</strong>g experience and demographic characteristics,<br />
personality traits and attitudes require different approaches. The above mentioned <strong>Driv<strong>in</strong>g</strong><br />
Style Questionnaire (DSQ) (French et al., 1993), for <strong>in</strong>stance, gives <strong>in</strong>sight <strong>in</strong>to drivers’<br />
subjective descriptions of their own driv<strong>in</strong>g style.
Chapter 3 - Research Tools 61<br />
Figure 3.3 Sensitivity of workload measures for different performance areas<br />
(De Waard, 1996, repr<strong>in</strong>ted with permission)<br />
3.4 Research tools used <strong>in</strong> this thesis<br />
In summary, the research described <strong>in</strong> this thesis is concerned with the follow<strong>in</strong>g concepts:<br />
Operational and tactical driv<strong>in</strong>g behaviour<br />
a number of unexpected, safety-critical events with vary<strong>in</strong>g event urgency<br />
vary<strong>in</strong>g levels of mental workload<br />
basic driver characteristics
62 <strong>Driv<strong>in</strong>g</strong> <strong>Behaviour</strong> <strong>in</strong> <strong>Unexpected</strong> <strong>Situations</strong><br />
This section describes the research methods used <strong>in</strong> the experiments.<br />
3.4.1 Experimental tools<br />
We chose to perform a number of controlled experiments <strong>in</strong> a driv<strong>in</strong>g simulator. Drivers<br />
encountered several unexpected and safety-critical events dur<strong>in</strong>g our experiments, and we<br />
determ<strong>in</strong>ed it both unsafe and unethical to expose drivers to a possible risk of a conflict or<br />
collision <strong>in</strong> a real traffic system. Moreover, repeat<strong>in</strong>g the same conditions over and over <strong>in</strong><br />
similar environments, and controll<strong>in</strong>g the conflicts that were studied, is not possible <strong>in</strong> a real<br />
world situation. Therefore, we would also not be able to set the participants’ expectations <strong>in</strong><br />
the controlled manner <strong>in</strong> a real-world environment. The unexpected, safety critical events can<br />
will be programmed <strong>in</strong> a driv<strong>in</strong>g simulator, and their severity can be determ<strong>in</strong>ed based on<br />
surrogate safety measures.<br />
The driv<strong>in</strong>g simulators used for the experiments described <strong>in</strong> this thesis were programmed<br />
with the use of ST Software (ST Software, 2010). ST Software was developed by experts <strong>in</strong><br />
the field of driv<strong>in</strong>g simulator technology and driv<strong>in</strong>g behaviour research. It consists of a<br />
number of modules <strong>in</strong> which researchers can build, run and analyse driv<strong>in</strong>g simulator studies.<br />
StRoadDesign is a module which can be used to develop a virtual road environment <strong>in</strong> a 2D<br />
grid, which then can be converted <strong>in</strong>to a full 3D environment. In StScenario, the road users’<br />
actions and other aspects of the research scenarios can be built, lead<strong>in</strong>g to a complete<br />
experimental setup. F<strong>in</strong>ally, StDataProc can be used for the real-time and accurate record<strong>in</strong>g<br />
and basic analysis of a large range of different tactical and operational level tasks, as well as<br />
surrogate safety measures, <strong>in</strong>formation about all other road users, and time markers. The ma<strong>in</strong><br />
advantages of ST are the natural driv<strong>in</strong>g behaviour of other road users, and the realistic traffic<br />
environment. Both the external validity and the relative <strong>in</strong>ternal validity of the experiments<br />
are therefore secured. ST Software can be applied <strong>in</strong> simulators for driver tra<strong>in</strong><strong>in</strong>g,<br />
behavioural research, driver assessment and other fields of application (ST Software, 2010).<br />
For the measurements of the (relative) level of mental workload, we decided to use the headmounted<br />
Peripheral Detection Task (Van der Horst & Martens, 2009) and record drivers’<br />
reaction times and response rates to this secondary task. Furthermore, we recorded the<br />
participants’ Heart Rate (HR) and Heart Rate Variability (HRV) <strong>in</strong> the second experiment as a<br />
supplement to these PDT measures. Task performance of an additional (arithmetic) task,<br />
where applicable, was also recorded <strong>in</strong> the second experiment as an <strong>in</strong>dication for mental<br />
workload level.<br />
Primary driv<strong>in</strong>g performance was measured dur<strong>in</strong>g all experiments, but was not used to<br />
determ<strong>in</strong>e a state of <strong>in</strong>creased mental workload. Accord<strong>in</strong>g to Horrey and Simons (2007),<br />
drivers adopt their safety marg<strong>in</strong>s <strong>in</strong> a different way when they are asked to perform tactical<br />
tasks (such as <strong>in</strong> the experiments described <strong>in</strong> this thesis), than when they are perform<strong>in</strong>g a<br />
steady-state task such as car-follow<strong>in</strong>g. In our study, chang<strong>in</strong>g safety marg<strong>in</strong>s are therefore a<br />
result of the level of mental workload at hand, and will not be used the other way around, as<br />
evidence for a certa<strong>in</strong> level of mental workload. F<strong>in</strong>ally, participants’ basic demographic<br />
characteristics (gender and age) were recorded before the experiment, as well as their driv<strong>in</strong>g<br />
experience (<strong>in</strong> years) and annual mileage. Participants’ (chang<strong>in</strong>g) expectations about the<br />
driv<strong>in</strong>g scenarios and experiences dur<strong>in</strong>g the trials were tested <strong>in</strong> a questionnaire.
Chapter 3 - Research Tools 63<br />
The experiments described <strong>in</strong> this thesis were both conducted us<strong>in</strong>g driv<strong>in</strong>g simulators.<br />
Certa<strong>in</strong> characteristics of the two simulators used <strong>in</strong> the experiments varied; they will<br />
therefore be described <strong>in</strong> each correspond<strong>in</strong>g chapter. Table 3.2 shows the parameters which<br />
were recorded <strong>in</strong> each experiment.<br />
Table 3.2 Experimental variables and methods of record<strong>in</strong>g<br />
Type of<br />
data<br />
recorded<br />
Specification Recorded<br />
parameter<br />
Method Number of<br />
experiment<br />
<strong>in</strong> which<br />
parameter<br />
was<br />
recorded<br />
<strong>Driv<strong>in</strong>g</strong> Longitud<strong>in</strong>al <strong>Driv<strong>in</strong>g</strong> speed <strong>Driv<strong>in</strong>g</strong> simulator 2 1 & 2<br />
Acceleration <strong>Driv<strong>in</strong>g</strong> simulator 1 & 2<br />
Distance<br />
Headway<br />
<strong>Driv<strong>in</strong>g</strong> simulator 1<br />
Time Headway <strong>Driv<strong>in</strong>g</strong> simulator 2<br />
Lateral Lateral position <strong>Driv<strong>in</strong>g</strong> simulator 1 & 2<br />
Lateral speed <strong>Driv<strong>in</strong>g</strong> simulator 1 & 2<br />
Lateral<br />
acceleration<br />
<strong>Driv<strong>in</strong>g</strong> simulator 1<br />
Workload <strong>Driv<strong>in</strong>g</strong> Primary task <strong>Driv<strong>in</strong>g</strong> simulator 1 & 2<br />
behaviour performance<br />
Physiological<br />
measure<br />
Heart Rate Polar watch 2<br />
Heart Rate<br />
Variability<br />
Polar watch 2<br />
Peripheral<br />
Detection<br />
Task (PDT)<br />
Reaction Time PDT 1 & 2<br />
Percentage of<br />
missed signals<br />
PDT 1 & 2<br />
Secondary Number of Recorded by 2<br />
task<br />
performance<br />
correct answers experimenter<br />
Percentage of Recorded by 2<br />
false answers experimenter<br />
Other<br />
Location of lead <strong>Driv<strong>in</strong>g</strong> simulator 1 & 2<br />
vehicles<br />
car<br />
Speed of lead car <strong>Driv<strong>in</strong>g</strong> simulator 1 & 2<br />
Location of most<br />
recent car from<br />
right<br />
<strong>Driv<strong>in</strong>g</strong> simulator 2<br />
2<br />
In Experiment 1, variables were recorded at a sampl<strong>in</strong>g rate of 256 Hz; the sampl<strong>in</strong>g rate used <strong>in</strong> Experiment 2<br />
was 100 Hz.
64 <strong>Driv<strong>in</strong>g</strong> <strong>Behaviour</strong> <strong>in</strong> <strong>Unexpected</strong> <strong>Situations</strong><br />
Table 3.2 Experimental variables and methods of record<strong>in</strong>g (cont<strong>in</strong>ued)<br />
Type of<br />
data<br />
recorded<br />
Other Controls<br />
Specification Recorded<br />
parameter<br />
Gas: percentage<br />
of maximum<br />
position<br />
Steer: percentage<br />
of maximum<br />
angle<br />
Brake:<br />
percentage of<br />
maximum<br />
position<br />
Time Time s<strong>in</strong>ce start<br />
of experiment<br />
Location Location of<br />
participant’s<br />
vehicle (both<br />
road section and<br />
distance to<br />
<strong>in</strong>tersection)<br />
Method Number of<br />
experiment<br />
<strong>in</strong> which<br />
parameter<br />
was<br />
recorded<br />
<strong>Driv<strong>in</strong>g</strong> simulator 1 & 2<br />
<strong>Driv<strong>in</strong>g</strong> simulator 1 & 2<br />
<strong>Driv<strong>in</strong>g</strong> simulator 1 & 2<br />
<strong>Driv<strong>in</strong>g</strong> simulator 1 & 2<br />
<strong>Driv<strong>in</strong>g</strong> simulator 1 & 2<br />
The recorded variables, all related to tactical level or control level driv<strong>in</strong>g tasks, were used to<br />
answer the question whether, and <strong>in</strong> what way, drivers change their driv<strong>in</strong>g behaviour after an<br />
unexpected event requir<strong>in</strong>g control level compensation.<br />
3.4.2 Calculation of variables from raw data<br />
As Table 3.2 showed, a large number of parameters were recorded at relatively high sampl<strong>in</strong>g<br />
rates <strong>in</strong> both experiments (256 Hz and 100 Hz, respectively). The average variable values<br />
were calculated from this raw data as follows. The average speed was calculated by divid<strong>in</strong>g<br />
the distance driven (either 100 metres for <strong>in</strong>tersections, or 10 metres for 10-metre cells) by the<br />
time it took to drive this distance. All other variables were calculated by add<strong>in</strong>g all recorded<br />
values over a specific stretch of road (e.g., the last 150 metres of each <strong>in</strong>tersection), and<br />
divid<strong>in</strong>g them by the number of values <strong>in</strong> this calculation. This latter method might have<br />
resulted <strong>in</strong> an over- or underestimation of certa<strong>in</strong> effects, s<strong>in</strong>ce lower speeds have a more<br />
prom<strong>in</strong>ent <strong>in</strong>put <strong>in</strong> this calculation, and certa<strong>in</strong> behavioural aspects can fluctuate with<br />
chang<strong>in</strong>g speeds. This might lead to an overrepresentation of certa<strong>in</strong> values at low speeds:<br />
s<strong>in</strong>ce distances travelled <strong>in</strong> a certa<strong>in</strong> amount of time are smaller at low speeds than is the case<br />
at high speeds, more values are recorded for stretches with low speeds than with high speeds.<br />
The variables at which this prom<strong>in</strong>ent presence of values at lower speed will probably have<br />
the largest effect, are the lateral position (and related to this, lateral speed and acceleration)<br />
and the distance headway. To start with the first, large lateral position effects are likely to be<br />
underestimated due to this calculation, s<strong>in</strong>ce lower speeds are often related to smaller lateral
Chapter 3 - Research Tools 65<br />
position deviations. The distance headway is also generally smaller at lower speeds, which<br />
might lead to an underestimation of distance headway effects. S<strong>in</strong>ce it is difficult to calculate<br />
average values of distance headway and lateral position other than by averag<strong>in</strong>g the recorded<br />
values, this is an aspect of data record<strong>in</strong>g and analysis that needs to be considered when<br />
<strong>in</strong>terpret<strong>in</strong>g the results. We will discuss whether this may have lead to an under- or<br />
overestimation of the effects <strong>in</strong> the correspond<strong>in</strong>g chapters.<br />
3.4.3 Statistical analysis for both experiments<br />
Experiment 1 had a repeated measures design with two with<strong>in</strong>-subjects variables: Trial (4<br />
conditions) and Intersection (20 conditions). Mental workload (3 conditions) and severity of<br />
the unexpected, safety-critical events (2 conditions) were both between-subjects variables.<br />
The variables were analyzed with a Repeated Measures ANOVA us<strong>in</strong>g SPSS. Correlations<br />
between variables were also computed. Tukey’s Honestly Significant Difference (HSD) test<br />
was performed as a post-hoc test to determ<strong>in</strong>e which means were significantly different from<br />
one another when an <strong>in</strong>teraction effect was found. S<strong>in</strong>ce multiple hypotheses were tested on<br />
the same dataset, the Bonferroni confidence <strong>in</strong>terval adjustment method was used to prevent a<br />
distortion of the family-wise error rate of multiple comparisons.<br />
Experiment 2 also had a repeated measures design. The design conta<strong>in</strong>ed two trials which<br />
consisted of three sections each, <strong>in</strong> which the mental workload was varied for participants.<br />
These sections <strong>in</strong> turn each conta<strong>in</strong>ed 20 <strong>in</strong>tersections. Both mental workload condition and<br />
severity of the unexpected, safety-critical situation (2 conditions) were between-subjects<br />
variables. In order to study the differences between conditions, we compared a number of<br />
variables <strong>in</strong> the different conditions by means of Paired Samples t-tests. To assess the<br />
behavioural effects of the brak<strong>in</strong>g event, we studied the ma<strong>in</strong> effects and two-way <strong>in</strong>teractions<br />
by means of Analysis of Variance (ANOVA) method for Repeated Measures. The statistical<br />
significance level was set at .05 for all statistical tests. Whenever a significant violation of the<br />
sphericity assumption was detected <strong>in</strong> the repeated measures ANOVA, the Huynh-Feldt<br />
procedure (Huynh & Feldt, 1976) was applied to correct the degrees of freedom. The<br />
corrected degrees of freedom are reported <strong>in</strong> the text. Tukey’s HSD test was performed to<br />
check for significant differences between means.<br />
p 2 (Partial Eta Squared) was determ<strong>in</strong>ed as effect size for the ANOVA. This effect size<br />
describes the proportion of variance accounted for by the factor when exclud<strong>in</strong>g other<br />
variables. The benchmarks were based on Cohen (1992) and Keppel and Wickens (2002). For<br />
the t-tests, the effect size was calculated us<strong>in</strong>g Pearson’s correlation coefficient r (Cohen,<br />
1988; Cohen, 1992). Table 3.3 shows these two effect size measures and their <strong>in</strong>terpretation.<br />
Table 3.3 Effect size measures and <strong>in</strong>terpretation<br />
Effect size p 2 (Partial ta Squared) Pearson’s r<br />
Small effect 0.20 0.10<br />
Medium effect 0.50 0.30<br />
Large effect 0.80 0.50
66 <strong>Driv<strong>in</strong>g</strong> <strong>Behaviour</strong> <strong>in</strong> <strong>Unexpected</strong> <strong>Situations</strong>
Chapter 4<br />
Experiment 1: Drivers’ reactions to unexpected<br />
events<br />
The first experiment was a large driv<strong>in</strong>g simulator experiment with the aim to explore driv<strong>in</strong>g<br />
behaviour dur<strong>in</strong>g and after unexpected situations. The notion of behavioural adaptation as a<br />
result of compensatory actions related to unexpected situations is related to the hierarchical<br />
model of the driv<strong>in</strong>g task, developed by Michon (1971, 1985). Accord<strong>in</strong>g to Michon (1985),<br />
driv<strong>in</strong>g behaviour can change from top-down <strong>in</strong>teraction <strong>in</strong> normal driv<strong>in</strong>g, to bottom-up<br />
<strong>in</strong>teraction when a driver encounters an unexpected situation to which compensation is<br />
required. We are <strong>in</strong>terested <strong>in</strong> determ<strong>in</strong><strong>in</strong>g how this directional change <strong>in</strong> task level<br />
<strong>in</strong>teraction manifests itself <strong>in</strong> driv<strong>in</strong>g behaviour. Do drivers consistently change their driv<strong>in</strong>g<br />
behaviour after an unexpected event requir<strong>in</strong>g control level compensation, and if so, <strong>in</strong> what<br />
way and at which task levels? Do all unexpected events trigger a change <strong>in</strong> direction of<br />
<strong>in</strong>teraction between task levels, regardless of the type of compensation required? And what is<br />
the role of mental workload and event urgency on this? The current experiment was aimed at<br />
test<strong>in</strong>g two hypotheses about these sub-questions and develop<strong>in</strong>g additional hypotheses.<br />
67
68 <strong>Driv<strong>in</strong>g</strong> <strong>Behaviour</strong> <strong>in</strong> <strong>Unexpected</strong> <strong>Situations</strong>
Chapter 4 - Experiment 1: Drivers’ reactions to unexpected events 69<br />
4.1 Research tools<br />
A<br />
s was described <strong>in</strong> Chapter 2, the hierarchical task model by Michon (1971, 1985)<br />
gives an overview of the levels that constitute the driv<strong>in</strong>g task and their <strong>in</strong>teractions.<br />
In normal driv<strong>in</strong>g behaviour, the <strong>in</strong>fluence between the task levels is top-down, from<br />
strategic level choices to tactical level action patterns and on to operational level actions.<br />
Dur<strong>in</strong>g certa<strong>in</strong> specific situations, however, this task level <strong>in</strong>teraction can be turned around to<br />
bottom-up <strong>in</strong>fluence. This is expected to occur as a result of compensation to unexpected<br />
situations (Michon, 1985).<br />
In order to get more <strong>in</strong>sight <strong>in</strong>to the <strong>in</strong>teractions between task levels, and specifically the<br />
behavioural adaptations result<strong>in</strong>g from directional changes <strong>in</strong> these <strong>in</strong>teractions between<br />
normal driv<strong>in</strong>g behaviour and driv<strong>in</strong>g <strong>in</strong> unexpected situations, a driv<strong>in</strong>g behaviour study was<br />
set up. It was decided to use a driv<strong>in</strong>g simulator, s<strong>in</strong>ce both the exact repetition of conditions<br />
and the cont<strong>in</strong>uous safety of participants could only be fully guaranteed when us<strong>in</strong>g a driv<strong>in</strong>g<br />
simulator. The aim was to test two hypotheses about behavioural adaptations result<strong>in</strong>g from<br />
changes <strong>in</strong> task level <strong>in</strong>teractions and expand these hypotheses, develop<strong>in</strong>g additional<br />
hypotheses relat<strong>in</strong>g to the <strong>in</strong>fluence of mental workload and event urgency. The two <strong>in</strong>itial<br />
hypotheses that the experiment was based upon were:<br />
The type of compensation behaviour (longitud<strong>in</strong>al, lateral, or a comb<strong>in</strong>ation) required to<br />
safely handle an unexpected, safety-critical event determ<strong>in</strong>es the type of any (temporary)<br />
behavioural effect. Therefore, longitud<strong>in</strong>al compensation behaviour leads to changes <strong>in</strong><br />
longitud<strong>in</strong>al driv<strong>in</strong>g behaviour only, and lateral compensation behaviour leads to changes<br />
<strong>in</strong> lateral driv<strong>in</strong>g behaviour only.<br />
After an unexpected event for which drivers need to perform compensatory actions, they<br />
adapt their driv<strong>in</strong>g behaviour. This is the result of a directional switch <strong>in</strong> task level<br />
<strong>in</strong>teraction.<br />
Recorded data therefore <strong>in</strong>cluded driv<strong>in</strong>g behaviour measurements, mental workload<br />
measurements, measurements of the events and circumstances, and <strong>in</strong>formation on drivers’<br />
perceptions and expectations. Table 3.2 lists all recorded variables.<br />
The fixed-base driv<strong>in</strong>g simulator available at TNO Human Factors <strong>in</strong> Soesterberg, the<br />
Netherlands, was used for the experiment. This simulator consists of the follow<strong>in</strong>g sub<br />
systems:<br />
A left-seated Volkswagen Golf 4 mock-up, with passenger seat and manual transmission<br />
The vehicle model computer, which calculates the simultaneous position and head<strong>in</strong>g of<br />
the simulated vehicle<br />
Projection on three screens <strong>in</strong> front and to the side of the simulator, with a total horizontal<br />
field of view of 180° and the total vertical field of view of 45°<br />
Stereo sound system<br />
The simulator’s rear view mirror was projected on the ma<strong>in</strong> projection screen, at the location<br />
where one would normally look <strong>in</strong>to the rear view mirror. Figure 4.1 shows this fixed-base<br />
driv<strong>in</strong>g simulator.<br />
This simulator’s relative <strong>in</strong>ternal validity is high due to the realistic behaviour models<br />
<strong>in</strong>cluded <strong>in</strong> StSoftware (StSoftware, 2010). The head-mounted Peripheral Detection Task<br />
69
70 <strong>Driv<strong>in</strong>g</strong> <strong>Behaviour</strong> <strong>in</strong> <strong>Unexpected</strong> <strong>Situations</strong><br />
(PDT) was used for the participants’ mental workload measurement. The LED lighted up<br />
randomly every three to five seconds, and stayed on for one second or until the participant<br />
pressed the f<strong>in</strong>ger switch. Reaction time was recorded, and reaction times of over two seconds<br />
were seen as missed signals. Refer to Section 3.2 on mental workload assessment for more<br />
<strong>in</strong>formation on the PDT. Furthermore, we used StRoadDesign for the design of the simulated<br />
urban environment, StScenario for development of the experiments, and StDataProc for data<br />
record<strong>in</strong>g (StSoftware, 2010; also refer to Section 3.5). Questionnaires were designed to study<br />
participants’ experiences with<strong>in</strong> the experiment, and the level to which participants’<br />
expectations were set and/ or met.<br />
4.2 Participants<br />
Eighty-seven subjects participated <strong>in</strong> the experiment. The selection criteria for participants<br />
were:<br />
<strong>in</strong> possession of a driver’s license for five or more years<br />
age between 20 and 60 years old<br />
at least 7,000 kilometres driven annually<br />
no <strong>in</strong>dication of motion sickness (e.g., no negative experience with car sickness, positive<br />
experience with driv<strong>in</strong>g simulator experiments)<br />
We aimed at gett<strong>in</strong>g a cross-section of the complete group of ‘experienced, regular drivers’ <strong>in</strong><br />
our studies; however, due to possible respondent-bias, it might be that our selection of<br />
participants was not representative of all drivers.<br />
Due to simulator sickness, 11 participants (13%) did not complete the experiment. An error <strong>in</strong><br />
the data storage led to an <strong>in</strong>complete dataset for 37 participants. Thirty-n<strong>in</strong>e complete datasets<br />
were used for analysis. The average age of the 39 participants was 41 years (SD 13, m<strong>in</strong>imum<br />
23, maximum 60); 26 participants were male, 13 female. All participants were paid € 18, for<br />
their participation.<br />
Seventeen of the 39 participants participated only <strong>in</strong> this experiment, while 22 also<br />
participated <strong>in</strong> another driv<strong>in</strong>g simulator experiment on the same day. This second experiment<br />
focused on <strong>in</strong>-car <strong>in</strong>formation systems for speed advice (Duivenvoorden, 2007). There was no<br />
relation between its content and the content of this experiment. Furthermore, all participants<br />
were given at least fifteen-m<strong>in</strong>ute breaks between the different experimental sessions, so no<br />
effect of this extra experiment on alertness or fatigue was anticipated.<br />
4.3 Experimental design<br />
The experiment consisted of four rides <strong>in</strong> an urban environment. Participants were divided<br />
<strong>in</strong>to two groups, with one group driv<strong>in</strong>g all four rides without an additional task and one<br />
group driv<strong>in</strong>g while perform<strong>in</strong>g an additional task. All participants encountered a set of two<br />
unexpected events dur<strong>in</strong>g their four rides, the order of which was balanced among the<br />
participants. These two unexpected events could occur at three levels of event urgency. The<br />
two levels of mental workload (driv<strong>in</strong>g without and with a secondary task) and the three<br />
levels of event urgency (low, medium and high; labels will be expla<strong>in</strong>ed later <strong>in</strong> this section)
Chapter 4 - Experiment 1: Drivers’ reactions to unexpected events 71<br />
led to six event conditions <strong>in</strong> a complete between-subjects set-up so as to avoid carry-over<br />
effects.<br />
An urban layout was simulated as one long road divided by 20 four-way <strong>in</strong>tersections,<br />
result<strong>in</strong>g <strong>in</strong> 21 <strong>in</strong>dividual road sections. Subjects were <strong>in</strong>structed to drive straight on each<br />
<strong>in</strong>tersection with a maximum speed of 50 km/h and give priority to traffic com<strong>in</strong>g from the<br />
right accord<strong>in</strong>g to Dutch traffic regulations. Each of the 21 road sections was at least 250<br />
metres long, and one complete ride took on average 9½ m<strong>in</strong>utes. The <strong>in</strong>frastructure was<br />
similar at each <strong>in</strong>tersection. A lead car drove <strong>in</strong> front of the subject dur<strong>in</strong>g the whole ride,<br />
slow<strong>in</strong>g down when the subject fell too far beh<strong>in</strong>d (more than 48 metres away) and speed<strong>in</strong>g<br />
up when the subject came too close (with<strong>in</strong> 18 metres). At 50 km/h, a distance headway of 48<br />
metres is equivalent to a time headway of 3.5 seconds, and a distance headway of 18 metres to<br />
1.3 seconds.<br />
When the participant was approach<strong>in</strong>g an <strong>in</strong>tersection, a car com<strong>in</strong>g from the right always<br />
crossed the <strong>in</strong>tersection first. The participant and a lead car then reached the <strong>in</strong>tersection, and<br />
a car com<strong>in</strong>g from the left approached the <strong>in</strong>tersection, yielded to the participant and the lead<br />
car, and crossed beh<strong>in</strong>d them. These actions of the other road users were similar at each<br />
<strong>in</strong>tersection. The <strong>in</strong>tersection layout and the position<strong>in</strong>g of other road users when the<br />
participant was about to cross an <strong>in</strong>tersection are depicted <strong>in</strong> Figure 4.2.<br />
Figure 4.1 TNO’s fixed based driv<strong>in</strong>g simulator
72 <strong>Driv<strong>in</strong>g</strong> <strong>Behaviour</strong> <strong>in</strong> <strong>Unexpected</strong> <strong>Situations</strong><br />
Figure 4.2 Standard <strong>in</strong>tersection layout with lead car and vehicles from left and right<br />
Figure 4.3 Brak<strong>in</strong>g lead car after <strong>in</strong>tersection 5 (road section 6) <strong>in</strong> one of the event trials<br />
The experiment consisted of four such experimental trials, and one <strong>in</strong>troduction ride<br />
preced<strong>in</strong>g the actual experiment to give all participants the opportunity to ga<strong>in</strong> some<br />
experience with the driv<strong>in</strong>g simulator and the simulated environment. In the reference trials<br />
(first and third trials), participants drove only on standard road sections, sett<strong>in</strong>g their<br />
expectations about the situations to come. The second and fourth trials were event trials, <strong>in</strong><br />
both of which one of two unexpected events occurred. The order of these events was balanced
Chapter 4 - Experiment 1: Drivers’ reactions to unexpected events 73<br />
among participants to avoid contam<strong>in</strong>at<strong>in</strong>g the results with any learn<strong>in</strong>g effects. Based on the<br />
model developed by Michon (1971, 1985), we expect that the direction of <strong>in</strong>fluence between<br />
driv<strong>in</strong>g task levels changes as a result from unexpected events. Accord<strong>in</strong>g to the model,<br />
compensatory actions on a lower level serve as <strong>in</strong>put for choices and actions made at the<br />
nearest higher level. We expect that there is a difference between longitud<strong>in</strong>al compensation<br />
and lateral compensation and their effects on driv<strong>in</strong>g behaviour. Therefore, two different<br />
types of events were staged, requir<strong>in</strong>g two different types of compensatory actions:<br />
longitud<strong>in</strong>al (brak<strong>in</strong>g) and lateral (mov<strong>in</strong>g away).<br />
The first of the unexpected events was the sudden brak<strong>in</strong>g of the lead car, which occurred<br />
shortly after the participant had passed the fifth <strong>in</strong>tersection of the trial (at the sixth road<br />
section), see Figure 4.3. The lead vehicle braked unexpectedly and then accelerated aga<strong>in</strong> to<br />
its <strong>in</strong>itial speed after the participant had driven 5, 10 or 20 metres, i.e. three levels of urgency,<br />
labelled low, medium and high. This gave a good <strong>in</strong>dication of event urgency if participants<br />
were at the same distance before the event. However, participants were free (with<strong>in</strong> limits) to<br />
choose their own headway at all times and this orig<strong>in</strong>al <strong>in</strong>dicator of urgency did not take <strong>in</strong>to<br />
account how close to the lead car the participant was driv<strong>in</strong>g. A low urgency event could<br />
therefore potentially be a situation <strong>in</strong> which the lead car would brake relatively close to the<br />
participant, whereas a highly urgent event could also be a brak<strong>in</strong>g lead car far away from the<br />
participant. Therefore, a second measure of criticality was determ<strong>in</strong>ed, namely the<br />
participant’s distance headway after brak<strong>in</strong>g had stopped. This measure is more directly<br />
related to the possibility of a conflict, and parts of the data were therefore also analysed with<br />
this criticality variable. The three criticality levels were set at high criticality (a distance<br />
headway of less than 18 metres), medium (distance headway between 18 and 30 metres), and<br />
low criticality (distance headway over 30 metres). These criticality levels are expla<strong>in</strong>ed more<br />
thoroughly <strong>in</strong> Section 4.6.4.2. The order of the trials with the unexpected event and the other<br />
(reference) trials was balanced among participants. The brak<strong>in</strong>g event occurred only once for<br />
each participant to ensure it was unexpected. Appendix A.1 gives the annotated code for the<br />
two unexpected events, as well as the regular driv<strong>in</strong>g behaviour for the lead vehicle.<br />
The second unexpected event was an event that required a different type of compensation<br />
behaviour from the participant. The car from the left, which had until that moment always<br />
yielded accord<strong>in</strong>g to the rules, abruptly accelerated before it stopped to avoid collid<strong>in</strong>g with<br />
the participants. This happened at the eighth <strong>in</strong>tersection of the trial. The car would start to<br />
approach when the participant was at either 10 metres from the <strong>in</strong>tersection, 6 metres from the<br />
<strong>in</strong>tersection, or at start of the <strong>in</strong>tersection, and these levels of urgency were also labelled low,<br />
medium and high due to their relationship with the level of conflict raised by the approach<strong>in</strong>g<br />
car.<br />
Half of the participants were given an additional cognitive task to perform while driv<strong>in</strong>g, <strong>in</strong><br />
order to determ<strong>in</strong>e the effects of mental workload on the driv<strong>in</strong>g task level <strong>in</strong>teractions. They<br />
were <strong>in</strong>structed to iteratively subtract a number between four and n<strong>in</strong>e from a three-digit<br />
figure dur<strong>in</strong>g each of the four complete trials. Table 4.1 lists these four serial subtraction<br />
tasks. Participants were encouraged to cont<strong>in</strong>uously perform this additional task and were<br />
rem<strong>in</strong>ded of their task after a number of seconds without an answer, but they were allowed to<br />
give their f<strong>in</strong>al answers at their own pace.
74 <strong>Driv<strong>in</strong>g</strong> <strong>Behaviour</strong> <strong>in</strong> <strong>Unexpected</strong> <strong>Situations</strong><br />
Table 4.1 Serial subtraction task <strong>in</strong> each of the four experimental trials for participants<br />
with elevated mental workload<br />
Trial Start<strong>in</strong>g number Number to subtract Solution<br />
1 851 4 847, 843, 839, etc<br />
2 735 6 729, 723, 717, etc<br />
3 800 7 793, 786, 779, etc<br />
4 900 8 892, 884, 876, etc<br />
Participants were asked to complete a questionnaire follow<strong>in</strong>g each trial, with 20 questions<br />
about simulator sickness, the predictability of the driv<strong>in</strong>g task and whether perform<strong>in</strong>g the<br />
PDT had <strong>in</strong>terfered with their driv<strong>in</strong>g. For the participants with the arithmetic task, two<br />
additional questions were asked about the level of difficulty of this task, and whether it had<br />
<strong>in</strong>fluenced the participant’s driv<strong>in</strong>g style. Participants had to rate their answers to the<br />
questions on a 5-po<strong>in</strong>t Likert scale. The questions were phrased as follows:<br />
What did you th<strong>in</strong>k of the behaviour of other road users? Please rate your answer on the<br />
scale below.<br />
Predictable X X X X X Unpredictable<br />
What did you th<strong>in</strong>k of the predictability of the driv<strong>in</strong>g task?<br />
Predictable X X X X X Unpredictable<br />
Participants had the opportunity to write additional remarks at the end of the questionnaire.<br />
The complete questionnaire is given <strong>in</strong> Appendix C.1 (<strong>in</strong> Dutch).<br />
4.4 Procedure<br />
Participants were welcomed at TNO and were taken to a wait<strong>in</strong>g room. They received<br />
<strong>in</strong>structions about the aim and content of the experiment, and general <strong>in</strong>formation about the<br />
project and the driv<strong>in</strong>g simulator. Participants were then given the opportunity to ask general<br />
questions about the project and the experiment. After sign<strong>in</strong>g an <strong>in</strong>formed consent form, all<br />
participants drove one <strong>in</strong>troduction ride preced<strong>in</strong>g the actual experiment to ga<strong>in</strong> some<br />
experience with the driv<strong>in</strong>g simulator and the simulated environment.<br />
Next, participants were given more <strong>in</strong>formation about the specific arithmetic and driv<strong>in</strong>g tasks<br />
<strong>in</strong> the experiment. They were <strong>in</strong>structed to give the highest priority to driv<strong>in</strong>g safely. The<br />
serial subtraction task, when applicable, should be given second priority, and the PDT should<br />
receive lowest priority, but should still be completed as fast as possible. The <strong>in</strong>structions for<br />
this experiment can be found <strong>in</strong> Appendix B.1 (<strong>in</strong> Dutch).<br />
After a short break <strong>in</strong> which they could ask the last procedural questions, participants drove<br />
the four experimental trials. The 22 participants who also participated <strong>in</strong> the study on green<br />
wave speed advice (Duivenvoorden, 2007) alternated these four trials with three trials from<br />
that study.
Chapter 4 - Experiment 1: Drivers’ reactions to unexpected events 75<br />
After each trial, participants were given a questionnaire with questions regard<strong>in</strong>g their health,<br />
the predictability of the task and other road users’ behaviour, and the <strong>in</strong>fluence of the<br />
secondary tasks on their driv<strong>in</strong>g style. After the f<strong>in</strong>al ride and questionnaire, participants were<br />
paid for their participation. Participants who still had questions regard<strong>in</strong>g the aim of the<br />
experiment were given a detailed explanation after completion of the experiment.<br />
4.5 Data registration and analysis<br />
S<strong>in</strong>ce our research focused on both anticipation to the <strong>in</strong>tersection and <strong>in</strong>tersection driv<strong>in</strong>g, all<br />
results were based on the values calculated from the last 100 metres before the next<br />
<strong>in</strong>tersection centre. This stretch of road will be called ‘<strong>in</strong>tersection’ <strong>in</strong> this chapter, describ<strong>in</strong>g<br />
both anticipation behaviour to the <strong>in</strong>tersection and actual <strong>in</strong>tersection driv<strong>in</strong>g behaviour.<br />
Furthermore, we looked at speed patterns by determ<strong>in</strong><strong>in</strong>g the m<strong>in</strong>imum speed with<strong>in</strong> this<br />
section of 100 metres, as well as the location at which this m<strong>in</strong>imum speed was reached.<br />
F<strong>in</strong>ally, speed was also calculated for parts of road sections with a length of 10 metres, from<br />
hereon labelled 10-metre cells, between 100 metres before the <strong>in</strong>tersection and the<br />
<strong>in</strong>tersection centre (this leads to 11 cells with values averaged over the stretch of road from<br />
100 to 90 metres from the next <strong>in</strong>tersection, 90 to 80 metres from the next <strong>in</strong>tersection, 80 to<br />
70 metres, et cetera).<br />
We studied the ma<strong>in</strong> effects and two-way <strong>in</strong>teractions by means of a Repeated Measures<br />
Analysis of Variance (Repeated Measures ANOVA) method. The statistical significance level<br />
was set at =0.05. Correlations between variables were calculated as well. Vertical bars <strong>in</strong><br />
each figure denote 95% confidence <strong>in</strong>tervals. Where figures display results that are not<br />
statistically significant at the 0.05 level, the effects are denoted by (ns) for ‘not significant’.<br />
The analyses of the predictability of the rides were based on<br />
Question <strong>in</strong> questionnaire: predictability of driv<strong>in</strong>g task, predictability of behaviour of<br />
other road users<br />
Trial (4)<br />
The follow<strong>in</strong>g between-subjects variables were furthermore studied:<br />
Mental workload condition (2): driv<strong>in</strong>g only or driv<strong>in</strong>g with an additional arithmetic task<br />
Urgency (3): high, medium or low<br />
Criticality due to distance headway after the brak<strong>in</strong>g event (3): close/ high criticality,<br />
medium criticality or far/ low criticality<br />
4.6 Results<br />
This section conta<strong>in</strong>s the results of the first driv<strong>in</strong>g simulator experiment. In the first part of<br />
this section, we determ<strong>in</strong>e whether our research constructs were implemented correctly. Were<br />
the events really unexpected to the participants? Did participants have an <strong>in</strong>creased cognitive<br />
workload due to the additional mathematical task? We also study the learn<strong>in</strong>g effect to driv<strong>in</strong>g<br />
<strong>in</strong> the driv<strong>in</strong>g simulator and to the experimental setup, and the data from the trials are<br />
therefore organized chronologically <strong>in</strong> this first part. The second part shows the overall<br />
driv<strong>in</strong>g behaviour <strong>in</strong> the different trials and between-subject conditions, <strong>in</strong>clud<strong>in</strong>g one<br />
reference trial and two trials with unexpected events. In order to ensure effect comparison for
76 <strong>Driv<strong>in</strong>g</strong> <strong>Behaviour</strong> <strong>in</strong> <strong>Unexpected</strong> <strong>Situations</strong><br />
similar events, we rearranged the data for the second and fourth trials to ensure that similar<br />
conditions could be compared directly. Throughout this chapter, we will therefore refer to<br />
these three trials after rearrangement as 2-BLC (the trial with the Brak<strong>in</strong>g Lead Car), 3-Reg<br />
(the Regular reference trial) and 4-Acc (the trial with the Acceleration event). The third part<br />
zooms <strong>in</strong> on the effects of these unexpected events, focus<strong>in</strong>g specifically on speed, speed<br />
approach patterns, distance headway and lateral position and acceleration.<br />
4.6.1 Validation of research construct and setup<br />
As was described earlier <strong>in</strong> this chapter, we implemented a number of variables to determ<strong>in</strong>e<br />
how drivers adapt their behaviour as a result of unexpected situations on the road. In order to<br />
establish what these effects were, it was first necessary to determ<strong>in</strong>e whether the experimental<br />
constructs were implemented correctly. We also checked any possible effects of other factors<br />
that might have contam<strong>in</strong>ated our results, such as the characteristics of the participants and the<br />
layout of our <strong>in</strong>tersections. The effects of the varied event level will be discussed <strong>in</strong> Section<br />
4.6.4, after rearrang<strong>in</strong>g the data accord<strong>in</strong>g to the order of the conditions.<br />
4.6.1.1 Expectations about regular <strong>in</strong>tersections and unexpectedness of safety-critical events<br />
The expectations of the participants were tested by study<strong>in</strong>g the learn<strong>in</strong>g effects <strong>in</strong> their<br />
driv<strong>in</strong>g behaviour (i.e. habituation dur<strong>in</strong>g the four trials). The average driv<strong>in</strong>g speed <strong>in</strong>creased<br />
dur<strong>in</strong>g the first trial, F(2.612,86.198)=12.080, p
Chapter 4 - Experiment 1: Drivers’ reactions to unexpected events 77<br />
each trial may be the relatively long breaks between each experimental ride (approximately 15<br />
m<strong>in</strong>utes), after which participants had to get used to driv<strong>in</strong>g <strong>in</strong> the simulator aga<strong>in</strong>.<br />
Additionally, participants’ answers to two questions concern<strong>in</strong>g the predictability of the<br />
driv<strong>in</strong>g task and the behaviour of other road users were exam<strong>in</strong>ed. The answers to the two<br />
different questions did not differ significantly, F(1,31)
78 <strong>Driv<strong>in</strong>g</strong> <strong>Behaviour</strong> <strong>in</strong> <strong>Unexpected</strong> <strong>Situations</strong><br />
Figure 4.4a Effects of mental workload conditions on average PDT reaction time (ms)<br />
Figure 4.4b Effects of mental workload conditions on percentage of missed PDT stimuli
Chapter 4 - Experiment 1: Drivers’ reactions to unexpected events 79<br />
4.6.1.3 Duration of the experiment: alertness and fatigue<br />
On average, each trial took 9 ½ m<strong>in</strong>utes, and participants were given a 15-m<strong>in</strong>ute break after<br />
each trial. The reaction times to the PDT did not <strong>in</strong>crease with time; <strong>in</strong> fact, the reaction time<br />
to the PDT decreased significantly after the first ride, F(2.972,86.184)=8.229, p
80 <strong>Driv<strong>in</strong>g</strong> <strong>Behaviour</strong> <strong>in</strong> <strong>Unexpected</strong> <strong>Situations</strong><br />
Average speed (km/h)<br />
50,00<br />
40,00<br />
30,00<br />
20,00<br />
10,00<br />
0,00<br />
5<br />
6<br />
7<br />
8<br />
9<br />
10<br />
11<br />
12<br />
13<br />
Intersection<br />
Figure 4.5 Average speed at 16 <strong>in</strong>tersections for the three trials comb<strong>in</strong>ed<br />
There was also a large variation between <strong>in</strong>dividual <strong>in</strong>tersections <strong>in</strong> the location relative to the<br />
next <strong>in</strong>tersection (DTI, distance to <strong>in</strong>tersection) at which drivers reached their m<strong>in</strong>imum<br />
speed, F(10.108,333.566)=3.277, p
Chapter 4 - Experiment 1: Drivers’ reactions to unexpected events 81<br />
DTI at m<strong>in</strong>imum speed (m)<br />
35,00<br />
30,00<br />
25,00<br />
20,00<br />
15,00<br />
10,00<br />
5<br />
6<br />
7<br />
8<br />
9<br />
10<br />
11<br />
12<br />
13<br />
Intersection<br />
Figure 4.6 DTI of m<strong>in</strong>imum speed at 16 <strong>in</strong>tersections for the three trials comb<strong>in</strong>ed<br />
Distance headway also differed significantly over the sixteen <strong>in</strong>tersections,<br />
F(4.062,101.545)=5.347, p=.002, see Figure 4.7. The most prom<strong>in</strong>ent differences were aga<strong>in</strong><br />
found at <strong>in</strong>tersections 5 and 9 and additionally at <strong>in</strong>tersection 17, with <strong>in</strong>tersections 5 and 17<br />
show<strong>in</strong>g a smaller headway and <strong>in</strong>tersection 9 a larger headway. This could partly be related<br />
to the higher (more aggressive) driv<strong>in</strong>g speed at <strong>in</strong>tersection 5 and the more defensive, lower<br />
speed at <strong>in</strong>tersection 9. The deviat<strong>in</strong>g distance headway could not be related to a difference <strong>in</strong><br />
speed at <strong>in</strong>tersection 17.<br />
14<br />
15<br />
16<br />
17<br />
18<br />
19<br />
20
82 <strong>Driv<strong>in</strong>g</strong> <strong>Behaviour</strong> <strong>in</strong> <strong>Unexpected</strong> <strong>Situations</strong><br />
Average headway (m)<br />
35<br />
30<br />
25<br />
20<br />
15<br />
5<br />
6<br />
7<br />
8<br />
9<br />
10<br />
11<br />
12<br />
13<br />
Intersection<br />
Figure 4.7 Average distance headway at 16 <strong>in</strong>tersections for the three trials comb<strong>in</strong>ed<br />
Outliers were filtered from the lateral position dataset. Based on visual <strong>in</strong>spection of the data,<br />
lateral position data with an absolute value of 2 metres and 50 centimetres or over were<br />
determ<strong>in</strong>ed outliers.<br />
The lateral position and lateral acceleration showed a number of significant changes over the<br />
sixteen <strong>in</strong>tersections, F(6.480,110.156)=27.417, p
Chapter 4 - Experiment 1: Drivers’ reactions to unexpected events 83<br />
Figure 4.8a Lateral position at the sixteen <strong>in</strong>tersections<br />
Figure 4.8b Lateral acceleration at the sixteen <strong>in</strong>tersections
84 <strong>Driv<strong>in</strong>g</strong> <strong>Behaviour</strong> <strong>in</strong> <strong>Unexpected</strong> <strong>Situations</strong><br />
4.6.2 Differences between trials: with<strong>in</strong>-subject effects on driv<strong>in</strong>g behaviour<br />
All participants drove one trial <strong>in</strong> which the lead car suddenly braked (trial 2–BLC), one<br />
reference trial (trial 3–Reg), and one trial <strong>in</strong> which a car from the left accelerated <strong>in</strong>stead of<br />
giv<strong>in</strong>g priority to the participant (trial 4–Acc). Note that the order of trials 2-BLC and 4-Acc<br />
was balanced among participants, so any effect seen <strong>in</strong> the results was not as a result of a<br />
learn<strong>in</strong>g effect, but rather due to one or both of the unexpected events. This section gives an<br />
overview of the observed driv<strong>in</strong>g behaviour <strong>in</strong> each of the full trials. The first four road<br />
sections of each trial and the last road section (where the participants stopped to park the car)<br />
are not <strong>in</strong>cluded <strong>in</strong> any of the analyses, due to the strong learn<strong>in</strong>g effect that was found <strong>in</strong><br />
these parts of the trials. All other road sections are <strong>in</strong>cluded <strong>in</strong> the analyses, which lead to<br />
averag<strong>in</strong>g over 16 road sections and three trials <strong>in</strong> total.<br />
4.6.2.1 Differences between trials: longitud<strong>in</strong>al driv<strong>in</strong>g behaviour<br />
Speed, distance headway and time headway constitute the most important attributes of<br />
longitud<strong>in</strong>al driv<strong>in</strong>g behaviour. As was described <strong>in</strong> an earlier chapter, an error <strong>in</strong> the data<br />
record<strong>in</strong>gs at the transition from one road section to another at an <strong>in</strong>tersection led to miss<strong>in</strong>g<br />
record<strong>in</strong>g of the exact distance headway values at these locations. These values were<br />
reconstructed by add<strong>in</strong>g the driver’s distance to the centre of the next <strong>in</strong>tersection and the lead<br />
car’s distance from the centre of that same <strong>in</strong>tersection. We chose to use distance headway<br />
and speed as the ma<strong>in</strong> variables describ<strong>in</strong>g follow<strong>in</strong>g behaviour <strong>in</strong> this experiment.<br />
With respect to the average speed, there was no statistically significant difference between the<br />
trial with the accelerat<strong>in</strong>g event (4-Acc) and the reference trial 3-Reg, but speed was<br />
significantly lower <strong>in</strong> trial 2-BLC, see Figure 4.9. The same was true for m<strong>in</strong>imum speed,<br />
which was lower <strong>in</strong> the brak<strong>in</strong>g event trial than <strong>in</strong> the reference trial and the trial with the<br />
accelerat<strong>in</strong>g event. However, the location at which this m<strong>in</strong>imum speed was reached (distance<br />
to the next <strong>in</strong>tersection) and the average headway did not differ between the three trials. Table<br />
4.5 gives an overview of these effects.<br />
Table 4.5 Effects of trial on average speed, m<strong>in</strong>imum speed, location of m<strong>in</strong>imum speed<br />
and average distance headway<br />
Variable 3-Reg<br />
(reference)<br />
Average speed M=44.88,<br />
SD=2.35<br />
M<strong>in</strong>imum speed M=38.04,<br />
SD=2.87<br />
DTI at m<strong>in</strong>imum M=24.84,<br />
speed<br />
SD=3.20<br />
Average distance M=24.73,<br />
headway SD=6.03<br />
2-BLC 4-Acc F, p<br />
M=42.91,<br />
SD=1.99<br />
M=35.83,<br />
SD=2.66<br />
M=25.39,<br />
SD=3.06<br />
M=25.66,<br />
SD=7.42<br />
M=45.57,<br />
SD=2.40<br />
M=38.63,<br />
SD=2.79<br />
M=24.77,<br />
SD=3.24<br />
M=25.00,<br />
SD=7.17<br />
F(1.866,55.994)=5.217,<br />
p=.010<br />
F(1.690,64.235)=4.146,<br />
p=.026<br />
F(2,67)=0.044,<br />
p=.957<br />
F(2,50) =1.648,<br />
p=.203
Chapter 4 - Experiment 1: Drivers’ reactions to unexpected events 85<br />
Figure 4.9 Average speed <strong>in</strong> trials 2–BLC, 3–Reg and 4–Acc<br />
4.6.2.2 Differences between trials: Lateral driv<strong>in</strong>g behaviour<br />
The lateral position and speed def<strong>in</strong>e at which position on the road relative to the road<br />
mark<strong>in</strong>g drivers are positioned and <strong>in</strong> which direction they move. Negative lateral speed<br />
values denote a movement to the right relative to the middle of the lane (outside of the road),<br />
whereas positive lateral speed values denote movement towards the centre l<strong>in</strong>e of the road.<br />
The type of trial (event trial or reference trial) did not affect drivers’ lateral position,<br />
F(1,17)=0.130, p=.723, nor did it affect drivers’ lateral acceleration, F(2,66)=1.453, p=.241.<br />
However, lower speeds were more prom<strong>in</strong>ent <strong>in</strong> the values used for averag<strong>in</strong>g and ceteris<br />
paribus, lower speeds can be related to smaller deviations <strong>in</strong> the lateral position (e.g., Green,<br />
L<strong>in</strong> and Bagian, 1994; also refer to Section 3.4.1). Possible side-effects of this correlation will<br />
be elaborated <strong>in</strong> Section 4.8 (Discussion of results).<br />
4.6.2.3 Differences between trials: operational compensation behaviour<br />
As was described before, the event with the suddenly brak<strong>in</strong>g lead car required actions of<br />
compensation <strong>in</strong> the longitud<strong>in</strong>al direction, such as brak<strong>in</strong>g and lower<strong>in</strong>g driv<strong>in</strong>g speed. The<br />
accelerat<strong>in</strong>g car from the left required a comb<strong>in</strong>ation of steer<strong>in</strong>g away and brak<strong>in</strong>g. With<br />
respect to the longitud<strong>in</strong>al behaviour, participants had both a lower average speed and a lower<br />
m<strong>in</strong>imum speed <strong>in</strong> trial 2-BLC than <strong>in</strong> reference trial 3-Reg, but their speed was not affected<br />
<strong>in</strong> the trial with the accelerat<strong>in</strong>g car from left. However, the location at which this m<strong>in</strong>imum
86 <strong>Driv<strong>in</strong>g</strong> <strong>Behaviour</strong> <strong>in</strong> <strong>Unexpected</strong> <strong>Situations</strong><br />
speed was reached did not vary between the trials. With respect to lateral driv<strong>in</strong>g behaviour,<br />
lateral position was not affected <strong>in</strong> any of the trials, nor was lateral acceleration. It appears<br />
that the type of compensation required partially determ<strong>in</strong>es how driv<strong>in</strong>g behaviour after the<br />
events changed.<br />
4.6.3 Effects of between-subjects factor: mental workload conditions<br />
As described <strong>in</strong> the previous chapter, half of the participants drove while perform<strong>in</strong>g an<br />
additional arithmetic task. The effect of this serial subtraction task was that mental workload<br />
<strong>in</strong>creased (see Section 4.6.1.2). When look<strong>in</strong>g at the complete trials, mental workload led to a<br />
change <strong>in</strong> driv<strong>in</strong>g behaviour, both longitud<strong>in</strong>ally and laterally.<br />
The speed pattern <strong>in</strong> the approach of the <strong>in</strong>tersection differed significantly between the two<br />
mental workload conditions over the three trials (<strong>in</strong>teraction effect 10-metre Cell x Mental<br />
workload condition), F(11,363)=2.194, p=.014 (see Figure 4.10). Participants driv<strong>in</strong>g with an<br />
additional task drove faster over the whole last 100 metres before the <strong>in</strong>tersection and hence<br />
showed a smaller range of values <strong>in</strong> the speed patterns than regular drivers. This difference<br />
became especially clear <strong>in</strong> the locations closer to the <strong>in</strong>tersection.<br />
Average speed (km/h)<br />
50<br />
45<br />
40<br />
35<br />
30<br />
100<br />
90<br />
80<br />
70<br />
60<br />
50<br />
40<br />
30<br />
Distance to Instersection (m)<br />
20<br />
10<br />
0 (centre)<br />
Mental workload<br />
condition<br />
No additional task<br />
Additional task<br />
Figure 4.10 Average speed per 10-metre cell <strong>in</strong> both Mental workload conditions<br />
Furthermore, an <strong>in</strong>teraction effect of workload and trial on average speed per <strong>in</strong>tersection was<br />
found. Participants with higher workload drove slower <strong>in</strong> trial 2-BLC than <strong>in</strong> the reference<br />
trial and trial 4-Acc, F(2,28)=6.606, p=.004, whereas regular drivers did not show a<br />
significant difference <strong>in</strong> average driv<strong>in</strong>g speeds between the three trials,
Chapter 4 - Experiment 1: Drivers’ reactions to unexpected events 87<br />
F(1.681,31.931)=0.850, p=.419. Table 4.6 and Figure 4.11 show how drivers with <strong>in</strong>creased<br />
workload drive faster than regular drivers <strong>in</strong> both the reference trial and the trial with the<br />
accelerat<strong>in</strong>g car from the left (4-Acc), but not <strong>in</strong> trial 2-BLC, <strong>in</strong> which a brak<strong>in</strong>g event took<br />
place. We will elaborate further on these <strong>in</strong>teraction effects <strong>in</strong> Section 4.5.4, when we zoom <strong>in</strong><br />
to the direct effects of the events.<br />
Table 4.6 Average and standard deviation of speed for each mental workload condition<br />
Condition Trial 2-BLC Trial 3-Reg Trial 4-Acc<br />
Without additional<br />
task<br />
M=42.66, SD=2.94 M=43.28, SD=3.11 M=43.78, SD=3.21<br />
With additional task M=43.27, SD=2.75 M=46.67, SD=3.81 M=47.51, SD=3.58<br />
Figure 4.11 Average speed, <strong>in</strong>teraction effect of mental workload condition and trial<br />
There was a significant effect of the level of mental workload on the position<strong>in</strong>g of drivers<br />
relative to the road mark<strong>in</strong>gs, F(1,17)=7.753, p=.013. Regular drivers (driv<strong>in</strong>g without an<br />
additional task) stayed more to the outside right of their lane (M=-0.17, SD=0.31) than their<br />
counterparts driv<strong>in</strong>g with an additional task, who tended to drive slightly more to the left of<br />
the centre of their lane with positive lateral position values (M=0.20, SD=0.31). <strong>Driv<strong>in</strong>g</strong> more<br />
to the outside of the lane could <strong>in</strong>dicate more defensive driv<strong>in</strong>g, although one might also<br />
argue that this is not the case <strong>in</strong> situations <strong>in</strong> which one needs to look further upstream <strong>in</strong><br />
oncom<strong>in</strong>g traffic. However, s<strong>in</strong>ce overtak<strong>in</strong>g was not an option <strong>in</strong> this experiment, this<br />
argument will not be taken <strong>in</strong>to account for this situation, and driv<strong>in</strong>g more to the outside of<br />
the lane will be considered as more defensive driv<strong>in</strong>g. Figure 4.12 shows this effect of
88 <strong>Driv<strong>in</strong>g</strong> <strong>Behaviour</strong> <strong>in</strong> <strong>Unexpected</strong> <strong>Situations</strong><br />
workload on lateral position. No other effects of mental workload condition on any of the<br />
variables measured were found.<br />
Figure 4.12 Effect of workload on lateral position (negative lateral position = right of<br />
lane centre)<br />
In the previous paragraphs, we described the mean effects of large sets of <strong>in</strong>tersections over a<br />
complete trial. The follow<strong>in</strong>g sections will zoom <strong>in</strong> to the locations where the events actually<br />
occurred. It is expected that effects of aspects directly related to the specific events, such as<br />
event urgency, will only surface when they are viewed <strong>in</strong> relation to the actual events. This is<br />
less the case for aspects which <strong>in</strong>fluence driv<strong>in</strong>g throughout the complete trial, such as mental<br />
workload.<br />
4.6.4 Effects of the unexpected events: a closer look<br />
In the next sections, we focus on the effects of the two unexpected events. These results will<br />
be used to test the <strong>in</strong>itial two hypotheses and, where applicable, develop additional<br />
hypotheses concern<strong>in</strong>g behavioural reactions to unexpected, safety-critical events and<br />
directional changes <strong>in</strong> task level <strong>in</strong>teraction.<br />
The effects of the unexpected events were only clear over a certa<strong>in</strong> stretch of route; after this,<br />
the effect decayed until it was no longer possible to dist<strong>in</strong>guish between effects of the event<br />
and normal driv<strong>in</strong>g behaviour. In order to determ<strong>in</strong>e the magnitude and length of the effects<br />
we analyzed behavioural adaptations to the unexpected events over a limited number of<br />
<strong>in</strong>tersections.
Chapter 4 - Experiment 1: Drivers’ reactions to unexpected events 89<br />
4.6.4.1 <strong>Behaviour</strong>al compensation dur<strong>in</strong>g and after the brak<strong>in</strong>g lead vehicle event<br />
The brak<strong>in</strong>g event occurred directly after <strong>in</strong>tersection 5 <strong>in</strong> trial 2–BLC. The urgency of the<br />
event was def<strong>in</strong>ed by the duration and length of the brak<strong>in</strong>g event (event levels low, medium<br />
or high). A number of behavioural changes occurred after the brak<strong>in</strong>g event. Eight<br />
<strong>in</strong>tersections <strong>in</strong>clud<strong>in</strong>g the ones directly before and after the brak<strong>in</strong>g event were used for all<br />
Analyses of Variance (ANOVA) for Repeated Measures <strong>in</strong> this section.<br />
Participants lowered their speeds for a number of <strong>in</strong>tersections directly follow<strong>in</strong>g the brak<strong>in</strong>g<br />
event, F(6.482,213.902)=3.638, p=.005. Figure 4.13 shows the speed development over the<br />
eight <strong>in</strong>tersections follow<strong>in</strong>g the brak<strong>in</strong>g event.<br />
Average speed (km/h)<br />
50,00<br />
45,00<br />
40,00<br />
35,00<br />
30,00<br />
5<br />
6<br />
7<br />
8 9 10<br />
Intersection<br />
11<br />
12<br />
13<br />
Trial<br />
2-BLC<br />
3-Reg<br />
Figure 4.13 Average speed as a function of Trial and Intersection<br />
The speed adjustment result<strong>in</strong>g from the brak<strong>in</strong>g event was different for groups with vary<strong>in</strong>g<br />
mental workload, F(1,33)=4.167, p=.049. While regular drivers did not drive at a different<br />
speed <strong>in</strong> the reference trial (M=42.90, SD=2.97) than <strong>in</strong> the trial with the brak<strong>in</strong>g lead vehicle<br />
(M=42.18, SD=2.76), those who experienced higher mental workload due to the additional<br />
task drove significantly faster <strong>in</strong> the reference trial (M=45.98, SD=3.36) than <strong>in</strong> the event trial<br />
(M=42.36, SD=3.12), see Figure 4.14.
90 <strong>Driv<strong>in</strong>g</strong> <strong>Behaviour</strong> <strong>in</strong> <strong>Unexpected</strong> <strong>Situations</strong><br />
Average speed (km/h)<br />
50,00<br />
45,00<br />
40,00<br />
35,00<br />
30,00<br />
No additional task<br />
Additional task<br />
Mental workload condition<br />
Trial<br />
2-BLC<br />
3-Reg<br />
Figure 4.14 Average speed as a function of Trial and Mental workload condition<br />
The average distance headway became larger with higher event levels, although this effect<br />
was not significant at the .05 level, F(2,25)=3.156, p=.060. The <strong>in</strong>teraction effect of Trial x<br />
Intersection (<strong>in</strong>dicat<strong>in</strong>g a change after a certa<strong>in</strong> <strong>in</strong>tersection <strong>in</strong> a certa<strong>in</strong> trial) was not<br />
significant, F(2.126,53.162)=0.214, p=.821, nor were any other effects of the brak<strong>in</strong>g event.<br />
The <strong>in</strong>teraction effect of Trial x Intersection on lateral position, which would po<strong>in</strong>t to a direct<br />
effect of the brak<strong>in</strong>g event, was not significant, F(7,161)=1.469, p=.182. S<strong>in</strong>ce there were also<br />
no significant three-way <strong>in</strong>teraction effects on lateral position, it can be concluded that lateral<br />
position was not affected by the brak<strong>in</strong>g event itself. This is accord<strong>in</strong>g to our expectations<br />
based on the type of compensation behaviour required for the brak<strong>in</strong>g event.<br />
4.6.4.2 Re-calculated criticality of the brak<strong>in</strong>g event<br />
In the programm<strong>in</strong>g phase of the experiment, the urgency of the brak<strong>in</strong>g event was set as a<br />
comb<strong>in</strong>ation of the time dur<strong>in</strong>g which the lead car would brake and the maximum distance the<br />
participant would drive dur<strong>in</strong>g this brak<strong>in</strong>g event (see Section 4.3). It was expected that there<br />
would be differences between groups <strong>in</strong> the level of conflict encountered as a result of vary<strong>in</strong>g<br />
headway after the brak<strong>in</strong>g event with this scenario (see Appendix A.1 for the annotated code<br />
for the lead vehicle). However, there turned out to be a large variation between distance<br />
headway values dur<strong>in</strong>g driv<strong>in</strong>g for <strong>in</strong>dividual drivers, which <strong>in</strong> turn led to large differences <strong>in</strong><br />
distance headway after the brak<strong>in</strong>g event with<strong>in</strong> groups as well as between groups.
Chapter 4 - Experiment 1: Drivers’ reactions to unexpected events 91<br />
In order to get more clarity on the actual criticality of the events, a new <strong>in</strong>dication of event<br />
urgency was determ<strong>in</strong>ed. A number of options exist for the classification and categorization<br />
of event urgency. Some are related to driv<strong>in</strong>g behaviour shown by the participants (e.g., brake<br />
reaction times, jerk, or maximum deceleration); others show the severity of the process or<br />
outcome of the situation (e.g., distance headway after the event or m<strong>in</strong>imum TTC). S<strong>in</strong>ce the<br />
new re-calculated event criticality is an <strong>in</strong>dependent variable <strong>in</strong>tended to show how event<br />
urgency <strong>in</strong>fluenced driv<strong>in</strong>g behaviour, choos<strong>in</strong>g an <strong>in</strong>dependent variable directly from<br />
participants’ driv<strong>in</strong>g behaviour was not an option. Therefore, we looked at options from the<br />
second type of event urgency <strong>in</strong>dicators, m<strong>in</strong>imum TTC and distance headway after the event.<br />
As the data for the TTC <strong>in</strong>cluded a large number of miss<strong>in</strong>g values (up to 60% <strong>in</strong> certa<strong>in</strong><br />
cases), it was decided that the distance headway after the event would serve as <strong>in</strong>dependent<br />
variable <strong>in</strong>dicat<strong>in</strong>g event urgency.<br />
The brak<strong>in</strong>g events were categorized accord<strong>in</strong>g to the distance headway after the brak<strong>in</strong>g<br />
event, with three categories: more than 30 metres (low criticality, N=8), 18 metres to 30<br />
metres (medium criticality, N=20), and less than 18 metres (high criticality, N=11). The<br />
correlation between this new variables and the orig<strong>in</strong>al level of urgency was r = 0.26 (N= 39),<br />
which was too small to deduce a strong positive relation between the two variables. We<br />
therefore chose to do the analyses of the data once more with the new criticality variable.<br />
S<strong>in</strong>ce the new criticality variable was based on headway after the brak<strong>in</strong>g event, headway<br />
effects of the brak<strong>in</strong>g event were not determ<strong>in</strong>ed <strong>in</strong> this section. Eight <strong>in</strong>tersections <strong>in</strong>clud<strong>in</strong>g<br />
one directly before, one dur<strong>in</strong>g and the rest after the brak<strong>in</strong>g event were aga<strong>in</strong> used for all<br />
Analyses of Variance (ANOVA) for Repeated Measures <strong>in</strong> this section, unless stated<br />
otherwise.<br />
Both average speed and m<strong>in</strong>imum speed decreased dramatically after the brak<strong>in</strong>g event<br />
(<strong>in</strong>teraction effect of Trial and Intersection), F(6,198)=2.186, p=.046 for average speed and<br />
F(7,231)=2.524, p=.016 for m<strong>in</strong>imum speed.<br />
Participants encounter<strong>in</strong>g higher criticality events on average drove at lower m<strong>in</strong>imum speeds<br />
over the two trials, F(2,33)=7.144, p=.003. It is not completely clear whether this is a causal<br />
relation, with higher criticality events lead<strong>in</strong>g to lower m<strong>in</strong>imum speeds, or a result of a<br />
positive correlation between two types of cautious driv<strong>in</strong>g behaviour. However, m<strong>in</strong>imum<br />
speed was also lowered for several <strong>in</strong>tersections directly after the brak<strong>in</strong>g event (<strong>in</strong>teraction<br />
effect of Trial and Intersection), F(7.737,55.305)=2.293, p=.023. Furthermore, the location at<br />
which this m<strong>in</strong>imum speed was reached was significantly different for the three Criticality<br />
groups, with higher criticality levels lead<strong>in</strong>g to deceleration be<strong>in</strong>g f<strong>in</strong>ished closer to the<br />
<strong>in</strong>tersection (lower DTI), F(2,33)=3.859, p=.032.<br />
The speed per 10-metre cell was changed significantly as a result of vary<strong>in</strong>g Criticality,<br />
F(2,33)=6.010, p=.006; the <strong>in</strong>teraction effect of Criticality and 10-metre Cell was also<br />
significant, po<strong>in</strong>t<strong>in</strong>g to a different speed patterns for the three Criticality groups:<br />
F(5.040,90.715)=3.589, p=.005. Furthermore, the speed pattern changed directly after the<br />
brak<strong>in</strong>g event <strong>in</strong> participants driv<strong>in</strong>g with an additional task. Figure 4.15 shows the different<br />
speed approach patterns at <strong>in</strong>tersection 6, directly after the brak<strong>in</strong>g event, for the betweenparticipant<br />
factors Mental workload condition and Criticality. Even though the 95%<br />
confidence <strong>in</strong>tervals are quite large, it is visible that there is not a big difference between<br />
levels of event urgency for the regular drivers. In the group of participants driv<strong>in</strong>g with the<br />
additional task, however, the lowest event urgency decelerated substantially less and showed<br />
a smaller range of values <strong>in</strong> the speed approach pattern than all the other groups, whereas
92 <strong>Driv<strong>in</strong>g</strong> <strong>Behaviour</strong> <strong>in</strong> <strong>Unexpected</strong> <strong>Situations</strong><br />
participants encounter<strong>in</strong>g the highest event level (High) had a much more profound<br />
deceleration curve, F(22,363)=2.143, p=.002 (three-way <strong>in</strong>teraction effect of Cell, Criticality<br />
and Mental workload condition).<br />
Average speed (km/h)<br />
60<br />
50<br />
40<br />
30<br />
20<br />
10<br />
100<br />
Mental workload condition<br />
No additional task<br />
Additional task<br />
80<br />
60<br />
40<br />
20<br />
0 (centre)<br />
100<br />
80<br />
60<br />
Distance to Intersection (m)<br />
40<br />
20<br />
0 (centre)<br />
Urgency<br />
Low<br />
Medium<br />
High<br />
Figure 4.15 Average speed as a function of criticality and distance to <strong>in</strong>tersection,<br />
without additional task (left) and with additional task (right)<br />
When look<strong>in</strong>g only at the brak<strong>in</strong>g event, participants <strong>in</strong> both mental workload conditions had<br />
similar <strong>in</strong>itial reactions on distance headway to the brak<strong>in</strong>g lead car at <strong>in</strong>tersection 6.<br />
However, participants driv<strong>in</strong>g with an additional task normalized their headway directly after<br />
this <strong>in</strong>tersection, whereas regular drivers drove with an <strong>in</strong>creased headway for a longer period<br />
of time, F(2,25)=3.402, p=.049 (Figure 4.16). Furthermore, us<strong>in</strong>g a Univariate Analysis of<br />
Variance (ANOVA) at only the path of the brak<strong>in</strong>g event, a significant <strong>in</strong>teraction effect on<br />
headway was found between event criticality and drivers’ mental workload conditions.<br />
Whereas regular drivers (no elevated mental workload) already showed a larger (distance)<br />
headway as a result of the medium critical event, this threshold was lifted for drivers with the<br />
serial subtraction task, who only showed a reaction after the most critical event,<br />
F(2,25)=6.097, p=.007. Figure 4.17 shows the <strong>in</strong>teraction.
Chapter 4 - Experiment 1: Drivers’ reactions to unexpected events 93<br />
Average headway (m)<br />
30<br />
27<br />
24<br />
21<br />
18<br />
5<br />
6<br />
7<br />
8<br />
9<br />
Intersection<br />
10<br />
11<br />
12<br />
Mental workload<br />
condition<br />
No additional task<br />
Additional task<br />
Figure 4.16 Distance headway dur<strong>in</strong>g and after the brak<strong>in</strong>g event as a function of<br />
mental workload<br />
Figure 4.17 Distance headway as a function of mental workload condition and event<br />
criticality
94 <strong>Driv<strong>in</strong>g</strong> <strong>Behaviour</strong> <strong>in</strong> <strong>Unexpected</strong> <strong>Situations</strong><br />
F<strong>in</strong>ally, we also found some <strong>in</strong>terest<strong>in</strong>g effects <strong>in</strong> the type of deceleration applied by the<br />
drivers as a result of event criticality. Participants encounter<strong>in</strong>g a lower criticality event<br />
released their gas pedal more often to decelerate, F(2,33)=6.847, p=.003, whereas participants<br />
<strong>in</strong> higher critical brak<strong>in</strong>g event would actively apply the brake pedal more often,<br />
F(2,33)=4.044, p=.027. Furthermore, participants on average braked more often after the<br />
brak<strong>in</strong>g event (<strong>in</strong>teraction effect of Trial and Intersection) than <strong>in</strong> the reference condition,<br />
although this effect was not statistically significant at the .05 level, F(13.739,226.690)=2.010,<br />
p=.056.<br />
Not surpris<strong>in</strong>gly, aga<strong>in</strong> no effects of the brak<strong>in</strong>g event (<strong>in</strong>teraction effect of Trial and<br />
Intersection) on lateral position were found with the new criticality categories,<br />
F(7,161)=1.049, p=.399, or lateral acceleration, F(4.333,142.987)=0.600, p=.676.<br />
4.6.4.3 Accelerat<strong>in</strong>g car from left<br />
The event with the suddenly accelerat<strong>in</strong>g car from the left occurred at the eighth road section<br />
<strong>in</strong> trial 4–Acc. In this section, driv<strong>in</strong>g tasks are compared between eight <strong>in</strong>tersections <strong>in</strong> trials<br />
3-Reg and 4–BLC (<strong>in</strong>tersections 7-14) us<strong>in</strong>g the two between-subject variables Mental<br />
workload condition and Event urgency.<br />
There was no effect on any of the analyzed variables that could be related directly to the<br />
accelerat<strong>in</strong>g event (which would be <strong>in</strong>dicated by a significant <strong>in</strong>teraction effect of Trial x<br />
Intersection), see Table 4.7. The urgency of the acceleration event did not have a substantial<br />
effect on average speed, F(2,33)=2.49, p=.099, m<strong>in</strong>imum speed, F(2,33)=2.89, p=.070, or<br />
lateral position, F(7,126)=1.949, p=.067. However, although these effects are not statistically<br />
significant, they do represent a trend: the more serious the acceleration event, the lower<br />
average and m<strong>in</strong>imum speed appear to be, and the more to the right of the road mark<strong>in</strong>gs<br />
people tend to drive. The average headway, on the other hand, <strong>in</strong>creased with acceleration<br />
urgency, although this change was aga<strong>in</strong> not significant at the .05 level, F(2,27)=3.25, p=.054.<br />
All of these effects po<strong>in</strong>t to slightly more cautious driv<strong>in</strong>g styles with <strong>in</strong>creas<strong>in</strong>g event<br />
urgency. Figures 4.18 a-c show these urgency effects on average speed, lateral position, and<br />
headway.<br />
Table 4.7 Interaction effects of Trial and Intersection on a number of behavioural<br />
variables after the accelerat<strong>in</strong>g event<br />
Variable F-value p-value<br />
Average speed F(6.650,219.461)=1.579 p=.147<br />
M<strong>in</strong>imum speed F(6,198)=1.265 p=.269<br />
DTI at m<strong>in</strong>imum speed F(3.803,125.485)=1.964 p=.107<br />
Distance headway F(5.828,116.567)=1.400 p=.222<br />
Lateral position F(7,161)=1.949 p=.067<br />
Lateral acceleration F(5.658,186.726)=0.674 p=.662
Chapter 4 - Experiment 1: Drivers’ reactions to unexpected events 95<br />
Figure 4.18a Effect of acceleration event urgency on average speed (ns)<br />
Figure 4.18b Effect of acceleration event urgency on lateral position (ns)
96 <strong>Driv<strong>in</strong>g</strong> <strong>Behaviour</strong> <strong>in</strong> <strong>Unexpected</strong> <strong>Situations</strong><br />
Figure 4.18c Effect of acceleration event urgency on average distance headway (ns)<br />
The speed pattern as given by the speed values averaged per 10 meter did change significantly<br />
from one <strong>in</strong>tersection to another, F(77,2541)=4.33, p
Chapter 4 - Experiment 1: Drivers’ reactions to unexpected events 97<br />
4.7 Interpretation of results and additional hypotheses<br />
The first driv<strong>in</strong>g simulator experiment revealed a number of results related to the <strong>in</strong>itial two<br />
hypotheses, and led to results on which a number of additional hypotheses for the f<strong>in</strong>al<br />
experiment can be based. This section gives an overview of these results and provides an<br />
<strong>in</strong>terpretation of their mean<strong>in</strong>g and relevance. F<strong>in</strong>ally, the hypotheses for the f<strong>in</strong>al driv<strong>in</strong>g<br />
simulator experiment will be given.<br />
4.7.1 Overview and <strong>in</strong>terpretation of results<br />
The hypotheses for this <strong>in</strong>itial experiment were as follows:<br />
The type of compensation behaviour (longitud<strong>in</strong>al, lateral, or a comb<strong>in</strong>ation) required to<br />
safely handle an unexpected, safety-critical event determ<strong>in</strong>es the type of any (temporary)<br />
behavioural effect. Therefore, longitud<strong>in</strong>al compensation behaviour leads to changes <strong>in</strong><br />
longitud<strong>in</strong>al driv<strong>in</strong>g behaviour only, and lateral compensation behaviour leads to changes<br />
<strong>in</strong> lateral driv<strong>in</strong>g behaviour only.<br />
After an unexpected event for which drivers need to perform compensatory actions, they<br />
adapt their driv<strong>in</strong>g behaviour. This is the result of a directional switch <strong>in</strong> task level<br />
<strong>in</strong>teraction.<br />
As was described <strong>in</strong> the <strong>in</strong>troduction of this chapter, the aim of this experiment was to test<br />
these hypotheses about behavioural adaptations result<strong>in</strong>g from changes <strong>in</strong> task level<br />
<strong>in</strong>teractions and expand these hypotheses, develop<strong>in</strong>g additional hypotheses relat<strong>in</strong>g to the<br />
<strong>in</strong>fluence of mental workload and event urgency.<br />
The results presented <strong>in</strong> the previous section revealed a number of trends related to the<br />
behavioural changes after an unexpected event, and more specifically, to the <strong>in</strong>fluence of<br />
mental workload and event level. First of all, our expectation about different compensatory<br />
actions result<strong>in</strong>g <strong>in</strong> different types of behavioural changes was supported. The two different<br />
types of required compensation behaviour <strong>in</strong>deed led to different effects after the unexpected<br />
events. Initial compensation to the (longitud<strong>in</strong>al) brak<strong>in</strong>g event <strong>in</strong>cluded lower<strong>in</strong>g<br />
(longitud<strong>in</strong>al) speed, and this event later resulted <strong>in</strong> lower speeds but no change <strong>in</strong> lateral<br />
driv<strong>in</strong>g behaviour. The acceleration event required both deceleration and mov<strong>in</strong>g to a safer<br />
lateral position, but did not result <strong>in</strong> behavioural changes that could be directly l<strong>in</strong>ked to this<br />
event. In other words, the type of compensation required to safely handle a safety-critical<br />
event does temporarily <strong>in</strong>fluence the behaviour after this event. However, <strong>in</strong>itial lateral<br />
compensatory actions were not shown to lead to behavioural adaptation regard<strong>in</strong>g tasks <strong>in</strong> the<br />
lateral direction. The first hypothesis will therefore be slightly altered.<br />
Both the average and m<strong>in</strong>imum speed per <strong>in</strong>tersection were lowered for a number of road<br />
sections as a result of a sudden brak<strong>in</strong>g event, while headway <strong>in</strong>creased. This suggests that<br />
drivers temporarily drove more cautiously after encounter<strong>in</strong>g an unexpected brak<strong>in</strong>g event.<br />
We studied event level <strong>in</strong> two ways: by us<strong>in</strong>g the orig<strong>in</strong>al deceleration distance and duration,<br />
and as def<strong>in</strong>ed by the participant’s headway directly after the brak<strong>in</strong>g event. The reason for<br />
choos<strong>in</strong>g the second <strong>in</strong>dication of event level was that the m<strong>in</strong>imum distance between two<br />
vehicles is related to the level of conflict, and that this is not necessarily <strong>in</strong>cluded <strong>in</strong> the first<br />
measure of event level. The latter event level <strong>in</strong>deed showed to be a better predictor of<br />
behavioural changes after the brak<strong>in</strong>g event, with significant effects on the average and
98 <strong>Driv<strong>in</strong>g</strong> <strong>Behaviour</strong> <strong>in</strong> <strong>Unexpected</strong> <strong>Situations</strong><br />
m<strong>in</strong>imum speed values after the brak<strong>in</strong>g event, and on the location at which drivers ended<br />
their deceleration and reached their m<strong>in</strong>imum speed. A significant effect on the way <strong>in</strong> which<br />
participants decelerated was also found, with lower criticality lead<strong>in</strong>g to more passive<br />
deceleration (by means of releas<strong>in</strong>g the gas pedal) and the highest criticality level lead<strong>in</strong>g to<br />
active brak<strong>in</strong>g. Summariz<strong>in</strong>g, a brak<strong>in</strong>g event with a higher criticality led to a stronger change<br />
<strong>in</strong> driv<strong>in</strong>g style from normal to more cautious than a less critical brak<strong>in</strong>g event, and this<br />
change was furthermore reached by more active changes and ways of deceleration <strong>in</strong> the<br />
critical situation than <strong>in</strong> the less safety-critical situation. These results might partially be<br />
effects of the brak<strong>in</strong>g event, and could also be connected to a certa<strong>in</strong> driv<strong>in</strong>g style.<br />
Participants who chose a larger headway might also be the participants who generally drive<br />
more slowly and change their speed on an <strong>in</strong>tersection area less (smaller range of values <strong>in</strong> the<br />
speed pattern). This could account for the fact that this same group reached their m<strong>in</strong>imum<br />
speed at a location closer to the <strong>in</strong>tersection centre.<br />
The most strik<strong>in</strong>g effects were seen <strong>in</strong> the <strong>in</strong>teractions with the additional task. It was found<br />
that, when controll<strong>in</strong>g for <strong>in</strong>cident criticality, participants <strong>in</strong> both mental workload conditions<br />
had similar <strong>in</strong>itial headway reactions to the brak<strong>in</strong>g lead car, but different reaction durations.<br />
After the first road section follow<strong>in</strong>g the event, regular drivers cont<strong>in</strong>ued to drive with an<br />
<strong>in</strong>creased headway for some time, whereas participants with high workload directly<br />
normalized their headway. In other words, drivers with high mental workload <strong>in</strong>itially reacted<br />
<strong>in</strong> the same cautious manner as did normal drivers, but fell back to their normal driv<strong>in</strong>g<br />
behaviour much faster than drivers who could completely focus on driv<strong>in</strong>g. Moreover, the<br />
threshold for <strong>in</strong>creas<strong>in</strong>g the headway after an unexpected brak<strong>in</strong>g event was higher when<br />
driv<strong>in</strong>g while perform<strong>in</strong>g an additional task than <strong>in</strong> normal workload circumstances. Whereas<br />
regular drivers reacted to both medium and high criticality events by <strong>in</strong>creas<strong>in</strong>g their<br />
headway, drivers with high workload only responded to the most serious event category.<br />
Apparently, only the most serious brak<strong>in</strong>g event triggered this latter group of drivers.<br />
Furthermore, drivers with an additional task approached faster and with a less profound speed<br />
pattern (smaller range of values) when encounter<strong>in</strong>g low criticality events, whereas the<br />
highest event criticality was related to a more profound deceleration curve than for drivers<br />
without an additional task. A possible explanation could be that drivers with higher workload<br />
are more occupied with their additional task and therefore give less attention to the<br />
unexpected event. They might generally drive more habitually and give less conscious control<br />
to parts of their driv<strong>in</strong>g task, s<strong>in</strong>ce they have less available attentional resources to react to<br />
cues <strong>in</strong> their environment. However, when the unexpected event reaches a certa<strong>in</strong> threshold,<br />
its effect appears to come through more strongly, lead<strong>in</strong>g to a strong change <strong>in</strong> behaviour.<br />
This was also seen <strong>in</strong> distance headway effects: participants with an additional task react<br />
stronger but shorter to the brak<strong>in</strong>g event than participants without an additional task.<br />
F<strong>in</strong>ally, drivers with high workload drove more to the left side of their lane. One could argue<br />
that driv<strong>in</strong>g on the left side of the lane could give drivers the opportunity to see further<br />
upstream <strong>in</strong> the oppos<strong>in</strong>g direction when driv<strong>in</strong>g with a lead<strong>in</strong>g vehicle that might obscure the<br />
driver’s l<strong>in</strong>e of sight. This would mostly be useful <strong>in</strong> situations where the driver is plann<strong>in</strong>g to<br />
overtake <strong>in</strong> the near future. However, it could also be seen as less cautious driv<strong>in</strong>g, s<strong>in</strong>ce the<br />
lateral position of the vehicle is closer to oppos<strong>in</strong>g traffic, lead<strong>in</strong>g to a higher risk of head-on<br />
conflicts. This is especially the case for our experimental setup, <strong>in</strong> which the lateral position<br />
of oppos<strong>in</strong>g road users was fixed, overtak<strong>in</strong>g was neither part of the task nor possible, and<br />
driv<strong>in</strong>g more to the left side of the lane therefore directly entailed driv<strong>in</strong>g closer to the<br />
oppos<strong>in</strong>g traffic without direct use. Moreover, the other actions also po<strong>in</strong>ted to less cautious
Chapter 4 - Experiment 1: Drivers’ reactions to unexpected events 99<br />
driv<strong>in</strong>g <strong>in</strong> high mental workload conditions. For <strong>in</strong>stance, decelerat<strong>in</strong>g to obta<strong>in</strong> a good<br />
overview when approach<strong>in</strong>g an <strong>in</strong>tersection can generally also be labelled as driv<strong>in</strong>g<br />
cautiously, and drivers with <strong>in</strong>creased workload showed this behaviour less than drivers with<br />
normal mental workload levels. We therefore conclude that <strong>in</strong>creased mental workload seems<br />
to lead to a less cautious driv<strong>in</strong>g style. The additional task might take some of the attention<br />
required for safe and cautious driv<strong>in</strong>g away from the available resources, lead<strong>in</strong>g to<br />
performance reduction and possibly distraction.<br />
Conclud<strong>in</strong>g, we can say that:<br />
Drivers who can focus most or all of their attention on the driv<strong>in</strong>g task temporarily drive<br />
at a defensive or cautious driv<strong>in</strong>g style as a result of a safety-critical brak<strong>in</strong>g event. They<br />
lower their speeds and keep larger headways.<br />
Drivers who have to divide their attention between driv<strong>in</strong>g and an additional task either do<br />
not show this defensive driv<strong>in</strong>g style, or quit this driv<strong>in</strong>g style sooner.<br />
Drivers spend less attention on certa<strong>in</strong> aspects of the driv<strong>in</strong>g task, such as decelerat<strong>in</strong>g<br />
before an <strong>in</strong>tersection, keep<strong>in</strong>g right, and ma<strong>in</strong>ta<strong>in</strong><strong>in</strong>g an appropriate speed, when driv<strong>in</strong>g<br />
with an additional task. This is also reflected <strong>in</strong> the fact that drivers under high mental<br />
workload only respond to highly critical events, whereas drivers under normal<br />
circumstances respond to all levels of events.<br />
The level of safety-criticality of a brak<strong>in</strong>g event does not <strong>in</strong>fluence the complete approach<br />
pattern of normal drivers, but it does <strong>in</strong>fluence the way <strong>in</strong> which drivers decelerate; higher<br />
criticality events evoke a more active way of deceleration (i.e., through brak<strong>in</strong>g) than less<br />
critical events, after which drivers more often release the gas pedal.<br />
Drivers with an additional task rema<strong>in</strong> to drive faster and with a less profound speed<br />
pattern than normal drivers dur<strong>in</strong>g the brak<strong>in</strong>g event (i.e., the range of speed values is<br />
smaller). This might be a result from the division of attention between the driv<strong>in</strong>g task and<br />
the additional task, lead<strong>in</strong>g to a lower level of awareness of the safety-criticality of the<br />
event. However, when the brak<strong>in</strong>g event reaches a certa<strong>in</strong> threshold, drivers with high<br />
mental workload react stronger, as if they are startled more than regular drivers. The level<br />
of criticality does not <strong>in</strong>fluence the speed pattern of regular drivers.<br />
This means that the first hypothesis on the type of compensatory actions lead<strong>in</strong>g to a specific<br />
type of behavioural adaptation, was only supported for longitud<strong>in</strong>al tasks, so this hypothesis<br />
will be optimized for the next experiment. Our second hypothesis, regard<strong>in</strong>g the effect of an<br />
unexpected event on behavioural adaptation, was supported, but more <strong>in</strong>formation about this<br />
behavioural compensation and the effects of external factors such as mental workload and<br />
event urgency was found. This second hypothesis will therefore be expanded for test<strong>in</strong>g <strong>in</strong> the<br />
next experiment.<br />
4.7.2 Hypotheses for f<strong>in</strong>al experiment<br />
Based on our results, we conclude that the type of compensation (longitud<strong>in</strong>al, lateral, or a<br />
comb<strong>in</strong>ation) required to safely handle an unexpected, safety-critical event determ<strong>in</strong>es the<br />
type of any behavioural effect shown for some time after the event. As lateral compensation<br />
behaviour did not lead to any longer-term effects, the f<strong>in</strong>al simulator experiment will focus<br />
only on longitud<strong>in</strong>al compensation behaviour and the related (temporary) behavioural effects.<br />
The additional hypotheses for this f<strong>in</strong>al experiment are formulated as follows:
100 <strong>Driv<strong>in</strong>g</strong> <strong>Behaviour</strong> <strong>in</strong> <strong>Unexpected</strong> <strong>Situations</strong><br />
Drivers driv<strong>in</strong>g with high mental workload pay less attention to the driv<strong>in</strong>g task, lead<strong>in</strong>g<br />
to a more <strong>in</strong>attentive style of driv<strong>in</strong>g; <strong>in</strong> other words, they are driv<strong>in</strong>g on <strong>in</strong> an automatic<br />
fashion.<br />
Drivers have a more defensive driv<strong>in</strong>g style after encounter<strong>in</strong>g a safety-critical situation<br />
when they can focus their full attention to the driv<strong>in</strong>g task. When this is not the case, for<br />
<strong>in</strong>stance when driv<strong>in</strong>g with the pressure of high mental workload, this defensive driv<strong>in</strong>g<br />
behaviour dim<strong>in</strong>ishes quickly.<br />
Although drivers quit their defensive driv<strong>in</strong>g style when driv<strong>in</strong>g under pressure, the<br />
defensiveness re-emerges even stronger when the unexpected event reaches a certa<strong>in</strong><br />
threshold of safety-criticality. In other words, startled drivers can get pulled out of their<br />
<strong>in</strong>attentive/ habitual driv<strong>in</strong>g style if the level of event criticality is high enough.<br />
4.8 Consequences of current experimental setup for results and lessons<br />
learned<br />
The validity of the results was checked by scrut<strong>in</strong>iz<strong>in</strong>g the experimental setup and the<br />
aggregation method for calculat<strong>in</strong>g the variables. Four categories of aspects of the<br />
experimental setup were <strong>in</strong>vestigated:<br />
Layout of virtual environment<br />
Programm<strong>in</strong>g of unexpected events<br />
Programm<strong>in</strong>g of the lead car’s speed choice<br />
Data record<strong>in</strong>g<br />
4.8.1 Layout of virtual environment<br />
The layout of certa<strong>in</strong> <strong>in</strong>dividual <strong>in</strong>tersections had a significant effect on a number of variables.<br />
Intersections 5, 6, 9, 10, 13 and 17 showed to <strong>in</strong>fluence longitud<strong>in</strong>al driv<strong>in</strong>g behaviour<br />
whereas <strong>in</strong>tersections 5, 10, 12 and 14 showed to be different from other <strong>in</strong>tersections with<br />
respect to its effect on lateral driv<strong>in</strong>g behaviour, which might lead to an overestimation or<br />
underestimation of some of the results at this <strong>in</strong>tersection. Intersection 10 was preceded by a<br />
bend, which probably led to the relatively large deviation <strong>in</strong> lateral position directed towards<br />
the outside (right side) of the lane. When comb<strong>in</strong><strong>in</strong>g both headway and speed, drivers drove<br />
more aggressive (driv<strong>in</strong>g faster with smaller headway) at <strong>in</strong>tersection 5, but more defensive<br />
(larger headway and lower speed) at <strong>in</strong>tersection 9 than at other <strong>in</strong>tersections.<br />
Although all <strong>in</strong>tersections were designed to be similar <strong>in</strong> setup, the build<strong>in</strong>gs fram<strong>in</strong>g the<br />
streets turned out to be placed a little closer to the street <strong>in</strong> a limited number of <strong>in</strong>tersections.<br />
The fact that a full view of the side street was only possible at a farther location than at other<br />
side streets might have resulted <strong>in</strong> participants driv<strong>in</strong>g at lower speeds and ma<strong>in</strong>ta<strong>in</strong><strong>in</strong>g a<br />
lower speed for a longer time, overall lead<strong>in</strong>g to a lower average speed at some <strong>in</strong>tersections.<br />
Furthermore, a rather large number of participants fell ill with driv<strong>in</strong>g simulator sickness<br />
dur<strong>in</strong>g the experiment (11 participants had to stop because of serious dizz<strong>in</strong>ess or nausea,<br />
which is equivalent to 13% of the total group of participants). Most of them compla<strong>in</strong>ed of<br />
objects <strong>in</strong> the virtual environment flash<strong>in</strong>g past rather quickly as they drove through the road<br />
environment, which made the driv<strong>in</strong>g environment unpleasantly dense <strong>in</strong> their perception.
Chapter 4 - Experiment 1: Drivers’ reactions to unexpected events 101<br />
Studies <strong>in</strong>to driv<strong>in</strong>g simulator sickness have revealed that it is related to a discrepancy<br />
between cues (both auditory and visual) and motion feedback. Accord<strong>in</strong>g to this sensory (or<br />
cue) conflict theory, this discrepancy <strong>in</strong>duces discomfort and a number of different symptoms<br />
related to simulator sickness (L<strong>in</strong>, Abi-Rached & Lahav, 2004). Other simulator aspects<br />
related to simulator sickness <strong>in</strong>clude the scene content, flicker, the duration of the experiment,<br />
the number of unusual movements, the angle and rate of movements made, and the screen<br />
refresh rate and resolution (Kolas<strong>in</strong>ski, 1995). In order to optimally avoid simulator sickness,<br />
some aspects of the setup of the next experiment will be altered from the current setup. This<br />
<strong>in</strong>cludes plac<strong>in</strong>g objects <strong>in</strong> the virtual environment farther away from the road, creat<strong>in</strong>g more<br />
straight roads as opposed to bends, and us<strong>in</strong>g a simulator with optimal motion feedback and<br />
screen quality. Unfortunately, these alterations to the setup do not guarantee that simulator<br />
sickness is no longer a risk, but they do m<strong>in</strong>imize the chance of simulator sickness.<br />
4.8.2 Programm<strong>in</strong>g of unexpected events<br />
The unexpected events could occur at three levels: low, medium and high urgency. Urgency<br />
of the brak<strong>in</strong>g event was programmed as the distance participants had travelled dur<strong>in</strong>g the<br />
duration of the brak<strong>in</strong>g of the lead vehicle (so the closer participants came to the lead car<br />
relative to the start of the event, the higher the urgency level). This would give a good<br />
<strong>in</strong>dication of event urgency if participants were at exactly the same time headway from the<br />
lead vehicle right before it would brake. However, participants were free (with<strong>in</strong> limits) to<br />
choose their own headway at all times and this variable did not take <strong>in</strong>to account the <strong>in</strong>itial<br />
distance between the lead vehicle and the participant. The effects of the variable ‘urgency’<br />
were only found to be significant for headway (larger headway after more serious events) and<br />
lateral position (drivers encounter<strong>in</strong>g the most serious events drove more to the outside of the<br />
road). When we looked at a different realization of event level, namely the headway to the<br />
lead vehicle at the moment directly after the event had f<strong>in</strong>ished, the effects of the variable<br />
<strong>in</strong>creased dramatically. This event level <strong>in</strong>dicator, ‘criticality’, was of significant <strong>in</strong>fluence on<br />
average speed, m<strong>in</strong>imum speed and speed pattern (as measured by the location of the<br />
m<strong>in</strong>imum speed and the speed values per 10 metres). Lateral position was not <strong>in</strong>fluenced by<br />
this measurement of urgency. It can be concluded that the urgency of the brak<strong>in</strong>g event was<br />
designed suboptimally. The duration of the brak<strong>in</strong>g event and the distance travelled dur<strong>in</strong>g<br />
this time were not always directly related to the participants’ experience of urgency. In further<br />
research, the urgency of unexpected events should be related to conflict measures, for <strong>in</strong>stance<br />
by us<strong>in</strong>g time-to-collision or m<strong>in</strong>imum time headway.<br />
4.8.3 Programm<strong>in</strong>g of lead car’s speed choice<br />
As was described <strong>in</strong> the previous chapter, the lead car was programmed to choose a desired<br />
speed based on headway values between the participant and the lead vehicle. Effects of this<br />
<strong>in</strong>teraction between speed and headway, caused by this way of bas<strong>in</strong>g a desired speed on the<br />
current headway, can therefore not be ruled out. Furthermore, an <strong>in</strong>direct <strong>in</strong>teraction was<br />
discovered between the participant’s speed choice and the behaviour of the vehicle<br />
approach<strong>in</strong>g the <strong>in</strong>tersection from the right side street at each <strong>in</strong>tersection. If the participant<br />
decelerated early before the <strong>in</strong>tersection and kept a large distance to the lead car, the vehicle<br />
from the right would also decelerate. This would cause the lead car and the car approach<strong>in</strong>g<br />
from the right to come <strong>in</strong>to conflict. The lead car would then decelerate <strong>in</strong> order to give way<br />
to the car com<strong>in</strong>g from the right, result<strong>in</strong>g <strong>in</strong> a decreas<strong>in</strong>g headway. Participants keep<strong>in</strong>g a
102 <strong>Driv<strong>in</strong>g</strong> <strong>Behaviour</strong> <strong>in</strong> <strong>Unexpected</strong> <strong>Situations</strong><br />
large headway and decelerat<strong>in</strong>g at large distances to <strong>in</strong>tersections are probably more cautious<br />
drivers than others, and this cautiousness could be encouraged by the <strong>in</strong>teraction with the car<br />
from the right lead<strong>in</strong>g to the lead car’s behaviour at certa<strong>in</strong> <strong>in</strong>tersections. Future experiments<br />
should try to avoid these <strong>in</strong>teractions between variables and between vehicles.<br />
4.8.4 Data record<strong>in</strong>g<br />
The raw data <strong>in</strong> this experiment were sampled with 256 Hz, which is the default sampl<strong>in</strong>g rate<br />
of StSoftware (also see Table 3.2). This led to a situation <strong>in</strong> which more values were recorded<br />
for the stretch of road if participants drove this distance at a lower speed than if they would<br />
have driven the same distance at a higher speed. As was described <strong>in</strong> Section 3.4.2, the<br />
average speed was calculated by divid<strong>in</strong>g the distance driven (either 100 metres for<br />
<strong>in</strong>tersections, or 10 metres for 10-metre cells) by the time it took to drive this distance; all<br />
other variables were calculated by add<strong>in</strong>g all recorded values over a specific stretch of road,<br />
and divid<strong>in</strong>g them by the number of values <strong>in</strong> this calculation.<br />
The headway was lowered for one <strong>in</strong>tersection <strong>in</strong> all mental workload conditions, but directly<br />
normalized aga<strong>in</strong> <strong>in</strong> high mental workload conditions. This difference might be actually larger<br />
than we calculated with the current averaged values, s<strong>in</strong>ce the driv<strong>in</strong>g speed rema<strong>in</strong>ed lower<br />
for a number of <strong>in</strong>tersections. With stretches of road driven at lower speeds be<strong>in</strong>g more<br />
prom<strong>in</strong>ent, <strong>in</strong>creases <strong>in</strong> headway values might have been slightly averaged out by the<br />
aggregation method. Large lateral position effects are also likely to be underestimated due to<br />
this way of calculat<strong>in</strong>g the average value, s<strong>in</strong>ce lower speeds are often related to smaller<br />
lateral position deviations.<br />
F<strong>in</strong>ally, the level of mental workload was measured us<strong>in</strong>g a secondary (or <strong>in</strong> some cases<br />
tertiary) task, the Peripheral Detection Task. Although this is a valid and highly sensitive<br />
measure of fluctuations <strong>in</strong> mental workload (Jahn et al., 2005), <strong>in</strong>clud<strong>in</strong>g additional measures<br />
sometimes leads to more optimal <strong>in</strong>formation about the causes of mental workload<br />
fluctuation. Accord<strong>in</strong>g to De Waard (1996), different measures are sensitive to different<br />
mental workload regions (please refer to Chapter 2 for more <strong>in</strong>formation on mental workload<br />
regions). Where possible, future experiments should not only <strong>in</strong>clude <strong>in</strong>formation about<br />
primary task performance and PDT performance, but should also <strong>in</strong>clude performance rates<br />
for the secondary tasks which were used to elevate mental workload, and preferably a<br />
physiological measure of mental workload.<br />
4.8.5 Modifications on experimental setup for f<strong>in</strong>al experiment - lessons learned<br />
Based on the discussion of validity, experimental setup and hypotheses, the follow<strong>in</strong>g<br />
modifications will be made to the experimental setup as compared to the current experiment:<br />
Every road section will have a similar <strong>in</strong>frastructure and layout, <strong>in</strong>clud<strong>in</strong>g the level of<br />
sight at <strong>in</strong>tersections.<br />
No bends or other road <strong>in</strong>frastructure shapes will be made <strong>in</strong> the blocks <strong>in</strong> which driv<strong>in</strong>g<br />
behaviour is measured.<br />
Any <strong>in</strong>teraction between the different road users <strong>in</strong> programmed speed choice behaviour<br />
will be avoided as far as possible.
Chapter 4 - Experiment 1: Drivers’ reactions to unexpected events 103<br />
The behaviour of the lead vehicle will be based on the time headway of the participant<br />
rather than on the headway, s<strong>in</strong>ce this relates closer to realistic speed choice behaviour.<br />
It is difficult to generalize among different types of unexpected events. We will therefore<br />
focus on only one type, namely a safety-critical brak<strong>in</strong>g event. The level of conflict (e.g.,<br />
time-to-collision, time headway) will be determ<strong>in</strong>ed to assess the event criticality level.<br />
The focus will be on the <strong>in</strong>teraction of mental workload level and event criticality. In<br />
order to get a complete view of the development of the mental workload dur<strong>in</strong>g the<br />
experiment, PDT performance, secondary (arithmetic) task performance and a<br />
physiological measure will be recorded. Furthermore, mental workload level will be made<br />
a with<strong>in</strong>-subjects factor, so that valid conclusions can be drawn based on smaller<br />
participant numbers.<br />
Build<strong>in</strong>gs will be placed farther away from the road, s<strong>in</strong>ce a relationship between<br />
closeness of large objects and simulator sickness is expected.<br />
The mov<strong>in</strong>g base simulator will be used, <strong>in</strong> order to <strong>in</strong>crease <strong>in</strong>ternal simulator validity,<br />
<strong>in</strong>crease screen resolution, provide motion feedback and thus reduce simulator sickness.
104 <strong>Driv<strong>in</strong>g</strong> <strong>Behaviour</strong> <strong>in</strong> <strong>Unexpected</strong> <strong>Situations</strong>
Chapter 5<br />
Experiment 2: Effects of unexpected brak<strong>in</strong>g events<br />
under vary<strong>in</strong>g mental workload conditions<br />
Based on the first driv<strong>in</strong>g simulator experiment, described <strong>in</strong> Chapter 4, we developed a<br />
number of hypotheses regard<strong>in</strong>g behavioural change result<strong>in</strong>g from unexpected events and<br />
the effects of several other factors, such as mental workload and event urgency. The analyses<br />
of the first experiment revealed some limitations to the experimental setup with regard to<br />
differences <strong>in</strong> the layout of <strong>in</strong>dividual <strong>in</strong>tersections, data record<strong>in</strong>g, and the determ<strong>in</strong>ation of<br />
the level of mental workload. The current experiment was designed to <strong>in</strong>corporate<br />
improvements on these aspects. After describ<strong>in</strong>g the method and setup of the experiment, an<br />
overview of the experimental results is given. The chapter concludes with a discussion of the<br />
generalizability of the results and a note on the experimental setup.<br />
105
106 <strong>Driv<strong>in</strong>g</strong> <strong>Behaviour</strong> <strong>in</strong> <strong>Unexpected</strong> <strong>Situations</strong>
Chapter 5 - Experiment 2: Effects of unexpected brak<strong>in</strong>g events under vary<strong>in</strong>g mental workload conditions 107<br />
5.1 Hypotheses<br />
T<br />
he hypotheses for the current driv<strong>in</strong>g simulator experiment, based on the results from<br />
the first experiment, are as follows:<br />
Drivers driv<strong>in</strong>g with elevated mental workload pay less attention to the driv<strong>in</strong>g task,<br />
lead<strong>in</strong>g to a more <strong>in</strong>attentive style of driv<strong>in</strong>g; <strong>in</strong> other words, they are driv<strong>in</strong>g <strong>in</strong> an<br />
automatic fashion.<br />
Drivers have a more defensive driv<strong>in</strong>g style after encounter<strong>in</strong>g a safety-critical situation<br />
when they can focus their full attention to the driv<strong>in</strong>g task. When this is not the case, for<br />
<strong>in</strong>stance when driv<strong>in</strong>g with the pressure of high mental workload, this defensive driv<strong>in</strong>g<br />
behaviour dim<strong>in</strong>ishes quickly.<br />
Although drivers quit their defensive driv<strong>in</strong>g style when driv<strong>in</strong>g under pressure, the<br />
defensiveness re-emerges even stronger when the unexpected event reaches a certa<strong>in</strong><br />
threshold of safety-criticality. In other words, startled drivers can get pulled out of their<br />
<strong>in</strong>attentive/ habitual driv<strong>in</strong>g style if the level of event criticality is high enough.<br />
A fourth hypothesis, which was formed earlier based on the model by Michon (1971, 1985)<br />
and was studied <strong>in</strong> the first driv<strong>in</strong>g simulator experiment, concerns the type of compensation<br />
and the related changes <strong>in</strong> driv<strong>in</strong>g behaviour, result<strong>in</strong>g from bottom-up <strong>in</strong>fluence between the<br />
driv<strong>in</strong>g tasks.<br />
The type of compensation (longitud<strong>in</strong>al, lateral, or a comb<strong>in</strong>ation) required to safely<br />
handle an unexpected, safety-critical event determ<strong>in</strong>es the type of any (temporary)<br />
behavioural effect. Therefore, longitud<strong>in</strong>al compensation behaviour leads to changes <strong>in</strong><br />
longitud<strong>in</strong>al driv<strong>in</strong>g behaviour only.<br />
5.2 Research tools<br />
The f<strong>in</strong>al driv<strong>in</strong>g simulator study was performed <strong>in</strong> order to test the hypotheses about<br />
behavioural adaptations result<strong>in</strong>g from changes <strong>in</strong> task level <strong>in</strong>teractions, about the <strong>in</strong>fluence<br />
of mental workload and event urgency. Our data therefore <strong>in</strong>cluded driv<strong>in</strong>g behaviour<br />
measurements, mental workload measurements, and <strong>in</strong>formation on drivers’ perceptions and<br />
expectations.<br />
The experiment was performed <strong>in</strong> the TNO Human Factors mov<strong>in</strong>g-based driv<strong>in</strong>g simulator<br />
with automatic transmission. This mov<strong>in</strong>g-base driv<strong>in</strong>g simulator (Figure 5.1) consists of the<br />
follow<strong>in</strong>g sub systems:<br />
The Mock-up, a BMW 318I with automatic transmission, left seated driver, and normal<br />
controls<br />
The vehicle model computer, which calculates the simultaneous position and head<strong>in</strong>g of<br />
the simulated vehicle<br />
The Motion Base System, a 6 degrees of freedom MOOG 2000E hexapod motion<br />
platform with the associated control equipment
108 <strong>Driv<strong>in</strong>g</strong> <strong>Behaviour</strong> <strong>in</strong> <strong>Unexpected</strong> <strong>Situations</strong><br />
The outside visual, a projected image on a radial screen <strong>in</strong> front of the mock-up, with a<br />
field of view of 120 o horizontal and 35 o vertical, and two large screens beh<strong>in</strong>d the mockup,<br />
project<strong>in</strong>g the rear-view images reflected <strong>in</strong> the car’s mirrors<br />
A 34” LCD display, mounted <strong>in</strong> the rear of the mock-up, for rear view display<br />
A supervisor computer for the communication with the experimenter and the other<br />
subsystems, the control and monitor<strong>in</strong>g of the experiment, data storage, controll<strong>in</strong>g the<br />
behaviour of other traffic, et cetera<br />
Figure 5.1 TNO’s mov<strong>in</strong>g-base driv<strong>in</strong>g simulator<br />
Furthermore, the video and sound are processed through separate PC systems. The Motion<br />
Base System <strong>in</strong>creases external validity (Kapte<strong>in</strong>, Theeuwes & Van der Horst, 1996).<br />
In order to assess participants’ mental workload dur<strong>in</strong>g driv<strong>in</strong>g, their heart rate and heart rate<br />
variability were measured us<strong>in</strong>g a Polar S810i tra<strong>in</strong><strong>in</strong>g computer and transmitter dur<strong>in</strong>g<br />
driv<strong>in</strong>g. Furthermore, participants were required to perform the Peripheral Detection Task<br />
(PDT) (Van W<strong>in</strong>sum, Martens & Herland, 1999) dur<strong>in</strong>g driv<strong>in</strong>g. More on the PDT can be<br />
found <strong>in</strong> Chapter 3.2.2.<br />
5.3 Participants<br />
A total of 46 subjects participated <strong>in</strong> our experiment. The selection criteria for participants<br />
were:<br />
<strong>in</strong> possession of a driver’s license for five or more years<br />
age between 24 and 60 years old<br />
at least 7,000 km driven annually<br />
no <strong>in</strong>dication of motion sickness (e.g., no negative experience with car sickness, positive<br />
experience with driv<strong>in</strong>g simulator experiments)<br />
no <strong>in</strong>dication or history of heart disease<br />
Eight participants (17% of the total number of participants) were unable to f<strong>in</strong>ish the<br />
experiment due to simulator sickness. Furthermore, the datasets of two participants were
Chapter 5 - Experiment 2: Effects of unexpected brak<strong>in</strong>g events under vary<strong>in</strong>g mental workload conditions 109<br />
excluded from analyses due to repeated non-compliance to the traffic regulations. The<br />
analyses are therefore based on complete data sets of 36 subjects who completed the<br />
experiment. They were between 23 and 60 years old, had their driver’s license for at least five<br />
years and drove 7,000 kilometres or more annually. The average age of the 36 participants<br />
was 48.9 years (SD 11, m<strong>in</strong>imum 23, maximum 60); 29 participants were male, 7 female.<br />
Participants drove 22,190 kilometres annually on average (SD 15,250, m<strong>in</strong>imum 10,000,<br />
maximum 60,000). All participants were paid € 30, for their participation. Most of the<br />
participants had prior experience <strong>in</strong> driv<strong>in</strong>g simulator studies.<br />
5.4 Experimental design<br />
An urban layout was simulated as a long road divided <strong>in</strong>to three blocks with twenty (20) fourway<br />
<strong>in</strong>tersections each, result<strong>in</strong>g <strong>in</strong> 60 road sections for a complete trial. Subjects were<br />
<strong>in</strong>structed to drive straight on each <strong>in</strong>tersection with a maximum speed of 50 km/h and give<br />
priority to traffic com<strong>in</strong>g from the right accord<strong>in</strong>g to Dutch traffic regulations. Each of the 60<br />
road sections was at least 175 metres long, and each block of 20 road sections was separated<br />
by curvy 70-km speed limit parts. One complete trial took an average of 18 m<strong>in</strong>utes.<br />
The <strong>in</strong>frastructure was comparable at each <strong>in</strong>tersection. A lead car drove <strong>in</strong> front of the<br />
subject dur<strong>in</strong>g the whole drive, slow<strong>in</strong>g down when the subject fell too far beh<strong>in</strong>d (time<br />
headway larger than 2.5 seconds) and speed<strong>in</strong>g up when the subject came too close (time<br />
headway smaller than 0.8 seconds). Furthermore, the lead car would decelerate at 45 metres<br />
before each <strong>in</strong>tersection at a rate equivalent to releas<strong>in</strong>g the gas pedal (maximum deceleration<br />
of 1.5 m/s 2 ), as to take enough time to get a good overview of the complete <strong>in</strong>tersection<br />
situation. At 10 metres before the <strong>in</strong>tersection, the lead car would accelerate aga<strong>in</strong> to normal<br />
speed with a maximum of 2.0 m/s 2 . The lead car did not use its brake lights dur<strong>in</strong>g this<br />
manoeuvre. At certa<strong>in</strong> <strong>in</strong>tersections, a car com<strong>in</strong>g from the right or the left crossed the<br />
<strong>in</strong>tersection before the participant and the lead car. Traffic from the opposite direction<br />
approached at random <strong>in</strong>tervals with<strong>in</strong> a range of 4.0 and 10.0 seconds.<br />
The experiment consisted of two such experimental trials, which <strong>in</strong> turn consisted of three<br />
blocks of 20 road sections. The mental workload level was varied between the three different<br />
blocks of each trial, accord<strong>in</strong>g to a pre-assigned order, and <strong>in</strong> three of the <strong>in</strong> total six blocks<br />
the lead car braked. In the first trial, this was <strong>in</strong> the second block; <strong>in</strong> the second trial, the<br />
brak<strong>in</strong>g happened <strong>in</strong> the first and third block. The lead car thus braked three times <strong>in</strong> total,<br />
once for each level of mental workload. Figure 5.2 shows the overview of the two<br />
experimental trials and the order <strong>in</strong> which reference blocks and event blocks were varied.<br />
In the blocks <strong>in</strong> which the lead car braked, participants first drove six to n<strong>in</strong>e standard road<br />
sections, sett<strong>in</strong>g their expectations about the situations to come. The exact number of road<br />
sections that the participants drove before the lead car braked depended on how quickly all<br />
constra<strong>in</strong>ts for the brak<strong>in</strong>g even were met. The constra<strong>in</strong>ts were set as follows:<br />
Time headway between 1.0 and 2.0 seconds<br />
Location between 100 and 45 metres from the next <strong>in</strong>tersection<br />
If the participant had passed the first three road sections selected for brak<strong>in</strong>g (the sixth,<br />
seventh and eighth road section of the current block) and not all constra<strong>in</strong>ts had been met, the
110 <strong>Driv<strong>in</strong>g</strong> <strong>Behaviour</strong> <strong>in</strong> <strong>Unexpected</strong> <strong>Situations</strong><br />
brak<strong>in</strong>g event would take place at a largely fixed location at the fourth option, namely at the<br />
n<strong>in</strong>th road section of the block, between 80 and 90 metres from the next <strong>in</strong>tersection.<br />
Figure 5.2 Overview of experimental trials with order of mental workload conditions<br />
and event versus reference sections<br />
Either as soon as all constra<strong>in</strong>ts were met at one of the selected road sections, or at the<br />
designated fallback option (the n<strong>in</strong>th road section), the lead vehicle braked suddenly. After<br />
some time it accelerated aga<strong>in</strong> to its <strong>in</strong>itial speed. Deceleration was set at 4.0 m/s 2 for a nonurgent<br />
brak<strong>in</strong>g event, and at 5.0 m/s 2 for an urgent brak<strong>in</strong>g event, and the headway after the<br />
event was varied for the two urgency levels. Appendix A.2 provides the annotated code for<br />
the lead vehicle’s behaviour, <strong>in</strong>clud<strong>in</strong>g these brak<strong>in</strong>g events. Participants encountered either<br />
three urgent or three non-urgent brak<strong>in</strong>g events <strong>in</strong> their experimental drives; urgency of the<br />
brak<strong>in</strong>g event was therefore a between-subjects factor. Mental workload level, on the other<br />
hand, was a with<strong>in</strong>-subjects factor. This variable had three levels: no additional task (only<br />
driv<strong>in</strong>g, basel<strong>in</strong>e workload level), driv<strong>in</strong>g while perform<strong>in</strong>g an easy arithmetic task (slightly<br />
elevated workload level), and driv<strong>in</strong>g while perform<strong>in</strong>g a difficult arithmetic task (highly<br />
elevated workload level). Participants encountered all of the workload levels dur<strong>in</strong>g their<br />
experimental drives. The three brak<strong>in</strong>g events took place at different mental workload levels,<br />
so <strong>in</strong> each level of mental workload exactly one block with and one block without a brak<strong>in</strong>g<br />
event was encountered. Figure 5.2 clarifies this setup.<br />
S<strong>in</strong>ce one and the same arithmetic task can br<strong>in</strong>g vary<strong>in</strong>g levels of elevated workload for<br />
different participants, we tested the arithmetic skills of all participants before the experiment<br />
and selected the participants with ‘good arithmetic skills’ from those with ‘less arithmetic<br />
skills’. This was done by ask<strong>in</strong>g them to iteratively subtract the number four (4) from onehundred<br />
(100). If they could do this quickly and without many errors, they were considered to<br />
be <strong>in</strong> the well-skilled group; if they made many errors or were struggl<strong>in</strong>g with the task, they<br />
were assigned to the less-skilled group. The easy and difficult arithmetic tasks were different<br />
for these two groups, but the structure rema<strong>in</strong>ed the same for all tasks. Participants were<br />
<strong>in</strong>structed to iteratively subtract a one-digit number from a three-digit figure dur<strong>in</strong>g the<br />
sections with the arithmetic task. Exact serial subtraction tasks for each condition and skillgroup<br />
are given <strong>in</strong> Table 5.1. Participants were furthermore <strong>in</strong>structed to cont<strong>in</strong>uously<br />
perform the additional task and were rem<strong>in</strong>ded of their task after a number of seconds without<br />
an answer, but it rema<strong>in</strong>ed a self-paced task.
Chapter 5 - Experiment 2: Effects of unexpected brak<strong>in</strong>g events under vary<strong>in</strong>g mental workload conditions 111<br />
Table 5.1: Additional tasks for each skill-group and each elevated workload condition<br />
Skill-group Simple arithmetic task Difficult arithmetic task<br />
(slightly elevated workload) (highly elevated workload)<br />
Good arithmetic skills 850-7 850-17<br />
Bad arithmetic skills 450-4 850-13<br />
The three levels of mental workload (driv<strong>in</strong>g only, driv<strong>in</strong>g with simple arithmetic task. and<br />
driv<strong>in</strong>g with difficult arithmetic task) and the two levels of urgency (brak<strong>in</strong>g close to<br />
participant and far away from participant) were comb<strong>in</strong>ed to 12 comb<strong>in</strong>ations and<br />
counterbalanced among participants. As described before, all levels of workload were<br />
presented to all participants <strong>in</strong> a with<strong>in</strong>-subjects setup; the order of the mental workload level<br />
and the level of urgency were <strong>in</strong> a between-subjects setup. Table 5.2 shows the 12 conditions,<br />
consist<strong>in</strong>g of the comb<strong>in</strong>ation of counterbalanced orders of workload level and the urgencies<br />
of the brak<strong>in</strong>g event.<br />
Table 5.2 Twelve conditions of workload level and urgency of the brak<strong>in</strong>g event<br />
Condition Mental workload 1 Mental workload 2 Mental workload 3 Urgency<br />
1 No additional task Easy arithmetic task<br />
Difficult arithmetic<br />
task<br />
Non-urgent<br />
2 No additional task Easy arithmetic task<br />
Difficult arithmetic<br />
task<br />
Urgent<br />
3 No additional task<br />
Difficult arithmetic<br />
task<br />
Easy arithmetic task Non-urgent<br />
4 No additional task<br />
Difficult arithmetic<br />
task<br />
Easy arithmetic task Urgent<br />
5 Easy arithmetic task No additional task<br />
Difficult arithmetic<br />
task<br />
Non-urgent<br />
6 Easy arithmetic task No additional task<br />
Difficult arithmetic<br />
task<br />
Urgent<br />
7<br />
Difficult arithmetic<br />
Easy arithmetic task<br />
task<br />
No additional task Non-urgent<br />
8<br />
Difficult arithmetic<br />
Easy arithmetic task<br />
task<br />
No additional task Urgent<br />
9<br />
Difficult arithmetic<br />
task<br />
No additional task Easy arithmetic task Non-urgent<br />
10<br />
Difficult arithmetic<br />
task<br />
No additional task Easy arithmetic task Urgent<br />
11<br />
Difficult arithmetic<br />
task<br />
Easy arithmetic task No additional task Non-urgent<br />
12<br />
Difficult arithmetic<br />
task<br />
Easy arithmetic task No additional task Urgent<br />
Heart rate and heart rate variability (<strong>in</strong>ter-beat <strong>in</strong>tervals) were recorded us<strong>in</strong>g a Polar watch<br />
which could be synchronised with the data record<strong>in</strong>gs by means of digital markers <strong>in</strong> the data.<br />
The supervisor of the experiments pressed a button at the supervision panel of the driv<strong>in</strong>g<br />
simulator each time the participant started a new part of each experimental trial, so that the<br />
time <strong>in</strong> the driv<strong>in</strong>g simulator and the time on the Polar watch could be exactly matched and
112 <strong>Driv<strong>in</strong>g</strong> <strong>Behaviour</strong> <strong>in</strong> <strong>Unexpected</strong> <strong>Situations</strong><br />
the heart rate fluctuations could be related to the events and changes <strong>in</strong> mental workload.<br />
Unfortunately, these markers were not recorded properly <strong>in</strong> many of the trials. The Polar<br />
watch started the data record<strong>in</strong>gs as soon as the participants put the watch on their wrist,<br />
whereas the driv<strong>in</strong>g simulator started the record<strong>in</strong>gs as soon as the experimenter started the<br />
scenarios. Because of this ‘mismatch’ between the start<strong>in</strong>g times of the experimental trials<br />
and the start<strong>in</strong>g time of the heart rate data record<strong>in</strong>gs, the markers were necessary to relate the<br />
heart rate data to the experimental trials and the event times. Due to the loss of the markers, it<br />
was no longer possible to relate the data <strong>in</strong> the heart rate record<strong>in</strong>gs to the actual data, and<br />
many of the heart rate datasets could not be used for data analysis. Therefore, we<br />
unfortunately could not <strong>in</strong>clude heart rate data <strong>in</strong> our f<strong>in</strong>al analyses.<br />
After each of the two trials, participants were given a break and a questionnaire, with two<br />
questions about simulator sickness, three questions about the predictability of the driv<strong>in</strong>g task,<br />
the driv<strong>in</strong>g environment and the other road users, and one question ask<strong>in</strong>g whether<br />
perform<strong>in</strong>g the PDT had <strong>in</strong>terfered with their driv<strong>in</strong>g. Furthermore, three additional questions<br />
were asked about the experienced difficulty of the arithmetic tasks and whether they had<br />
<strong>in</strong>fluenced the participant’s driv<strong>in</strong>g style. Participants had to rate their answers to the<br />
questions on a 5-po<strong>in</strong>t Likert scale. The questions were phrased as follows:<br />
What did you th<strong>in</strong>k of the behaviour of other road users? Please rate your answer on the<br />
scale below.<br />
Predictable X X X X X Unpredictable<br />
What did you th<strong>in</strong>k of the predictability of the driv<strong>in</strong>g task? Please rate your answer on the<br />
scale below.<br />
Predictable X X X X X Unpredictable<br />
Participants had the opportunity to write additional remarks at the end of the questionnaire.<br />
Appendix C2 gives the full questionnaire (<strong>in</strong> Dutch).<br />
5.5 Procedure<br />
Participants were welcomed to TNO and were taken to a wait<strong>in</strong>g room. They received general<br />
<strong>in</strong>formation about the project and the driv<strong>in</strong>g simulator. Participants were then given the<br />
opportunity to ask general questions about the project and the experiment. After sign<strong>in</strong>g an<br />
<strong>in</strong>formed consent form, all participants drove one <strong>in</strong>troduction drive preced<strong>in</strong>g the actual<br />
experiment to give them the opportunity to ga<strong>in</strong> some experience with the driv<strong>in</strong>g simulator<br />
and the simulated environment.<br />
Next, participants were given more <strong>in</strong>formation about the specific arithmetic and driv<strong>in</strong>g tasks<br />
<strong>in</strong> the experiment. They were categorized accord<strong>in</strong>g to their arithmetic skills based on a short<br />
arithmetic task (see Section 5.4). After this categorization participants received their<br />
<strong>in</strong>structions. <strong>Driv<strong>in</strong>g</strong> safely was to receive the highest priority. The arithmetic task, when<br />
applicable, should be given second priority, and the PDT should receive lowest priority, but<br />
should still be completed as fast as possible. The <strong>in</strong>structions can be found <strong>in</strong> Appendix B2.
Chapter 5 - Experiment 2: Effects of unexpected brak<strong>in</strong>g events under vary<strong>in</strong>g mental workload conditions 113<br />
After a short break <strong>in</strong> which they could ask the last procedural questions, participants drove<br />
the two experimental drives. Participants were randomly assigned to one of 12 conditions, and<br />
based on this assignment they were presented with a certa<strong>in</strong> type of brak<strong>in</strong>g event (urgent or<br />
non-urgent) and the three mental workload levels <strong>in</strong> a certa<strong>in</strong> order. The mental workload<br />
levels corresponded with the three parts per drive. At the start of each new part, the supervisor<br />
of the experiment told the participant which arithmetic task, if any, he or she had to perform<br />
<strong>in</strong> that part. The experiment supervisor recorded each participant’s correct and false answers<br />
to the arithmetic tasks on an answer sheet. Heart rate and heart rate variability were measured<br />
unobtrusively throughout the complete trials, and digital markers were placed at the start of<br />
each new part of a trial.<br />
After each of the two trials, participants were given a questionnaire with questions regard<strong>in</strong>g<br />
their health, the predictability of the task and other road users’ behaviour, and the <strong>in</strong>fluence of<br />
the secondary tasks on their driv<strong>in</strong>g style. After completion of the experiment, participants<br />
were paid € 30,-. Participants with questions regard<strong>in</strong>g the goal of the experiment were given<br />
a detailed explanation of the setup and aim of the experiment.<br />
The parameters recorded <strong>in</strong> this experiment were given <strong>in</strong> Table 3.2 (Section 3.4). Section 3.4<br />
also describes the statistical tests used for the analysis of the dataset.<br />
5.6 Results<br />
This section describes the results of the f<strong>in</strong>al experiment. Firstly we will determ<strong>in</strong>e whether<br />
our research setup was valid, and <strong>in</strong>spect any possible confound<strong>in</strong>g factors <strong>in</strong> the setup. Were<br />
the brak<strong>in</strong>g events implemented correctly? Did participants experience <strong>in</strong>creased mental<br />
workload due to the additional mathematical task? Did the overall characteristics of the<br />
participants not <strong>in</strong>fluence their driv<strong>in</strong>g behaviour? Secondly, we determ<strong>in</strong>e what effects the<br />
brak<strong>in</strong>g events and their urgency have on driv<strong>in</strong>g behaviour. Do drivers <strong>in</strong>deed drive more<br />
carefully after the brak<strong>in</strong>g events? And does the urgency of the brak<strong>in</strong>g event have an effect<br />
on this behavioural reaction? And f<strong>in</strong>ally, we <strong>in</strong>vestigate the effects of mental workload on<br />
general driv<strong>in</strong>g behaviour and the reactions to the unexpected brak<strong>in</strong>g events.<br />
Vertical bars <strong>in</strong> each figure denote 95% confidence <strong>in</strong>tervals. Tables describ<strong>in</strong>g the<br />
comparison between brak<strong>in</strong>g conditions conta<strong>in</strong> <strong>in</strong>formation about one road section before the<br />
brak<strong>in</strong>g event, the road section of the brak<strong>in</strong>g event itself, and a number of road sections<br />
follow<strong>in</strong>g this event. The number of road sections <strong>in</strong>cluded <strong>in</strong> the tables is dependent on the<br />
number of road sections with a statistically significant effect. We <strong>in</strong>cluded two road sections<br />
after the f<strong>in</strong>al significant effect, to make sure no falsely undetected effect at a certa<strong>in</strong> road<br />
section would be mistaken for the end of the behavioural change. In certa<strong>in</strong> tables the<br />
significance values of many consecutive locations (distance to <strong>in</strong>tersection, DTI) on a specific<br />
road section are given. In these tables, multiple consecutive non-significant results are<br />
comb<strong>in</strong>ed for space efficiency reasons. Their significance values are denoted as (ns) for ‘not<br />
significant’.
114 <strong>Driv<strong>in</strong>g</strong> <strong>Behaviour</strong> <strong>in</strong> <strong>Unexpected</strong> <strong>Situations</strong><br />
5.6.1 Construct validity and setup<br />
As was described <strong>in</strong> Chapter 4, we manipulated a number of variables to determ<strong>in</strong>e the effects<br />
of an unexpected brak<strong>in</strong>g event on driv<strong>in</strong>g behaviour <strong>in</strong> several conditions of mental<br />
workload elevation. In order to give a solid and valid answer to these questions, it is first<br />
necessary to determ<strong>in</strong>e whether the experimental constructs were implemented correctly.<br />
Besides check<strong>in</strong>g whether the setup of the experiment was done correctly, it is also important<br />
to determ<strong>in</strong>e whether there were any possible other confound<strong>in</strong>g factors that might have<br />
contam<strong>in</strong>ated our results, such as the characteristics of our group of participants and the order<br />
<strong>in</strong> which mental workload was varied across conditions.<br />
5.6.1.1 Mental workload<br />
In order to check whether add<strong>in</strong>g the additional task onto the driv<strong>in</strong>g task had had an effect on<br />
the mental workload, we analyzed the average reaction time to the PDT stimuli and the<br />
percentage of missed PDT stimuli <strong>in</strong> each of the mental workload conditions. The data show<br />
that add<strong>in</strong>g an additional task to the driv<strong>in</strong>g task <strong>in</strong>creased mental workload, and that an<br />
<strong>in</strong>crease <strong>in</strong> difficulty of this secondary task led to a further <strong>in</strong>crease <strong>in</strong> mental workload.<br />
Swerv<strong>in</strong>g showed a slightly different pattern: the standard deviation of the lateral position<br />
(SDLP) was significantly lower <strong>in</strong> the easy arithmetic task condition than the normal driv<strong>in</strong>g<br />
condition. The other conditions did not differ significantly from each other. Swerv<strong>in</strong>g, <strong>in</strong><br />
other studies often related to high mental workload, was therefore strongest <strong>in</strong> both the<br />
normal driv<strong>in</strong>g condition and the high mental workload condition, and decreased <strong>in</strong> the easy<br />
additional task condition. These f<strong>in</strong>d<strong>in</strong>gs co<strong>in</strong>cide with results reported by Brookhuis, De<br />
Vries and de Waard (1991). The results of the three measurements of mental workload are<br />
displayed <strong>in</strong> Table 5.3; Figures 5.3a and 5.3b give a graphic display of the results on PDT<br />
stimuli (Reaction time and Percentage of missed signals).<br />
Table 5.3 Effects of task difficulty on mental workload measurements (average and 95%<br />
confidence <strong>in</strong>tervals)<br />
Measure<br />
Reaction Time<br />
to PDT (ms)<br />
Percentage of<br />
missed PDT<br />
stimuli (%)<br />
Swerv<strong>in</strong>g<br />
(SDLP) (m)<br />
<strong>Driv<strong>in</strong>g</strong> only <strong>Driv<strong>in</strong>g</strong> with<br />
easy arithmetic<br />
M= 495.75<br />
(462.53, 528.97)<br />
M= 9.38<br />
(5.89, 12.87 )<br />
M= 0.073<br />
(0.066, 0.080)<br />
task<br />
M= 697.75<br />
(650.27, 745.23)<br />
M= 31.24<br />
(24.36, 38.12)<br />
M= 0.064<br />
(0.059, 0.070)<br />
<strong>Driv<strong>in</strong>g</strong> with<br />
difficult<br />
arithmetic task<br />
M= 747.73<br />
(698.42, 797.04)<br />
M= 41.21<br />
(34.09, 48.33)<br />
M= 0.068<br />
(0.061, 0.074)<br />
Effect and effect<br />
size<br />
F(2,66)= 116.122,<br />
p
Chapter 5 - Experiment 2: Effects of unexpected brak<strong>in</strong>g events under vary<strong>in</strong>g mental workload conditions 115<br />
Average reaction time to PDT stimuli (ms)<br />
800,00<br />
700,00<br />
600,00<br />
500,00<br />
400,00<br />
No additional task<br />
Easy arithmetic task<br />
Mental workload condition<br />
Difficult arithmetic task<br />
Figure 5.3a Reaction time to PDT (ms) as a function of mental workload condition<br />
Percentage of missed PDT signals (%)<br />
50,00<br />
40,00<br />
30,00<br />
20,00<br />
10,00<br />
0,00<br />
<strong>Driv<strong>in</strong>g</strong> only<br />
Easy arithmetic task Difficult arithmetic task<br />
Mental workload condition<br />
Figure 5.3b Percentage of missed PDT stimuli as a function of mental workload<br />
condition
116 <strong>Driv<strong>in</strong>g</strong> <strong>Behaviour</strong> <strong>in</strong> <strong>Unexpected</strong> <strong>Situations</strong><br />
We also determ<strong>in</strong>ed participants’ performance on the arithmetic tasks. Together with primary<br />
task and PDT performance, this measure can give a good <strong>in</strong>dication of mental workload,<br />
especially when there are signs of giv<strong>in</strong>g up on either the primary or the secondary task.<br />
When driv<strong>in</strong>g while perform<strong>in</strong>g the easy arithmetic task, participants on average gave 102.5<br />
answers <strong>in</strong> total, and made 2.6 mistakes (2.9%). In the difficult arithmetic task, 47.3 answers<br />
were given and 4.8 mistakes were made (12.5%). Therefore, participants on average<br />
performed much better on the easy task, with 2.4 times more answers and only one third of<br />
the proportion of wrong answers. This could suggest that participants gave up on the difficult<br />
arithmetic task <strong>in</strong> order to focus on the primary task of driv<strong>in</strong>g (please refer to Chapter 2 for<br />
more <strong>in</strong>formation on multi-task<strong>in</strong>g).<br />
5.6.1.2 Location of the brak<strong>in</strong>g events<br />
As Section 5.5 described, the brak<strong>in</strong>g event was programmed to occur at one out of four<br />
designated road sections per block of the experiment. The brak<strong>in</strong>g events occurred if a<br />
participant’s time headway fell with<strong>in</strong> certa<strong>in</strong> limits between certa<strong>in</strong> distances to the next<br />
<strong>in</strong>tersection at the first three possible paths. If this situation did not occur with<strong>in</strong> the first three<br />
road sections, there was a fallback option at a fourth road section, where the brak<strong>in</strong>g event<br />
would take place at a fixed distance from the next <strong>in</strong>tersection. Of all brak<strong>in</strong>g events, 64.8%<br />
occurred at the very first possible road section, and 86.1% occurred with<strong>in</strong> the first three<br />
possible road sections selected for brak<strong>in</strong>g. The other 13.9% of the brak<strong>in</strong>g events occurred at<br />
the fallback road section, all with<strong>in</strong> 140 and 80 metres before the next <strong>in</strong>tersection.<br />
We compared time headway and speed at the start of the brak<strong>in</strong>g event for these two options:<br />
fallback option (N=15) or brak<strong>in</strong>g with<strong>in</strong> constra<strong>in</strong>ts (N=93). Independent samples t-tests<br />
showed that time headway at the start of the brak<strong>in</strong>g event at the fallback road section was<br />
significantly shorter (M=0.77, SD=0.16) than time headway at the start of the brak<strong>in</strong>g event <strong>in</strong><br />
the first three selected road sections (M=1.34, SD=0.31), t(32.487)=10.523, p=
Chapter 5 - Experiment 2: Effects of unexpected brak<strong>in</strong>g events under vary<strong>in</strong>g mental workload conditions 117<br />
5.6.1.3 Driver characteristics and order of mental workload condition<br />
We determ<strong>in</strong>ed the effects of age, gender, number of kilometres driven annually, and the<br />
order <strong>in</strong> which the mental workload variations were presented, on a number of driv<strong>in</strong>g tasks:<br />
ma<strong>in</strong>ta<strong>in</strong><strong>in</strong>g average speed, standard deviation of speed, lateral speed, and headway. This was<br />
done by analyz<strong>in</strong>g the results of 36 complete datasets us<strong>in</strong>g a Repeated Measures Analysis of<br />
Variance (ANOVA). Neither any of the driver characteristics, nor other un<strong>in</strong>tended factors <strong>in</strong><br />
the setup of the experiment, had a significant effect on any of the driv<strong>in</strong>g tasks (= .050). It<br />
can therefore be concluded that any behavioural effects found can fully be attributed to the<br />
deliberate programm<strong>in</strong>g <strong>in</strong> the experiment.<br />
5.6.2 Effects of the brak<strong>in</strong>g event on driv<strong>in</strong>g behaviour<br />
In this section, the effects of the brak<strong>in</strong>g event on both longitud<strong>in</strong>al and lateral driv<strong>in</strong>g<br />
behaviour are described. We studied average effects and effects on approach pattern for the<br />
follow<strong>in</strong>g five variables: speed, follow<strong>in</strong>g distance (headway), time headway, lateral position<br />
and lateral speed.<br />
Road sections are labelled ‘paths’ <strong>in</strong> the rema<strong>in</strong>der of this chapter, referr<strong>in</strong>g to the recod<strong>in</strong>g<br />
that was necessary for the comparison of different mental workload conditions. As was<br />
described before, there were four possible road sections at which the brak<strong>in</strong>g event could<br />
occur. We recoded their road section numbers <strong>in</strong> such a way that allowed comparison between<br />
and with<strong>in</strong> conditions and participants. The road sections at which the brak<strong>in</strong>g events took<br />
place were recoded as path 0, and will be referred to as such throughout this chapter and the<br />
next. The sections lead<strong>in</strong>g up to the brak<strong>in</strong>g event were recoded with negative path numbers,<br />
with lower numbers referr<strong>in</strong>g to sections farther away and numbers closer to zero referr<strong>in</strong>g to<br />
sections closer to the brak<strong>in</strong>g event. The same was done for the paths after the brak<strong>in</strong>g event,<br />
but <strong>in</strong> this case positive numbers were used. The road directly before the brak<strong>in</strong>g event was<br />
therefore recoded as path -1, the road section of the brak<strong>in</strong>g event as path 0, and the road<br />
section after the event as path +1. In the trial without the brak<strong>in</strong>g event, these codes were<br />
copied, lead<strong>in</strong>g to the recod<strong>in</strong>g of all road sections <strong>in</strong> the whole experiment. Figure 5.4 shows<br />
the result<strong>in</strong>g scheme of the experiment.<br />
We determ<strong>in</strong>ed the effect of brak<strong>in</strong>g on driv<strong>in</strong>g behaviour by compar<strong>in</strong>g certa<strong>in</strong> (recoded)<br />
road sections <strong>in</strong> a block with a brak<strong>in</strong>g event, to the same roads <strong>in</strong> the block without the<br />
brak<strong>in</strong>g event. This means that path 0 <strong>in</strong> the brak<strong>in</strong>g condition was compared to the same path<br />
<strong>in</strong> the reference condition, so the same path <strong>in</strong> the next trial (which was then recoded to path<br />
0). The subsequent path <strong>in</strong> each condition was recoded as path +1 and compared to the other<br />
condition, and this was done for all the other paths with<strong>in</strong> the comparison range as well. This<br />
way, the same paths and the same mental workload condition could be used as a factor <strong>in</strong><br />
comparison; the only difference was the brake condition.
118 <strong>Driv<strong>in</strong>g</strong> <strong>Behaviour</strong> <strong>in</strong> <strong>Unexpected</strong> <strong>Situations</strong><br />
Figure 5.4 Scheme of experimental setup. Top: Brake events occur <strong>in</strong> Trial 1 Block 2,<br />
Trial 2 Block 1 and Trial 2 Block 3. Bottom: Locations of brak<strong>in</strong>g events are used as<br />
basel<strong>in</strong>e for recod<strong>in</strong>g of road sections<br />
5.6.2.1 Speed<br />
In this section we describe the effects of the brak<strong>in</strong>g event and its urgency on average driv<strong>in</strong>g<br />
speed. Average speed was calculated by divid<strong>in</strong>g the distance travelled by the time it took a<br />
participant to drive this distance (km/h).<br />
General effect of the brak<strong>in</strong>g event<br />
We compared the difference between paths after the brak<strong>in</strong>g event to the same paths <strong>in</strong> the<br />
condition without the brak<strong>in</strong>g event.
Chapter 5 - Experiment 2: Effects of unexpected brak<strong>in</strong>g events under vary<strong>in</strong>g mental workload conditions 119<br />
The brak<strong>in</strong>g event had a large effect on the speed at path 0, as compared to the condition<br />
without a brake event, F(1,34)=1292.097, p
120 <strong>Driv<strong>in</strong>g</strong> <strong>Behaviour</strong> <strong>in</strong> <strong>Unexpected</strong> <strong>Situations</strong><br />
Figure 5.5 Average speed (km/h) at paths -1 to +3 <strong>in</strong> both brak<strong>in</strong>g conditions<br />
Most differences between the brak<strong>in</strong>g condition and the reference condition disappeared at<br />
path +3. There were no statistically significant changes <strong>in</strong> speed at this path for any of the<br />
DTI’s. One very small but statistically significant <strong>in</strong>teraction effect between workload and<br />
brake condition was found at 50 metres before the <strong>in</strong>tersection, F(2,68)=4.704, p=.012,<br />
p 2 =0.122. However, due to its very small effect size, this result is not practically relevant. No<br />
significant effects were found at path +4.<br />
Effects of urgency<br />
There was a significant <strong>in</strong>teraction effect of urgency and brak<strong>in</strong>g condition at path 0,<br />
F(1,34)=30.416, p
Figure 5.6 Speed per DTI for both brak<strong>in</strong>g conditions at paths -1 to +4
Table 5.5 Speed approach pattern - comparison between both brak<strong>in</strong>g conditions at paths 0 to +2<br />
Path DTI Average (95%-CI) non- Average (95%-CI) F(1,34) p-value Effect size<br />
brak<strong>in</strong>g (km/h)<br />
brak<strong>in</strong>g (km/h)<br />
(p 2 Observed<br />
) power<br />
0 0 m 44.29 (43.20, 45.39) 35.38 (34.19, 36.57) 179.918
Chapter 5 – Experiment 2: Effects of unexpected brak<strong>in</strong>g events under vary<strong>in</strong>g mental workload conditions 123<br />
5.6.2.2 Headway<br />
This section describes the effect of the brak<strong>in</strong>g event and its urgency on headway, averaged<br />
either per complete road section or per 10-metre cell. The average headway per road section<br />
or per cell was calculated by divid<strong>in</strong>g the sum of the recorded headway values (100 Hz) by<br />
the number of recorded values. This means that headway values recorded at lower speeds<br />
might be more pronounced <strong>in</strong> the calculation. Section 3.4.2 elaborates the ways <strong>in</strong> which<br />
average values were calculated for different variables; possible effects of this calculation will<br />
be discussed <strong>in</strong> Section 5.9, together with the question whether this has led to an over- or<br />
underestimation of the headway results.<br />
General effect of the brak<strong>in</strong>g event<br />
An ANOVA for Repeated Measures was performed on a number of paths dur<strong>in</strong>g and after the<br />
brak<strong>in</strong>g event. As can be seen from Table 5.6 and Figure 5.7, the headway <strong>in</strong>deed changed as<br />
a result of the brak<strong>in</strong>g event. Apparently, the decrease <strong>in</strong> headway due to the brak<strong>in</strong>g lead car<br />
was first neutralized at path +1 before the absolute <strong>in</strong>crease became apparent at paths +2 and<br />
+3.<br />
Some of the results have a very low observed power, but s<strong>in</strong>ce the effect sizes of these results<br />
are generally also very low, we expect that no practically relevant type II errors are made.<br />
Table 5.6: Effects of the brak<strong>in</strong>g event on the average headway per path<br />
Path Average (95%-CI)<br />
non-brak<strong>in</strong>g<br />
(km/h)<br />
-1 15.82<br />
(14.48, 17.16)<br />
0 16.38<br />
(14.94, 17.81)<br />
+1 16.69<br />
(15.22, 18.17)<br />
+2 16.67<br />
(15.14, 18.19)<br />
+3 16.15<br />
(14.69, 17.61)<br />
+4 16.71<br />
15.32, 18.10)<br />
+5 16.99<br />
(15.57, 18.40)<br />
Average (95%-CI)<br />
brak<strong>in</strong>g (km/h)<br />
15.69<br />
(14.24, 17.15)<br />
11.37<br />
(10.49, 12.24)<br />
16.34<br />
(15.13, 17.56)<br />
18.21<br />
(16.89, 19.53)<br />
17.32<br />
(15.85, 18.79)<br />
17.41<br />
(15.87, 18.94)<br />
17.14<br />
(15.53, 18.76)<br />
F(1,33) pvalue<br />
Effect<br />
size<br />
(p 2 )<br />
Observed<br />
power<br />
0.092 .764 0.003 0.060<br />
148.233
124 <strong>Driv<strong>in</strong>g</strong> <strong>Behaviour</strong> <strong>in</strong> <strong>Unexpected</strong> <strong>Situations</strong><br />
Average headway (m)<br />
20,00<br />
18,00<br />
16,00<br />
14,00<br />
12,00<br />
10,00<br />
-1<br />
0<br />
+1<br />
+2<br />
Path<br />
Figure 5.7: Average headway (m) at paths -1 to +5<br />
Distance headway approach pattern<br />
+3<br />
+4<br />
+5<br />
Brake condition<br />
No brake condition<br />
Condition with<br />
brak<strong>in</strong>g lead car<br />
Distance headway decreased rapidly dur<strong>in</strong>g the brak<strong>in</strong>g event, and did not return to its<br />
orig<strong>in</strong>al value until approximately 120 metres before the next <strong>in</strong>tersection at path +1. It then<br />
cont<strong>in</strong>ued to <strong>in</strong>crease, until the difference reached its peak at 70 metres before the <strong>in</strong>tersection<br />
at path +2, and rema<strong>in</strong>ed elevated until the effect of the brak<strong>in</strong>g event f<strong>in</strong>ally disappeared at<br />
path +4. The effect of the brak<strong>in</strong>g event was therefore visible for two paths after path +1, as<br />
was also concluded from the average distance headway values per path (Table 5.6).<br />
The approach pattern itself also changed: at paths +1 to +3, the distance headway <strong>in</strong>creased<br />
over the first 100 metres of each path, until approximately 60 metres before the next<br />
<strong>in</strong>tersection (see Figure 5.8, next page). Remember that at 60 metres before the <strong>in</strong>tersection<br />
the lead car decelerated slowly (equivalent to tak<strong>in</strong>g the foot off the gas pedal) <strong>in</strong> order to<br />
have a good overview of the <strong>in</strong>tersection. This change <strong>in</strong> distance headway pattern over the<br />
first 100 metres of the path was not seen <strong>in</strong> the reference condition. We determ<strong>in</strong>ed whether<br />
this relative <strong>in</strong>crease per path was statistically significant by subtract<strong>in</strong>g the headway at 60<br />
metres from the headway at 160 metres, and compar<strong>in</strong>g both brak<strong>in</strong>g conditions. The<br />
development of the distance headway over the path changed significantly as a result of the<br />
brak<strong>in</strong>g event. Drivers <strong>in</strong>creased their headway over a certa<strong>in</strong> stretch of the path at which they<br />
drove after they had encountered an unexpected brak<strong>in</strong>g event. At path +1 and +2, the relative<br />
change <strong>in</strong> distance headway over the path <strong>in</strong> the brak<strong>in</strong>g condition was significantly larger<br />
(positive) than the change <strong>in</strong> the reference condition. This change <strong>in</strong> behaviour disappeared<br />
after these two paths. At this po<strong>in</strong>t, the pattern at which they drove (development of headway
Chapter 5 – Experiment 2: Effects of unexpected brak<strong>in</strong>g events under vary<strong>in</strong>g mental workload conditions 125<br />
over the path) was no longer significantly different, but the distance headway itself was still<br />
larger than <strong>in</strong> the reference condition.<br />
Summariz<strong>in</strong>g, two behavioural changes were seen: a change <strong>in</strong> the development of distance<br />
headway over the first 100 metres of the two paths directly after the brak<strong>in</strong>g event, and an<br />
absolute <strong>in</strong>crease <strong>in</strong> headway which was revealed from the second path after the brak<strong>in</strong>g<br />
event, last<strong>in</strong>g for two paths.<br />
Table 5.7 shows the results of the comparison between the distance headway values at 160<br />
metres and 60 metres before a number of <strong>in</strong>tersections (development of headway) <strong>in</strong> both<br />
brak<strong>in</strong>g conditions. Table 5.8 (next page) presents the results of the comparison between both<br />
brak<strong>in</strong>g conditions for each stretch of 10 metres at paths 0 to +3.<br />
Table 5.7 Effects of the brak<strong>in</strong>g event on the headway development <strong>in</strong> the first 100m of<br />
each path (paths -1 to +4)<br />
Path Average (95%-CI)<br />
non-brak<strong>in</strong>g (m)<br />
Average (95%-CI)<br />
brak<strong>in</strong>g (m)<br />
F(1,33) pvalue<br />
Effect<br />
size<br />
(p 2 )<br />
Observed<br />
power<br />
-1 0.23 (-0.41, 0.86) 0.46 (-0.28, 1.20) 0.263 . 611 0.008 0.079<br />
0 0.10 (-0.67, 0.87) -6.91 (-8.37, -5.44) 101.551
Table 5.8 Headway per 10-metre cell - comparison between both brak<strong>in</strong>g conditions at paths 0 to +3<br />
Path DTI Average (95%-CI) non-brak<strong>in</strong>g (m) Average (95%-CI) brak<strong>in</strong>g (m) F(1,33) p- Effect<br />
value size (p 2 Observed<br />
) power<br />
0 0 m 17.11 (15.64, 18.58) 10.72 (9.77, 11.66) 114.168
Table 5.8 Headway per 10-metre cell - comparison between both brak<strong>in</strong>g conditions at paths 0 to +3 (cont<strong>in</strong>ued)<br />
Path DTI Average (95%-CI)<br />
Average (95%-CI) brak<strong>in</strong>g (m) F(1,33) p-value Effect size<br />
non-brak<strong>in</strong>g (m)<br />
(p 2 Observed<br />
) power<br />
+3 0 m 16.42 (15.17, 17.68) 17.48 (16.08, 18.89) 4.782 .036 0.127 0.565<br />
10 m 14.43 (12.99, 15.87) 15.38 (13.84, 16.92) 4.667 .033 0.131 0.581<br />
20 m 12.83 (11.36, 14.30) 13.77 (12.26, 15.28) 5.186 .029 0.136 0.599<br />
30 m 13.04 (11.66, 14.41) 13.89 (12.55, 15.23) 4.408 .043 0.118 0.531<br />
40 m (ns) (ns)
Figure 5.8 Headway per 10-metre cell <strong>in</strong> both brak<strong>in</strong>g conditions at paths -1 to +4
Chapter 5 – Experiment 2: Effects of unexpected brak<strong>in</strong>g events under vary<strong>in</strong>g mental workload conditions 129<br />
Effects of urgency<br />
No significant effect of urgency was found on average headway per road section or the<br />
headway approach pattern (per 10-metre cell), nor were there any <strong>in</strong>teraction effects with<br />
urgency of the brak<strong>in</strong>g event. There was an <strong>in</strong>teraction effect of urgency and brak<strong>in</strong>g<br />
condition at path 0, but this effect was very small, F(2,66)=3.373, p=.040, p 2 =0.093. This<br />
<strong>in</strong>teraction effect was not seen at any of the paths after the brak<strong>in</strong>g event. It can therefore be<br />
concluded that the urgency of a brak<strong>in</strong>g event did <strong>in</strong> practice not affect the headway dur<strong>in</strong>g or<br />
after the event.<br />
5.6.2.3 Time headway<br />
Average time headway per path was calculated by averag<strong>in</strong>g all recorded values for the<br />
headway over one s<strong>in</strong>gle road section or per 10-metre cell. S<strong>in</strong>ce the time headway is the ratio<br />
of the participant’s speed and the distance between the two vehicles, this value can grow to<br />
extremely large numbers at low speeds. To avoid corruption of the average time headway<br />
values by these extreme numbers, any time headway values over 10 seconds were coded as<br />
miss<strong>in</strong>g values. Due to the (often) low speeds at the brak<strong>in</strong>g path, there were less degrees of<br />
freedom at path 0 than at the other paths.<br />
General effect of the brak<strong>in</strong>g event<br />
Time headway <strong>in</strong>creased significantly at path 0 due to the brak<strong>in</strong>g event, but this <strong>in</strong>crease was<br />
no longer visible at path +1. However, at paths +2 and +3, the <strong>in</strong>crease was apparent and<br />
statistically significant aga<strong>in</strong>, after which the effect died out. Table 5.9 gives the results of the<br />
ANOVA for Repeated Measures that were performed for paths -1 to +5.<br />
Table 5.9: Effects of the brak<strong>in</strong>g event on time headway at paths -1 to +5<br />
Path Average<br />
(95%-CI)<br />
non-brak<strong>in</strong>g (s)<br />
-1 1.23<br />
(1.11, 1.35)<br />
0 1.32<br />
(1.16, 1.49)<br />
+1 1.29<br />
(1.17, 1.41)<br />
+2 1.30<br />
(1.18, 1.42)<br />
+3 1.26<br />
(1.13, 1.38)<br />
+4 1.32<br />
(1.20, 1.44)<br />
+5 1.35<br />
(1.23, 1.47)<br />
Average<br />
(95%-CI)<br />
brak<strong>in</strong>g (s)<br />
1.21<br />
(1.08, 1.35)<br />
1.67<br />
(1.47, 1.87)<br />
1.34<br />
(1.22, 1.46)<br />
1.46<br />
(1.34, 1.58)<br />
1.36<br />
(1.23, 1.48)<br />
1.35<br />
(1.22, 1.48)<br />
1.36<br />
(1.21, 1.51)<br />
F pvalue<br />
Effect<br />
size<br />
(p 2 )<br />
Observed<br />
power<br />
F(1,34)=0.595 .446 0.017 0.116<br />
F(1,23)=20.882
130 <strong>Driv<strong>in</strong>g</strong> <strong>Behaviour</strong> <strong>in</strong> <strong>Unexpected</strong> <strong>Situations</strong><br />
When look<strong>in</strong>g at time headway per 10 metres, the effect of the brak<strong>in</strong>g situation did become<br />
apparent at path +1. Time headway was shorter at the start and larger at the end of path +1 <strong>in</strong><br />
the brake condition than <strong>in</strong> the reference condition, F(3.197,108.686)=14.118, p
Figure 5.9 Time headway per 10-metre cell <strong>in</strong> both brak<strong>in</strong>g conditions at paths -1 to +4
132 <strong>Driv<strong>in</strong>g</strong> <strong>Behaviour</strong> <strong>in</strong> <strong>Unexpected</strong> <strong>Situations</strong><br />
Table 5.11: Effects of the brak<strong>in</strong>g event on swerv<strong>in</strong>g (standard deviation of lateral<br />
position) at paths -1 to +2<br />
Path Average (95%-CI)<br />
Non-brak<strong>in</strong>g (s)<br />
Average (95%-CI)<br />
brak<strong>in</strong>g (s)<br />
F(1,33) pvalue<br />
Effect<br />
size<br />
(p 2 )<br />
Observed<br />
power<br />
-1 0.07 (0.06, 0.07) 0.07 (0.06, 0.07) 0.007 .934 0.000 0.051<br />
0 0.06 (0.05, 0.07) 0.07 (0.06, 0.08) 11.998 .001 0.267 0.919<br />
+1 0.06 (0.06, 0.07) 0.07 (0.07, 0.08) 3.868 .058 0.105 0.480<br />
+2 0.06 (0.05, 0.07) 0.06 (0.06, 0.07) 0.196 .661 0.006 0.071<br />
Effects of urgency<br />
No effects of urgency were found at path 0 on either average lateral position, F(1,33)=0.369,<br />
p=.548, p 2 =0.011, or standard deviation of lateral position (swerv<strong>in</strong>g), F(1,33)=0.037,<br />
p=.845, p 2 =0.001. The same was true for all other paths after the brak<strong>in</strong>g event.<br />
5.6.2.5 Lateral speed<br />
Lateral speed describes a driver’s lateral movement over a certa<strong>in</strong> period of time. A negative<br />
value for lateral speed describes a movement to the right (to the outside of the lane), whereas<br />
a positive lateral speed describes movement to the left, so more to the centre of the lane.<br />
Lateral speed is recorded <strong>in</strong> (m/s).<br />
General effect of the brak<strong>in</strong>g event<br />
The brak<strong>in</strong>g event only had an effect on lateral speed at the path of the brak<strong>in</strong>g itself, and this<br />
effect was rather small. At path 0, participants moved more to the outside of their lane <strong>in</strong> the<br />
brak<strong>in</strong>g condition (M=-0.002, SD
Chapter 5 – Experiment 2: Effects of unexpected brak<strong>in</strong>g events under vary<strong>in</strong>g mental workload conditions 133<br />
In determ<strong>in</strong><strong>in</strong>g the effects of mental workload level on general driv<strong>in</strong>g behaviour, only data<br />
were used <strong>in</strong> which ‘normal driv<strong>in</strong>g behaviour’ was displayed: parts of the experimental<br />
drives without any brak<strong>in</strong>g events. For the analyses <strong>in</strong> the follow<strong>in</strong>g sections, 10 paths <strong>in</strong> the<br />
middle of the non-brak<strong>in</strong>g condition were used.<br />
5.6.3.1 Speed<br />
Average driv<strong>in</strong>g speed over the 10 tested road sections was not affected by vary<strong>in</strong>g mental<br />
workload, F(2,70)=0.361, p=.698, p 2 =0.010. However, the speed approach pattern did<br />
change significantly with mental workload level (<strong>in</strong>teraction effect of mental workload<br />
condition and distance to <strong>in</strong>tersection), although the effect size was only m<strong>in</strong>imal,<br />
F(16.667,58.336)=1.699, p=.040, p 2 =0.040. The effect was mostly attributable to the<br />
locations farthest away from the <strong>in</strong>tersection, i.e. directly after pass<strong>in</strong>g through an earlier<br />
<strong>in</strong>tersection, where the speed was higher <strong>in</strong> conditions with <strong>in</strong>creased mental workload than <strong>in</strong><br />
normal driv<strong>in</strong>g.<br />
5.6.3.2 Headway<br />
Average headway changed significantly as a result of vary<strong>in</strong>g mental workload,<br />
F(2,68)=5.586, p=.006, p 2 =0,141. The headway approach pattern also changed significantly<br />
over the mental workload conditions, F(2,68)=5.887, p=.004, p 2 =0.148. Headway <strong>in</strong> the<br />
driv<strong>in</strong>g only condition (M=18.20, SD=1.58) was significantly larger at every s<strong>in</strong>gle DTI than<br />
headway <strong>in</strong> the easy task condition (M=15.37, SD=1.64), but neither of these mental<br />
workload conditions differed significantly from the difficult task condition (M=16.50,<br />
SD=1.78). Figure 5.10 shows the average headway for the three mental workload conditions;<br />
Figure 5.11 displays the headway approach patterns per 10-metre cell for each mental<br />
workload condition.
134 <strong>Driv<strong>in</strong>g</strong> <strong>Behaviour</strong> <strong>in</strong> <strong>Unexpected</strong> <strong>Situations</strong><br />
Average headway (m)<br />
Average headway (m)<br />
20,00<br />
18,00<br />
16,00<br />
14,00<br />
12,00<br />
10,00<br />
No additional task<br />
Easy arithmetic task<br />
Mental workload condition<br />
Difficult arithmetic task<br />
Figure 5.10 Average headway <strong>in</strong> each mental workload condition<br />
25,00<br />
20,00<br />
15,00<br />
10,00<br />
5,00<br />
160 150 140 130 120 110 100 90 80 70 60 50<br />
Distance to Intersection (m)<br />
40<br />
Mental workload<br />
condition<br />
No additional task<br />
Easy arithmetic task<br />
Difficult arithmetic task<br />
Figure 5.11 Headway patterns per 10-metre cell <strong>in</strong> each mental workload condition<br />
30<br />
20<br />
10<br />
0
Chapter 5 – Experiment 2: Effects of unexpected brak<strong>in</strong>g events under vary<strong>in</strong>g mental workload conditions 135<br />
5.6.3.3 Time headway<br />
Average time headway changed significantly due to vary<strong>in</strong>g mental workload,<br />
F(1.810,66.960)=6.371, p=.004, p 2 =0,147. Average time headway <strong>in</strong> the driv<strong>in</strong>g only<br />
condition (M=1.40, SD=0.14) was significantly longer than <strong>in</strong> the easy task condition<br />
(M=1.17, SD=0.13), but there was no difference between the difficult task condition (M=1.27,<br />
SD=0.09) and any of the other two mental workload conditions.<br />
5.6.3.4 Average and standard deviation of lateral position<br />
Lateral position did not change significantly as a result of vary<strong>in</strong>g mental workload. However,<br />
a trend was seen, although its effect was very small: with <strong>in</strong>creas<strong>in</strong>g mental workload,<br />
participants drove slightly more to the left side of their lane, F(2,68)=2.830, p=.066,<br />
p 2 =0.077. Figure 5.12 shows this effect. Swerv<strong>in</strong>g was affected by the level of mental<br />
workload, as was already discussed <strong>in</strong> Section 5.6.1.1 and Table 5.3.<br />
Average lateral position (m)<br />
0,00<br />
-0,05<br />
-0,10<br />
-0,15<br />
-0,20<br />
No additional task<br />
Easy arithmetic task Difficult arithmetic task<br />
Mental workload condition<br />
Figure 5.12 Average lateral position <strong>in</strong> each mental workload condition<br />
5.6.3.5 Lateral speed<br />
In the difficult task condition, participants moved significantly more to the <strong>in</strong>side of their<br />
lanes (M=-0.070, SD=0.05) than when driv<strong>in</strong>g only (M=-0.125, SD=0.13) or driv<strong>in</strong>g with an<br />
easy arithmetic task (M=-0.125, SD=0.05), F(1.771,60.226)=4.714, p=.016, p 2 =0.122. The
136 <strong>Driv<strong>in</strong>g</strong> <strong>Behaviour</strong> <strong>in</strong> <strong>Unexpected</strong> <strong>Situations</strong><br />
easy task condition and driv<strong>in</strong>g only did not differ significantly, based on pairwise<br />
comparisons.<br />
5.6.4 Interaction effects: brak<strong>in</strong>g, urgency and level of mental workload<br />
In this section we determ<strong>in</strong>e whether there were any <strong>in</strong>teraction effects between the brak<strong>in</strong>g<br />
events, the urgency of the events, and the level of mental workload.<br />
5.6.4.1 Speed<br />
There was no difference of approach pattern between mental workload conditions over the<br />
last 100 metres of the brak<strong>in</strong>g path (<strong>in</strong>teraction effect of mental workload condition and DTI),<br />
F(7.166,114.660)=0.351, p=.931 p 2 =0.021. Only the speeds at 20 metres before the<br />
<strong>in</strong>tersection differed significantly between mental workload conditions, F(2,15)=4.883,<br />
p=.023, p 2 =0.394. At this location the speed <strong>in</strong> the easy arithmetic task condition was<br />
significantly lower than <strong>in</strong> other conditions. Summariz<strong>in</strong>g, participants driv<strong>in</strong>g with an easy<br />
arithmetic task showed a slightly more profound approach pattern than <strong>in</strong> the other conditions,<br />
but s<strong>in</strong>ce this effect only shows at one location, it is difficult to draw a conclusion on the<br />
whole approach pattern.<br />
We also determ<strong>in</strong>ed the <strong>in</strong>teraction effects of mental workload level and brak<strong>in</strong>g event after<br />
selection of only one of the two urgency groups. With the urgent event, the <strong>in</strong>teraction effect<br />
of mental workload condition and location was significant for the complete approach pattern,<br />
F(7.394,133.089)=1.130, p=.348; however, speeds at 40 metres and 60 metres before the<br />
<strong>in</strong>tersection were significantly different for the three mental workload levels, with<br />
F(2,17)=7.015, p=.006 at 40 metres and F(2,17)=4.504, p=.027 at 60 metres. At both<br />
locations, speed <strong>in</strong> the driv<strong>in</strong>g only condition was significantly lower than <strong>in</strong> the other<br />
conditions, with medium (40 metres) and large (60 metres) effects. In other words,<br />
participants drove with a more profound pattern without an additional task, and with a<br />
smoother pattern when perform<strong>in</strong>g the difficult additional task. The approach patterns of<br />
participants driv<strong>in</strong>g with an easy additional task were <strong>in</strong> between. For both situations, the<br />
approach pattern was smoother for participants driv<strong>in</strong>g with the difficult arithmetic task than<br />
for the other participants. However, although we did expect smoother patterns for participants<br />
with higher workload, we also hypothesized that this smoothness would be ‘broken’ by the<br />
most severe brak<strong>in</strong>g situations. The fact that the smoother approach pattern was not broken by<br />
the most urgent event could <strong>in</strong>dicate that our most urgent brak<strong>in</strong>g event was ‘not urgent<br />
enough’ to pass a certa<strong>in</strong> threshold <strong>in</strong> order to br<strong>in</strong>g a behavioural change <strong>in</strong> participants with<br />
high mental workload. Figures 5.13a and 5.13b displays the speed approach pattern per 10metre<br />
cell for both the non-urgent brak<strong>in</strong>g event (Figure 5.13a) and the urgent brak<strong>in</strong>g event<br />
(Figure 5.13b). The figure zooms <strong>in</strong> at the last 100 metres before the <strong>in</strong>tersection, where the<br />
actual approach took place.
Chapter 5 – Experiment 2: Effects of unexpected brak<strong>in</strong>g events under vary<strong>in</strong>g mental workload conditions 137<br />
Average speed (km/h)<br />
60,00<br />
50,00<br />
40,00<br />
30,00<br />
20,00<br />
10,00<br />
100<br />
90<br />
80<br />
70<br />
60<br />
50<br />
40<br />
30<br />
Distance to Intersection (m)<br />
Mental workload condition<br />
No additional task<br />
Easy arithmetic task<br />
Difficult arithmetic task<br />
Figure 5.13a Speed pattern at path 0 for each level of mental workload (non-urgent)<br />
Average speed (km/h)<br />
60,00<br />
50,00<br />
40,00<br />
30,00<br />
20,00<br />
10,00<br />
0,00<br />
100<br />
90<br />
80<br />
70 60 50 40 30<br />
Distance to Intersection (m)<br />
20<br />
20<br />
10<br />
10<br />
0<br />
Mental workload<br />
condition<br />
No additional task<br />
Easy arithmetic task<br />
Difficult arithmetic task<br />
Figure 5.13b Speed pattern at path 0 for each level of mental workload (urgent)<br />
0
138 <strong>Driv<strong>in</strong>g</strong> <strong>Behaviour</strong> <strong>in</strong> <strong>Unexpected</strong> <strong>Situations</strong><br />
A set number of Paired Samples t-tests were performed to compare the speeds <strong>in</strong> the reference<br />
and brake conditions for each level of mental workload. As can be seen from Table 5.12, the<br />
speed <strong>in</strong> each mental workload condition decreases for two paths as compared to the reference<br />
condition, and there is no difference between the duration lengths of these changes.<br />
Table 5.12: Effects of the brak<strong>in</strong>g event on average speed per path, for each level of<br />
mental workload<br />
Mental workload<br />
condition<br />
No additional task<br />
(driv<strong>in</strong>g only)<br />
Path<br />
t-value<br />
(df=35)<br />
p-value<br />
Effect size<br />
(r)<br />
-1 0.450 .665 .076<br />
Proportion<br />
of variance<br />
expla<strong>in</strong>ed<br />
0.6%<br />
0 23.976
Chapter 5 – Experiment 2: Effects of unexpected brak<strong>in</strong>g events under vary<strong>in</strong>g mental workload conditions 139<br />
Section 5.6.1.1 on secondary task performance). It appears that participants could go for<br />
seconds without giv<strong>in</strong>g their next answer, which would allow them to drive as they would <strong>in</strong><br />
the driv<strong>in</strong>g only condition. Table 5.13 shows the results of the Paired Samples t-test<br />
comparison between brak<strong>in</strong>g conditions for each level of mental workload.<br />
Table 5.13: Effects of the brak<strong>in</strong>g event on average headway (m) per path, for each level<br />
of mental workload<br />
Level of mental<br />
workload<br />
No additional task<br />
(driv<strong>in</strong>g only)<br />
Path<br />
t-value<br />
(df=34)<br />
p-value<br />
Effect size<br />
(r)<br />
-1 1.051 .301 .177<br />
Proportion<br />
of variance<br />
expla<strong>in</strong>ed<br />
3.1%<br />
0 8.528
140 <strong>Driv<strong>in</strong>g</strong> <strong>Behaviour</strong> <strong>in</strong> <strong>Unexpected</strong> <strong>Situations</strong><br />
Average headway difference (m)<br />
10,00<br />
5,00<br />
0,00<br />
-5,00<br />
-10,00<br />
<strong>Driv<strong>in</strong>g</strong> only<br />
Easy arithmetic task<br />
Mental workload condition<br />
Difficult arithmetic<br />
task<br />
Brake condition<br />
No brake condition<br />
Condition with<br />
brak<strong>in</strong>g lead car<br />
Figure 5.14 Headway change over 100m (headway at 60 metres m<strong>in</strong>us headway at 160<br />
metres from next <strong>in</strong>tersection) at path 0<br />
5.6.4.3 Average and standard deviation of lateral position<br />
There was no significant and relevant <strong>in</strong>teraction effect of workload with brak<strong>in</strong>g condition or<br />
brak<strong>in</strong>g urgency on average lateral position. At path 0, there was a very small effect of<br />
workload on average lateral position, with a higher level of mental workload lead<strong>in</strong>g to a<br />
lateral position more to the <strong>in</strong>side of the lane, F(2,66)=3.457, p=.037, p 2 =0.095. This effect<br />
did not occur at any po<strong>in</strong>t before or after path 0, and no other effects on lateral position were<br />
found, not when tak<strong>in</strong>g <strong>in</strong>to account both urgencies nor when focuss<strong>in</strong>g only on the most<br />
urgent brak<strong>in</strong>g event.<br />
No significant <strong>in</strong>teraction effects on swerv<strong>in</strong>g were found. At the brak<strong>in</strong>g path (path 0),<br />
workload had a non-significant effect on the standard deviation of the lateral position,<br />
F(2,66)=2.530, p=.087, po<strong>in</strong>t<strong>in</strong>g to a slight decrease <strong>in</strong> swerv<strong>in</strong>g for the easy task condition as<br />
compared to the other two conditions. This could be <strong>in</strong> l<strong>in</strong>e with the results found on<br />
workload and impaired driv<strong>in</strong>g behaviour described earlier <strong>in</strong> Section 5.6.1.<br />
5.6.4.4 Lateral speed<br />
No significant <strong>in</strong>teraction effects between brak<strong>in</strong>g, event urgency and/ or mental workload<br />
condition on lateral speed were found.
Figure 5.15 Headway patterns at paths -1 to +4 <strong>in</strong> all three mental workload conditions
142 <strong>Driv<strong>in</strong>g</strong> <strong>Behaviour</strong> <strong>in</strong> <strong>Unexpected</strong> <strong>Situations</strong><br />
5.7 Overview of results<br />
In order to determ<strong>in</strong>e whether the hypotheses, listed at the start of the current chapter, were<br />
supported by the experimental results, these results are summarized <strong>in</strong> this section. Chapter 6<br />
(Discussion) will discuss the <strong>in</strong>terpretation, relevance and validity of these results.<br />
Effects of the brak<strong>in</strong>g event:<br />
Drivers modified their speed for one path after a sudden brak<strong>in</strong>g event, when look<strong>in</strong>g at<br />
average driv<strong>in</strong>g speed over one complete path.<br />
Speed was lowered over the complete path of the brak<strong>in</strong>g event (path 0). One path ahead,<br />
speed between 40 and 100 metres before the <strong>in</strong>tersection had changed, and on the path<br />
after this, this change was only apparent between 80 and 110 metres before the<br />
<strong>in</strong>tersection. The speed effect wore off after this.<br />
There was no speed modification at more than 100 metres from the <strong>in</strong>tersection at any of<br />
the paths after the suddenly brak<strong>in</strong>g lead car (<strong>in</strong>dicat<strong>in</strong>g an effect on anticipation and<br />
<strong>in</strong>tersection approach).<br />
The urgency of a brak<strong>in</strong>g event did not affect the speed at which people drive after a<br />
brak<strong>in</strong>g event, nor did it affect drivers’ speed approach pattern.<br />
Drivers first returned to driv<strong>in</strong>g at their orig<strong>in</strong>al headway after a brak<strong>in</strong>g event, but the<br />
headway pattern at the path changed immediately as a result of the brak<strong>in</strong>g event. This<br />
pattern change (present over two paths) transferred <strong>in</strong>to an <strong>in</strong>crease <strong>in</strong> average headway<br />
for the duration of two paths, after which the effect died out aga<strong>in</strong>.<br />
Urgency did not affect headway after the brak<strong>in</strong>g event.<br />
Dur<strong>in</strong>g the brak<strong>in</strong>g event, drivers had a tendency to drive more to the outside of their lane<br />
than <strong>in</strong> the reference condition (although the result<strong>in</strong>g behavioural change was very<br />
small).<br />
Effects of workload:<br />
When driv<strong>in</strong>g only, participants kept a larger headway than when driv<strong>in</strong>g with an easy<br />
arithmetic task. <strong>Driv<strong>in</strong>g</strong> with a difficult arithmetic task resulted <strong>in</strong> a headway that<br />
rema<strong>in</strong>ed <strong>in</strong> between these other two conditions.<br />
Drivers with high mental workload drove more to the <strong>in</strong>side of their lane than their<br />
counterparts driv<strong>in</strong>g without an additional task. However, this trend was not found to be<br />
significant.<br />
Interaction effects:<br />
At the path of the brak<strong>in</strong>g event, drivers without an additional task changed their headway<br />
approach pattern more (larger difference between beg<strong>in</strong>n<strong>in</strong>g of path and 60 metres before<br />
the <strong>in</strong>tersection) than drivers with an additional task, and this change decreased with task<br />
difficulty.<br />
After a brak<strong>in</strong>g event, drivers without an additional task adjusted their headway, whereas<br />
drivers driv<strong>in</strong>g with an additional task did not (<strong>in</strong>dependent of the level of task difficulty).
Chapter 5 – Experiment 2: Effects of unexpected brak<strong>in</strong>g events under vary<strong>in</strong>g mental workload conditions 143<br />
5.8 Discussion of experimental setup<br />
This section discusses the effects of the current experimental setup for the results found <strong>in</strong> this<br />
experiment. It first elaborates the number of unexpected events and the criticality levels, and<br />
then discusses the chosen benchmarks for the effect sizes.<br />
5.8.1 Criticality levels and number of unexpected events<br />
Some of the results related to the effects of criticality levels did not support our hypotheses<br />
with regard to the effects of different criticality levels. In fact, a few of the found effects<br />
<strong>in</strong>dicated that the criticality levels of the events at hand were not severe enough. For <strong>in</strong>stance,<br />
participants drove with a more profound pattern without an additional task, and with a<br />
smoother pattern when perform<strong>in</strong>g an additional task, as was expected. However, we also<br />
expected that participants would be startled by the most serious brak<strong>in</strong>g event and would thus<br />
be pulled out of their <strong>in</strong>attentive driv<strong>in</strong>g style. Accord<strong>in</strong>g to our hypotheses, this would then<br />
lead to more profound deceleration curves. The more profound deceleration curves were not<br />
found, on the contrary: the effects result<strong>in</strong>g from the most critical event were actually<br />
anticipated for the least critical event. This could <strong>in</strong>dicate that our most urgent brak<strong>in</strong>g event<br />
was ‘not urgent enough’ to pass a certa<strong>in</strong> threshold <strong>in</strong> order to br<strong>in</strong>g a behavioural change <strong>in</strong><br />
participants with high mental workload.<br />
Another issue related to the criticality of the events is the number of unexpected events for<br />
one participant. The total number of brak<strong>in</strong>g events for each participant <strong>in</strong> this experiment<br />
was three, as opposed to one <strong>in</strong> the previous experiment. Furthermore, Experiment 1 <strong>in</strong>cluded<br />
three complete trials <strong>in</strong> which no brak<strong>in</strong>g event happened, compared to none <strong>in</strong> the current<br />
experiment. S<strong>in</strong>ce events which occur more often can be anticipated to, this might result <strong>in</strong> a<br />
less critical experience and thus an outcome which could <strong>in</strong>dicate less critical events.<br />
The differences between the results from two experiments and the implications for the<br />
urgency of the events presented will be discussed <strong>in</strong> Chapter 6 (Discussion).<br />
5.8.2 Effect sizes<br />
We used the benchmarks for Partial Eta Squared (p 2 ) as provided by Cohen (1992) and<br />
Keppel and Wickens (2002) for the <strong>in</strong>terpretation of our effect sizes (see Section 3.4.4). These<br />
benchmarks are set as follows: 0.20 entails a small effect size, 0.50 a medium effect size, and<br />
0.80 a large effect size. There have been some different <strong>in</strong>terpretations about the benchmarks<br />
for p 2 . For <strong>in</strong>stance, Kittler, Menard and Philips (2007) use benchmarks of 0.01, 0.06 and<br />
0.14 for small, medium and large effect sizes, respectively. The latter study was concerned<br />
with human weight, a very different discipl<strong>in</strong>e, but it shows that the benchmarks for p 2 are<br />
not carved <strong>in</strong> stone. Their <strong>in</strong>terpretation may therefore be related to the discipl<strong>in</strong>e studied and<br />
could rema<strong>in</strong> subject to discussion. However, we decided to use the aforementioned<br />
benchmarks for p 2 , s<strong>in</strong>ce no other rules of thumb were found regard<strong>in</strong>g the effect sizes <strong>in</strong><br />
driv<strong>in</strong>g behaviour data.
144 <strong>Driv<strong>in</strong>g</strong> <strong>Behaviour</strong> <strong>in</strong> <strong>Unexpected</strong> <strong>Situations</strong><br />
5.8.3 Motion sickness<br />
As was noted <strong>in</strong> Section 5.3, 17% of the total number of participants did not f<strong>in</strong>ish the<br />
experiment due to motion sickness. After the previous experiment, <strong>in</strong> which 13% of the total<br />
number of participants had fallen ill, a number of changes had been made to the experimental<br />
setup. The resolution of the screen projection was <strong>in</strong>creased, as was the distance to projected<br />
objects, and the motion <strong>in</strong>put from the simulator was tuned to the visual <strong>in</strong>put participants<br />
received by us<strong>in</strong>g the mov<strong>in</strong>g base simulator. However, these improvements did not lead to a<br />
lower percentage of participants suffer<strong>in</strong>g from motion sickness, on the contrary, the<br />
percentage of participants fallen ill with simulator sickness <strong>in</strong>creased. Although this <strong>in</strong>crease<br />
might be a result of chance and a smaller sample size, the results might also expla<strong>in</strong>ed by<br />
look<strong>in</strong>g <strong>in</strong>to the experimental setup used for this current experiment.<br />
The specific type of motion sickness participants of these experiments experienced is often<br />
referred to as Visually Induced Motion Sickness (VIMS); common symptoms are nausea,<br />
drows<strong>in</strong>ess and salivation (Kennedy, Drexler & Kennedy, 2010). Earlier studies <strong>in</strong>to VIMS<br />
show that it can be <strong>in</strong>duced by two types of factors: factors related to the stimuli, and factors<br />
related to the person experienc<strong>in</strong>g the stimuli (Gold<strong>in</strong>g, 2006). For <strong>in</strong>stance, sex and age are<br />
two factors that appear to be highly related to motion sickness susceptibility, as are certa<strong>in</strong><br />
psychological variables such as mood and anxiety (Gold<strong>in</strong>g, 2006). There is a l<strong>in</strong>k between<br />
the duration of the exposure to visual motion stimuli and the severity of experienced VIMS<br />
(Stanney, K<strong>in</strong>gdon, Nahmens & Kennedy, 2003).<br />
A number of explanations for the higher percentage of ill participants can be found <strong>in</strong> these<br />
factors. For <strong>in</strong>stance, all participants had to perform additional tasks dur<strong>in</strong>g four out of the <strong>in</strong><br />
total six sections of which the experiment consisted. This <strong>in</strong>creased mental workload might<br />
have lead to stress and possibly anxiety, which can lead to a higher susceptibility to motion<br />
sickness (Gold<strong>in</strong>g, 2006). Furthermore, while the total duration of this current experiment was<br />
not higher than the previous experiment, the <strong>in</strong>dividual trials were longer, so participants were<br />
presented with visual motion stimuli for longer periods at a time. S<strong>in</strong>ce longer exposure to<br />
motion stimuli might <strong>in</strong>crease the susceptibility to motion sickness (Stanney et al., 2003), this<br />
might also be a factor <strong>in</strong> expla<strong>in</strong><strong>in</strong>g the relative <strong>in</strong>crease <strong>in</strong> ill participants. Conclud<strong>in</strong>g,<br />
despite the actions taken to prevent simulator sickness, there were factors that might have<br />
<strong>in</strong>creased the participant’s susceptibility for simulator sickness <strong>in</strong> the f<strong>in</strong>al experiment.
Chapter 6<br />
Discussion<br />
The two driv<strong>in</strong>g simulator experiments revealed that drivers react differently to situations<br />
dependent of their state, the criticality of the situation, and the type of compensation required.<br />
However, there were some differences between the f<strong>in</strong>d<strong>in</strong>gs <strong>in</strong> both experiments. The current<br />
chapter discusses these differences and their underly<strong>in</strong>g causes. It then discusses the ma<strong>in</strong><br />
results <strong>in</strong> the light of the hierarchical model of the driv<strong>in</strong>g task (Michon 1971, 1985) and<br />
other theories relevant for driv<strong>in</strong>g <strong>in</strong> risky and/ or unexpected situations. The chapter<br />
concludes with a discussion of the implications of our f<strong>in</strong>d<strong>in</strong>gs for the human-centred<br />
development of Advanced Driver Assistance (ADA) Systems.<br />
145
146 <strong>Driv<strong>in</strong>g</strong> <strong>Behaviour</strong> <strong>in</strong> <strong>Unexpected</strong> <strong>Situations</strong>
Chapter 6 - Discussion 147<br />
6.1 Recapitulation: an overview of relevant results<br />
B<br />
oth the first experiment <strong>in</strong>to task level <strong>in</strong>teraction and the f<strong>in</strong>al experiment <strong>in</strong>to the<br />
adaptation of driv<strong>in</strong>g behaviour to unexpected brak<strong>in</strong>g events yielded a number of<br />
results, which will be reviewed <strong>in</strong> this section. For an elaboration of the results, please<br />
refer to the chapters on the specific experiments.<br />
6.1.1 Experiment 1: <strong>in</strong>itial hypotheses<br />
The first experiment revealed a number of <strong>in</strong>terest<strong>in</strong>g results. First of all, it was found that the<br />
two different types of unexpected events <strong>in</strong>duced different compensation behaviour. In theory,<br />
adequate or safe compensation to the brak<strong>in</strong>g event would require lower<strong>in</strong>g speed, while the<br />
acceleration event would require a comb<strong>in</strong>ation of deceleration and mov<strong>in</strong>g to a safer lateral<br />
position. In fact, drivers lowered their driv<strong>in</strong>g speed for some time after the brak<strong>in</strong>g event, but<br />
no change on speed was found after the acceleration event. Lateral position did not change<br />
significantly as a result of any of the events.<br />
The event criticality (def<strong>in</strong>ed as m<strong>in</strong>imum headway after an unexpected brak<strong>in</strong>g event) turned<br />
out to be a better predictor of behavioural adaptation to a brak<strong>in</strong>g event than the orig<strong>in</strong>al event<br />
urgency, which was related to the duration time of brak<strong>in</strong>g. Criticality had a significant effect<br />
on drivers’ m<strong>in</strong>imum speed, on the location of this m<strong>in</strong>imum speed (end of deceleration as<br />
part of <strong>in</strong>tersection approach<strong>in</strong>g), and on the way <strong>in</strong> which participants decelerated, with<br />
lower criticality lead<strong>in</strong>g to more passive deceleration (by means of releas<strong>in</strong>g the gas pedal)<br />
and the highest criticality level lead<strong>in</strong>g to active brak<strong>in</strong>g.<br />
The most strik<strong>in</strong>g effects were seen <strong>in</strong> the <strong>in</strong>teractions between the brak<strong>in</strong>g event and the level<br />
of mental workload. It was found that, when controll<strong>in</strong>g for <strong>in</strong>cident criticality, participants <strong>in</strong><br />
both mental workload conditions had similar <strong>in</strong>itial headway reactions to the brak<strong>in</strong>g lead car,<br />
but different reaction durations. After the first road section follow<strong>in</strong>g the brak<strong>in</strong>g, drivers with<br />
high workload normalized their headway immediately, whereas regular drivers cont<strong>in</strong>ued to<br />
drive with an <strong>in</strong>creased headway for some time. In other words, drivers with high mental<br />
workload <strong>in</strong>itially responded as cautiously as normal drivers, but returned to their orig<strong>in</strong>al<br />
driv<strong>in</strong>g behaviour much faster then drivers who completely focussed on driv<strong>in</strong>g. This<br />
<strong>in</strong>dicates that drivers with high mental workload did not pay as much attention to their driv<strong>in</strong>g<br />
task and their surround<strong>in</strong>gs (viz., a suddenly brak<strong>in</strong>g lead vehicle) as drivers without other<br />
th<strong>in</strong>gs to do than driv<strong>in</strong>g. Further evidence for this relationship between elevated mental<br />
workload and reduced attention for the driv<strong>in</strong>g task was found when event criticality was<br />
<strong>in</strong>cluded <strong>in</strong> the analyses. The threshold for <strong>in</strong>creas<strong>in</strong>g the headway after an unexpected<br />
brak<strong>in</strong>g event was lifted for drivers perform<strong>in</strong>g an additional task as compared to normal<br />
driv<strong>in</strong>g. Whereas regular drivers reacted to both medium and high criticality events by<br />
<strong>in</strong>creas<strong>in</strong>g their headway, drivers with high workload only responded to the most serious<br />
event category. Apparently, only the most serious brak<strong>in</strong>g event triggered this latter group to<br />
change their driv<strong>in</strong>g behaviour.<br />
F<strong>in</strong>ally, mental workload level was shown to be of great <strong>in</strong>fluence on driv<strong>in</strong>g behaviour<br />
before, dur<strong>in</strong>g and after all unexpected events. Elevated mental workload levels led to<br />
smoother speed approach patterns and resulted <strong>in</strong> vehicle positions more to the left side of the<br />
lane. Also, speed adjustment result<strong>in</strong>g from the brak<strong>in</strong>g event was different for groups with
148 <strong>Driv<strong>in</strong>g</strong> <strong>Behaviour</strong> <strong>in</strong> <strong>Unexpected</strong> <strong>Situations</strong><br />
different mental workload levels: while drivers without an additional task did not drive at a<br />
different speed <strong>in</strong> the reference drive than <strong>in</strong> the drive with the brak<strong>in</strong>g lead vehicle, those<br />
who experienced higher mental workload due to the additional task drove significantly faster<br />
<strong>in</strong> the reference trial than <strong>in</strong> the event trial. Add<strong>in</strong>g to this result, drivers with higher mental<br />
workload drove at a smoother pattern when encounter<strong>in</strong>g less urgent events, whereas the<br />
highest event urgency was related to a more profound deceleration curve. There were no<br />
significant differences <strong>in</strong> speed patterns for the drivers with normal mental workload levels<br />
which could be attributed to event criticality.<br />
6.1.2 Experiment 2: additional hypotheses<br />
The hypotheses for the f<strong>in</strong>al experiment, based on the first experiment, were as follows:<br />
Drivers driv<strong>in</strong>g with high mental workload pay less attention to the driv<strong>in</strong>g task, lead<strong>in</strong>g<br />
to a more <strong>in</strong>attentive style of driv<strong>in</strong>g. In other words, they are driv<strong>in</strong>g <strong>in</strong> an automatic<br />
fashion.<br />
Drivers have a more defensive driv<strong>in</strong>g style after encounter<strong>in</strong>g a safety-critical situation<br />
when they can focus their full attention to the driv<strong>in</strong>g task. When this is not the case, for<br />
<strong>in</strong>stance when driv<strong>in</strong>g with the pressure of high mental workload, this defensive driv<strong>in</strong>g<br />
behaviour dim<strong>in</strong>ishes quickly.<br />
Although drivers quit their defensive driv<strong>in</strong>g style when driv<strong>in</strong>g under pressure, the<br />
defensiveness re-emerges even stronger when the unexpected event reaches a certa<strong>in</strong><br />
threshold of safety-criticality. In other words, startled drivers can get pulled out of their<br />
<strong>in</strong>attentive driv<strong>in</strong>g style if the level of event criticality is high enough.<br />
A fourth hypothesis, which was based on an assumption result<strong>in</strong>g from the hierarchical task<br />
model by Michon (1971, 1985) and which was already studied <strong>in</strong> Experiment 1, concerns the<br />
type of compensation and the related changes <strong>in</strong> driv<strong>in</strong>g behaviour, result<strong>in</strong>g from bottom-up<br />
<strong>in</strong>fluence between the driv<strong>in</strong>g tasks.<br />
The type of compensation (longitud<strong>in</strong>al, lateral, or a comb<strong>in</strong>ation) required to safely<br />
handle an unexpected, safety-critical event determ<strong>in</strong>es the type of any (temporary)<br />
behavioural effect.<br />
The follow<strong>in</strong>g results regard<strong>in</strong>g these hypotheses were found.<br />
ad 1. Drivers driv<strong>in</strong>g with high mental workload pay less attention to the driv<strong>in</strong>g task, lead<strong>in</strong>g<br />
to a more <strong>in</strong>attentive style of driv<strong>in</strong>g.<br />
Swerv<strong>in</strong>g, an important driv<strong>in</strong>g performance measure, was not affected by mental workload.<br />
This result does therefore not support the hypothesis. Furthermore, no significant effect was<br />
found on lateral position, although a trend could be identified, show<strong>in</strong>g that drivers do have a<br />
tendency to drive more to the left side of their lane when deal<strong>in</strong>g with high demand tasks. As<br />
we discussed <strong>in</strong> Section 4.7.1, driv<strong>in</strong>g to the left side of the lane can be seen as either driv<strong>in</strong>g<br />
more cautiously (try<strong>in</strong>g to see farther upstream <strong>in</strong> the oppos<strong>in</strong>g traffic) or as less cautious<br />
behaviour (hav<strong>in</strong>g less regard for possible head-on conflicts). When look<strong>in</strong>g specifically at the<br />
effects on safety boundaries, driv<strong>in</strong>g closer to the centre l<strong>in</strong>e leads to a smaller distance to<br />
other road users, <strong>in</strong> this case the road users from the opposite direction. This is especially the<br />
case for our experimental setup <strong>in</strong> which the oppos<strong>in</strong>g traffic was programmed to drive at a
Chapter 6 - Discussion 149<br />
fixed lateral position <strong>in</strong> their lane. However, s<strong>in</strong>ce the current effect was not found to be either<br />
significant or relevantly large for real-life situations, this result will not be regarded as<br />
support<strong>in</strong>g the hypothesis.<br />
Moreover, the result from the previous experiment which showed that participants drove<br />
faster and that their speed approach patterns were less pronounced when mental workload was<br />
elevated, was not reproduced <strong>in</strong> this experiment. The speed values were significantly higher at<br />
certa<strong>in</strong> locations farther away from the next upcom<strong>in</strong>g <strong>in</strong>tersection, but this does not<br />
necessarily po<strong>in</strong>t to less attentive driv<strong>in</strong>g.<br />
However, the hypothesis was supported when look<strong>in</strong>g at headway and time headway<br />
adaptation. The comb<strong>in</strong>ation of a shorter (time) headway and a higher speed translates to<br />
smaller safety marg<strong>in</strong>s, which can be expla<strong>in</strong>ed as less cautious or <strong>in</strong>attentive driv<strong>in</strong>g.<br />
<strong>Driv<strong>in</strong>g</strong> with a difficult arithmetic task resulted <strong>in</strong> a headway that rema<strong>in</strong>ed <strong>in</strong> between the<br />
values for the other two conditions. It appears as though the difficult task condition did not<br />
lead to the same amount of change as the easy task condition. We will get to this f<strong>in</strong>d<strong>in</strong>g later<br />
<strong>in</strong> this section.<br />
ad 2. Drivers have a more defensive driv<strong>in</strong>g style after encounter<strong>in</strong>g a safety-critical situation<br />
when they can focus their full attention on the driv<strong>in</strong>g task. When this is not the case, for<br />
<strong>in</strong>stance when driv<strong>in</strong>g with the pressure of high mental workload, this defensive driv<strong>in</strong>g<br />
behaviour dim<strong>in</strong>ishes quickly.<br />
The first part of this hypothesis was supported by both headway and speed changes seen after<br />
the brak<strong>in</strong>g event. Drivers driv<strong>in</strong>g under normal workload circumstances showed a more<br />
defensive driv<strong>in</strong>g style after the safety-critical event than before. They drove at a lower speed,<br />
temporarily kept a larger average headway, and started the next road section after the<br />
headway <strong>in</strong>crease had died out at a larger headway than before the safety-critical brak<strong>in</strong>g<br />
event. So even though the average headway over a complete road section did not change,<br />
drivers were still cautious at the start of a new road section, translat<strong>in</strong>g <strong>in</strong>to a larger headway<br />
at this location.<br />
The second part of this hypothesis was also supported when look<strong>in</strong>g at headway adaptation.<br />
After a brak<strong>in</strong>g event, drivers without an additional task adjusted their headway, whereas<br />
drivers driv<strong>in</strong>g with an additional task did not (<strong>in</strong>dependent of the level of task difficulty).<br />
And at the path of the brak<strong>in</strong>g event itself, drivers without an additional task changed their<br />
headway approach pattern more (larger difference between beg<strong>in</strong>n<strong>in</strong>g of path and 60 metres<br />
before the <strong>in</strong>tersection) than drivers with an additional task, and this change decreased with<br />
task difficulty. In other words, there was a clear change <strong>in</strong> headway dur<strong>in</strong>g and after the<br />
brak<strong>in</strong>g <strong>in</strong>cident for drivers with normal mental workload, and a significantly smaller change<br />
for drivers with <strong>in</strong>creased mental workload.<br />
Drivers had a tendency to drive more to the outside (right side) of their lane dur<strong>in</strong>g the<br />
brak<strong>in</strong>g event than <strong>in</strong> a reference condition. They kept a larger distance to the oppos<strong>in</strong>g<br />
traffic, which was driv<strong>in</strong>g at a fixed lateral position on the oppos<strong>in</strong>g lane. This effect of the<br />
brak<strong>in</strong>g event was significant, but due to its small effect size, it might be less relevant for reallife<br />
situations.
150 <strong>Driv<strong>in</strong>g</strong> <strong>Behaviour</strong> <strong>in</strong> <strong>Unexpected</strong> <strong>Situations</strong><br />
As was expected, driv<strong>in</strong>g speed was lowered dur<strong>in</strong>g the brak<strong>in</strong>g event. When we <strong>in</strong>vestigated<br />
one and two paths ahead, the driv<strong>in</strong>g speed was first lowered between 40 and 100 metres<br />
before the <strong>in</strong>tersection, and then only between 80 and 110 metres before the <strong>in</strong>tersection. The<br />
speed effect died out after this. This means that the speed change was not apparent at the<br />
<strong>in</strong>tersection itself, nor directly after the <strong>in</strong>tersections. Only around the locations where the<br />
brak<strong>in</strong>g event had actually happened did drivers adjust their speeds.<br />
ad 3. Although drivers quit their defensive driv<strong>in</strong>g style when driv<strong>in</strong>g under pressure, the<br />
defensiveness re-emerges even stronger when the unexpected event reaches a certa<strong>in</strong><br />
threshold of safety-criticality. In other words, drivers can get startled out of their <strong>in</strong>attentive<br />
driv<strong>in</strong>g style.<br />
This hypothesis was not supported by the data from this experiment. The urgency of a brak<strong>in</strong>g<br />
event used <strong>in</strong> this experiment did not affect average speed, drivers’ speed approach pattern, or<br />
headway. This might mean that either the hypothesis is false, or that the event urgency used <strong>in</strong><br />
the current experiment was too low. The levels of urgency adopted <strong>in</strong> this experiment will be<br />
elaborated <strong>in</strong> Section 6.1.4.<br />
ad 4. The type of compensation (longitud<strong>in</strong>al, lateral, or a comb<strong>in</strong>ation) required to safely<br />
handle an unexpected, safety-critical event determ<strong>in</strong>es the type of any (temporary)<br />
behavioural effect.<br />
As was expla<strong>in</strong>ed before, the differences between two types of compensation behaviour and<br />
their respective effects on behavioural adaptation were already studied <strong>in</strong> the first driv<strong>in</strong>g<br />
simulator experiment. It was found that two different types of unexpected events, requir<strong>in</strong>g<br />
different comb<strong>in</strong>ations of compensatory actions, have different behavioural effects. The<br />
current elaboration concerns only these behavioural effects of longitud<strong>in</strong>al compensatory<br />
actions.<br />
The safety-critical situations under <strong>in</strong>vestigation <strong>in</strong> this experiment were unexpected brak<strong>in</strong>g<br />
actions from the participant’s lead<strong>in</strong>g vehicle. They required compensation <strong>in</strong> the longitud<strong>in</strong>al<br />
direction from the participants, specifically <strong>in</strong> the form of lower<strong>in</strong>g speed; no lateral<br />
compensation was required. The longitud<strong>in</strong>al effect was <strong>in</strong>deed found. Participants lowered<br />
their speed and adapted their headway, and this was a strong effect. However, drivers also had<br />
a tendency to drive more to the outside of their lane dur<strong>in</strong>g the brak<strong>in</strong>g manoeuvre than <strong>in</strong><br />
reference conditions. Although the size of this effect on lateral actions was very small<br />
(render<strong>in</strong>g the effect almost negligible), this means that the longitud<strong>in</strong>al compensation was<br />
not done without any effect on lateral behaviour. Apparently, a longitud<strong>in</strong>al event triggers<br />
drivers to show a short-term reaction <strong>in</strong> more than only a longitud<strong>in</strong>al manner. However, no<br />
behavioural adaptation was seen <strong>in</strong> the drivers’ lateral behaviour after the brak<strong>in</strong>g events.<br />
Other f<strong>in</strong>d<strong>in</strong>gs<br />
i. Task prioritization<br />
The results show that <strong>in</strong> situations where the high task demands rise above a certa<strong>in</strong> level,<br />
drivers change their task prioritization <strong>in</strong> order to focus on the ma<strong>in</strong> driv<strong>in</strong>g task, at the<br />
expense of other, less relevant tasks. This was reflected <strong>in</strong> the headway changes <strong>in</strong> the three<br />
mental workload conditions. In the easy task condition, drivers decreased their headway as<br />
compared to normal driv<strong>in</strong>g without any additional tasks. The <strong>in</strong>creased task demands led to a<br />
situation <strong>in</strong> which drivers apparently shared their attention between the secondary task and the
Chapter 6 - Discussion 151<br />
primary driv<strong>in</strong>g task. A decrease <strong>in</strong> safety marg<strong>in</strong>s is generally considered less safe. However,<br />
when the task demands <strong>in</strong>creased further, drivers normalized their headway to accommodate<br />
these <strong>in</strong>creased demands, and apparently turned their focus back to the driv<strong>in</strong>g task. This was<br />
done at the expense of the additional task, as was shown <strong>in</strong> the secondary task performance. It<br />
appears as though mental workload and distraction were both elevated <strong>in</strong> the easy task<br />
condition, but that motivation and prioritization played a role <strong>in</strong> reduc<strong>in</strong>g distraction while<br />
keep<strong>in</strong>g mental workload elevated <strong>in</strong> the difficult task condition.<br />
ii. Switch<strong>in</strong>g between driv<strong>in</strong>g <strong>in</strong> an automatic fashion and conscious control over the<br />
driv<strong>in</strong>g task<br />
Results from both experiments suggest that drivers perform certa<strong>in</strong> subtasks <strong>in</strong> a less<br />
conscious manner, when driv<strong>in</strong>g with an additional task. These subtasks <strong>in</strong>clude decelerat<strong>in</strong>g<br />
before an <strong>in</strong>tersection, keep<strong>in</strong>g right, and ma<strong>in</strong>ta<strong>in</strong><strong>in</strong>g an appropriate speed and distance to a<br />
lead<strong>in</strong>g vehicle. These results po<strong>in</strong>t <strong>in</strong> the direction of driv<strong>in</strong>g <strong>in</strong> an automatic fashion, or a<br />
habitualized driv<strong>in</strong>g style. S<strong>in</strong>ce the experimental setups of both experiments <strong>in</strong>cluded many<br />
situations that all appeared similar, it would seem reasonable that drivers would get used to<br />
the situations, develop expectations about them, and thus develop a habit of driv<strong>in</strong>g though<br />
them <strong>in</strong> the optimally efficient manner. This habit could be ma<strong>in</strong>ta<strong>in</strong>ed for some time, until a<br />
safety-critical situation occurred. It was seen that drivers started to exert more conscious<br />
control over the driv<strong>in</strong>g task after an unexpected situation, and showed more active<br />
<strong>in</strong>volvement <strong>in</strong> the driv<strong>in</strong>g task and the traffic situation. The results furthermore show that the<br />
level of safety-criticality of a brak<strong>in</strong>g event changes the way <strong>in</strong> which drivers decelerate;<br />
higher criticality events evoke a more active way of deceleration (i.e., through brak<strong>in</strong>g) than<br />
less critical events, after which drivers more often release the gas pedal.<br />
Both experiments show that level of criticality, or the urgency of the brak<strong>in</strong>g event, does not<br />
<strong>in</strong>fluence the speed pattern of drivers with normal mental workload levels. However, other<br />
aspects of their driv<strong>in</strong>g behaviour did change as a result of the safety-critical break<strong>in</strong>g event.<br />
The results <strong>in</strong>dicated that participants drive more slowly after the brak<strong>in</strong>g event, if only<br />
temporarily. Drivers <strong>in</strong> the first experiment also kept larger headways after the unexpected<br />
and safety-critical brak<strong>in</strong>g event.<br />
6.1.3 Possible under- or overestimation of results<br />
As was already discussed <strong>in</strong> the light of the first experimental results (Chapter 4), the manner<br />
<strong>in</strong> which the data for both experiments were recorded might have had some <strong>in</strong>fluence on the<br />
outcome of our analyses. The raw data were recorded with fixed sampl<strong>in</strong>g rates (256 Hz for<br />
the first experiment, and 100 Hz for the f<strong>in</strong>al experiment), and this strict time <strong>in</strong>terval between<br />
recorded data values resulted <strong>in</strong> an overrepresentation of values for periods of time <strong>in</strong> which<br />
participants drove slower. S<strong>in</strong>ce all variables other than speed variables were averaged over<br />
the total number of recorded values, some effects might have been over- or underestimated.<br />
At lower speeds, drivers usually have smaller deviations of their lateral positions; swerv<strong>in</strong>g<br />
effects might therefore have been underestimated <strong>in</strong> both experiments. The f<strong>in</strong>al experiment<br />
showed no significant results for swerv<strong>in</strong>g effects, other than a small <strong>in</strong>crease of swerv<strong>in</strong>g at<br />
the path of the brak<strong>in</strong>g event. This <strong>in</strong>crease might have been bigger than <strong>in</strong>dicated <strong>in</strong> the<br />
analyses, especially s<strong>in</strong>ce the speeds dur<strong>in</strong>g the brak<strong>in</strong>g event were rather low (some<br />
participants even came to a full stop <strong>in</strong> reaction to the brak<strong>in</strong>g lead vehicle). A trend of<br />
<strong>in</strong>creased swerv<strong>in</strong>g was identified at path +1, but its effect size was too small to be of
152 <strong>Driv<strong>in</strong>g</strong> <strong>Behaviour</strong> <strong>in</strong> <strong>Unexpected</strong> <strong>Situations</strong><br />
relevance, based on the current analyses. However, the power of the related test was rather<br />
small (0.480), and comb<strong>in</strong>ed with the supposition of underestimation of swerv<strong>in</strong>g values this<br />
could <strong>in</strong>dicate that the results were actually larger than found <strong>in</strong> the current analyses.<br />
The averag<strong>in</strong>g method might furthermore have led to an underestimation of relative headway<br />
<strong>in</strong>creases and an overestimation of headway decreases, but only when they co<strong>in</strong>cide with<br />
lower speeds. The decrease <strong>in</strong> headway seen for driv<strong>in</strong>g while perform<strong>in</strong>g the secondary task<br />
was not affected by the averag<strong>in</strong>g method, s<strong>in</strong>ce it co<strong>in</strong>cided with faster rather than lower<br />
driv<strong>in</strong>g speeds. S<strong>in</strong>ce there was no overrepresentation of lower speeds, these values of<br />
decreased headway are not expected to be overestimated. There was however an <strong>in</strong>crease <strong>in</strong><br />
headway related to slower speeds at the path directly follow<strong>in</strong>g the brak<strong>in</strong>g events <strong>in</strong> the easy<br />
task condition <strong>in</strong> the second experiment. The effect on headway was not significant, but s<strong>in</strong>ce<br />
the speeds were lower <strong>in</strong> that part of the experiment, it might be the case that this effect was<br />
underestimated. Furthermore, drivers driv<strong>in</strong>g under normal workload circumstances showed a<br />
more defensive driv<strong>in</strong>g style after the safety-critical event than before; they also drove more<br />
cautiously at the start of a new road section as compared to the reference situation. This effect<br />
might have been underestimated, s<strong>in</strong>ce lower speeds are often related to smaller (time)<br />
headway values, and <strong>in</strong> this case the lower speed contrarily co<strong>in</strong>cided with larger (time)<br />
headway values. So maybe the values were even larger.<br />
Conclud<strong>in</strong>g, some of the results that did not appear to be very strong might actually have been<br />
more prom<strong>in</strong>ent and/ or relevant than concluded from the current analyses.<br />
6.1.4 Differences expla<strong>in</strong>ed<br />
There were a number of differences between the f<strong>in</strong>d<strong>in</strong>gs <strong>in</strong> the first experiment and the ones<br />
aris<strong>in</strong>g from the second experiment. This section describes the most prom<strong>in</strong>ent deviat<strong>in</strong>g<br />
results and subsequently elaborates on their possible underly<strong>in</strong>g causes. Given that the f<strong>in</strong>al<br />
experiment was designed to optimally answer the f<strong>in</strong>al research questions, the set of results<br />
from that experiment will be used as guidel<strong>in</strong>es for our conclusions (Chapter 7).<br />
i. Compensation behaviour and safety marg<strong>in</strong>s after the most serious brak<strong>in</strong>g event<br />
Experiment 1<br />
In all situations but the one with the most urgent brak<strong>in</strong>g event, smoother approach patterns<br />
were seen for drivers with elevated mental workload than for those without. Only after the<br />
most urgent event did the drivers with <strong>in</strong>creased workload show a more profound speed<br />
pattern. Furthermore, drivers without high workload <strong>in</strong>creased their headway after the brak<strong>in</strong>g<br />
events if these were medium or highly critical; drivers with high workload only adapted their<br />
headway after the most serious event. Conclud<strong>in</strong>g, when driv<strong>in</strong>g with high workload, only the<br />
most serious event triggered drivers to change their driv<strong>in</strong>g style<br />
Experiment 2<br />
After the most urgent event, participants with a difficult additional task drove with a smoother<br />
pattern than those without. The approach patterns of participants driv<strong>in</strong>g with an easy<br />
additional task were <strong>in</strong> between. The urgency of a brak<strong>in</strong>g event did not affect drivers’<br />
headway.<br />
Explanation<br />
The results <strong>in</strong>dicate that the experienced criticality of the second set of experimental situations<br />
were not as high as the situations <strong>in</strong> the first experiment. There were some alterations <strong>in</strong> setup
Chapter 6 - Discussion 153<br />
of Experiment 2 as compared to Experiment 1 that might expla<strong>in</strong> this difference. For <strong>in</strong>stance,<br />
there were more brak<strong>in</strong>g events <strong>in</strong> a shorter time span; these brak<strong>in</strong>g events were all caused<br />
by the same lead<strong>in</strong>g vehicle; and other vehicles’ behaviours were not <strong>in</strong>fluenced by the<br />
brak<strong>in</strong>g event.<br />
A very different explanation might lie <strong>in</strong> the fact that the mov<strong>in</strong>g-base simulator was used,<br />
giv<strong>in</strong>g participants the feel<strong>in</strong>g of movement <strong>in</strong> addition to the view of a brak<strong>in</strong>g event. This<br />
might have given them a stronger sense of control, render<strong>in</strong>g the need to react less important.<br />
The criticality of an event is partly determ<strong>in</strong>ed by the experience of drivers. We expect that<br />
this is the reason why startled drivers reacted more profoundly to the most serious event than<br />
<strong>in</strong> a situation when they are less (or not at all) startled. Strongly related to the experienced<br />
criticality of the events is the number of unexpected events presented to one participant. The<br />
total number of presented brak<strong>in</strong>g events for each participant <strong>in</strong> this experiment was three, as<br />
opposed to one <strong>in</strong> Experiment 1. Furthermore, the first experiment <strong>in</strong>cluded three trials <strong>in</strong><br />
which no brak<strong>in</strong>g event happened out of the total four. This might have given participants<br />
stronger expectations about situations to come: only at one out of 80 <strong>in</strong>tersections did this<br />
severe brak<strong>in</strong>g event occur. When compar<strong>in</strong>g this to the second experiment, <strong>in</strong> which both<br />
trials <strong>in</strong>cluded at least one unexpected situation and three events were presented over a total of<br />
120 road <strong>in</strong>tersections, the difference is apparent. The ratio of unexpected situations per<br />
<strong>in</strong>tersection encountered is much lower <strong>in</strong> the first experiment (1:80) than <strong>in</strong> the second<br />
experiment (3:120). Furthermore, there was no variation <strong>in</strong> the causes for the unexpected<br />
event. S<strong>in</strong>ce events which occur more often can be anticipated to, specifically if they also<br />
have similar causes, drivers might have had a less critical experience <strong>in</strong> the f<strong>in</strong>al experiment.<br />
However, this is hard to verify.<br />
Referr<strong>in</strong>g to the results for the previous experiment, another <strong>in</strong>dication of the events’<br />
criticality levels was found on the means of deceleration after brak<strong>in</strong>g. In the first experiment,<br />
the level of safety-criticality of a brak<strong>in</strong>g event had a significant effect on the means of<br />
deceleration, with higher criticality be<strong>in</strong>g related to a more active approach to decelerat<strong>in</strong>g<br />
(brak<strong>in</strong>g) than less critical events (releas<strong>in</strong>g the gas pedal). In order to <strong>in</strong>vestigate whether the<br />
current most urgent event was similarly different from the non-urgent event, we determ<strong>in</strong>ed<br />
the correlation (Spearman’s ) between the number of times the brake was applied, the time<br />
dur<strong>in</strong>g which the gas pedal was released, and the two criticality levels. These analyses show<br />
that the criticality was positively correlated to the number of times the brake pedal was<br />
applied (more serious entails more active brak<strong>in</strong>g), =.161, p=.029. The time the gas pedal<br />
was released and the criticality levels were negatively correlated (less critical entails more<br />
time released), =-.048, p=.008. In other words, there was <strong>in</strong>deed a relationship between the<br />
level of activity of decelerat<strong>in</strong>g and the criticality levels, and this was similar to the<br />
relationship found <strong>in</strong> the previous experiment: the level of criticality changed the way <strong>in</strong><br />
which drivers moved towards their more defensive driv<strong>in</strong>g style.<br />
A last explanation for a difference <strong>in</strong> experienced criticality might lie <strong>in</strong> the way the lead<strong>in</strong>g<br />
vehicle’s speed choice was programmed, and its effects on the brak<strong>in</strong>g events. In the f<strong>in</strong>al<br />
experiment, the lead<strong>in</strong>g vehicle rema<strong>in</strong>ed with<strong>in</strong> a time headway range of between 1.5 and 2.5<br />
seconds dur<strong>in</strong>g normal driv<strong>in</strong>g. The distance between the two vehicles <strong>in</strong> Experiment 1<br />
rema<strong>in</strong>ed <strong>in</strong> a range of between 18 and 48 metres. Remember that a headway value of 48<br />
metres is equivalent to a time headway of 3.5 seconds at a speed of 50 km/h, and to an even<br />
longer time headway at lower speeds. If the lead<strong>in</strong>g vehicle was often at the high end of the<br />
range of possible distances, a sudden brak<strong>in</strong>g event result<strong>in</strong>g <strong>in</strong> a f<strong>in</strong>al distance of less than 18<br />
metres (highest criticality) would have been a large difference. It could be argued that such a
154 <strong>Driv<strong>in</strong>g</strong> <strong>Behaviour</strong> <strong>in</strong> <strong>Unexpected</strong> <strong>Situations</strong><br />
large change could result <strong>in</strong> a more startl<strong>in</strong>g situation than a change <strong>in</strong> time headway from 2.5<br />
seconds to 0.8 seconds.<br />
We can therefore conclude that the events which were <strong>in</strong>tended as more critical were <strong>in</strong>deed<br />
more critical than others, as was already concluded from the programmed behaviour of the<br />
lead<strong>in</strong>g vehicle. However, it appears from the results that the most serious event <strong>in</strong> the f<strong>in</strong>al<br />
experiment was not as serious and/ or unexpected as the most serious event <strong>in</strong> Experiment 1.<br />
Therefore, we cannot be completely certa<strong>in</strong> that the level of criticality was high enough to<br />
prompt the level of behavioural change found <strong>in</strong> the first experiment.<br />
ii. Initial response to the brak<strong>in</strong>g events<br />
Experiment 1<br />
Drivers with high mental workload <strong>in</strong>itially responded as cautiously as normal drivers, but<br />
returned to their orig<strong>in</strong>al driv<strong>in</strong>g behaviour much faster than drivers who completely focussed<br />
on driv<strong>in</strong>g.<br />
Experiment 2<br />
At the path of the brak<strong>in</strong>g event itself, drivers without an additional task changed their<br />
headway approach pattern more (larger difference between beg<strong>in</strong>n<strong>in</strong>g of path and 60 metres<br />
before the <strong>in</strong>tersection) than drivers with an additional task, and this change decreased with<br />
task difficulty. The <strong>in</strong>itial change was therefore not similar between groups of different<br />
mental workload levels. However, drivers without an additional task adjusted their headway<br />
after the brak<strong>in</strong>g event, whereas drivers driv<strong>in</strong>g with an additional task did not. This is similar<br />
to the f<strong>in</strong>d<strong>in</strong>gs <strong>in</strong> the first experiment.<br />
Explanation<br />
The supposed lower event criticality might also have had an <strong>in</strong>fluence on this response. The<br />
perception of a lower criticality event might result <strong>in</strong> less startled drivers, who then might<br />
show a smaller response. This might also be related to the predecessor’s speed choice and the<br />
related difference <strong>in</strong> (time) headway before and after the brak<strong>in</strong>g events.<br />
6.2 Interpretation of results<br />
This section describes the mean<strong>in</strong>g of our f<strong>in</strong>d<strong>in</strong>gs <strong>in</strong> the light of earlier studies and vary<strong>in</strong>g<br />
theories regard<strong>in</strong>g driv<strong>in</strong>g behaviour. It specifically focuses on dynamic versus steady-state<br />
driv<strong>in</strong>g situations, on the implications of our f<strong>in</strong>d<strong>in</strong>gs for the hierarchical model of the driv<strong>in</strong>g<br />
task (Michon, 1971, 1985), on task prioritization, on conscious control versus driv<strong>in</strong>g <strong>in</strong> an<br />
automatic fashion, and on risk handl<strong>in</strong>g.<br />
6.2.1 Mental workload and the driv<strong>in</strong>g task: dynamic vs steady-state situations<br />
Other researchers have also <strong>in</strong>vestigated the relationship between mental workload and<br />
driv<strong>in</strong>g behaviour. One of the conclusions drawn <strong>in</strong> many of these studies was that driv<strong>in</strong>g <strong>in</strong><br />
dual-task conditions is often related to safety precautions, for <strong>in</strong>stance a decrease <strong>in</strong> speed and<br />
an <strong>in</strong>crease <strong>in</strong> safety marg<strong>in</strong>s (e.g., D<strong>in</strong>gus et al., 1997; Ranney, Harbluk & Noy, 2005;<br />
Strayer, Drews & Johnston, 2003). This implies that drivers with high workload levels often<br />
drive with larger (time) headways and at lower speeds, which can be expla<strong>in</strong>ed as driv<strong>in</strong>g<br />
more cautiously. At first glance, our results seem to contradict these earlier f<strong>in</strong>d<strong>in</strong>gs: we<br />
found that drivers with elevated mental workload drive closer to their lead<strong>in</strong>g vehicle and
Chapter 6 - Discussion 155<br />
road users from the opposite direction and have higher speeds than their counterparts without<br />
elevated mental workload. However, when look<strong>in</strong>g more closely to the differences between<br />
our experiment and some of these earlier studies, an explanation for the different f<strong>in</strong>d<strong>in</strong>gs<br />
presents itself.<br />
There are a number of other studies that support our found results that drivers tend to <strong>in</strong>crease<br />
their speed and decrease their safety marg<strong>in</strong>s <strong>in</strong> high mental workload level situations. For<br />
<strong>in</strong>stance, Lesh and Hancock suggested that drivers overestimate their own capabilities and<br />
performance, <strong>in</strong>dicat<strong>in</strong>g that an (<strong>in</strong>tentional) compensatory strategy <strong>in</strong>volv<strong>in</strong>g an <strong>in</strong>crease <strong>in</strong><br />
safety marg<strong>in</strong>s is unlikely (Lesh & Hancock, 2004). Furthermore, Charlton (2004) found that<br />
drivers who were driv<strong>in</strong>g while talk<strong>in</strong>g on the phone became less responsive to primary task<br />
demands, lead<strong>in</strong>g to an <strong>in</strong>crease <strong>in</strong> speed and longer reaction times.<br />
Earlier studies f<strong>in</strong>d<strong>in</strong>g that drivers decrease their speed and <strong>in</strong>crease their safety marg<strong>in</strong>s with<br />
elevated mental workload were often based on car-follow<strong>in</strong>g, and often <strong>in</strong> a highly controlled<br />
environment. Brookhuis, De Waard and Mulder (1994) presented a way to measure impair<strong>in</strong>g<br />
effects of external factors on driv<strong>in</strong>g behaviour us<strong>in</strong>g the car-follow<strong>in</strong>g task. Participants were<br />
required to follow a lead<strong>in</strong>g vehicle at a safe and constant distance <strong>in</strong> real traffic. The lead<strong>in</strong>g<br />
vehicle’s speed was preset by the researchers, and would fluctuate with<strong>in</strong> a preset range of<br />
speeds. Reaction times and coherence and phase shift of the driver’s response to the lead<br />
vehicle’s chang<strong>in</strong>g speed were recorded and used as a measurement of impaired driv<strong>in</strong>g. It<br />
was found that the ability to adaptively follow a car <strong>in</strong> front was a good <strong>in</strong>dicator of (attention<br />
and perception related) driv<strong>in</strong>g performance. In other experiments <strong>in</strong>vestigat<strong>in</strong>g dual-task<br />
effects on safety marg<strong>in</strong>s that found evidence for compensatory strategies, the driv<strong>in</strong>g<br />
scenarios were all steady-state scenarios <strong>in</strong> which many decisions were taken away from the<br />
drivers: route choice, speed choice, the choice to ma<strong>in</strong>ta<strong>in</strong> a certa<strong>in</strong> constant distance, the<br />
choice whether or not to overtake, and the overall goal of the trip. Furthermore, the<br />
encountered traffic situations were often rather simple, without any cross<strong>in</strong>g traffic, oppos<strong>in</strong>g<br />
traffic, <strong>in</strong> a relatively simple environment without multiple relevant features - <strong>in</strong> other words,<br />
no response to other traffic or aspects of the traffic situation would be required. The only<br />
rema<strong>in</strong><strong>in</strong>g subtask was car-follow<strong>in</strong>g, and this setup generally resulted <strong>in</strong> <strong>in</strong>creased safety<br />
marg<strong>in</strong>s <strong>in</strong> dual-task conditions (e.g., D<strong>in</strong>gus et al., 1997; Ranney, Harbluk & Noy, 2005;<br />
Strayer, Drews & Johnston, 2003).<br />
Horrey and Simmons (2007) questioned the conclusion that drivers always <strong>in</strong>crease their<br />
safety marg<strong>in</strong>s when driv<strong>in</strong>g with elevated workload. They described the aforementioned carfollow<strong>in</strong>g<br />
task as steady-state car-follow<strong>in</strong>g. The authors performed two concurrent<br />
experiments <strong>in</strong> order to <strong>in</strong>vestigate whether normal driv<strong>in</strong>g behaviour resembles driv<strong>in</strong>g<br />
behaviour <strong>in</strong> these steady-state tasks. Normal, or ‘tactical’ driv<strong>in</strong>g behaviour, accord<strong>in</strong>g to the<br />
researchers, <strong>in</strong>volves monitor<strong>in</strong>g multiple aspects of the driv<strong>in</strong>g environment and adapt<strong>in</strong>g to<br />
chang<strong>in</strong>g goals. Their first experiment <strong>in</strong>volved perform<strong>in</strong>g a steady-state car-follow<strong>in</strong>g task;<br />
<strong>in</strong> the second experiment, drivers were given what the researchers call a ‘tactical’ driv<strong>in</strong>g<br />
assignment. Drivers were requested to drive on a simulated highway and drive as they<br />
normally would, although specific <strong>in</strong>structions were given to avoid excessive speed<strong>in</strong>g.<br />
Drivers drove two similar experimental blocks, one while driv<strong>in</strong>g only and one while<br />
perform<strong>in</strong>g an additional task. They were free to overtake slower mov<strong>in</strong>g vehicles, but could<br />
also rema<strong>in</strong> beh<strong>in</strong>d another vehicle or drive at their own pace. The researchers divided the<br />
blocks <strong>in</strong>to sections of car-follow<strong>in</strong>g and the sections of overtak<strong>in</strong>g, and compared the results.<br />
They found that drivers <strong>in</strong>deed adaptively <strong>in</strong>crease their safety marg<strong>in</strong>s <strong>in</strong> dual-task<br />
conditions while follow<strong>in</strong>g their predecessor. However, drivers did not <strong>in</strong>crease (and
156 <strong>Driv<strong>in</strong>g</strong> <strong>Behaviour</strong> <strong>in</strong> <strong>Unexpected</strong> <strong>Situations</strong><br />
sometimes even decreased) their safety marg<strong>in</strong>s <strong>in</strong> other (tactical) tasks. The authors therefore<br />
concluded that dur<strong>in</strong>g the performance of tactical tasks, so while mov<strong>in</strong>g through a complex<br />
traffic environment at their own pace, drivers do not adapt their safety marg<strong>in</strong>s as was<br />
expected based on other studies.<br />
A similar conclusion can be drawn based on our experiments. Instead of presett<strong>in</strong>g a high<br />
number of subtasks, drivers could choose their own driv<strong>in</strong>g speed, driv<strong>in</strong>g style and safety<br />
marg<strong>in</strong>s, and could prioritize their additional tasks. The <strong>in</strong>structions for the participants <strong>in</strong><br />
both our experiments stated that drivers should drive ‘as they normally would’. They<br />
furthermore described how other road users might appear <strong>in</strong> the experiment, such as oppos<strong>in</strong>g<br />
traffic or cars driv<strong>in</strong>g <strong>in</strong> the same lane as the participants, but did not prescribe how to <strong>in</strong>teract<br />
with them. Instead, participants were requested to drive at a self-chosen speed and distance to<br />
other road users, but to prioritize safe driv<strong>in</strong>g over other tasks. The <strong>in</strong>structions did not read<br />
that drivers could not overtake other vehicles; however, overtak<strong>in</strong>g was made impossible <strong>in</strong><br />
both scenarios by either the acceleration of the lead vehicle or the high number of oppos<strong>in</strong>g<br />
traffic.<br />
Horrey and Simmons (2007) argued that the stretches of time <strong>in</strong> which drivers stayed beh<strong>in</strong>d<br />
their predecessor can still be categorized as steady-state car follow<strong>in</strong>g. This was not the case<br />
<strong>in</strong> our experiment, which consisted of only tactical driv<strong>in</strong>g <strong>in</strong> the parts which were used for<br />
measurement. Our participants cont<strong>in</strong>uously faced tactical tasks and challenges, all related to<br />
driv<strong>in</strong>g <strong>in</strong> an urban sett<strong>in</strong>g, and met with cross<strong>in</strong>g and oppos<strong>in</strong>g traffic and busy<br />
<strong>in</strong>frastructure. They furthermore had to cross 60 <strong>in</strong>tersections per trial, which largely consists<br />
of tactical driv<strong>in</strong>g. Participants <strong>in</strong> Horrey and Simmons’s (2007) study, <strong>in</strong> contrast, drove on a<br />
highway with all the encountered traffic mov<strong>in</strong>g <strong>in</strong> the same direction. In situations where<br />
drivers decide to follow, tactical choices are ignored; this is not the case <strong>in</strong> our experimental<br />
sett<strong>in</strong>g. In other words, whereas drivers <strong>in</strong> the study by Horrey and Simmons could<br />
temporarily ignore or forget their tactical tasks and engage <strong>in</strong> steady-state car-follow<strong>in</strong>g, this<br />
was not an option <strong>in</strong> our experiment.<br />
We therefore conclude that our results support the f<strong>in</strong>d<strong>in</strong>gs of Horrey and Simmons (2007), <strong>in</strong><br />
that drivers do not <strong>in</strong>crease necessarily their safety marg<strong>in</strong>s <strong>in</strong> dual-task conditions when they<br />
perform tactical driv<strong>in</strong>g actions. In challeng<strong>in</strong>g situations <strong>in</strong> which their driv<strong>in</strong>g is not<br />
restricted by <strong>in</strong>structions, viz. <strong>in</strong> tactical driv<strong>in</strong>g situations, drivers do not <strong>in</strong>crease their safety<br />
marg<strong>in</strong>s; they may even decrease them. This is valuable new knowledge for <strong>in</strong>creas<strong>in</strong>g the<br />
understand<strong>in</strong>g of driv<strong>in</strong>g with elevated mental workload.<br />
6.2.2 Michon’s (1971, 1985) hierarchical model of the driv<strong>in</strong>g task<br />
As was described <strong>in</strong> Chapter 2 (Theoretical Framework), Michon (1971) proposed a<br />
hierarchical model of the driv<strong>in</strong>g task consist<strong>in</strong>g of three task levels. These three levels are the<br />
strategic level, at which dest<strong>in</strong>ation, departure time, route and mode choices are made; the<br />
tactical level, deal<strong>in</strong>g with <strong>in</strong>teraction with the road and other road users; and the operational<br />
level, which consists of driv<strong>in</strong>g tasks related to handl<strong>in</strong>g the vehicle. In normal driv<strong>in</strong>g, these<br />
task levels <strong>in</strong>teract <strong>in</strong> a hierarchical, top-down manner: route choices made at the strategic<br />
level have their effect on the turns needed to arrive at the chosen dest<strong>in</strong>ation, and operational<br />
actions are required to steer the vehicle <strong>in</strong> the appropriate direction at the appropriate speed.<br />
There are however situations <strong>in</strong> which the <strong>in</strong>teraction between task levels can be bottom-up,<br />
for <strong>in</strong>stance <strong>in</strong> unexpected situations. Due to the required compensation behaviour, often at
Chapter 6 - Discussion 157<br />
lower levels, choices which were made earlier can sometimes become obsolete or have to be<br />
changed (Michon, 1985).<br />
The hierarchical model of the driv<strong>in</strong>g task (Michon, 1971, 1985) was <strong>in</strong>tended both as a<br />
description of the (structure of the) driv<strong>in</strong>g task and as a framework for a comprehensive<br />
driver model. We therefore wanted to determ<strong>in</strong>e to what extent the model could describe and<br />
frame the actions of drivers <strong>in</strong> specific situations. Our first driv<strong>in</strong>g simulator experiment was<br />
aimed at f<strong>in</strong>d<strong>in</strong>g more <strong>in</strong>formation on the ways <strong>in</strong> which compensation behaviour to<br />
unexpected, safety-critical situations <strong>in</strong>fluenced both short-term and long-term driv<strong>in</strong>g<br />
behaviour. The subsequent experiment focussed on test<strong>in</strong>g hypotheses aris<strong>in</strong>g from the<br />
f<strong>in</strong>d<strong>in</strong>gs <strong>in</strong> Experiment 1. Some of the results described <strong>in</strong> Chapters 4 and 5 <strong>in</strong>dicate that a<br />
directional change <strong>in</strong> task level <strong>in</strong>teraction can <strong>in</strong>deed have both a short-term and a long-term<br />
effect on driv<strong>in</strong>g behaviour, and that this can be seen dur<strong>in</strong>g and after unexpected events. For<br />
<strong>in</strong>stance, compensation behaviour to a longitud<strong>in</strong>al, safety-critical event was clearly found to<br />
have an effect on longitud<strong>in</strong>al driv<strong>in</strong>g behaviour after that event. However, the results also<br />
<strong>in</strong>dicate that us<strong>in</strong>g the model as a framework for a comprehensive model of driv<strong>in</strong>g behaviour<br />
poses some difficulties, that the model <strong>in</strong> itself has some limitations, and that there are a<br />
number of uncerta<strong>in</strong>ties that first need to be clarified before the model could possibly be used<br />
<strong>in</strong> that manner.<br />
The first uncerta<strong>in</strong>ty arises with the fixed number of three levels of the driv<strong>in</strong>g task. On the<br />
one hand, it is questionable whether certa<strong>in</strong> strategic subtasks, such as choos<strong>in</strong>g a transport<br />
mode and determ<strong>in</strong><strong>in</strong>g trip goal, are part of the actual driv<strong>in</strong>g task. After all, if travellers<br />
strategically decide to use the tra<strong>in</strong> as their transport mode, there is no driv<strong>in</strong>g task to be<br />
executed. Trip goal and personal demands concern<strong>in</strong>g the time, price and comfort of a trip are<br />
a factor <strong>in</strong> determ<strong>in</strong><strong>in</strong>g a transport mode. One could argue that the driv<strong>in</strong>g task only starts<br />
after these choices have been made <strong>in</strong> favour of us<strong>in</strong>g the car as transport mode, and that these<br />
tasks therefore should not be considered an <strong>in</strong>tegral part of the driv<strong>in</strong>g task. Follow<strong>in</strong>g this<br />
l<strong>in</strong>e of reason<strong>in</strong>g, the outcome of tasks at the strategic level could be considered a constra<strong>in</strong>t<br />
for driv<strong>in</strong>g (<strong>in</strong>clud<strong>in</strong>g the related route and time demands), and the actual driv<strong>in</strong>g task could<br />
be reduced to the two levels that actually take place while driv<strong>in</strong>g a car, the tactical and<br />
operational level. This raises a question related to situations <strong>in</strong> which route, time or goal have<br />
to be reconsidered (bottom-up <strong>in</strong>teraction): Is this reconsideration part of driv<strong>in</strong>g, or is it<br />
check<strong>in</strong>g the constra<strong>in</strong>ts and demands related to the choice of whether or not to drive? On the<br />
other hand, arguments for expand<strong>in</strong>g the driv<strong>in</strong>g task to <strong>in</strong>clude an additional fourth level also<br />
exist. Higher motivations and personal skills play a role <strong>in</strong> many every-day situations,<br />
<strong>in</strong>clud<strong>in</strong>g driv<strong>in</strong>g. Michon’s (1971, 1985) model has therefore been expanded by Hatakka,<br />
Kesk<strong>in</strong>en, Glad, Gregersen and Hernetkoski (2002) to conta<strong>in</strong> a fourth level which does not<br />
strictly conta<strong>in</strong> primary driv<strong>in</strong>g tasks but which directly <strong>in</strong>fluences all other levels, namely<br />
‘Goals for life and skills for liv<strong>in</strong>g’. This level describes how drivers’ higher motivations and<br />
personal skills also determ<strong>in</strong>e certa<strong>in</strong> aspects of how they drive. Should this <strong>in</strong>fluential fourth<br />
‘level’ be taken <strong>in</strong>to account when look<strong>in</strong>g at the three levels of the driv<strong>in</strong>g task itself, and<br />
does it have an <strong>in</strong>fluence on the way the three driv<strong>in</strong>g task levels <strong>in</strong>teract? Do drivers’<br />
motivations play a role <strong>in</strong> their adaptation to certa<strong>in</strong> situations, and how? Can the driv<strong>in</strong>g task<br />
be considered a separate task that can be studied dist<strong>in</strong>ctive from these higher motivations, or<br />
do decisional and motivational aspects also play a role <strong>in</strong> driv<strong>in</strong>g? Although these motivations<br />
and skills are not solely related to the driv<strong>in</strong>g task, they do say a lot about the way drivers<br />
handle this task. It can therefore also be argued that the driv<strong>in</strong>g task does not consist of three,<br />
but even of four levels. Conclud<strong>in</strong>g, the fixed number of three driv<strong>in</strong>g task levels can be<br />
disputed.
158 <strong>Driv<strong>in</strong>g</strong> <strong>Behaviour</strong> <strong>in</strong> <strong>Unexpected</strong> <strong>Situations</strong><br />
Also, the classification of different tasks <strong>in</strong> the three levels of the driv<strong>in</strong>g task poses some<br />
theoretical challenges. In this study, we classified most tasks <strong>in</strong> which hand or foot<br />
movements were <strong>in</strong>volved as an operational task. This also <strong>in</strong>volves the amount of pressure<br />
put on the gas pedal. We considered keep<strong>in</strong>g a certa<strong>in</strong> speed, which also <strong>in</strong>volves the<br />
estimation and evaluation of current speed, a tactical task, s<strong>in</strong>ce it was related to the<br />
<strong>in</strong>teraction with the other road users and the road. F<strong>in</strong>ally, choos<strong>in</strong>g an average goal speed, by<br />
estimat<strong>in</strong>g travel time and desired time of arrival, was considered a strategic task. However,<br />
this classification is subject to <strong>in</strong>terpretation. For <strong>in</strong>stance, Bellet and Tattegra<strong>in</strong>-Veste (1999)<br />
classify keep<strong>in</strong>g speed as an operational task, s<strong>in</strong>ce it is a low-level task that <strong>in</strong>volves actions<br />
with durations of less than a second. On the other hand, Koppa (1990) states that speed<br />
control (especially when adapt<strong>in</strong>g speed to a car <strong>in</strong> front) is a tactical-level task, s<strong>in</strong>ce it<br />
<strong>in</strong>volves react<strong>in</strong>g to the environment and other road users’ behaviour and is dynamic. F<strong>in</strong>ally,<br />
Brookhuis, De Vries and De Waard (1991) also state that normal speed choice can be related<br />
to the tactical level; however, the authors say that excessive speed<strong>in</strong>g is also, and maybe even<br />
ma<strong>in</strong>ly, related to the strategic level. Other reasons <strong>in</strong> favour of classify<strong>in</strong>g speed choice as a<br />
strategic task can also be given, s<strong>in</strong>ce speed choice is almost always related to reach<strong>in</strong>g a<br />
certa<strong>in</strong> dest<strong>in</strong>ation with<strong>in</strong> a certa<strong>in</strong> time span. Michon does not mention speed choice and<br />
speed control as a separate task, but focuses on overtak<strong>in</strong>g and stopp<strong>in</strong>g (Michon, 1985);<br />
these tasks both <strong>in</strong>volve speed control, and they are both categorized as be<strong>in</strong>g tactical level<br />
tasks. When develop<strong>in</strong>g a model based on a strict classification of subtasks among different<br />
levels, the classification of tasks to certa<strong>in</strong> levels should not be subject to <strong>in</strong>terpretation.<br />
Furthermore, the question arises whether it is possible to talk about strictly separate subtasks<br />
<strong>in</strong> a primary task <strong>in</strong> which every action at every s<strong>in</strong>gle moment is dictated by a number of<br />
subtasks and goals. Can the different actions <strong>in</strong> driv<strong>in</strong>g be separated to the extent needed for<br />
mak<strong>in</strong>g computations between the different levels? And is the separation <strong>in</strong>to levels the<br />
optimal way to model the <strong>in</strong>teraction between different driv<strong>in</strong>g tasks, or would it be more<br />
realistic to model different types of dist<strong>in</strong>ctions between different types of subtasks, which are<br />
all <strong>in</strong>terrelated?<br />
F<strong>in</strong>ally, the results of Experiment 1 showed that different characteristics of unexpected events<br />
may lead to vary<strong>in</strong>g types and sizes of change after these events. The two cases that we<br />
studied led to very different results, and it would be difficult to draw a generalized conclusion<br />
based on these two events. It is unclear whether add<strong>in</strong>g a third or a fourth type of unexpected<br />
event would lead to more vary<strong>in</strong>g results, or would fall under the category of one of the<br />
studied examples. It is however already clear from these two different types of events that it<br />
cannot be stated that unexpected events <strong>in</strong> general lead to a certa<strong>in</strong> directional change <strong>in</strong> task<br />
level <strong>in</strong>teraction. The longitud<strong>in</strong>al brak<strong>in</strong>g event led to changes <strong>in</strong> longitud<strong>in</strong>al driv<strong>in</strong>g<br />
behaviour, but the acceleration event, requir<strong>in</strong>g both longitud<strong>in</strong>al and lateral compensation,<br />
did not br<strong>in</strong>g about any significant changes. It is therefore not even clear whether a certa<strong>in</strong><br />
type of compensation behaviour will lead to a certa<strong>in</strong> (similar or different) type of behavioural<br />
change <strong>in</strong> driv<strong>in</strong>g. In short, we cannot draw any solid conclusions on the type of change after<br />
unexpected events <strong>in</strong> general. It is probably the case that this model has a specific realization<br />
for different types of events, or even for different specific events.<br />
Conclud<strong>in</strong>g, us<strong>in</strong>g the model as a framework for modell<strong>in</strong>g the way <strong>in</strong> which drivers handle<br />
the driv<strong>in</strong>g task <strong>in</strong> practice poses some challenges, and a number of other limitations also<br />
exist for the model as representation of the driv<strong>in</strong>g task. Moreover, further research is needed<br />
to clarify the uncerta<strong>in</strong>ties that were identified. These uncerta<strong>in</strong>ties and difficulties are mostly<br />
related to the delimitation of the task and the number of levels constitut<strong>in</strong>g the driv<strong>in</strong>g task, to<br />
whether or not these levels are strictly divided or partly overlapp<strong>in</strong>g, and to the division of the
Chapter 6 - Discussion 159<br />
different tasks over the task levels. The model with its current setup is useful for provid<strong>in</strong>g<br />
<strong>in</strong>sight <strong>in</strong>to the different aspects that constitute the driv<strong>in</strong>g task. The underly<strong>in</strong>g (sub)tasks,<br />
although very different, together constitute the overall driv<strong>in</strong>g task. These subtasks have<br />
different time frames and different roles <strong>in</strong> the realization of car driv<strong>in</strong>g. The hierarchical<br />
order<strong>in</strong>g of the task levels clarifies how car driv<strong>in</strong>g <strong>in</strong>volves cont<strong>in</strong>uous creation, execution<br />
and control of goal-directed plans and related feedback loops. This hierarchical order<strong>in</strong>g is<br />
<strong>in</strong>spired by architectures of human cognition modell<strong>in</strong>g (e.g., SOAR, see Lehman, Laird &<br />
Rosenbloom, 2006, or ACT-R, see Anderson, 1995), <strong>in</strong> which a goal is set at a higher level<br />
and passed on to the next lower level dur<strong>in</strong>g conscious control of the task. Feedback loops<br />
guide the execution of the plan. Furthermore, the hierarchy shows how an <strong>in</strong>creas<strong>in</strong>gly larger<br />
amount of <strong>in</strong>formation is needed for the successful execution of tasks at each higher order<br />
task level. Although reservations about the general setup of the model are <strong>in</strong> order, the<br />
hierarchical structure does provide <strong>in</strong>sight <strong>in</strong>to a number of important aspects of the driv<strong>in</strong>g<br />
task. With the mentioned uncerta<strong>in</strong>ties and theoretical problems solved, the altered version of<br />
the hierarchical driv<strong>in</strong>g task model (Michon, 1971, 1985) could serve as a guidel<strong>in</strong>e for<br />
modell<strong>in</strong>g the cognitive aspects of the driv<strong>in</strong>g task <strong>in</strong> situations <strong>in</strong> which conscious control<br />
and goal management are <strong>in</strong>volved.<br />
6.2.3 Task prioritization<br />
When determ<strong>in</strong><strong>in</strong>g the safety effects of additional tasks on driv<strong>in</strong>g performance, the first step<br />
is to understand the prioritization of tasks and subtasks. After all, if a possibly distract<strong>in</strong>g task<br />
is completely ignored <strong>in</strong> favour of safe driv<strong>in</strong>g, its effects are much smaller than when drivers<br />
fully engage <strong>in</strong> the distraction, regardless of the level of mental workload or task demands.<br />
But how does this prioritization take place <strong>in</strong> actual traffic situations? Do drivers still pay as<br />
much attention to safe driv<strong>in</strong>g when they concurrently do someth<strong>in</strong>g else? Do they actively<br />
prioritize safe driv<strong>in</strong>g at the expense of their secondary task? Or could driv<strong>in</strong>g <strong>in</strong> a situation<br />
with <strong>in</strong>creased mental workload turn out to be detrimental to safety?<br />
Even without <strong>in</strong>structions, drivers dist<strong>in</strong>guish between different types of subtasks. As was<br />
described <strong>in</strong> Chapter 2 (Theoretical Framework), Cnossen, Meijman and Rothengatter (2004)<br />
found that drivers prioritize safe driv<strong>in</strong>g at the expense of lower-priority secondary tasks. Our<br />
experiments revealed similar results. Both driv<strong>in</strong>g simulator experiments showed that an<br />
<strong>in</strong>crease <strong>in</strong> mental workload changes drivers’ behaviour. Drivers paid less attention to their<br />
speed and speed approach pattern and ma<strong>in</strong>ta<strong>in</strong>ed a smaller headway when engaged <strong>in</strong> certa<strong>in</strong><br />
levels of the secondary task, specifically the easy arithmetic task.<br />
Prioritization of the primary driv<strong>in</strong>g task at the expense of the secondary task occurred when<br />
the level of mental workload reached a threshold, which occurred while perform<strong>in</strong>g the<br />
difficult arithmetic task <strong>in</strong> both experiments. This was <strong>in</strong>dicated by the larger behavioural<br />
effects for the easy arithmetic task than the difficult task. Furthermore, when participants were<br />
asked to perform only the difficult and not the easy task (Experiment 1), the difficult task did<br />
not <strong>in</strong>terfere with behavioural variables. This also <strong>in</strong>dicates prioritization of safe driv<strong>in</strong>g <strong>in</strong><br />
high demand situations. F<strong>in</strong>ally, driv<strong>in</strong>g task prioritization was also <strong>in</strong>dicated by drivers’<br />
performance on the two secondary tasks. Participants performed much better on the easy than<br />
the difficult version of the task, with 2.4 times more answers and only one third of the<br />
proportion of wrong answers. This ratio could suggest that participants abandoned the<br />
difficult arithmetic task <strong>in</strong> order to focus on the primary task of safe and attentive driv<strong>in</strong>g.
160 <strong>Driv<strong>in</strong>g</strong> <strong>Behaviour</strong> <strong>in</strong> <strong>Unexpected</strong> <strong>Situations</strong><br />
Conclud<strong>in</strong>g, drivers do not only prioritize when <strong>in</strong>structed to (De Waard, 1996), they also<br />
prioritize safe driv<strong>in</strong>g over distract<strong>in</strong>g tasks when the external tasks are not relevant for safe<br />
driv<strong>in</strong>g (Cnossen et al., 2004), or when the comb<strong>in</strong>ed task demands exceed a certa<strong>in</strong> threshold<br />
(our results).<br />
6.2.4 Conscious control versus driv<strong>in</strong>g <strong>in</strong> an automatic fashion<br />
<strong>Driv<strong>in</strong>g</strong> is a task <strong>in</strong> which both automatic performance of subtasks and conscious task<br />
execution play a role. Such learned automatic (sub)tasks can allow drivers to save attentional<br />
resources. When fewer resources are <strong>in</strong>vested, task execution will be done <strong>in</strong> a more<br />
automatic or habitual fashion. When drivers drive <strong>in</strong> an automatic fashion and thus do not<br />
exert conscious control over every s<strong>in</strong>gle subtask, this habitual behaviour can show <strong>in</strong><br />
different ways and on different levels of the driv<strong>in</strong>g task. The automatic fashion <strong>in</strong> which<br />
drivers handle the driv<strong>in</strong>g task <strong>in</strong> these automaticity situations can be compared to the<br />
supervision task when supported by certa<strong>in</strong> ADA Systems. This type of support can have<br />
positive effects on the reduction of stress and negative affect (Cottrell & Barton, 2011).<br />
However, there needs to be an adequate balance between automaticity and conscious control.<br />
When it is safe and possible to perform (part of) the driv<strong>in</strong>g task <strong>in</strong> an automatic fashion,<br />
automaticity can <strong>in</strong>deed be positive, but the driver needs to rema<strong>in</strong> alert <strong>in</strong> order to switch<br />
back to conscious control when necessary. If this switch back to an active driv<strong>in</strong>g mode is<br />
<strong>in</strong>itiated too late drivers may not respond <strong>in</strong> a timely fashion, and safety-critical situations<br />
might occur.<br />
In our experiment, we found a relationship between the level of criticality of a situation, the<br />
level of automaticity at which a task is performed, and the level of mental workload <strong>in</strong> the<br />
driver. It was shown that drivers pay less attention to certa<strong>in</strong> crucial aspects of the driv<strong>in</strong>g task<br />
<strong>in</strong> dual-task situations. Specifically, our first experiment showed that drivers perform certa<strong>in</strong><br />
subtasks, such as decelerat<strong>in</strong>g before an <strong>in</strong>tersection, keep<strong>in</strong>g right, and ma<strong>in</strong>ta<strong>in</strong><strong>in</strong>g an<br />
appropriate speed, <strong>in</strong> a more automatic fashion when driv<strong>in</strong>g with an additional task.<br />
Furthermore, our second experiment showed that participants kept a larger headway when<br />
they could focus all of their attention on driv<strong>in</strong>g, than when they were driv<strong>in</strong>g with an<br />
arithmetic task. To a large extent this reflects the way <strong>in</strong> which people drive when they<br />
perform their driv<strong>in</strong>g task <strong>in</strong> an automatic fashion: habitually and without high levels of<br />
conscious control and/ or decision-mak<strong>in</strong>g. It appears that a high level of mental workload<br />
pushes drivers <strong>in</strong> the direction of an automatized driv<strong>in</strong>g mode. The l<strong>in</strong>k between mental<br />
workload and automaticity seems reasonable, s<strong>in</strong>ce automatization is strongly related to the<br />
efficient allocation of attentional resources.<br />
Switch<strong>in</strong>g task execution from a habitual, skill-based performance level to a more conscious,<br />
rule- or knowledge-based performance level is a mechanism that is related to compensation<br />
for a situation that does not fit with<strong>in</strong> the normal patterns (Rasmussen, 1987). In other words,<br />
the task needs to be executed at a different performance level. This could be characterized as a<br />
directional switch with<strong>in</strong> the SRK-framework (Rasmussen, 1987), with performance levels<br />
mov<strong>in</strong>g from skill-based (automatized, habitual) towards rule-based or even knowledge-based<br />
(conscious control over the driv<strong>in</strong>g task). This directional switch is strongly related to the way<br />
<strong>in</strong> which the driv<strong>in</strong>g task hierarchy responds to unexpected situations (Michon, 1985; also<br />
refer to Section 2.2.1). When drivers actually make this switch onto a lower level of<br />
automaticity and thus start to exert more conscious control over the driv<strong>in</strong>g task after an<br />
unexpected situation, one would expect more active <strong>in</strong>volvement <strong>in</strong> the driv<strong>in</strong>g task and the
Chapter 6 - Discussion 161<br />
traffic situation. The results of the first experiment <strong>in</strong>deed confirm this expectation. It was<br />
found that the level of safety-criticality of a brak<strong>in</strong>g event changes the way <strong>in</strong> which drivers<br />
decelerate; higher criticality events evoke a more active way of deceleration (i.e., through<br />
brak<strong>in</strong>g) than less critical events, after which drivers more often release the gas pedal.<br />
The results furthermore <strong>in</strong>dicate that the switch from automatic to conscious control is mostly<br />
restricted to specific levels of the driv<strong>in</strong>g task. This can be clarified by show<strong>in</strong>g the different<br />
responses between people with high mental workload and people who could focus all of their<br />
attentional resources on the driv<strong>in</strong>g task. In situations where the task demands are not very<br />
high (normal driv<strong>in</strong>g), drivers do not change all aspects of their driv<strong>in</strong>g behaviour after a<br />
safety-critical situation. For <strong>in</strong>stance, both experiments showed that level of criticality, or the<br />
urgency of the brak<strong>in</strong>g event, does not <strong>in</strong>fluence the speed pattern of regular drivers. So even<br />
though a safety-critical situation occurred, drivers did not change their habitual speed<br />
approach pattern. However, other aspects of their driv<strong>in</strong>g behaviour did change as a result of<br />
the safety-critical break<strong>in</strong>g event. Both experiments showed that participants drove more<br />
slowly after the brak<strong>in</strong>g event, if only temporarily. Drivers <strong>in</strong> the first experiment also kept<br />
larger headways; one could argue that they temporarily drove at a defensive or cautious<br />
driv<strong>in</strong>g style as a result of a safety-critical brak<strong>in</strong>g event. It seems as if the approach pattern to<br />
an <strong>in</strong>tersection is a very habitual behaviour that is not easily changed from automatized to<br />
conscious performance, whereas general speed and distance keep<strong>in</strong>g do appear to change as a<br />
result of more conscious control. This could be expla<strong>in</strong>ed by the fact that an approach pattern<br />
is largely connected to operational tasks such as brake and gas pedal control. Earlier studies<br />
have shown that it is very difficult to unlearn these tasks (e.g., Kortel<strong>in</strong>g, 1994; also refer to<br />
Section 2.2.1.2). However, subtasks on a higher level, for <strong>in</strong>stance tactical subtasks such as<br />
distance keep<strong>in</strong>g and speed ma<strong>in</strong>tenance, are more easily performed consciously. In other<br />
words, it can be concluded that a directional switch <strong>in</strong> skill-level mostly occurs <strong>in</strong> tactical<br />
level driv<strong>in</strong>g tasks, and less <strong>in</strong> operational subtasks.<br />
Conclud<strong>in</strong>g, our results <strong>in</strong>dicate that the level of mental workload has a l<strong>in</strong>k with the level of<br />
automaticity, and that drivers become more actively <strong>in</strong>volved <strong>in</strong> their task and drive <strong>in</strong> a less<br />
automatic manner after an unexpected situation. Mental workload appears to drive people <strong>in</strong>to<br />
automaticity and the directional switches between performance levels and task levels appear<br />
to be l<strong>in</strong>ked. Our results also revealed another <strong>in</strong>teraction between mental workload, situation<br />
criticality and automaticity.<br />
If drivers face an unexpected and safety-critical situation while they are driv<strong>in</strong>g <strong>in</strong> an<br />
automatic manner, it is recommendable to switch back to a higher level of conscious control<br />
<strong>in</strong> order to handle the situation actively and safely. This is the case for all drivers, whether or<br />
not they are driv<strong>in</strong>g with elevated levels of mental workload. Our results show that drivers<br />
with <strong>in</strong>creased mental workload are very reluctant to switch back from their habitual driv<strong>in</strong>g<br />
style. If they do change their driv<strong>in</strong>g mode, it is only when the situation is highly safetycritical<br />
and urgent, and their response also lasts shorter than a response from normally loaded<br />
drivers. Apparently it takes more to get people with high mental workload from their<br />
automatized driv<strong>in</strong>g style <strong>in</strong>to conscious driv<strong>in</strong>g than it does for people with normal workload<br />
levels. This is reflected <strong>in</strong> the results for both experiments. The first experiment showed that,<br />
while drivers with normal workload levels switch back from habitual driv<strong>in</strong>g to a more active<br />
and cautious driv<strong>in</strong>g style, drivers who have to divide their attention between driv<strong>in</strong>g and an<br />
additional task either do not show this defensive driv<strong>in</strong>g style, or quit this driv<strong>in</strong>g style<br />
sooner. This divide between the two mental workload groups <strong>in</strong> the first experiment was also<br />
reflected <strong>in</strong> the fact that drivers with high mental workload only respond to the most critical
162 <strong>Driv<strong>in</strong>g</strong> <strong>Behaviour</strong> <strong>in</strong> <strong>Unexpected</strong> <strong>Situations</strong><br />
events, whereas drivers under normal circumstances respond to all levels of events. The<br />
second experiment confirmed these results, show<strong>in</strong>g that drivers without an additional task<br />
adjusted their headway after a brak<strong>in</strong>g event, whereas drivers driv<strong>in</strong>g with an additional task<br />
did not (<strong>in</strong>dependent of the level of task difficulty).<br />
When drivers with elevated mental workload levels do f<strong>in</strong>ally respond to a highly critical<br />
situation, they show a stronger reaction, as if they are startled more strongly than their<br />
normally loaded counterparts. Their rega<strong>in</strong>ed active engagement <strong>in</strong> the driv<strong>in</strong>g task even<br />
reflects <strong>in</strong> the operational level of the driv<strong>in</strong>g task, as they even change their approach<br />
patterns to <strong>in</strong>tersections, <strong>in</strong> both speed and headway (based on results from both experiments).<br />
In other words, our results po<strong>in</strong>t towards a three-way <strong>in</strong>teraction between levels of mental<br />
workload, levels of automaticity, and levels of safety-criticality.<br />
Safe driv<strong>in</strong>g requires an appropriate balance between conscious driv<strong>in</strong>g (<strong>in</strong> which the driver is<br />
alert and <strong>in</strong>vests cognitive effort) and driv<strong>in</strong>g <strong>in</strong> an automatic fashion (dur<strong>in</strong>g which cognitive<br />
effort can be saved). Many studies have shown that both very low and very high task demands<br />
can lead to a high level of mental workload, and that this might impair driv<strong>in</strong>g behaviour (for<br />
a review of studies on mental workload and task demands, please refer to Section 2.4.3). The<br />
current study furthermore showed that the level of conscious or habitual driv<strong>in</strong>g is also related<br />
to mental workload.<br />
Further research could focus more deeply on the relationship between mental workload, task<br />
prioritization, automaticity and driv<strong>in</strong>g performance. Some of our current f<strong>in</strong>d<strong>in</strong>gs seem to<br />
contradict at first glance (on the one hand prioritiz<strong>in</strong>g the primary task <strong>in</strong> high mental<br />
workload situations and on the other hand go<strong>in</strong>g <strong>in</strong>to a more or less automatized driv<strong>in</strong>g<br />
mode). However, it might be that both f<strong>in</strong>d<strong>in</strong>gs describe drivers’ strategies to relieve some of<br />
the burden of extremely high mental workload, especially s<strong>in</strong>ce they did not explicitly show<br />
other compensation strategies such as <strong>in</strong>creas<strong>in</strong>g their safety marg<strong>in</strong>s. This thesis has already<br />
attempted to uncover the differences and similarities between distraction and mental workload<br />
(Chapter 2). Further untangl<strong>in</strong>g the relationship between mental workload and possible<br />
strategies for workload relief would strongly improve the knowledge about ways to improve<br />
driv<strong>in</strong>g performance by protect<strong>in</strong>g drivers from their ‘bad habits’. S<strong>in</strong>ce previous studies have<br />
shown that drivers overestimate their performance and there is little chance that they<br />
consciously adopt a strategy to <strong>in</strong>crease their driv<strong>in</strong>g performance (Lesh & Hancock, 2004). It<br />
would also be very <strong>in</strong>terest<strong>in</strong>g to know more about the role of conscious decision mak<strong>in</strong>g and<br />
strategy form<strong>in</strong>g <strong>in</strong> this context. Further research should therefore focus on these<br />
<strong>in</strong>terrelations.<br />
6.2.5 Risk handl<strong>in</strong>g<br />
The participants of the two experiments were placed <strong>in</strong> safety-critical situations, which lead to<br />
a behavioural adaptation to this risk. We compared our results to the theories on risk handl<strong>in</strong>g<br />
that were described <strong>in</strong> Chapter 2 (Theoretical framework): the Risk Homeostasis theory<br />
(Wilde, 1982), the Zero-risk theory (Näätänen & Summala, 1976; Summala & Näätänen,<br />
1988) and the Task-Capability Interface model (Fuller, 2000). Our experiments were not<br />
directed towards f<strong>in</strong>d<strong>in</strong>g the (<strong>in</strong>ternal) reasons for drivers’ actions, so the results are not<br />
appropriate for support<strong>in</strong>g or falsify<strong>in</strong>g any of the theories described. It has however become<br />
clear that the ways <strong>in</strong> which drivers cope with safety-critical situations can be related to the
Chapter 6 - Discussion 163<br />
level at which they are actively engaged <strong>in</strong> their driv<strong>in</strong>g task, an aspect of behavioural<br />
adaptation to risk that is not explicitly <strong>in</strong>cluded <strong>in</strong> all of the theories of risk handl<strong>in</strong>g.<br />
The fact that encounter<strong>in</strong>g risk <strong>in</strong> a traffic situation leads to behavioural adaptation is not<br />
controversial. Risk handl<strong>in</strong>g theories mostly focus on expla<strong>in</strong><strong>in</strong>g why behavioural adaptation<br />
takes place, rather than how. All the theories on risk handl<strong>in</strong>g described <strong>in</strong> Chapter 2<br />
(Theoretical Framework) can expla<strong>in</strong> the results <strong>in</strong> their own way. For <strong>in</strong>stance, the f<strong>in</strong>d<strong>in</strong>g<br />
that drivers lowered their speeds for a number of <strong>in</strong>tersections directly follow<strong>in</strong>g a safetycritical<br />
brak<strong>in</strong>g event (Experiment 1) would be expla<strong>in</strong>ed by the Risk Homeostasis theory<br />
(Wilde, 1982) as orig<strong>in</strong>at<strong>in</strong>g from a perceived <strong>in</strong>crease of risk. This new risk level presumably<br />
exceeded the personal acceptable level of risk which could be successfully atta<strong>in</strong>ed until the<br />
brak<strong>in</strong>g event occurred. As a result, the drivers’ perceived utility of their driv<strong>in</strong>g behaviour<br />
was no longer optimal, lead<strong>in</strong>g to a decrease <strong>in</strong> speed. However, this result would be<br />
expla<strong>in</strong>ed differently when bas<strong>in</strong>g the explanation on the Zero-risk model (Näätänen &<br />
Summala, 1976; Summala & Näätänen, 1988). Based on this Zero-risk model, it could be<br />
argued that drivers felt <strong>in</strong> control (zero risk) until the lead car braked. Whereas they might not<br />
have cont<strong>in</strong>uously monitored the risk level of the situation before the brak<strong>in</strong>g event, they<br />
apparently did feel the need to adapt their behaviour afterwards <strong>in</strong> order to accommodate for<br />
the perceived occurrence of risk. The drivers therefore adjusted their behaviour by means of<br />
control mechanisms, lead<strong>in</strong>g to a decrease <strong>in</strong> speed and/ or an <strong>in</strong>crease <strong>in</strong> safety marg<strong>in</strong>s.<br />
After some time, they rega<strong>in</strong>ed their trust <strong>in</strong> the situation and their perceived risk returned to<br />
zero. F<strong>in</strong>ally, a third explanation from the viewpo<strong>in</strong>t of the Task-Capability-Interface (Fuller,<br />
2000) would say that the difficulty of the task <strong>in</strong>creased due to the unexpected behaviour of<br />
the lead car, result<strong>in</strong>g <strong>in</strong> a situation where the (new) task demands exceed the drivers’<br />
capabilities. Therefore, drivers could react by do<strong>in</strong>g one of two th<strong>in</strong>gs: either <strong>in</strong>vest more<br />
effort with the aim of <strong>in</strong>creas<strong>in</strong>g their own capability, or decrease the task demands.<br />
Decreas<strong>in</strong>g task demands could <strong>in</strong>volve dropp<strong>in</strong>g an external or secondary task, but could also<br />
be achieved by lower<strong>in</strong>g the demands from the driv<strong>in</strong>g task itself. S<strong>in</strong>ce driv<strong>in</strong>g is mostly a<br />
self-paced task, lower<strong>in</strong>g their driv<strong>in</strong>g speed would give drivers more time to perceive<br />
possible hazards and make adequate decisions, therefore decreas<strong>in</strong>g task difficulty.<br />
It is our recommendation that further research be done <strong>in</strong>to the ways <strong>in</strong> which behavioural<br />
adaptation to risky situations (<strong>in</strong>clud<strong>in</strong>g the reasons for this adaptation) is <strong>in</strong>fluenced by the<br />
level of mental workload and by the extent to which drivers are actively engaged <strong>in</strong> driv<strong>in</strong>g.<br />
6.3 Design considerations for ADA Systems<br />
As was already expla<strong>in</strong>ed <strong>in</strong> Chapter 1, ADA Systems can be designed based either on<br />
technological advancements or on a human-centred design process. With such a humancentred<br />
design process, driver needs are at the start<strong>in</strong>g po<strong>in</strong>t for system development. A way<br />
to accomplish human-centred design is to comply with a number of ergonomic design<br />
pr<strong>in</strong>ciples, such as transparency of the system’s actions, adjust<strong>in</strong>g to <strong>in</strong>dividual situations and<br />
requirements (an adaptive system), and <strong>in</strong>telligibility of the operator’s role. Transparency<br />
means that the system’s responses to certa<strong>in</strong> traffic situations should be ‘understandable’ for<br />
drivers. To this end, the system could for <strong>in</strong>stance mimic the drivers’ natural optimal (safe)<br />
responses, or compensate for unsafe responses while accompanied by some type of<br />
explanation (<strong>in</strong>formation or warn<strong>in</strong>g).
164 <strong>Driv<strong>in</strong>g</strong> <strong>Behaviour</strong> <strong>in</strong> <strong>Unexpected</strong> <strong>Situations</strong><br />
An adaptive system could adapt the systems’ reactions to foreseen actions from drivers, <strong>in</strong><br />
addition to us<strong>in</strong>g the cues about the environment available to sensors. Our results show that<br />
drivers’ reactions to safety-critical situations differ accord<strong>in</strong>g to their level of mental<br />
workload and/ or distraction. By adaptively react<strong>in</strong>g to the drivers’ current state, ADA<br />
Systems can give the best appropriate response. For <strong>in</strong>stance, the objectively measured<br />
criticality of a situation and the related experience of a driver turn out to differ due to the<br />
driver’s state. This has an effect on the duration and size of the <strong>in</strong>tervention that drivers<br />
perform. Moreover, given that a risky situation is highly safety-critical, all drivers show an<br />
immediate reaction to the situation, but their response is much shorter <strong>in</strong> dual-task conditions<br />
(such as driv<strong>in</strong>g while handl<strong>in</strong>g the <strong>in</strong>terface of a support system). In addition to this, the total<br />
sum of task demands and the related level of mental workload also determ<strong>in</strong>e the priorities<br />
that drivers give to primary driv<strong>in</strong>g tasks and other possibly distract<strong>in</strong>g secondary tasks.<br />
Mimick<strong>in</strong>g the driver’s safety response <strong>in</strong> normal circumstances (<strong>in</strong>creas<strong>in</strong>g the response<br />
duration until some time after the actual event) might possibly lead to higher acceptance rates.<br />
More research is needed to determ<strong>in</strong>e whether this is actually the case.<br />
As the actions performed by ADA Systems should be transparent to drivers, so should be the<br />
drivers’ own responsibilities. Drivers need to be aware of the relative priority for handl<strong>in</strong>g and<br />
comply<strong>in</strong>g with the ADA System as compared to focus<strong>in</strong>g on their normal driv<strong>in</strong>g tasks. This<br />
is especially true when the ma<strong>in</strong> aim of the ADA System is to <strong>in</strong>crease driver comfort rather<br />
than traffic safety. Drivers’ prioritization of tasks (both primary and external) and, related, the<br />
relative relevance of external tasks, are important <strong>in</strong>dicators of the impair<strong>in</strong>g effects of mental<br />
workload. Driver tra<strong>in</strong><strong>in</strong>g feedback dur<strong>in</strong>g driv<strong>in</strong>g could make drivers (more) aware of the<br />
relative relevance of us<strong>in</strong>g ADA Systems as compared to regular driv<strong>in</strong>g tasks. Of course, not<br />
overload<strong>in</strong>g the driver with <strong>in</strong>formation rema<strong>in</strong>s an important concern, especially <strong>in</strong> situations<br />
of high mental workload, so more research is needed to establish the optimal way to provide<br />
this <strong>in</strong>formation to drivers.<br />
Moreover, researchers and developers of ADA Systems need to be aware that a ‘tipp<strong>in</strong>g po<strong>in</strong>t’<br />
exists for the impair<strong>in</strong>g effects of <strong>in</strong>creased mental workload. Below a certa<strong>in</strong> threshold of<br />
mental workload, drivers allow themselves to be distracted, result<strong>in</strong>g <strong>in</strong> impaired driv<strong>in</strong>g<br />
behaviour. When the level of mental workload exceeds this threshold, drivers appear to<br />
realize that the task demands exceed their capabilities, and they put their focus back on safe<br />
driv<strong>in</strong>g. Unfortunately, this tipp<strong>in</strong>g po<strong>in</strong>t is not always situated where researchers and<br />
developers would wish it was, viz. before the impairment of driv<strong>in</strong>g performance. Studies <strong>in</strong>to<br />
the effects of ADA Systems should therefore not only focus on possible <strong>in</strong>creases or<br />
decreases of mental workload levels <strong>in</strong>volved with us<strong>in</strong>g the system. They should also<br />
determ<strong>in</strong>e what effects the system has on task prioritization, distraction, and the overall traffic<br />
safety result<strong>in</strong>g from possible changes <strong>in</strong> driv<strong>in</strong>g behaviour.<br />
With these recommendations and our f<strong>in</strong>d<strong>in</strong>gs on driver distraction and mental workload <strong>in</strong><br />
m<strong>in</strong>d, we proposed a promis<strong>in</strong>g direction for the development of safety-enhanc<strong>in</strong>g ADA<br />
Systems. This could lead to a group of safety-enhanc<strong>in</strong>g ADA Systems designed for urban<br />
sett<strong>in</strong>gs. The functions of this group of systems are related to safety enhancement <strong>in</strong> distracted<br />
driv<strong>in</strong>g. Based on the f<strong>in</strong>d<strong>in</strong>gs <strong>in</strong> this thesis, we recommend that this type of systems would<br />
be developed as <strong>in</strong>tegrated systems, <strong>in</strong> order to coord<strong>in</strong>ate all signals given to the driver and<br />
adaptively suppress <strong>in</strong>formation based on the level of current workload <strong>in</strong> the driver. This<br />
means that it would conta<strong>in</strong> a communication and coord<strong>in</strong>ation module, which communicates<br />
with all other devices and comb<strong>in</strong>es <strong>in</strong>formation from sensors to cont<strong>in</strong>uously update<br />
<strong>in</strong>formation on the states of both driver and vehicle. A module for workload estimation could
Chapter 6 - Discussion 165<br />
keep track of the state of the driver <strong>in</strong> terms of mental workload and distraction. This module<br />
could for <strong>in</strong>stance comb<strong>in</strong>e <strong>in</strong>formation about the static road environment, the number of<br />
systems and vehicle controls drivers are <strong>in</strong>teract<strong>in</strong>g with, drivers’ seat positions, glanc<strong>in</strong>g<br />
behaviour, or a change <strong>in</strong> driv<strong>in</strong>g style (e.g., Mayser, Piechulla, Weiss & König, 2003). By<br />
comb<strong>in</strong><strong>in</strong>g the <strong>in</strong>formation about the state of the driver, the vehicle and the environment, this<br />
type of systems can constantly be aware of the actual driv<strong>in</strong>g situation. The actions of the<br />
system can thus be adapted to give the optimal response to this situation.<br />
The proposed direction for development could lead to a group of systems which could be<br />
given the generic name DAISy (Distraction Avoidance Integrated System). DAISy has the<br />
aim of enhanc<strong>in</strong>g drivers’ safety dur<strong>in</strong>g distracted driv<strong>in</strong>g <strong>in</strong> urban sett<strong>in</strong>gs. Based on the<br />
f<strong>in</strong>d<strong>in</strong>gs presented <strong>in</strong> this thesis, five recommendations for this new direction of systems are<br />
made.<br />
Many safety issues arise from or manifest <strong>in</strong> the form of <strong>in</strong>appropriate speeds and safety<br />
marg<strong>in</strong>s, and adopt<strong>in</strong>g these safety boundaries to the current driv<strong>in</strong>g situation and the driver<br />
state could largely benefit safety. The first recommendation is therefore to establish a safety<br />
zone around the vehicle with its boundaries set at safe distances, giv<strong>in</strong>g drivers enough time<br />
to counter a possible conflict.<br />
We found that drivers might ‘allow’ their driv<strong>in</strong>g to be impaired when their mental workload<br />
is elevated but still stays below a certa<strong>in</strong> threshold. Drivers should thus not be presented with<br />
unnecessary stimuli when they are driv<strong>in</strong>g <strong>in</strong> safety-critical situations, such as another object<br />
enter<strong>in</strong>g the safety boundaries. The second recommendation would therefore be to stop the<br />
<strong>in</strong>put of non-vital systems and warn the driver when another object enters this safety zone.<br />
We furthermore found that drivers respond later to upcom<strong>in</strong>g conflicts <strong>in</strong> the case of elevated<br />
mental workload. Drivers therefore need to be warned earlier when they are <strong>in</strong> a high<br />
workload situation, so that they can switch their full attention to avoid<strong>in</strong>g a possible conflict.<br />
So when it is determ<strong>in</strong>ed that mental workload is higher than normal, the safety boundaries<br />
should be <strong>in</strong>creased to accommodate the decreased attention. This is the third<br />
recommendation for this type of systems.<br />
A fourth recommendation would be to adjust the speed or (lateral) direction of the vehicle if<br />
the level of mental workload is higher than normal, <strong>in</strong> order to accommodate the decreased<br />
attention.<br />
F<strong>in</strong>ally, when mental workload <strong>in</strong>creases, drivers pay less attention to objects appear<strong>in</strong>g <strong>in</strong><br />
their peripheral visual field. As a fifth recommendation, we therefore propose that Distraction<br />
Avoidance Integrated Systems scan for mov<strong>in</strong>g objects <strong>in</strong> the part of drivers’ visual field that<br />
overlap with the safety boundaries around the vehicle, such as pedestrians and bicyclists, <strong>in</strong><br />
situations with elevated mental workload.<br />
In this way, ADA Systems <strong>in</strong> the DAISy ‘family’ would meet several of the recommendations<br />
based on this thesis. More research is needed to determ<strong>in</strong>e how the relative priorities of<br />
drivers’ own driv<strong>in</strong>g actions and <strong>in</strong>teraction with the system can be guided <strong>in</strong> a safe manner,<br />
without overload<strong>in</strong>g the driver with too much <strong>in</strong>formation.
166 <strong>Driv<strong>in</strong>g</strong> <strong>Behaviour</strong> <strong>in</strong> <strong>Unexpected</strong> <strong>Situations</strong>
Chapter 7<br />
Conclusions<br />
The f<strong>in</strong>al chapter of this thesis gives an overview of the f<strong>in</strong>d<strong>in</strong>gs and conclusions for the<br />
studies performed. Recommendations for further research are discussed, based on the<br />
f<strong>in</strong>d<strong>in</strong>gs from the driv<strong>in</strong>g simulator studies and the questions raised <strong>in</strong> discuss<strong>in</strong>g them.<br />
167
168 <strong>Driv<strong>in</strong>g</strong> <strong>Behaviour</strong> <strong>in</strong> <strong>Unexpected</strong> <strong>Situations</strong>
Chapter 7 - Conclusions 169<br />
7.1 Context and research questions<br />
T<br />
he central theme <strong>in</strong> this thesis is the way <strong>in</strong> which drivers handle unexpected risky<br />
situations, and the personal characteristics and circumstances that affect the outcome<br />
of their choices and actions. This is related to the change between top-down and<br />
bottom-up <strong>in</strong>fluence between levels of the driv<strong>in</strong>g task, as proposed by Michon (1971). In this<br />
hierarchical task level model, three task levels make up the driv<strong>in</strong>g task: the strategic, tactical,<br />
and operational level. Tasks <strong>in</strong>volv<strong>in</strong>g choices about trip dest<strong>in</strong>ation, departure time, route<br />
and other trip goals are part of the strategic level. At the tactical level, tasks <strong>in</strong>volv<strong>in</strong>g<br />
<strong>in</strong>teraction with the road and other road users are performed. This <strong>in</strong>cludes ma<strong>in</strong>ta<strong>in</strong><strong>in</strong>g an<br />
appropriate distance to other road users, driv<strong>in</strong>g on the correct side of the road, and tak<strong>in</strong>g<br />
turns accord<strong>in</strong>g to the trip goals. At the lowest operational level, all <strong>in</strong>teraction with the<br />
vehicle controls takes place. This <strong>in</strong>volves, among other tasks, press<strong>in</strong>g the gas pedal, turn<strong>in</strong>g<br />
the steer<strong>in</strong>g wheel, and check<strong>in</strong>g the mirrors.<br />
These three driv<strong>in</strong>g task levels <strong>in</strong>teract, and <strong>in</strong> normal driv<strong>in</strong>g this <strong>in</strong>teraction takes place topdown.<br />
Choices about the route <strong>in</strong>volve the turns to be taken, and this determ<strong>in</strong>es the angle <strong>in</strong><br />
which the steer<strong>in</strong>g wheel needs to be held. Choices about the desired departure and arrival<br />
times (partly) determ<strong>in</strong>e the desired speed, which <strong>in</strong> turn determ<strong>in</strong>es how drivers <strong>in</strong>teract with<br />
other road users and how far they press the gas pedal. In other words, higher level choices<br />
dictate the <strong>in</strong>put for lower level tasks. However, a directional change can take place <strong>in</strong> the<br />
<strong>in</strong>teraction between task levels. Top-down <strong>in</strong>teraction, important <strong>in</strong> normal driv<strong>in</strong>g, can<br />
switch to bottom-up <strong>in</strong>teraction <strong>in</strong> the case of an unexpected situation (Michon, 1985). When<br />
drivers’ choices do not turn out the way they had anticipated, drivers have to compensate for<br />
this unexpected situation by chang<strong>in</strong>g certa<strong>in</strong> actions <strong>in</strong> order to rega<strong>in</strong> control over the<br />
situation. For example, a driver driv<strong>in</strong>g on a slippery road who would normally act accord<strong>in</strong>g<br />
to top-down route choices, might have to <strong>in</strong>tervene when the car starts to shift, and thus<br />
prioritize lower-level tasks (rega<strong>in</strong><strong>in</strong>g control over the vehicle) over earlier higher-level<br />
choices (tak<strong>in</strong>g the correct turn, or keep<strong>in</strong>g the appropriate distance to a predecessor). This is<br />
what is meant throughout this thesis by the directional change <strong>in</strong> task level <strong>in</strong>teraction dur<strong>in</strong>g<br />
unexpected situations.<br />
7.1.1 Research questions<br />
This thesis aimed to answer the follow<strong>in</strong>g research questions:<br />
How do drivers respond to unexpected, safety-critical events while driv<strong>in</strong>g <strong>in</strong> an urban<br />
environment?<br />
To what extent does the urgency of the event <strong>in</strong>fluence this response?<br />
To what extent does the level of mental workload exert an <strong>in</strong>fluence on this reaction?<br />
To what extent do drivers’ basic demographic characteristics, such as gender or age,<br />
<strong>in</strong>fluence this reaction?<br />
How do the results relate to the framework presented by the hierarchical model of the<br />
driv<strong>in</strong>g task (Michon, 1971, 1985)?<br />
What is the relationship between the f<strong>in</strong>d<strong>in</strong>gs <strong>in</strong> our studies and previous studies done <strong>in</strong>to<br />
driver distraction, mental workload and other human factors <strong>in</strong> driv<strong>in</strong>g?<br />
What is the relationship between mental workload and driver distraction?<br />
Which recommendations can be made for the development of safe ADA Systems?
170 <strong>Driv<strong>in</strong>g</strong> <strong>Behaviour</strong> <strong>in</strong> <strong>Unexpected</strong> <strong>Situations</strong><br />
7.1.2 Research approach<br />
Accord<strong>in</strong>g to the hierarchical model of the driv<strong>in</strong>g task (Michon, 1971, 1985), described <strong>in</strong><br />
Chapter 2, normal driv<strong>in</strong>g with its top-down <strong>in</strong>teraction between task levels can switch to<br />
compensation behaviour and the related bottom-up <strong>in</strong>teraction <strong>in</strong> the case of an unexpected<br />
situation. The hypothesized change of the direction of <strong>in</strong>teractions between task levels and its<br />
effects on driv<strong>in</strong>g behaviour were <strong>in</strong>vestigated <strong>in</strong> two driv<strong>in</strong>g simulator experiments with the<br />
aim of study<strong>in</strong>g the implications of Michon’s (1971, 1985) model. By present<strong>in</strong>g successive<br />
similar situations to drivers, without much variation, expectations were created by the drivers.<br />
These expectations were subsequently broken by present<strong>in</strong>g them with unexpected and safetycritical<br />
situations. In <strong>in</strong>vestigat<strong>in</strong>g the drivers’ responses, we determ<strong>in</strong>ed their primary<br />
responses dur<strong>in</strong>g the event, the (temporary) effects on driv<strong>in</strong>g behaviour, and the <strong>in</strong>fluence of<br />
external factors such as mental workload and the urgency of the situation. We furthermore<br />
determ<strong>in</strong>ed whether certa<strong>in</strong> basic demographic characteristics of drivers (e.g., gender, age)<br />
have an effect on their reactions.<br />
7.2 F<strong>in</strong>d<strong>in</strong>gs: Reactions to unexpected, safety-critical events<br />
7.2.1 Compensation behaviour and driv<strong>in</strong>g style<br />
Car drivers adapt their driv<strong>in</strong>g style and behavioural responses to the type of situations they<br />
encounter, the risk level of encountered situations, and their own level of mental workload.<br />
When they experience an unexpected, safety-critical event at the operational level, they<br />
generally tend to compensate for it at this operational level (for <strong>in</strong>stance, by brak<strong>in</strong>g and/ or<br />
steer<strong>in</strong>g away), and they might temporarily adapt their (tactical) driv<strong>in</strong>g style to accommodate<br />
for the risky situation. Depend<strong>in</strong>g on the type of situation, the compensatory actions required<br />
to divert the immediate traffic conflict and the result<strong>in</strong>g change <strong>in</strong> driv<strong>in</strong>g style can vary. For<br />
<strong>in</strong>stance, a suddenly brak<strong>in</strong>g lead vehicle was found to have a different behavioural effect<br />
than a suddenly accelerat<strong>in</strong>g car from a left side street, although both situations led to<br />
approximately equally risky situations <strong>in</strong> terms of the distance after the event between the two<br />
vehicles <strong>in</strong>volved. Not only were the <strong>in</strong>itial compensatory responses different, also the<br />
(temporary) behavioural adaptation after the events varied between the two types of events.<br />
Encounter<strong>in</strong>g the suddenly accelerat<strong>in</strong>g car did not seem to affect participants’ driv<strong>in</strong>g styles,<br />
whereas the required compensation to the brak<strong>in</strong>g lead vehicle did have an effect on driv<strong>in</strong>g<br />
speed, speed approach pattern, lateral position on the road, and distance headway.<br />
Driver characteristics such as age and gender were not found to significantly affect these<br />
reactions to unexpected and/ or safety-critical events. However, the level of mental workload<br />
of the driver does have an <strong>in</strong>fluence on the aforementioned reactions. Perform<strong>in</strong>g a relatively<br />
simple, yet cognitively demand<strong>in</strong>g, arithmetic task elevates mental workload. With this<br />
elevated mental workload, the safety of drivers’ reactions to the unexpected and safety-critical<br />
events deteriorates. On the one hand, drivers with normal workload were found to <strong>in</strong>tervene<br />
and adapt their driv<strong>in</strong>g style to accommodate for safety-critical situations, also <strong>in</strong> situations<br />
which are not very high-risk. After hav<strong>in</strong>g ga<strong>in</strong>ed back control, they ma<strong>in</strong>ta<strong>in</strong> a larger<br />
distance than before the event, and drive slower. In other words, they try to prevent a similar<br />
situation from occurr<strong>in</strong>g aga<strong>in</strong> by pay<strong>in</strong>g more attention to the driv<strong>in</strong>g task and their<br />
(apparently risky) environment. This <strong>in</strong>dicates a directional change from normal top-down<br />
directed driv<strong>in</strong>g behaviour to compensation behaviour, which is directed <strong>in</strong> a bottom-up
Chapter 7 - Conclusions 171<br />
manner. Regular drivers furthermore drive more cautiously (larger headway) at the start of a<br />
road section after the brak<strong>in</strong>g event than they do at the end of that particular road section, as if<br />
they try to exam<strong>in</strong>e the situation. They ma<strong>in</strong>ta<strong>in</strong> this cautious behaviour for some time after<br />
the brak<strong>in</strong>g event. On the other hand, drivers with high levels of mental workload seem to<br />
respond only to very serious situations (although this was not supported <strong>in</strong> both experiments,<br />
possibly due to a difference <strong>in</strong> programm<strong>in</strong>g of the severity of the experimental events). They<br />
furthermore ma<strong>in</strong>ta<strong>in</strong> a shorter distance to other road users (both their predecessor and<br />
oppos<strong>in</strong>g traffic), drive faster, and return to their normal driv<strong>in</strong>g situation much more quickly<br />
than drivers who are able to focus their full attention to the driv<strong>in</strong>g task. There appears to be a<br />
threshold above which drivers abandon their attempt to perform both the primary driv<strong>in</strong>g task<br />
and the secondary tasks concurrently, and prioritize safe driv<strong>in</strong>g at the cost of performance on<br />
the secondary task.<br />
Our experiments confirm the premise of the hierarchical model of the driv<strong>in</strong>g task (Michon,<br />
1971, 1985) that top-down <strong>in</strong>teraction between task levels temporarily changes <strong>in</strong>to bottomup<br />
<strong>in</strong>teraction as a result of compensation for unexpected and safety-critical situations. This is<br />
shown <strong>in</strong> the temporary behavioural change after unexpected, safety-critical events.<br />
Furthermore, our results <strong>in</strong>dicate that the model can be extended when it comes to the impact<br />
of conscious attention on the part of the driver. If drivers focus on other th<strong>in</strong>gs than safe<br />
driv<strong>in</strong>g, bottom-up <strong>in</strong>teraction occurs only <strong>in</strong> response to highly dangerous situations <strong>in</strong><br />
contrast to situations when drivers do pay full attention to driv<strong>in</strong>g. Additionally we found that<br />
the duration of this behavioural change is dependent on the level of mental workload that<br />
drivers have <strong>in</strong> such double task situations. Section 7.3 reflects on the theoretical issues<br />
related to these results and their application <strong>in</strong> the light of the hierarchical model of the<br />
driv<strong>in</strong>g task (Michon, 1971, 1985).<br />
7.2.2 Task prioritization<br />
The primary driv<strong>in</strong>g task was prioritized at the expense of the secondary task when the level<br />
of mental workload reached a threshold, which occurred while perform<strong>in</strong>g the difficult<br />
arithmetic task <strong>in</strong> both experiments. Participants performed much better on the easy than the<br />
difficult version of the task (more than one would expect based on the task difficulty itself),<br />
and their primary task performance <strong>in</strong>creased at the same time. This suggests that participants<br />
abandoned the difficult arithmetic task <strong>in</strong> order to focus on the primary task of safe and<br />
attentive driv<strong>in</strong>g. In other words, when drivers are faced with <strong>in</strong>creas<strong>in</strong>g task demands which<br />
exceed their capabilities, they put safe driv<strong>in</strong>g back at the top of their priority list. The<br />
<strong>in</strong>creased task demands result <strong>in</strong> prioritiz<strong>in</strong>g safer driv<strong>in</strong>g over the performance on the<br />
secondary task. Earlier research conducted by Cnossen, Meijman and Rothengatter (2004)<br />
already showed that drivers give a lower priority to secondary tasks which are irrelevant for<br />
safe driv<strong>in</strong>g, such as tun<strong>in</strong>g the radio, than to external tasks which are <strong>in</strong>deed relevant for<br />
driv<strong>in</strong>g, such as read<strong>in</strong>g a map. The current research furthermore shows that not only the<br />
relevance of the secondary task for driv<strong>in</strong>g performance, but also the task demands play a role<br />
<strong>in</strong> drivers’ task prioritization. Conclud<strong>in</strong>g, drivers do not only prioritize safe driv<strong>in</strong>g over<br />
distract<strong>in</strong>g tasks when <strong>in</strong>structed to or when the external tasks are not relevant for safe<br />
driv<strong>in</strong>g, but also when the comb<strong>in</strong>ed task demands exceed a certa<strong>in</strong> threshold.
172 <strong>Driv<strong>in</strong>g</strong> <strong>Behaviour</strong> <strong>in</strong> <strong>Unexpected</strong> <strong>Situations</strong><br />
7.2.3 Automatized driv<strong>in</strong>g versus conscious control over the driv<strong>in</strong>g task<br />
<strong>Driv<strong>in</strong>g</strong> is a task <strong>in</strong> which both automatic performance of subtasks and conscious task<br />
execution play a role. Such learned automatic (sub)tasks can allow drivers to save attentional<br />
resources. However, there needs to be an adequate balance between automaticity and<br />
conscious control. When it is safe and possible to perform (part of) the driv<strong>in</strong>g task <strong>in</strong> an<br />
automatized fashion, automaticity can <strong>in</strong>deed be positive, but the driver needs to rema<strong>in</strong> alert<br />
<strong>in</strong> order to switch back to conscious control when necessary. When this switch back to an<br />
active driv<strong>in</strong>g mode is <strong>in</strong>itiated too late, drivers may not respond <strong>in</strong> a timely fashion, and<br />
safety-critical situations might occur.<br />
F<strong>in</strong>d<strong>in</strong>gs from this study suggest a relationship between the level of criticality of a situation,<br />
the level of automaticity with which a task is performed, and the level of mental workload of<br />
the driver. Drivers pay less attention to certa<strong>in</strong> crucial aspects of the driv<strong>in</strong>g task, such as<br />
decelerat<strong>in</strong>g before an <strong>in</strong>tersection, keep<strong>in</strong>g right, and ma<strong>in</strong>ta<strong>in</strong><strong>in</strong>g an appropriate speed and<br />
headway, when they have a high level of mental workload. It appears that a high level of<br />
mental workload pushes drivers <strong>in</strong> the direction of an automatized driv<strong>in</strong>g mode. Although a<br />
switch from conscious control to automatized driv<strong>in</strong>g might save attentional resources,<br />
switch<strong>in</strong>g back to full conscious control over the driv<strong>in</strong>g task is required <strong>in</strong> safety-critical<br />
situations. It was found that drivers do make this switch, but mostly at the tactical level of the<br />
driv<strong>in</strong>g task (strategic level subtasks were not studied).<br />
Drivers with <strong>in</strong>creased mental workload are highly reluctant to switch back from their<br />
habitual driv<strong>in</strong>g style. If they do change their driv<strong>in</strong>g mode, it is only when the situation is<br />
highly safety-critical and urgent, and their response also lasts shorter than a response from<br />
normally loaded drivers. However, when mentally loaded drivers do f<strong>in</strong>ally respond to a<br />
highly critical situation, they show a stronger reaction, as if they are startled more strongly<br />
than their normally loaded counterparts.<br />
Conclud<strong>in</strong>g, our results po<strong>in</strong>t towards a three-way <strong>in</strong>teraction between levels of mental<br />
workload, automaticity, and safety-criticality.<br />
7.3 Reflections on theoretical framework<br />
The theoretical framework presented <strong>in</strong> Chapter 2 was based on the three-layered hierarchical<br />
model of the driv<strong>in</strong>g task (Michon, 1971, 1985), and <strong>in</strong>cluded references to mental workload<br />
and the effects of unexpected situations. This section reflects upon two theoretical aspects of<br />
this framework, namely the underly<strong>in</strong>g structure of the hierarchical model and the relationship<br />
between mental workload and (latent) driver distraction.<br />
7.3.1 Latent driver distraction and mental workload<br />
Accord<strong>in</strong>g to its def<strong>in</strong>ition, driver distraction occurs when there is a secondary task or activity<br />
which is given attention by the driver and thus dim<strong>in</strong>ishes driv<strong>in</strong>g performance. Traditionally,<br />
whether or not driv<strong>in</strong>g performance was dim<strong>in</strong>ished was determ<strong>in</strong>ed by measur<strong>in</strong>g the level of<br />
safety of the current situation. However, be<strong>in</strong>g able to respond to an upcom<strong>in</strong>g safety hazard<br />
is also a part of safe driv<strong>in</strong>g, and this does not necessarily materialize <strong>in</strong> measurable safety<br />
effects with<strong>in</strong> the current situation. Therefore, the concept of latent driver distraction, a form
Chapter 7 - Conclusions 173<br />
of driver distraction that does not materialize <strong>in</strong> measurably unsafe driv<strong>in</strong>g behaviour but that<br />
does impair be<strong>in</strong>g able to respond adequately to upcom<strong>in</strong>g safety-critical situations, is<br />
<strong>in</strong>troduced <strong>in</strong> Chapter 2.<br />
The concepts of driver distraction and mental workload appear to have a number of aspects <strong>in</strong><br />
common. They are both related to task demands; they can both co<strong>in</strong>cide with deteriorat<strong>in</strong>g<br />
driv<strong>in</strong>g performance; and they can occur simultaneously. However, the concepts and<br />
processes <strong>in</strong>volved are clearly dist<strong>in</strong>ct. Whereas driver distraction can only occur as the result<br />
of a distract<strong>in</strong>g task or object; mental workload can also <strong>in</strong>crease due to chang<strong>in</strong>g demands<br />
from the primary task itself. While decreased driv<strong>in</strong>g performance from an <strong>in</strong>crease <strong>in</strong> mental<br />
workload can be countered by <strong>in</strong>vest<strong>in</strong>g more task-related effort, distraction always leads to<br />
worse performance. And f<strong>in</strong>ally, drivers can <strong>in</strong>fluence their level of distraction through<br />
motivation and task engagement; <strong>in</strong> other words, through task prioritization. But although<br />
us<strong>in</strong>g an <strong>in</strong>crease <strong>in</strong> one of these concepts as a <strong>in</strong>dication of the other is <strong>in</strong>correct, the<br />
read<strong>in</strong>ess to respond that is affected by latent driver distraction can actually also be measured<br />
by one of the tools used for mental workload assessment. It is therefore proposed to use this<br />
mental workload assessment tool, the Peripheral Detection Task, to assess latent distraction.<br />
7.3.2 The hierarchical model of the driv<strong>in</strong>g task<br />
The results from the current study relate to the hierarchical model of the driv<strong>in</strong>g task (Michon,<br />
1971, 1985) as follows. There <strong>in</strong>deed appears to be a directional change <strong>in</strong> driv<strong>in</strong>g task level<br />
<strong>in</strong>teraction as a result of compensation for unexpected and safety-critical situations, although<br />
is has not been established what exactly are the constitut<strong>in</strong>g factors for these unexpected<br />
situations. This directional change <strong>in</strong> task level <strong>in</strong>teraction requires conscious attention from<br />
the driver, and if this attention is not fully available, for <strong>in</strong>stance as result of demand<strong>in</strong>g<br />
secondary tasks, the result<strong>in</strong>g change occurs only <strong>in</strong> more critical situations and lasts shorter.<br />
The behavioural change result<strong>in</strong>g from the directional change is temporary. Drivers change<br />
back to their normal driv<strong>in</strong>g behaviour after some time, and this duration is dependent on the<br />
level of mental workload that drivers have.<br />
It was found that <strong>in</strong> challeng<strong>in</strong>g, high mental workload situations <strong>in</strong> which their driv<strong>in</strong>g is not<br />
restricted by <strong>in</strong>structions, viz. <strong>in</strong> real-world tactical driv<strong>in</strong>g situations, drivers do not<br />
necessarily <strong>in</strong>crease their safety marg<strong>in</strong>s; they may even decrease them. This is contrary to<br />
what one would expect from compensation behaviour. It seems that longitud<strong>in</strong>al tasks are<br />
easier <strong>in</strong>fluenced by compensatory actions than are lateral tasks. Another f<strong>in</strong>d<strong>in</strong>g is that the<br />
behavioural change result<strong>in</strong>g from compensatory actions can become visible at the specific<br />
location on the road around which the unexpected situation orig<strong>in</strong>ally occurred, rather than<br />
over the complete stretch of road.<br />
However, a few comments can be made about the hierarchical driv<strong>in</strong>g task model, based on<br />
both theoretical considerations and empirical data. It rema<strong>in</strong>s unclear which tasks <strong>in</strong>fluence<br />
which other tasks <strong>in</strong> the nearest upper level. Moreover, <strong>in</strong>terpretations of the classification of<br />
subtasks over the different levels have differed between researchers, and it rema<strong>in</strong>s unclear<br />
what the f<strong>in</strong>al classification of subtasks should be. The fixed number of three task levels can<br />
be disputed, s<strong>in</strong>ce on the one hand certa<strong>in</strong> subtasks <strong>in</strong>cluded <strong>in</strong> the model are not part of<br />
driv<strong>in</strong>g (e.g, when the tra<strong>in</strong> is chosen as the transport mode at the strategic level) and on the<br />
other hand, higher level motivations and skills also play a role <strong>in</strong> the execution of driv<strong>in</strong>g<br />
tasks. And f<strong>in</strong>ally, separat<strong>in</strong>g the subtasks of driv<strong>in</strong>g <strong>in</strong>to strictly divided different tasks at
174 <strong>Driv<strong>in</strong>g</strong> <strong>Behaviour</strong> <strong>in</strong> <strong>Unexpected</strong> <strong>Situations</strong><br />
different levels seems to be an abstract theoretical <strong>in</strong>tervention that does not resemble actual<br />
driv<strong>in</strong>g behaviour and goal management. Chapter 6 elaborates these reflections on the<br />
hierarchical model of the driv<strong>in</strong>g task (Michon, 1971, 1985).<br />
However, the model does also provide <strong>in</strong>sight <strong>in</strong>to the hierarchical order<strong>in</strong>g of different types<br />
of tasks with<strong>in</strong> driv<strong>in</strong>g. This hierarchy is an important aspect of goal-driven plann<strong>in</strong>g and<br />
execution of complex tasks, and resembles the way <strong>in</strong> which human cognition is modelled <strong>in</strong><br />
a number of architectures (e.g., SOAR, see Lehman, Laird & Rosenbloom, 2006, and ACT-R,<br />
Anderson, 1995). Furthermore, different subtasks which bear resemblance <strong>in</strong> terms of their<br />
role with<strong>in</strong> the overall driv<strong>in</strong>g task and the time frame <strong>in</strong>volved <strong>in</strong> their execution are<br />
(theoretically) clustered with<strong>in</strong> the different task levels. This cluster<strong>in</strong>g is useful for<br />
understand<strong>in</strong>g the different types of tasks <strong>in</strong>volved. Furthermore, the model does give <strong>in</strong>sight,<br />
however limited, <strong>in</strong>to the stages and durations related to certa<strong>in</strong> driv<strong>in</strong>g subtasks and choices,<br />
<strong>in</strong>to the fact that actions and external aspects <strong>in</strong>fluence each other, and (partly) <strong>in</strong>to the role of<br />
expectations, unexpected situations, and compensatory actions.<br />
We therefore conclude that the hierarchical model of the driv<strong>in</strong>g task (Michon, 1971, 1985)<br />
has a number of theoretical and practical shortcom<strong>in</strong>gs, although it is <strong>in</strong>deed a valuable model<br />
for the purpose of describ<strong>in</strong>g the complexities and the different types of subtasks that<br />
constitute the driv<strong>in</strong>g task. Its setup with <strong>in</strong>teract<strong>in</strong>g task levels and the notion that driv<strong>in</strong>g<br />
subtasks are hierarchically ordered are also valuable for understand<strong>in</strong>g the hierarchical ways<br />
<strong>in</strong> which (driv<strong>in</strong>g) plans are created and executed with the help of feedback loops. However,<br />
<strong>in</strong> its current form, it is <strong>in</strong>complete as a framework for a comprehensive model of the driv<strong>in</strong>g<br />
task.<br />
7.4 Human-centred design of ADA Systems<br />
When design<strong>in</strong>g Advanced Driver Assistance (ADA) Systems, it is of the utmost importance<br />
to <strong>in</strong>corporate normal driv<strong>in</strong>g behaviour <strong>in</strong>to the development process. This normal driv<strong>in</strong>g<br />
behaviour does not only cover driv<strong>in</strong>g behaviour <strong>in</strong> predictable circumstances <strong>in</strong> which<br />
drivers can have their complete focus on the driv<strong>in</strong>g task. It also concerns behaviour <strong>in</strong><br />
unexpected situations, compensation effects, temporary or long-last<strong>in</strong>g changes <strong>in</strong> driv<strong>in</strong>g<br />
behaviour result<strong>in</strong>g from situational circumstances, and the <strong>in</strong>teraction between multiple<br />
tasks.<br />
A way to accomplish human-centred design is to ensure transparency of the system’s actions,<br />
dynamically adjust<strong>in</strong>g to <strong>in</strong>dividual needs, and <strong>in</strong>telligibility of the operator’s role.<br />
Transparency means that the system’s responses to specific situations should be<br />
‘understandable’ for drivers; mimick<strong>in</strong>g drivers’ reactions or expla<strong>in</strong><strong>in</strong>g before act<strong>in</strong>g could<br />
support this goal. By adaptively react<strong>in</strong>g to the drivers’ current state, ADA Systems can give<br />
the best appropriate response. Mimick<strong>in</strong>g the driver’s safety response <strong>in</strong> normal<br />
circumstances (<strong>in</strong>creas<strong>in</strong>g the response duration until some time after the actual event) is a<br />
way of respond<strong>in</strong>g to critical situations <strong>in</strong> a more human-like manner, and this might possibly<br />
lead to higher acceptance rates. Furthermore, drivers need to be made aware of the relative<br />
priority for handl<strong>in</strong>g and comply<strong>in</strong>g with the ADA System as compared to focus<strong>in</strong>g on their<br />
normal driv<strong>in</strong>g tasks. And f<strong>in</strong>ally, a ‘tipp<strong>in</strong>g po<strong>in</strong>t’ exists for the impair<strong>in</strong>g effects of<br />
<strong>in</strong>creased mental workload. Studies <strong>in</strong>to the effects of ADA Systems should therefore not<br />
only focus on possible <strong>in</strong>creases or decreases of mental workload levels <strong>in</strong>volved with us<strong>in</strong>g
Chapter 7 - Conclusions 175<br />
the system; they should also determ<strong>in</strong>e what effects the system has on task prioritization,<br />
distraction, and the overall traffic safety result<strong>in</strong>g from possible changes <strong>in</strong> driv<strong>in</strong>g behaviour.<br />
With these recommendations and our f<strong>in</strong>d<strong>in</strong>gs on driver distraction and mental workload <strong>in</strong><br />
m<strong>in</strong>d, we proposed a promis<strong>in</strong>g direction for the development of safety-enhanc<strong>in</strong>g ADA<br />
Systems. The proposed direction for development could lead to a group of systems which<br />
could be given the generic name Distraction Avoidance Integrated System, DAISy for short.<br />
DAISy has the aim of enhanc<strong>in</strong>g drivers’ safety dur<strong>in</strong>g distracted driv<strong>in</strong>g <strong>in</strong> urban sett<strong>in</strong>gs.<br />
Based on this thesis, five recommendations for this new direction of systems are made.<br />
The first recommendation is to establish a safety zone around the vehicle with its boundaries<br />
set at safe distances, giv<strong>in</strong>g drivers enough time to counter a possible conflict. Secondly,<br />
when another object enters this safety zone, this thesis recommends that systems follow<strong>in</strong>g<br />
the DAISy guidel<strong>in</strong>es stop the <strong>in</strong>put of non-vital systems and warn the driver. Thirdly, it is<br />
recommended to <strong>in</strong>crease the safety boundaries when DAISy determ<strong>in</strong>es that mental<br />
workload is higher than normal, <strong>in</strong> order to accommodate the decreased attention. A fourth<br />
recommendation is to adjust the speed or (lateral) direction of the vehicle if the driver does<br />
not respond <strong>in</strong> a timely and appropriate manner, <strong>in</strong> order to avoid a conflict. F<strong>in</strong>ally,<br />
Distraction Avoidance Integrated Systems could scan for mov<strong>in</strong>g objects <strong>in</strong> the part of<br />
drivers’ visual field that overlap with the safety boundaries around the vehicle, such as<br />
pedestrians and bicyclists, when the workload estimator establishes elevated mental workload,<br />
which is often related to dim<strong>in</strong>ished attention for the peripheral visual field.<br />
With the guidel<strong>in</strong>es <strong>in</strong> this thesis taken <strong>in</strong>to account, this new direction for development could<br />
adaptively lead to a group op generic systems which assist the driver <strong>in</strong> one of the most<br />
demand<strong>in</strong>g driv<strong>in</strong>g situations: distracted driv<strong>in</strong>g <strong>in</strong> an urban sett<strong>in</strong>g.<br />
7.5 Recommendations for further research<br />
One of the aims of this thesis was to determ<strong>in</strong>e to what extent the hierarchical driv<strong>in</strong>g task<br />
model as proposed by Michon (1971, 1985) is suitable as a framework for a model describ<strong>in</strong>g<br />
and/ or predict<strong>in</strong>g how drivers actually drive. Some f<strong>in</strong>d<strong>in</strong>gs support the postulation that<br />
compensation behaviour <strong>in</strong>fluences the directional <strong>in</strong>fluence driv<strong>in</strong>g task levels have, and that<br />
this change is temporary. However, there are some theoretical considerations that need<br />
clarification before the model can actually serve as such a framework. Firstly, it has not been<br />
fully determ<strong>in</strong>ed whether separat<strong>in</strong>g the subtasks of driv<strong>in</strong>g <strong>in</strong>to strictly divided tasks at<br />
different levels is an abstract theoretical <strong>in</strong>tervention or a resemblance of actual driv<strong>in</strong>g<br />
behaviour. Secondly, if such a dist<strong>in</strong>ction would be viable, it rema<strong>in</strong>s unclear how related<br />
subtasks are connected between task levels and how they <strong>in</strong>fluence each other. It has also not<br />
been determ<strong>in</strong>ed how other types of unexpected situations and their related compensation<br />
behaviour <strong>in</strong>duce behavioural adaptation. Thirdly, <strong>in</strong>terpretations of the classification of<br />
subtasks over the different levels have differed between researchers, and it rema<strong>in</strong>s unclear<br />
what the f<strong>in</strong>al classification of subtasks should be. And f<strong>in</strong>ally, the question whether and to<br />
what extent higher-order skills and attitudes, such as ‘Goals for life and skills for liv<strong>in</strong>g’<br />
(Hatakka et al., 2002), are a factor <strong>in</strong> the hierarchical task model, needs further consideration.<br />
The human-centred design process of ADA Systems could benefit from more research on a<br />
number of issues raised <strong>in</strong> this thesis. Firstly, drivers appear to prioritize safe driv<strong>in</strong>g over
176 <strong>Driv<strong>in</strong>g</strong> <strong>Behaviour</strong> <strong>in</strong> <strong>Unexpected</strong> <strong>Situations</strong><br />
distract<strong>in</strong>g tasks when the comb<strong>in</strong>ed task demands exceed a certa<strong>in</strong> threshold. More research<br />
is needed to determ<strong>in</strong>e whether there exists one threshold that is fixed over drivers and/ or<br />
over time, or whether this is an <strong>in</strong>dividual and fluctuat<strong>in</strong>g threshold. Furthermore, the aspects<br />
determ<strong>in</strong><strong>in</strong>g such a threshold require further <strong>in</strong>vestigation. Secondly, we postulate that<br />
mimick<strong>in</strong>g the drivers’ longer-term safety response might lead to higher acceptance rates of<br />
<strong>in</strong>-vehicle support systems. However, this topic needs further <strong>in</strong>vestigation <strong>in</strong> order to<br />
establish the preferred tim<strong>in</strong>g and level of support given to drivers outside of direct conflict<br />
areas, and the optimal ratio between mental workload aris<strong>in</strong>g from warn<strong>in</strong>gs and acceptance<br />
result<strong>in</strong>g from ‘understandable’ reactions. Related to this is the question what exactly<br />
determ<strong>in</strong>es whether or not drivers f<strong>in</strong>d an unexpected or safety-critical situation risky, or are<br />
startled by them. Our study has shown that this can partly depend on circumstances of mental<br />
workload, but possibly also on external circumstances such as the number of previous risky<br />
encounters. Clear <strong>in</strong>sight <strong>in</strong>to drivers’ perceptions of risk and the factors constitut<strong>in</strong>g this<br />
perception would help both human factors research and the human-centred design of ADA<br />
Systems. And f<strong>in</strong>ally, an <strong>in</strong>tegrated design with a focus on mental workload estimation and<br />
distraction avoidance determ<strong>in</strong>es which stimuli drivers receive at which po<strong>in</strong>t <strong>in</strong> time. This<br />
means that control is taken away from the driver to a certa<strong>in</strong> level. Will this have an <strong>in</strong>fluence<br />
on drivers’ acceptance levels of such a system, or do drivers prefer to rema<strong>in</strong> <strong>in</strong> control of<br />
their own actions and tim<strong>in</strong>g of those actions? Further research should attempt to answer this<br />
question.<br />
This study showed that behavioural adaptation to risky situations is <strong>in</strong>fluenced by the level of<br />
mental workload and by the extent to which drivers are actively engaged <strong>in</strong> driv<strong>in</strong>g. However,<br />
researchers still have not come to consensus on the ways <strong>in</strong> which this <strong>in</strong>fluence takes place<br />
and the underly<strong>in</strong>g reasons for the behavioural adaptation. We recommend do<strong>in</strong>g further<br />
research <strong>in</strong>to the ways <strong>in</strong> which behavioural adaptation to risky situations (<strong>in</strong>clud<strong>in</strong>g the<br />
underly<strong>in</strong>g reasons for this adaptation) is <strong>in</strong>fluenced by mental workload and task<br />
engagement.<br />
F<strong>in</strong>ally, driver distraction, mental workload, and the related concepts of task prioritization,<br />
automaticity, motivation and effort are important aspects of driv<strong>in</strong>g and ‘hot topics’ <strong>in</strong> human<br />
factors research. Our f<strong>in</strong>d<strong>in</strong>gs suggests that drivers might adopt different strategies for<br />
reliev<strong>in</strong>g extremely high levels of mental workload, for <strong>in</strong>stance by driv<strong>in</strong>g <strong>in</strong> a habitualized<br />
or automatized manner. It is however not clear whether people actively decide to adopt a<br />
strategy for workload relieve, or that this is a reflexive, automatized response to high mental<br />
workload. More <strong>in</strong>sight <strong>in</strong>to the relationship between the different concepts could support<br />
human factors research <strong>in</strong> develop<strong>in</strong>g countermeasures and mitigat<strong>in</strong>g the negative and large<br />
impacts of driver distraction and driver overload on traffic safety.
References<br />
Åberg, L. & Rimmö, P.-A. (1998). Dimensions of aberrant driver behaviour. Ergonomics, 41,<br />
39–56.<br />
Adell, E., Várhelyi, A. & Fontana, M. dalla (2011). The effects of a driver assistance system<br />
for safe speed and safe distance – A real-life field study. Transportation Research Part C, 19,<br />
145-155.<br />
Alm, H. & Nilsson, L. (1994). Changes <strong>in</strong> driv<strong>in</strong>g behaviour as a function of handsfree<br />
mobile phones – a simulator study. Accident Analysis and Prevention, 26, 441-451.<br />
Anderson, J.R. (1995). Cognitive psychology and its implications. 4 th ed. New York: W.H.<br />
Freeman and Co.<br />
Anttila, V. & Luoma, J. (2005). Surrogate <strong>in</strong>-vehicle <strong>in</strong>formation systems and driver<br />
behaviour <strong>in</strong> an urban environment: A field study on the effects of visual and cognitive load.<br />
Transportation Research Part F, 8, 121-133.<br />
Anund, A. & Kircher, K. (2009). Advantages and disadvantages of different methods to<br />
evaluate sleep<strong>in</strong>ess warn<strong>in</strong>g systems. VTI Report 664A, VTI, L<strong>in</strong>köp<strong>in</strong>g, Sweden.<br />
Ajzen, I. (1985). From <strong>in</strong>tentions to actions: A theory of planned behavior. In J. Kuhi & J.<br />
Beckmann (Eds.), Action-control: From cognition to behaviour (pp. 11-39). Heidelberg:<br />
Spr<strong>in</strong>ger.<br />
Baldauf, D., Burgard, E. & Wittmann, M. (2009). Time perception as a workload measure <strong>in</strong><br />
simulated car driv<strong>in</strong>g. Applied Ergonomics, 40, 929-935.<br />
Bartenwerfer, H. (1969). E<strong>in</strong>ige praktische Konsequenzen aus der Aktivierungstheorie.<br />
Zeitschrift für Experimentelle und Angewandte Psychologie, 16, 195-222.<br />
Bartlett, F.C. (1962). The future of ergonomics. Ergonomics, 5, 505-511.<br />
Bekiaris, E. Amditis, A & Panou, M. (2003). DRIVABILITY: A new concept for modell<strong>in</strong>g<br />
driv<strong>in</strong>g performance. Cognition, Technology & Work, 5, 152-161.<br />
Bellet, T. & Tattegra<strong>in</strong>-Veste, H. (1999). A framework for represent<strong>in</strong>g driv<strong>in</strong>g knowledge.<br />
International Journal of Cognitive Ergonomics, 3, 37–49.<br />
Bishop, R. (2005). Intelligent vehicle technology and trends. Norwood, Massachusetts: Artec<br />
House Publishers.<br />
Blaauw, G.J. (1982). <strong>Driv<strong>in</strong>g</strong> experience and task demands <strong>in</strong> simulator and <strong>in</strong>strumented car:<br />
A validation study. Human Factors, 24, 473–486.<br />
Blockey, P.N. & Hartley, L.R. (1995). Aberrant driv<strong>in</strong>g behaviour: Errors and violations.<br />
Ergonomics, 38, 1759–1771.<br />
Boudreau, D. (2009). Driven to distraction. Interview with Robert Gray. Retrieved November<br />
6, 2010, from http://researchstories.asu.edu/stories/driven-distraction-1300<br />
177
178 <strong>Driv<strong>in</strong>g</strong> <strong>in</strong> <strong>Unexpected</strong> <strong>Situations</strong><br />
Brewer, M. (2000). Research design and issues of validity. In H. Reis. & C. Judd (Eds.)<br />
Handbook of research methods <strong>in</strong> social and personality psychology (pp. 3-16). Cambridge:<br />
Cambridge University Press.<br />
Brookhuis, K.A. (2008). From ergonauts to <strong>in</strong>fonauts: 50 years of ergonomics research.<br />
Ergonomics, 51, 55-58.<br />
Brookhuis, K.A. & De Waard, D. (2005). ADAS’ acceptance and effects on behaviour: the<br />
consequences of automation. In G. Underwood (Ed.), Traffic and Transport Psychology.<br />
Theory and Application (pp.273-278). Amsterdam: Elsevier.<br />
Brookhuis, K.A., De Vries, G. & De Waard, D. (1991). The effects of mobile telephon<strong>in</strong>g on<br />
driv<strong>in</strong>g performance. Accident Analysis and Prevention, 23, 309-316.<br />
Brookhuis, K., De Waard, D. & Mulder, B. (1994). Measur<strong>in</strong>g driv<strong>in</strong>g performance by carfollow<strong>in</strong>g<br />
<strong>in</strong> traffic. Ergonomics, 37, 427-434.<br />
Centraal Bureau voor de Statistiek (2010). Motorvoertuigen; personenauto's per periode naar<br />
technische kenmerken. CBS Statl<strong>in</strong>e. Retrieved November 4, 2010, from<br />
http://statl<strong>in</strong>e.cbs.nl/statweb.<br />
Charlton, S.G. (2004). Perceptual and attentional effects on drivers’ speed selection at curves.<br />
Accident Analysis and Prevention, 36, 877-884.<br />
Chauv<strong>in</strong>, C. & Saad, F. (2000). Interaction and communication <strong>in</strong> dynamic control tasks: ship<br />
handl<strong>in</strong>g and car driv<strong>in</strong>g. In T. Rothengatter & R.D. Huguen<strong>in</strong> (Eds.), Traffic and Transport<br />
psychology (pp. 101-112). Amsterdam: Elsevier.<br />
Cnossen, F., Meijman, T. & Rothengatter, T. (2004). Adaptive strategy changes as a function<br />
of task demands: A study of car drivers. Ergonomics 47, 218-236.<br />
Cody, D., & Gordon, T. (2007). TRB Workshop on Driver models: a step towards a<br />
comprehensive model of driv<strong>in</strong>g? In P.C. Cacciabue (Ed.), Modell<strong>in</strong>g driver behaviour <strong>in</strong><br />
automotive environments: Critical issues <strong>in</strong> driver <strong>in</strong>teractions with <strong>in</strong>telligent transport<br />
systems (pp. 26-42). New York: Spr<strong>in</strong>ger-Verlag.<br />
Cohen, J. (1988). Statistical power analysis for the behavioral sciences (2nd ed). New York:<br />
Academic Press.<br />
Cohen, J. (1992). A power primer. Psychological Bullet<strong>in</strong> 112, 155-159.<br />
Comte, S.L. (2000). New systems: new behaviour? Transportation Research Part F, 3, 95-<br />
111.<br />
Cottrell, N.D. & Barton, B.K. (2011). The role of automation <strong>in</strong> reduc<strong>in</strong>g stress and negative<br />
affect while driv<strong>in</strong>g. Theoretical Issues <strong>in</strong> Ergonomics Science. First published on: 24 May<br />
2011 (iFirst).<br />
Daimler AG. (2010). Daimler Safety Technologies. Retrieved May 22, 2010, from<br />
http://www.daimler.com/technology-and-<strong>in</strong>novation/safety-technologies<br />
De Waard, D. (1996). The measurement of drivers’ mental workload. Ph.D. thesis, University<br />
of Gron<strong>in</strong>gen. Haren, The Netherlands: University of Gron<strong>in</strong>gen, Traffic Research Centre.<br />
De Waard, D., Brookhuis, K.A., Fabriek, E. & Wolffelaar, P.C. van (2004). <strong>Driv<strong>in</strong>g</strong> the<br />
Phileas, a new automated public transport vehicle. In: Proceed<strong>in</strong>gs of the ICTTP2004.
References 179<br />
De Waard, D., Hulst, M. van der, Hoedemaeker, M. & Brookhuis, K. (1999). Driver<br />
behaviour <strong>in</strong> an emergency situation <strong>in</strong> the automated highway system. Transportation<br />
Human Factors, 1, 67-82.<br />
Delbridge, K.A. (2000). Individual differences <strong>in</strong> multi-task<strong>in</strong>g ability: Explor<strong>in</strong>g a<br />
nomological network. Ph. D. thesis, Michigan State University.<br />
D<strong>in</strong>gus, T.A., Hulse, M.C., Mollenhauer, M.A., Fleischmann, R.N., McGehee, D.V. &<br />
Manakkal. N. (1997). Effects of age, system experience, and navigation technique on driv<strong>in</strong>g<br />
with an advanced traveler <strong>in</strong>formation system. Human Factors, 39, 177–199.<br />
Dragut<strong>in</strong>ovic, N., Brookhuis, K.A., Hagenzieker, M.P. & Marchau, A.W.J. (2005).<br />
<strong>Behaviour</strong>al effects of Advanced Cruise Control – a meta-analytic approach. European<br />
Journal of Transport and Infrastructure Research, 5, 267-280.<br />
Dragut<strong>in</strong>ovic, N. & Twisk, D. (2005). Use of mobile phones while driv<strong>in</strong>g – effects on road<br />
safety. A literature review. Dutch Institute for Road Safety Research SWOV, Report no. R-<br />
2005-12, Leidschendam, the Netherlands.<br />
Driel, C.J.G. van, Hoedemaeker, M. & Arem, B. van (2007). Impacts of a Congestion<br />
Assistant on driv<strong>in</strong>g behaviour and acceptance us<strong>in</strong>g a driv<strong>in</strong>g simulator. Transportation<br />
Research Part F, 10, 139–152.<br />
Driel, C.J.G. van (2007). Driver Support <strong>in</strong> Congestion. An assessment of user needs and<br />
impacts on driver and traffic flow. Ph.D. thesis, University of <strong>Twente</strong>, Enschede, the<br />
Netherlands.<br />
Duivenvoorden, C.W.A.E. (2007). Roadside versus <strong>in</strong>-car speed support for a green wave: A<br />
driv<strong>in</strong>g simulator study. M.Sc. Thesis, University of <strong>Twente</strong>, Enschede, the Netherlands.<br />
Duncan, J., Williams, P. & Brown, I. (1991). Components of driv<strong>in</strong>g skill: experiences does<br />
not mean expertise. Ergonomics, 34, 919–937.<br />
Eby, D.W. & Vivoda, J.M. (2003). Driver hand-held mobile phone use and safety belt use.<br />
Accident Analysis and Prevention, 35, 893-895.<br />
Eggemeier, F.T. & Wilson, G.F. (1991). Performance-based and subjective assessment of<br />
workload <strong>in</strong> multi-task environments. In D.L. Damos (Ed.), Multiple-task performance (pp.<br />
217- 278). London: Taylor & Francis.<br />
Endsley, M.R. (1995). Toward a theory of situation awareness <strong>in</strong> dynamic systems. Human<br />
Factors, 37, 32-64.<br />
euroFOT (2010). The project. 8 functionalities, 28 partners, 1000 vehicles… One field test!<br />
Retrieved May 19, 2010, from http://www.eurofot-ip.eu/en/the_project.<br />
Evans, L. (1991). Traffic safety and the driver. New York: Van Nostrand Re<strong>in</strong>hold.<br />
Fleishman, E.A. (1967). Performance assessment based on an empirically derived task<br />
taxonomy. Human Factors, 9, 349-366.<br />
Fleishman, E.A. (1975). Toward a taxonomy of human performance. American Psychologist,<br />
30, 1127-1149.<br />
French, D.J., West, R.J., Elander, J. & Wild<strong>in</strong>g, J.M. (1993). Decision-mak<strong>in</strong>g style, driv<strong>in</strong>g<br />
style, and self-reported <strong>in</strong>volvement <strong>in</strong> road traffic accidents. Ergonomics, 36, 627-644.
180 <strong>Driv<strong>in</strong>g</strong> <strong>in</strong> <strong>Unexpected</strong> <strong>Situations</strong><br />
Fuller, R. (1984). A conceptualization of driv<strong>in</strong>g behaviour as threat avoidance. Ergonomics,<br />
27, 1139-1155.<br />
Fuller, R. (2000). The task-capability <strong>in</strong>terface model of the driv<strong>in</strong>g process. Recherche<br />
Transports Sécurité, 66, 47-59.<br />
Fuller, R. (2005). Towards a general theory of driver behaviour. Accident Analysis and<br />
Prevention, 37, 461-472.<br />
Fuller, R., McHugh, C. & Pender, S. (2008). Task difficulty and risk <strong>in</strong> the determ<strong>in</strong>ation of<br />
driver behaviour. Revue Européenne de Psychologie Appliquée, 58, 13-21.<br />
Ganey, H.C.N., Koltko-Rivera, M.E., Murphy, L.M., Hancock, P.A. & Dalton, J. (2004).<br />
Affect as an aspect of workload: Why and how to address affect <strong>in</strong> automation and simulation<br />
studies. Paper presented at the 2 nd Human Performance Situation Awareness and Automation<br />
Conference. Daytona Beach, Florida, USA.<br />
Godthelp, H., Milgram, P. & Blaauw, G.J. (1984). The development of a time related measure<br />
to describe driv<strong>in</strong>g strategy. Human Factors, 26, 257–268.<br />
Gold<strong>in</strong>g, J.F. (2006). Motion sickness susceptibility. Autonomic Neuroscience: Basic and<br />
Cl<strong>in</strong>ical, 129, 67-76.<br />
Gollwitzer, P.M., & Moskowitz, G.B. (1996). Goal effects on action and cognition. In E.T.<br />
Higg<strong>in</strong>s & A.W. Kruglanski (Eds.), Social psychology: Handbook of basic pr<strong>in</strong>ciples (pp.<br />
361–399). New York: Guilford.<br />
Goszczynska, M. & Roslan, A. (1989). Self-evaluation of drivers’ skill: A cross-cultural<br />
comparison. Accident Analysis and Prevention, 21, 217-224.<br />
Green, P., L<strong>in</strong>, B. & Bagian, T. (1994). Driver workload as a function of road geometry: A<br />
pilot experiment. Technical Report GLCTTR 22-9 1/01, University of Michigan<br />
Transportation Research Institute, Ann Harbor, Michigan, USA.<br />
Groeger, J.A. (2000). Understand<strong>in</strong>g driv<strong>in</strong>g: apply<strong>in</strong>g cognitive psychology to a complex<br />
everyday task. Hove: Psychology Press.<br />
Gronwall, D. (1977). Paced auditory serial addition task: A measure of recovery from<br />
concussion. Perceptual and Motor Skills, 44, 367–373.<br />
Hale, A.R., Stoop, J. & Hommels, J. (1990). Human error models as predictors of accident<br />
scenarios for designers <strong>in</strong> collision <strong>in</strong>cipient conditions. Ergonomics, 33, 1377-1387.<br />
Hancock, P.A. (1989). The effect of performance failure and task demand on the perception<br />
of mental workload. Applied Ergonomics, 20, 197-205.<br />
Hancock, P.A. & Caird, J.K. (1993). Experimental evaluation of a model of mental workload.<br />
Human Factors, 35, 413-429.<br />
Hancock, P.A., Lesch, M.F. & Simmons, L. (2003). The distraction effects of phone use<br />
dur<strong>in</strong>g a crucial driv<strong>in</strong>g maneuver. Accident Analysis and Prevention, 35, 501-514.<br />
Hancock, P.A., Mouloua, M. & Senders, J. (2008). On the philosophical foundations of<br />
driv<strong>in</strong>g distraction and the distracted driver. In M.A. Regan, J.D. Lee & K.L. Young (Eds.),<br />
Driver Distraction: Theory, Effects and Mitigation (pp. 11-30). Boca Raton, FL: CRC Press.
References 181<br />
Hancock, P.A., Williams, G., Mann<strong>in</strong>g, C.M. & Miyake, S. (1995). Influence of task demand<br />
characteristics on workload and performance. The International Journal of Aviation<br />
Psychology, 5, 63-86.<br />
Harris, W.C. Hancock, P.A., Arthur, E.J. & Caird, J.K. (2002). Performance, workload, and<br />
fatigue changes associated with automation. The International Journal of Aviation<br />
Psychology, 5, 169-185.<br />
Hart, S.G. (1978). Time estimation as a secondary task to measure workload: summary of<br />
research. In Proceed<strong>in</strong>gs of the 14th Annual Conference on Manual Control (NASA CD-2060)<br />
(pp. 82–90). NASA, Wash<strong>in</strong>gton, DC.<br />
Hart, S.G. & Staveland, L.E. (1988). Development of NASA-TLX (Task Load Index):<br />
Results of empirical and theoretical research. In P.A. Hancock & N. Meshkati (Eds.), Human<br />
Mental Workload (pp. 239-250). Amsterdam: North Holland Press.<br />
Hatakka, M, Kesk<strong>in</strong>en, E., Gregersen, N.P., Glad, A. & Hernetkoski, K. (2002). From control<br />
of the vehicle to personal self-control; broaden<strong>in</strong>g the perspectives to driver education.<br />
Transportation Research Part F, 5, 201-215.<br />
Hayward, J.C. (1971). Near misses as a measure of safety at urban <strong>in</strong>tersections. Ph.D. thesis,<br />
Dept. of Civil Eng<strong>in</strong>eer<strong>in</strong>g, The Pennsylvania State University, Pennsylvania.<br />
Hicks, T.G. & Wierwille, W.W. (1979). Comparison of five mental workload assessment<br />
procedures <strong>in</strong> a mov<strong>in</strong>g-base simulator. Human Factors, 21, 129-143.<br />
Hoedemaeker, M., Hogema, J. & Pauwelussen, J. (2009). Distraction and workload. <strong>Driv<strong>in</strong>g</strong><br />
on the A10 r<strong>in</strong>groad around Amsterdam. Paper presented at the First International Conference<br />
on Driver Distraction and Inattention (28–29 September), Göteborg, Sweden. Retrieved on<br />
May 10, 2011 from http://document.chalmers.se/workspaces/chalmers/safer/safersem<strong>in</strong>ars/2009-09-28-29-driver.<br />
Hoedemaeker, M., Janssen, W.H., & Brouwer, R.F.T. (2002). Evaluatie versmalde<br />
dwarsprofielen op het hoofdwegennet. Deelrapport 3: De relatie tussen de <strong>in</strong>richt<strong>in</strong>gsvorm en<br />
het rijgedrag. Report TM-02-C021, TNO Human Factors Research Institute, Soesterberg, The<br />
Netherlands.<br />
Hole, G. (2007). The psychology of driv<strong>in</strong>g. London: Lawrence Erlbaum Associates.<br />
Hollnagel, E. & Woods, D.D. (2005). Jo<strong>in</strong>t Cognitive Systems. Foundation of Cognitive<br />
System Eng<strong>in</strong>eer<strong>in</strong>g. New York: CRC Press, Taylor and Francis Group.<br />
Horrey, W.J. & Lesch, M.F. (2009). Driver-<strong>in</strong>itiated distractions: Exam<strong>in</strong><strong>in</strong>g strategic<br />
adaptation for <strong>in</strong>-vehicle task <strong>in</strong>itiation. Accident Analysis and Prevention, 41, 115-122.<br />
Horrey, W.J., Lesch, M.F. & Garabet, A. (2008). Assess<strong>in</strong>g the awareness of performance<br />
decrements <strong>in</strong> distracted drivers. Accident Analysis and Prevention, 40, 675-682.<br />
Horrey, W.J. & Simmons, D.J. (2007). Exam<strong>in</strong><strong>in</strong>g cognitive <strong>in</strong>terference and adaptive safety<br />
behaviour <strong>in</strong> tactical vehicle control. Ergonomics, 50, 1340-1350.<br />
Horrey, W.J. & Wickens, C.D. (2006). Exam<strong>in</strong><strong>in</strong>g the impact of cell phone conversations on<br />
driv<strong>in</strong>g us<strong>in</strong>g meta-analytic techniques. Human Factors, 48, 196-205.<br />
Horst, A.R.A. van der (1977). Informatieverschaff<strong>in</strong>g op kruispunten. Soesterberg: TNO<br />
Institute for Perception (unpublished).
182 <strong>Driv<strong>in</strong>g</strong> <strong>in</strong> <strong>Unexpected</strong> <strong>Situations</strong><br />
Horst, A.R.A. van der (1990). A time-based analysis of road user behaviour <strong>in</strong> normal and<br />
critical encounters. Ph.D. thesis, TU Delft, Delft, the Netherlands.<br />
Horst, A.R.A. van der (1998). Factors <strong>in</strong>fluenc<strong>in</strong>g drivers’ speed behaviour and adaptation.<br />
Report TM-98-006. Soesterberg: TNO Human Factors Research Institute.<br />
Horst, A.R.A. van der (2007). Time-related measures for modell<strong>in</strong>g risk <strong>in</strong> driver behaviour.<br />
In C. Cacciabue & Ch. Re (Eds.), Critical Issues In Advanced Automotive Systems and<br />
Human-Centered Design. Spr<strong>in</strong>ger UK., 235-252.<br />
Horst, A.R.A. van der & Martens, M.H. (2010). The Peripheral Detection Task (PDT): Onl<strong>in</strong>e<br />
measurement of driver cognitive workload and selective attention. In G.L. Rupp (Ed.),<br />
Performance metrics for assess<strong>in</strong>g driver distraction: The quest for improved road safety (pp.<br />
73-88). SAE International.<br />
Hulst, M. van der (1999). Adaptive control of safety marg<strong>in</strong>s <strong>in</strong> driv<strong>in</strong>g. Ph. D. thesis,<br />
Rijksuniversiteit Gron<strong>in</strong>gen, Gron<strong>in</strong>gen, the Netherlands.<br />
Huynh, H. & Feldt, L.S. (1976). Estimation of the box correction for degrees of freedom from<br />
sample data <strong>in</strong> randomized block and split-plot designs. Journal of Educational Statistics 1,<br />
69-82.<br />
Hydén, C. (1987). The development of a method for traffic safety evaluation: The Swedish<br />
Traffic Conflicts Technique. Bullet<strong>in</strong> 70. Lund University, Lund.<br />
ISO (2008) ISO TC 22/SC 13 WG 8. Road vehicles – Ergonomic aspects of transport<br />
<strong>in</strong>formation and control systems – Simulated lane change test to assess <strong>in</strong>-vehicle secondary<br />
task demand.<br />
Jackson, L., Chapman, P. & Crundall, D. (2009). What happens next? Predict<strong>in</strong>g other road<br />
user’s behaviour as a function of driv<strong>in</strong>g experience and process<strong>in</strong>g time. Ergonomics, 52,<br />
154-164.<br />
Jahn, G., Oehme, A., Krems, J. & Gelau, C. (2005). Peripheral detection as a workload<br />
measure <strong>in</strong> driv<strong>in</strong>g: effects of traffic complexity and route guidance system use <strong>in</strong> a driv<strong>in</strong>g<br />
study. Transportation Research Part F, 8, 255-275.<br />
Janssen, W.H. (1979). Routeplann<strong>in</strong>g en geleid<strong>in</strong>g: een literatuurstudie. Report IZF 1979 C-<br />
13. Soesterberg, The Netherlands: Institute for Perception TNO.<br />
Janssen, W. (1994). Seat-belt wear<strong>in</strong>g and driv<strong>in</strong>g behavior: An <strong>in</strong>strumented-vehicle study.<br />
Accident Analysis and Prevention, 26, 249-261.<br />
Janssen, W., Wierda, M. & Horst, R. van der (1995). Automation and the future of car<br />
driv<strong>in</strong>g. Safety Science, 19, 237-244.<br />
Katteler, H. (2003). Acceptance of Lane Departure Warn<strong>in</strong>g Assistance (LDWA) Systems:<br />
F<strong>in</strong>al Report. Report No. TM-03-C022. TNO Human Factors, Soesterberg.<br />
Kapte<strong>in</strong>, N.A., Theeuwes, J., & Horst, A.R.A van der (1996). <strong>Driv<strong>in</strong>g</strong> simulator validity:<br />
Some considerations. Transportation Research Record: Journal of the Transportation<br />
Research Board, 1550, 30-36.<br />
Kennedy, R.S., Drexler, J. & Kennedy, R.C. (2010). Research <strong>in</strong> visually <strong>in</strong>duced motion<br />
sickness. Applied Ergonomics, 41, 494-503.<br />
Kennis<strong>in</strong>stituut voor Mobiliteitsbeleid (2011). Mobiliteitsbalans 2011. M<strong>in</strong>isterie van<br />
Infrastructuur en Milieu, Den Haag, the Netherlands.
References 183<br />
Keppel, G. & Wickens, T.D. (2004). Design and analysis: A researcher's handbook (4th ed.).<br />
Upper Saddle River, NJ: Pearson Prentice–Hall.<br />
Kittler, J.E., Menard, W. & Phillips, K.A. (2007). Weight concerns <strong>in</strong> <strong>in</strong>dividuals with body<br />
dysmorphic disorder. Eat<strong>in</strong>g Behaviors, 8, 115–120.<br />
Klauer, S.G., D<strong>in</strong>gus, T.A., Neale, V.L., Sudweeks, J.D. & Ramsey, D.J. (2006). The impact<br />
of driver <strong>in</strong>attention on near-crash/crash risk: an analysis us<strong>in</strong>g the 100-car naturalistic<br />
driv<strong>in</strong>g study data. Technical Report No. DOT HS 810 594. Wash<strong>in</strong>gton, DC: NHTSA.<br />
Kolas<strong>in</strong>ski, E.M. (1995). Simulator sickness <strong>in</strong> virtual environments. Technical Report No.<br />
1027, United States Army Research Institute for the <strong>Behaviour</strong>al and Social Sciences.<br />
Koppa, R.J. (1990). Human Factors. In N.H. Gartner, C.J. Messer & A. Rathi (Eds.), Revised<br />
Monograph on Traffic Flow Theory. Special Report, Transportation Research Board, National<br />
Research Council, Wash<strong>in</strong>gton, D.C.<br />
Kortel<strong>in</strong>g, J. (1994). Effects of ag<strong>in</strong>g, skill modification, and demand alternation on multiple<br />
task performance. Human Factors, 36, 27–43.<br />
Kovordányi, R. (2005). When will advanced driver support systems be user-adaptive? The<br />
case of adaptive cruise control. Proceed<strong>in</strong>gs of AAAI Spr<strong>in</strong>g Symposium Series, Challenges to<br />
Decision Support <strong>in</strong> a Chang<strong>in</strong>g World, California, USA.<br />
Kulmala, R., Leviäkangas, P., Sihvola, N., Rämä, P., Francsics, J., Hardman, E., Ball, S.,<br />
Smith, B., McCrae, I., Barlow, T. & Stevens, A. (2008). CODIA F<strong>in</strong>al study report. CODIA<br />
deliverable 5, European Commission DG-INFSO.<br />
Kullack, A. & Eggert, F. (2010). Straight <strong>in</strong>to curves: ReflektAS <strong>in</strong> different contextual<br />
conditions. In J. Krems, T. Petzoldt & M. Henn<strong>in</strong>g (Eds.), Proceed<strong>in</strong>gs of the Humanist<br />
Conference on Human Centred Design for Intelligent Transport Systems 2010 (pp. 521-527).<br />
Berl<strong>in</strong>, Germany.<br />
Lajunen, T., Corry, A., Summala, H. & Hartley, L. (1998). Cross-cultural differences <strong>in</strong><br />
drivers’ self-assessment of their perceptual-motor and safety skills: Australians and F<strong>in</strong>ns.<br />
Personality and Individual Differences, 24, 539-550.<br />
Lajunen, T., Parker, D. & Summala, H. (1999). Does traffic congestion <strong>in</strong>crease driver<br />
aggression? Transportation Research Part F, 2, 225–236.<br />
Lamble, D., Kauranen, T., Laakso, M. & Summala, H. (1999). Cognitive load and detection<br />
thresholds <strong>in</strong> car follow<strong>in</strong>g situations: Safety implications for us<strong>in</strong>g mobile (cellular)<br />
telephones while driv<strong>in</strong>g. Accident Analysis and Prevention, 31, 617–623.<br />
Lansdown, T.C., Brook-Carter, N. & Kersloot, T. (2004). Distraction from multiple <strong>in</strong>-vehicle<br />
secondary tasks: vehicle performance and mental workload implications. Ergonomics, 47, 91-<br />
104.<br />
Lee, J., Young, K. & Regan, M. (2008). Def<strong>in</strong><strong>in</strong>g driver distraction. In M. Regan, J. Lee & K.<br />
Young (Eds.), Driver Distraction. Theory, Effects, and Mitigation. London: Taylor & Francis.<br />
Lehman, J.F., Laird J. & Rosenbloom, P. (2006). A Gentle Introduction to SOAR, an<br />
Architecture for Human Cognition: 2006 Update. Retrieved November 25, 2011 from<br />
http://ai.eecs.umich.edu/soar/sitemaker/docs/misc/GentleIntroduction-2006.pdf.
184 <strong>Driv<strong>in</strong>g</strong> <strong>in</strong> <strong>Unexpected</strong> <strong>Situations</strong><br />
Lesh, M.F. & Hancock, P.A. (2004). <strong>Driv<strong>in</strong>g</strong> performance dur<strong>in</strong>g concurrent cell phone use:<br />
are drivers aware of their performance decrements? Accident Analysis and Prevention, 36,<br />
471-480.<br />
Lewis-Evans, B., De Waard, D. & Brookhuis, K.A. (2011). Speed ma<strong>in</strong>tenance under<br />
cognitive load - Implications for theories of driver behaviour. Accident Analysis and<br />
Prevention, 43, 1497-1507.<br />
Lewis-Evans, B. & Rothengatter, T. (2009). Task difficulty, risk, effort and comfort <strong>in</strong> a<br />
simulated driv<strong>in</strong>g task - Implications for Risk Allostasis Theory. Accident Analysis and<br />
Prevention, 41, 1053-1063.<br />
L<strong>in</strong>, J.J.W., Abi-Rached, H. & Kahav, M. (2004). Virtual guid<strong>in</strong>g avatar: an effective<br />
procedure to reduce simulator sickness <strong>in</strong> virtual environments. Proceed<strong>in</strong>gs of the CHI 2004<br />
Conference on Human Factors <strong>in</strong> Comput<strong>in</strong>g Systems, Vienna, Austria, 719-726.<br />
L<strong>in</strong>dner, P., Weigel, H., Fardi, B., Henn<strong>in</strong>g, M.J., Kienast, H., Wanielik, G., Krems, J. F. &<br />
Spanner-Ulmer, B. (2009). Räumlich gerichtete Anzeigen im Fahrzeug: Realisierung e<strong>in</strong>er<br />
Mensch-Masch<strong>in</strong>e-Schnittstelle für e<strong>in</strong> Fußgängererkennungssystem. In Tagungsband (CD)<br />
1. Automobiltechnisches Kolloquium. Düsseldorf: VDI Wissensforum.<br />
Liu, Y., Özgüner, Ü. & Ekicim, E. (2005). Performance evaluation of <strong>in</strong>tersection warn<strong>in</strong>g<br />
system us<strong>in</strong>g a vehicle traffic and wireless simulator. Proceed<strong>in</strong>gs of the IEEE Intelligent<br />
Vehicles Symposium, Las Vegas, USA, 171-176.<br />
Ma, R. & Kaber, D.B. (2005). Situation awareness and workload <strong>in</strong> driv<strong>in</strong>g while us<strong>in</strong>g<br />
adaptive cruise control and a cell phone. International Journal of Industrial Ergonomics, 35,<br />
939-953.<br />
Macdonald, W.A. & Hoffmann, E.R. (1980). Review of relationships between Steer<strong>in</strong>g Wheel<br />
Reversal Rate and driv<strong>in</strong>g task demand. Human Factors 22, 733-739.<br />
Matena, S., Louwerse, W., Schermers, G., Vaneerderwegh, P., Pokorny, P., Gaitanidou, L. et<br />
al. (2008). Road design and environment - Best practice on self-expla<strong>in</strong><strong>in</strong>g and forgiv<strong>in</strong>g<br />
roads. Deliverable D3 of the RIPCoRD-ISEREST project. European Commission, Brussels.<br />
Matthews, M.L., Bryant, D.J., Webb, R.D. & Harbluk, J.L. (2001). Model for situation<br />
awareness and driv<strong>in</strong>g. Transportation Research Record, 1779, 26-32.<br />
Mayser, C., Piechulla, W., Weiss, K.-E. & König, W. (2003). Driver workload monitor<strong>in</strong>g. In<br />
H. Strasser, K. Kluth, H. Rausch, & H. Bubb (Eds.), Quality of Work and Products <strong>in</strong><br />
Enterprises of the Future. Proceed<strong>in</strong>gs of the 50th-Anniversary Conference of the GfA and the<br />
XVII Annual ISOES Conference (pp. 41-44). Munich, May 7-9, 2003. Stuttgart: Ergonomia.<br />
McEvoy, S.O., Stevenson, M.R., McCartt, A.T., Woodward, M., Haworth, C., Palamara, P. &<br />
Cercarelli, R. (2005). Role of mobile phones <strong>in</strong> motor vehicle crashes result<strong>in</strong>g <strong>in</strong> hospital<br />
attendance; A case-crossover study. British Medical Journal, 331, 428-433.<br />
McKnight, A.J., & Adams, B.B. (1970). Driver education task analysis. Volume 1: Task<br />
descriptions. Technical Report, Department of Transportation, National Highway Safety<br />
Bureau, November 1970.<br />
McKnight, A.J. & McKnight, A.S. (1993). The effect of cellular phone use upon driver<br />
attention. Accident Analysis and Prevention, 25, 259-265.
References 185<br />
Meshkati, N., Hancock, P.A., Rahim, M. & Dawes, S.M. (1005). Techniques <strong>in</strong> mental<br />
workload assessment. In J. Wilson & E.N. Corlett (Eds.), Evaluation of human work: A<br />
practical ergonomics methodology (2nd ed.), pp. 749-782. London: Taylor and Francis.<br />
Mesken, J., Lajunen, T. & Summala, H. (2002). Interpersonal violations, speed<strong>in</strong>g violations<br />
and their relation to accident <strong>in</strong>volvement <strong>in</strong> F<strong>in</strong>land. Ergonomics, 45, 469–483.<br />
Michon, J.A. (1971). Psychonomie onderweg. Inaugural speech at University of Gron<strong>in</strong>gen.<br />
November 2, 1971.<br />
Michon, J.A. (1985). A critical view of driver behaviour models: What do we know, what<br />
should we do? In L. Evans & R.C. Schw<strong>in</strong>g (Eds.), Human <strong>Behaviour</strong> and Traffic Safety (pp.<br />
485-520). New York: Plenum Press.<br />
Michon, J.A. (1989). Explanatory pitfalls and rule-based driver models. Accident Analysis<br />
and Prevention, 21, 341-353.<br />
Miglez, D.J., Glanz, W.D. & Bauer, K.M. (1985). Relationships between traffic conflicts and<br />
accidents. Report No. FHWA/RD-84/042, US Department of Transportation, Federal<br />
Highway Adm<strong>in</strong>istration, Wash<strong>in</strong>gton, D.C.<br />
Mohebbi, R., Gray, R. & Tan, H.Z. (2009). Driver reaction time to tactile and auditory rearend<br />
collision warn<strong>in</strong>gs while talk<strong>in</strong>g on a cell phone. Human Factors, 51, 102-110.<br />
Molen, H.H. van der & Botticher, A.M.T. (1988). A hierarchical risk model for traffic<br />
participants. Ergonomics, 31, 537-555.<br />
Moors, A. & De Houwer, J. (2006). Automaticity: a theoretical and conceptual analysis.<br />
Psychological Bullet<strong>in</strong>, 132, 297-326.<br />
Näätänen, R & Summala, H. (1976). Road user behaviour and traffic accidents. Amsterdam,<br />
New York: North-Holland/ American Elsevier.<br />
Nachre<strong>in</strong>er, F. (1995). Standards for ergonomics pr<strong>in</strong>ciples relat<strong>in</strong>g to the design of work<br />
systems and to mental workload. Applied Ergonomics, 26, 259-263.<br />
Neale, V., Klauer, S., Knipl<strong>in</strong>g, R., D<strong>in</strong>gus, T., Holbrook, G. & Petersen, A. (2002). The 100<br />
car naturalistic study, phase 1 - Experimental design. Interim Report No. DOT HS 808 536.<br />
Wash<strong>in</strong>gton, DC: NHTSA.<br />
Oborne, D.J. (1976). Examples of the use of rat<strong>in</strong>g-scales <strong>in</strong> ergonomics research. Applied<br />
Ergonomics, 7, 201-204.<br />
OECD Scientific Expert Group (1990). <strong>Behaviour</strong>al adaptation to changes <strong>in</strong> the road<br />
transport system. Paris: OECD.<br />
Parker. D., Reason, J.T., Manstead, A.S.R. & Stradl<strong>in</strong>g, S.G. (1995). <strong>Driv<strong>in</strong>g</strong> errors, driv<strong>in</strong>g<br />
violations and accident <strong>in</strong>volvement. Ergonomics, 38, 1036-1048.<br />
Patten, C.J.D., Kircher, A., Ostlund, J. & Nilsson, L. (2004). Us<strong>in</strong>g mobile telephones:<br />
Cognitive workload and attention resource allocation. Accident Analysis and Prevention, 36,<br />
341-350.<br />
Peters, B. & Nilsson, L. (2007). Modell<strong>in</strong>g the driver <strong>in</strong> control. In Cacciabue, P.C. (Ed.),<br />
Modell<strong>in</strong>g driver behaviour <strong>in</strong> automotive environments: Critical issues <strong>in</strong> driver <strong>in</strong>teractions<br />
with <strong>in</strong>telligent transport systems, (pp. 85-104). New York: Spr<strong>in</strong>ger-Verlag.
186 <strong>Driv<strong>in</strong>g</strong> <strong>in</strong> <strong>Unexpected</strong> <strong>Situations</strong><br />
Philip, P., Taillard, J., Quera-Salva, M.A., Bioulac, B. & Åkerstedt, T. (1999). Simple<br />
reaction time, duration of driv<strong>in</strong>g and sleep deprivation <strong>in</strong> young versus old automobile<br />
drivers. Journal of Sleep Research, 8, 9-14.<br />
Pradhan, A.K., Pollatschek, A., Knodler, M. & Fischer, D.L. (2009). Can younger drivers be<br />
tra<strong>in</strong>ed to scan for <strong>in</strong>formation that will reduce their risk <strong>in</strong> roadway traffic scenarios that are<br />
hard to identify as hazardous? Ergonomics, 52, 657-675.<br />
Ranney, T.A. (1994). Models of driv<strong>in</strong>g behavior: A review of their revolution. Accident<br />
Analysis and Prevention, 26, 733-750.<br />
Ranney, T.A., Harbluk, J.L. & Noy, Y.I. (2005). Effects of voice technology on test track<br />
driv<strong>in</strong>g performance: Implications for driver distraction. Human Factors, 47, 439–454.<br />
Rasmussen, J. (1987). The def<strong>in</strong>ition of human error and a taxonomy for technical system<br />
design. In J. Rasmussen, K. Duncan & J. Leplat (Eds.), New technology and human error.<br />
Chichester, UK: Wiley.<br />
Reason, J.T., Manstead, A.S.R., Stradl<strong>in</strong>g, S., Baxter, J. & Campbell, K. (1990). Errors and<br />
violations on the roads: a real dist<strong>in</strong>ction? Ergonomics, 33, 1315–1332.<br />
Redelmeier, D.A & Tibshirani, R.J. (1997). Association between cellular-telephone calls and<br />
motor vehicle crashes. The New England Journal of Medic<strong>in</strong>e, 336, 453-458.<br />
Redenbo, S.J. & Lee, Y.-C. (2009). Effects of cognitive and perceptual loads on driver<br />
behavior. Transportation Research Record: Journal of the Transportation Research Board,<br />
2138, 20-27.<br />
Rumar, K. (1990). Driver requirements and road traffic <strong>in</strong>formatics. Transportation, 17, 215-<br />
229.<br />
Saad, F. (2006). Some critical issues when study<strong>in</strong>g behavioural adaptations to new driver<br />
support systems. Cognition, Technology & Work, 8, 175-181.<br />
Schaap, T.W., Horst, A.R.A. van der, Arem, B. van & Brookhuis, K.A. (2012). The<br />
relationship between driver distraction and mental workload. In M. Regan, T. Viktor & J. Lee<br />
(Eds.), Driver distraction and <strong>in</strong>attention: Advances <strong>in</strong> research and countermeasures (<strong>in</strong><br />
press).<br />
Sheridan, T.B. (2004). Driver distraction from a control theory perspective. Human Factors,<br />
46, 587-599.<br />
Shiffr<strong>in</strong>, R. & Schneider, W. (1977). Controlled and automatic human <strong>in</strong>formation<br />
process<strong>in</strong>g: II. Perceptual learn<strong>in</strong>g, automatic attend<strong>in</strong>g, and a general theory. Psychological<br />
Review, 84, 127–190.<br />
Stanney, K.M., K<strong>in</strong>gdon, K.S., Nahmens, I. & Kennedy, R.S. (2003). What to expect from<br />
immersive virtual environment exposure: <strong>in</strong>fluences of age, gender, body mass <strong>in</strong>dex, and<br />
past experience. Human Factors, 45, 504–520.<br />
Staubach, M. (2009). Factors correlated with traffic accidents as a basis for evaluat<strong>in</strong>g<br />
Advanced Driver Assistance Systems. Accident Analysis and Prevention, 41, 1025-1033.<br />
Steyvers, F.J.J.M. (1991). Information process<strong>in</strong>g and sleep deprivation - Effects of<br />
knowledge of results and task variables on choice reaction. Ph.D. thesis, Haren: Traffic<br />
Research Centre, University of Gron<strong>in</strong>gen.
References 187<br />
Strayer, D.L., Drews, F.A. & Johnston, W.A. (2003). Cell phone-<strong>in</strong>duced failures of visual<br />
attention dur<strong>in</strong>g simulated driv<strong>in</strong>g. Journal of Experimental Psychology: Applied, 9, 23 - 32.<br />
STSoftware (2010). ST Software Simulator Systems. Retrieved May 17, 2010, from<br />
http://www.stsoftware.nl.<br />
Summala, H. (2002). Behavioral adaptation and driver’s task control. In R. Fuller & J. Santos<br />
(Eds.), Human factors for highway eng<strong>in</strong>eers (pp. 189-200). Oxford: Pergamon Press.<br />
Summala, H. & Näätänen, R. (1988). The zero-risk theory and overtak<strong>in</strong>g decisions. In T.<br />
Rothengatter & R. de Bru<strong>in</strong> (Eds.), Road User Behavior: Theory and Research (pp. 82-92).<br />
Van Gorcum, Assen/Maastricht.<br />
Sticht<strong>in</strong>g Wetenschappelijk Onderzoek Verkeersveiligheid SWOV (2008). Factsheet<br />
Advanced Cruise Control (ACC). SWOV, Leidschendam, the Netherlands. Retrieved May 20,<br />
2010, from http://www.swov.nl/rapport/Factsheets/NL/Factsheet_ACC.pdf.<br />
Sticht<strong>in</strong>g Wetenschappelijk Onderzoek Verkeersveiligheid SWOV (2010). Toelicht<strong>in</strong>g bij<br />
ongevallen. Kennisbank SWOV, Leidschendam, the Netherlands. Retrieved June 5, 2010,<br />
from http://www.swov.nl/nl/research/kennisbank/<strong>in</strong>houd/90_gegevensbronnen/<strong>in</strong>houd/<br />
toelicht<strong>in</strong>g_bij_ongevallen.htm.<br />
Sticht<strong>in</strong>g Wetenschappelijk Onderzoek Verkeersveiligheid SWOV (2011). Letelselongevallen<br />
registratie, tijdreeksen op basis van BRON. Kennisbank SWOV. Leidschendam, the<br />
Netherlands. Retrieved November 8, 2011, from<br />
http://www.swov.nl/NL/Research/Kennisbank/<strong>in</strong>houd/kennisbank.htm.<br />
Theeuwes, J. (1993). Visual attention and driv<strong>in</strong>g behaviour. In Proceed<strong>in</strong>gs of the<br />
International Sem<strong>in</strong>ar on Human Factors <strong>in</strong> Road Traffic (pp. 103-123). Braga, Portugal:<br />
Universidade do M<strong>in</strong>ho.<br />
Theeuwes, J. & Godthelp, H. (1995). Self-expla<strong>in</strong><strong>in</strong>g roads. Safety Science, 19, 217-225.<br />
Tideman, M., Voort, M.C. van der & Arem, B. van (2010). A new scenario based approach<br />
for design<strong>in</strong>g driver support systems applied to the design of a lane change support system.<br />
Transportation Research Part C: Emerg<strong>in</strong>g Technologies, 18, 247-258.<br />
Tombaugh, T.N. (2006). A comprehensive review of the Paced Auditory Serial Addition Test<br />
(PASAT). Archives of Cl<strong>in</strong>ical Neuropsychology, 21, 53–76.<br />
Treat, J.R. (1980). A study of pre-crash factors <strong>in</strong>volved <strong>in</strong> traffic accidents. HSRI Research<br />
Review, 10(11), 1-35.<br />
Trick, L.M., Enns, J.T., Mills, J. & Vavrik, J. (2004). Pay<strong>in</strong>g attention beh<strong>in</strong>d the wheel: a<br />
framework for study<strong>in</strong>g the role of attention <strong>in</strong> driv<strong>in</strong>g. Theoretical Issues <strong>in</strong> Ergonomics<br />
Science, 5, 385 - 424.<br />
Urmson, C., Baker, C., Dolan, J., Rybski, P., Salesky, B., Whittaker, W., Ferguson, D. &<br />
Darms, M. (2008). Autonomous driv<strong>in</strong>g <strong>in</strong> traffic: Boss and the urban challenge. Journal of<br />
Field Robotics: Special Issue on the 2007 DARPA Urban Challenge, 425–466.<br />
Verwey, W.B. (2000). On-l<strong>in</strong>e driver workload estimation. Effects of road situation and age<br />
on secondary task measures. Ergonomics, 43, 187-209.<br />
Verwey, W.B., Brookhuis, K.A. & Janssen, W.H. (1996). Safety effects of <strong>in</strong>-vehicle<br />
<strong>in</strong>formation systems. Report TM-96-C002. Soesterberg, the Netherlands: TNO Human<br />
Factors Research Institute.
188 <strong>Driv<strong>in</strong>g</strong> <strong>in</strong> <strong>Unexpected</strong> <strong>Situations</strong><br />
Vicente, K.J. & Wang, J.H. (1998). An ecological theory of expertise effects <strong>in</strong> memory<br />
recall. Psychological Review, 105, 33-57.<br />
Valkveld, W. (2011). Hazard Anticipation of Young Novice Drivers. Ph.D. thesis, Gron<strong>in</strong>gen:<br />
University of Gron<strong>in</strong>gen.<br />
Volvo Trucks (2005). Volvo Trucks Field Operational Test: Evaluation of Advanced Safety<br />
Systems for Heavy Truck Tractors. Intelligent Vehicle Initiative (IVI) Field Operational Test<br />
Program, F<strong>in</strong>al Report.<br />
VTTI (2010). 100-car Naturalistic driv<strong>in</strong>g study factsheet. Virg<strong>in</strong>ia Tech Transportation<br />
Institute. Retrieved May 12, 2011, from http://www.vtti.vt.edu/PDF/100-Car_Fact-Sheet.pdf.<br />
Wagenaar, W.A. (1992). Risk tak<strong>in</strong>g and accident causation. In J.F. Yates (Ed.), Risk-tak<strong>in</strong>g<br />
behaviour (pp. 257-281). New York: John Wiley and Sons.<br />
Waller, M.J. (1997). Keep<strong>in</strong>g the p<strong>in</strong>s <strong>in</strong> the air: How work groups juggle multiple tasks. In<br />
M.M. Beyerle<strong>in</strong> & D.A. Johnson (Eds.), Advances <strong>in</strong> <strong>in</strong>terdiscipl<strong>in</strong>ary studies of work teams,<br />
Vol. 4 (pp. 217-247). Stamford, CT: JAI Press.<br />
Wang, J.-S., Knipl<strong>in</strong>g, R.R., Goodman, M.J. (1996). The role of driver <strong>in</strong>attention <strong>in</strong> crashes:<br />
New statistics from the 1995 Crashworth<strong>in</strong>ess Data System. 40th Annual Proceed<strong>in</strong>gs of the<br />
Association for the Advancement of Automotive Medic<strong>in</strong>e, Vancouver, British Columbia, 377-<br />
392.<br />
Ward, N.J. (2000). Automation of task processed: an example of <strong>in</strong>telligent transport systems.<br />
Human Factors and Ergonomics <strong>in</strong> Manufactur<strong>in</strong>g, 10, 395-408.<br />
Warm, J.S., Parasuraman, R. & Matthews, G. (2008). Vigilance requires hard mental<br />
workload and is stressful. Human Factors, 50, 433-441.<br />
Wickens, C.D. (1984). Process<strong>in</strong>g resources <strong>in</strong> attention. In R. Parasuraman & D.R. Davies<br />
(Eds.), Varieties of attention (pp. 63-102). New York, NY: Academic Press.<br />
Wickens, C.D. (1991). Process<strong>in</strong>g resources and attention. In D.L. Lamos (Ed.), Multiple-task<br />
performance (pp. 3-34). London: Taylor & Francis.<br />
Wickens, C.D., Sandry, D.L. & Vidulich, M. (1983).Compatibility and resource competition<br />
between modalities of <strong>in</strong>put, central process<strong>in</strong>g, and output. Human Factors, 25, 227-248.<br />
Wilde, G.J.S. (1982). The theory of risk homeostasis: implications for safety and health. Risk<br />
Analysis, 2, 209-255.<br />
W<strong>in</strong>sum, W. van, Martens, M. & Herland, L. (1999). The effects of speech versus tactile<br />
driver support messages on workload, driver behaviour and user acceptance. Report TMO-<br />
01-D009, TNO Human Factors Research Institute, Soesterberg, the Netherlands.<br />
W<strong>in</strong>sum, W. van & Hoedemaeker, M. (2000). A road test of a prototype satellite system for<br />
<strong>in</strong>-vehicle menu control. Report TM-00-C003, TNO Human Factors Research Institute,<br />
Soesterberg, The Netherlands.<br />
Young, K., Regan, M. & Hammer, M. (2003). Driver distraction: a review of the literature.<br />
Report no. 206, Monash University Accident Research Centre, Australia.<br />
Young, M.S. & Stanton, N.A. (2007). What’s skill got to do with it? Vehicle automation and<br />
driver mental workload. Ergonomics, 50, 1324-1339.
References 189<br />
Zijlstra, F.R.H. (1993). Efficiency <strong>in</strong> work behavior. A design approach for modern tools.<br />
Ph.D. thesis, Delft University of Technology. Delft, the Netherlands: Delft University Press.
190 <strong>Driv<strong>in</strong>g</strong> <strong>in</strong> <strong>Unexpected</strong> <strong>Situations</strong>
Appendices<br />
191
192 <strong>Driv<strong>in</strong>g</strong> <strong>Behaviour</strong> <strong>in</strong> <strong>Unexpected</strong> <strong>Situations</strong>
Appendix A - Annotated code for the driv<strong>in</strong>g simulator experiments 193<br />
A.1 Annotated code for the first experiment<br />
Lead car starts at 20 metres <strong>in</strong> front of the participant’s car, with <strong>in</strong>itial speed of 20 km/h.<br />
Participant’s car starts with <strong>in</strong>itial speed of 0 km/h. Route for both participant and lead car is<br />
straight at each <strong>in</strong>tersection (N=20 for each trial). Data record<strong>in</strong>g and the PDT start when the<br />
participant reaches a speed of 1 km/h for the first time and stops when the participant stops at<br />
the last road section.<br />
A1.1 Lead car’s speed choice<br />
Normal driv<strong>in</strong>g behaviour<br />
Do {<br />
If (Part[Ma<strong>in</strong>Target].DisToLeadCar 48)<br />
[If headway is over larger than 48m, lead car will decelerate to participant’s speed m<strong>in</strong>us 3.5<br />
km/h, or drive at 1 km/h if participant has stopped completely]<br />
{ Part[PNr].MaxVelocity := max(Part[Ma<strong>in</strong>Target].Velocity – 3.5/3.6, 1);<br />
}<br />
Else [In all other situations, lead vehicle’s desired speed is 50 km/h]<br />
{ Part[PNr].MaxVelocity := 50/3.6;<br />
}<br />
}<br />
Sudden brak<strong>in</strong>g (2-BLC)<br />
[At a certa<strong>in</strong> location, i.e. Path Number 18 (directly after the 5 th <strong>in</strong>tersection) <strong>in</strong> trial 2-BLC,<br />
regular speed choice behaviour as described above is replaced by anticipation to the brak<strong>in</strong>g<br />
event. The lead car accelerates or decelerates with the aim of either decreas<strong>in</strong>g or <strong>in</strong>creas<strong>in</strong>g<br />
headway to an average value for all participants.]<br />
If (Part[Ma<strong>in</strong>Target].PathNr = 18 and<br />
Part[Ma<strong>in</strong>Target].DisToInter > 250 and Part[Ma<strong>in</strong>Target].DisToInter < 240)<br />
{ If (Part[Ma<strong>in</strong>Target].DisToLeadCar < 18)<br />
{ Part[PNr].Velocity := Part[Ma<strong>in</strong>Target].Velocity + 6/3.6;<br />
}<br />
ElseIf (Part[Ma<strong>in</strong>Target].DisToLeadCar > 45)<br />
{<br />
Part[PNr].MaxVelocity :=<br />
max(Part[Ma<strong>in</strong>Target].velocity – 3.5/3.6, 1);<br />
}<br />
}<br />
[When the participant is driv<strong>in</strong>g at 240 metres before the <strong>in</strong>tersection, the lead car starts to<br />
decelerate to 10% of the current speed; this deceleration loop could ultimately lead to a full<br />
stop. Deceleration cont<strong>in</strong>ues unless the headway has reached either 14, 10 or 6 metres, related<br />
to the three urgency levels]
194 <strong>Driv<strong>in</strong>g</strong> <strong>Behaviour</strong> <strong>in</strong> <strong>Unexpected</strong> <strong>Situations</strong><br />
ElseIf (Part[Ma<strong>in</strong>Target].DisToleadCar > [14 / 10 / 6])<br />
{<br />
[Current speed is recorded and brak<strong>in</strong>g lights are turned on]<br />
Currentspeed := Part[PNr].Velocity;<br />
Part[PNr].Velocity := Currentspeed * 0.9;<br />
Part[PNr].Brakelight := On;<br />
[The time of the brak<strong>in</strong>g event is recorded, <strong>in</strong>clud<strong>in</strong>g the urgency level of the<br />
event]<br />
Proc(SetEventCode, [1/ 2/ 3]);<br />
}<br />
}<br />
A1.2 Car from left (4-CfL)<br />
[Between 140 and 150 metres before the 7 th <strong>in</strong>tersection <strong>in</strong> trial 4-CfL, a car is created and<br />
placed at 80 metres before the <strong>in</strong>tersection at the road section from the left]<br />
When (Part[Ma<strong>in</strong>Target].DisToInter < 150 and Part[Ma<strong>in</strong>Target].DisToInter > 140;<br />
PNr := CreatePart;<br />
Part[PNr].DisToInter := 80;<br />
Do<br />
{<br />
If ( Part[Ma<strong>in</strong>Target].PathNr = 26 and Part[Ma<strong>in</strong>Target].DisToInter > [15/ 6/ 0] )<br />
[If the participant is at the predef<strong>in</strong>ed location and drives at either 15, 6 or 0 metres from the<br />
start of the <strong>in</strong>tersection (related to the three urgency levels), the car from left accelerates]<br />
{<br />
[The left car’s speed is adjusted so that the two vehicles will reach the <strong>in</strong>tersection<br />
centre at the same time]<br />
If (Part[PNr].DisToInter > Part[Ma<strong>in</strong>Target].DisToInter - 4)<br />
{ Part[PNr].MaxVelocity := Part[PNr].Velocity + 2/3.6;<br />
}<br />
ElseIf (Part[PNr].DisToInter < Part[Ma<strong>in</strong>Target].DisToInter - 4)<br />
{ Part[PNr].MaxVelocity := max( 1, Part[PNr].Velocity - 2/3.6);<br />
}<br />
Else<br />
{ Part[PNr].Velocity := 50/3.6;<br />
}<br />
}<br />
[When the participant reaches the <strong>in</strong>tersection, accelerate left car and record event time and<br />
urgency level]<br />
ElseIf(Part[Ma<strong>in</strong>Target].PathNr = 26 and Part[PNr].OnInterPlane = False )<br />
{ Part[PNr].Velocity := 45/3.6;<br />
Proc(SetEventCode, [1/2/3]);<br />
}<br />
[F<strong>in</strong>ally, when the participant has passed the <strong>in</strong>tersection centre, end the event by stopp<strong>in</strong>g the<br />
car from left]<br />
ElseIf(Part[Ma<strong>in</strong>Target].PathNr = 26 and Part[Ma<strong>in</strong>Target].DisToInter > - 8)<br />
{ Part[PNr].Velocity := 1/3.6;<br />
}<br />
}
Appendix A - Annotated code for the driv<strong>in</strong>g simulator experiments 195<br />
A.2 Annotated code for the f<strong>in</strong>al experiment<br />
Initialization of the second experiment was similar to the first experiment.<br />
A2.2 Lead car<br />
The section describes the lead vehicle’s speed choice.<br />
Normal driv<strong>in</strong>g behaviour<br />
[The time headway is calculated as the distance between the centre of the lead car and the<br />
centre of the participant’s car, divided by the participant’s speed. This is possible s<strong>in</strong>ce the<br />
roads at which the lead car’s speed choice is regulated are all straight]<br />
Def<strong>in</strong>e Function TimeHeadWay ( )<br />
{<br />
TimeHeadWay := ((DisBetween(Part[Ma<strong>in</strong>Target].PartNr, VoorLigger) –<br />
(0.5 * Part[VoorLigger].CarLength) - (0.5 * Part[Ma<strong>in</strong>Target].CarLength)) /<br />
Part[Ma<strong>in</strong>Target].Velocity);<br />
}<br />
[The lead vehicle slows down when the time headway is larger than 2.5 seconds and<br />
accelerates when the time headway is smaller than 0.8 seconds. The acceleration and<br />
deceleration rate are chosen randomly between boundaries.]<br />
Do {<br />
If (TimeHeadWay 2.5)<br />
{ Part[Voorligger].MaxVelocity := Part[Voorligger].Velocity – rnd(2,5)/3.6);<br />
}<br />
}<br />
Sudden brak<strong>in</strong>g<br />
[Between 100 and 45 metres from the sixth, seventh or eight <strong>in</strong>tersection <strong>in</strong> three of the<br />
blocks, the speed choice behaviour as described above is replaced by a brak<strong>in</strong>g scenario. An<br />
event code (200) is recorded. Depend<strong>in</strong>g on the location with<strong>in</strong> the experiment, a certa<strong>in</strong><br />
number of previous brak<strong>in</strong>g events is used as a condition for start<strong>in</strong>g the brak<strong>in</strong>g scenario.<br />
The acceleration rate and distance headway after the event vary with urgency. After the<br />
brak<strong>in</strong>g event, another event code (201) is recorded, to <strong>in</strong>dicate the end of the brak<strong>in</strong>g event.]<br />
If (Part[Voorligger].PathNr => and Part[Voorligger].PathNr
196 <strong>Driv<strong>in</strong>g</strong> <strong>Behaviour</strong> <strong>in</strong> <strong>Unexpected</strong> <strong>Situations</strong><br />
Def<strong>in</strong>e Action[0]<br />
{<br />
Var { a; }<br />
Start<br />
{<br />
When (Scen_RemmenVoorligger = 1);<br />
Part[VoorLigger].MaxDec := X; // vary<strong>in</strong>g with event urgency<br />
Part[VoorLigger].DumVar1 := Part[VoorLigger].MaxVelocity;<br />
Part[VoorLigger].DumVar2 := Part[VoorLigger].MaxAcc;<br />
Part[VoorLigger].MaxVelocity := 0;<br />
Part[VoorLigger].UseBrakeLight := On;<br />
ControlVoorligger := Off;<br />
Proc(SetEventCode, 200);<br />
NrRemactie := NrRemactie + 1;<br />
}<br />
End<br />
{<br />
When (TimeHeadWay() X );<br />
Scen_RemmenVoorligger := 0;<br />
Part[VoorLigger].UseBrakeLight := Off;<br />
Part[VoorLigger].MaxVelocity := 50/3.6;<br />
Part[VoorLigger].MaxAcc := 3.0;<br />
ControlVoorligger := True;<br />
Proc(SetEventCode, 201);<br />
}
Appendix B - Instructions for the driv<strong>in</strong>g simulator experiments 197<br />
B.1 Instructions for the first driv<strong>in</strong>g simulator experiment (<strong>in</strong> Dutch)<br />
Hartelijk dank voor uw deelname aan het onderzoek “TRANSUMO” en welkom bij TNO. U<br />
gaat zo deelnemen aan een rijsimulator experiment. In dit experiment wordt uw normale<br />
rijgedrag gemeten. Het is dan ook van belang dat u rijdt zoals u normaal ook zou doen.<br />
In dit experiment, dat <strong>in</strong> een stedelijke omgev<strong>in</strong>g plaatsv<strong>in</strong>dt, willen we graag uw normale<br />
rijgedrag meten op wegen en kruispunten waar de maximumsnelheid van 50 kilometer per uur<br />
geldt, en waar verkeer van rechts voorrang heeft. Het doel van dit experiment is om te bepalen<br />
op welk punt automobilisten ondersteun<strong>in</strong>g <strong>in</strong> de auto kunnen gebruiken. Daarnaast wordt er<br />
<strong>in</strong> sommige ritten bij sommige proefpersonen iets aangepast <strong>in</strong> de omgev<strong>in</strong>g, om te kijken wat<br />
dit voor <strong>in</strong>vloed heeft op uw normale rijgedrag.<br />
In een enkel geval zou ook een onverwachte situatie kunnen ontstaan op de weg. Het is ook <strong>in</strong><br />
deze situaties van belang dat u rijdt zoals u normaal gesproken ook zou rijden.<br />
Allereerst maakt u een korte <strong>in</strong>troductierit. Deze is bedoeld om u vertrouwd te maken met de<br />
rijsimulator en de bedien<strong>in</strong>g ervan. Na een korte pauze zal u een aantal korte ritten rijden,<br />
waarna u steeds een vragenlijst <strong>in</strong>vult. De ritten duren ongeveer 10 m<strong>in</strong>uten, en het<br />
experiment zal <strong>in</strong> totaal ongeveer 2 uur duren. Tussen twee ritten heeft u steeds ongeveer 10<br />
m<strong>in</strong>uten de tijd voor een vragenlijst en een pauze.<br />
Bedenkt u tijdens het rijden dat u <strong>in</strong> een rijsimulator rijdt, en niet <strong>in</strong> een gewone auto, hier<br />
moet u mogelijk even aan wennen <strong>in</strong> het beg<strong>in</strong>. Daarom rijden we straks eerst een korte<br />
<strong>in</strong>troductierit.<br />
Het is belangrijk dat u het direct aan de proefleider doorgeeft als u zich draaierig, misselijk of<br />
andersz<strong>in</strong>s vervelend voelt. U moet hier niet mee wachten, omdat het de resultaten van het<br />
experiment kan beïnvloeden en omdat de ervar<strong>in</strong>g leert dat het vervelende gevoel niet<br />
overgaat als u doorrijdt. Bovendien kan het vaak snel onderdrukt worden door een korte pauze<br />
te nemen buiten de simulator.<br />
Als u iets niet begrijpt, of vragen heeft over uw taak, kunt u deze voorafgaand aan het<br />
experiment en tijdens de pauzes stellen. Tijdens de ritten is er geen mogelijkheid om vragen te<br />
stellen. Vragen over het experiment en de uitkomsten kunt u naderhand aan de proefleider<br />
stellen.
198 <strong>Driv<strong>in</strong>g</strong> <strong>Behaviour</strong> <strong>in</strong> <strong>Unexpected</strong> <strong>Situations</strong><br />
B.2 Instructions for the f<strong>in</strong>al driv<strong>in</strong>g simulator experiment (<strong>in</strong> Dutch)<br />
Hartelijk dank voor uw deelname aan het onderzoek “TRANSUMO – rijgedrag b<strong>in</strong>nen de<br />
bebouwde kom” en welkom bij TNO. U gaat zo deelnemen aan een rijsimulator experiment.<br />
In dit experiment, dat <strong>in</strong> een stedelijke omgev<strong>in</strong>g plaatsv<strong>in</strong>dt, willen we graag uw normale<br />
rijgedrag meten op wegen en kruispunten waar de maximumsnelheid van 50 kilometer per uur<br />
geldt, en waar verkeer van rechts voorrang heeft. Het doel van dit experiment is om te bepalen<br />
op welk punt automobilisten ondersteun<strong>in</strong>g <strong>in</strong> de auto kunnen gebruiken. Daarnaast vragen<br />
we u <strong>in</strong> twee van de drie delen van de rit een extra rekentaak uit te voeren, om te kijken wat<br />
dit voor <strong>in</strong>vloed heeft op uw normale rijgedrag. Over deze extra taak krijgt u zo meteen meer<br />
uitleg.<br />
Het is <strong>in</strong> het hele experiment van belang dat u rijdt zoals u normaal gesproken ook zou rijden.<br />
Gedurende het experiment rijdt u vrijwel voortdurend <strong>in</strong> een stad, en er kunnen dus auto’s uit<br />
verschillende richt<strong>in</strong>gen komen. Zoals ook <strong>in</strong> een normale stad gebeurt het meestal dat u<br />
achter iemand rijdt die een andere snelheid aanhoudt dan u misschien gewend bent, we willen<br />
u vragen om geen ongevallen met tegenliggers te riskeren. In een enkel geval zou er een<br />
onverwachte situatie kunnen ontstaan op de weg. Het is ook <strong>in</strong> deze situaties van belang dat u<br />
rijdt zoals u normaal gesproken ook zou rijden.<br />
Allereerst maakt u een korte <strong>in</strong>troductierit. Deze is bedoeld om u vertrouwd te maken met de<br />
rijsimulator en de bedien<strong>in</strong>g ervan. Halverwege de <strong>in</strong>troductierit krijgt u bovendien de<br />
mogelijkheid om met de rekentaak te oefenen. Na een korte pauze zult u twee keer een rit van<br />
ongeveer 20 m<strong>in</strong>uten rijden, waarna u een vragenlijst <strong>in</strong>vult over wat u van de rit vond en of u<br />
het moeilijk vond. Na de laatste vragenlijst is het experiment afgelopen.<br />
Bedenk tijdens het rijden dat u <strong>in</strong> een rijsimulator rijdt, en niet <strong>in</strong> een gewone auto, hier moet<br />
u mogelijk even aan wennen <strong>in</strong> het beg<strong>in</strong>. Daarom rijden we eerst de korte <strong>in</strong>troductierit.<br />
Het is belangrijk dat u het direct aan de proefleider doorgeeft als u zich draaierig, ziek of<br />
andersz<strong>in</strong>s vervelend voelt, ook als dit al voorafgaand aan het experiment het geval is. U moet<br />
hier niet mee wachten, omdat het de resultaten van het experiment kan beïnvloeden en omdat<br />
het vervelende gevoel niet altijd overgaat als u doorrijdt. Bovendien kan het vaak snel<br />
onderdrukt worden door een korte pauze te nemen buiten de simulator. Uw vergoed<strong>in</strong>g blijft<br />
uiteraard hetzelfde.<br />
U krijgt tijdens het rijden een hoofdband om uw hoofd, met een kle<strong>in</strong> lampje <strong>in</strong> uw<br />
l<strong>in</strong>kerbovenhoek dat aan en uit gaat. Om uw v<strong>in</strong>ger wordt een knopje geschoven dat u kunt<br />
<strong>in</strong>drukken tegen het stuur. Zodra het rode lampje aan gaat moet u dit knopje <strong>in</strong>drukken. Het is<br />
van belang dat u het autorijden niet ondergeschikt maakt aan het reageren op dit knopje, rijdt<br />
u dus normaal en laat u niet afleiden door het lampje. Met andere woorden: reageert u zo snel<br />
mogelijk, maar besteed er niet meer aandacht aan dan het autorijden toelaat. Ook <strong>in</strong> de<br />
rijsimulator is het van belang dat u zo veilig mogelijk naar uw bestemm<strong>in</strong>g rijdt.<br />
Verder krijgt u een borstband om uw borst en elektrodes op uw schouder, borst en heup die<br />
uw hartslagfrequentie meten. Dit geeft extra <strong>in</strong>formatie over hoe moeilijk u het vond om de<br />
rekentaak en het autorijden te comb<strong>in</strong>eren. De band en de elektrodes zijn veilig en hebben<br />
geen enkel effect op uw hartslag, ze meten alleen!
Appendix B - Instructions for the driv<strong>in</strong>g simulator experiments 199<br />
Zoals al eerder genoemd krijgt u tijdens delen van deze rit een extra taak. U moet hardop<br />
terugtellen vanaf 250 of 350 <strong>in</strong> stappen van bijvoorbeeld 6. Dit gaat ongeveer als volgt: 250,<br />
244, 238,…etc. U geeft dus antwoord <strong>in</strong> de vorm van een cijferreeks. De proefleider zal<br />
aangeven wanneer deze taak beg<strong>in</strong>t en wat de taak precies <strong>in</strong>houdt. Maakt u <strong>in</strong> de terugtell<strong>in</strong>g<br />
een vergiss<strong>in</strong>g, dan zal de proefleider u het goede antwoord geven en kunt u vanaf dat punt<br />
doorgaan. Om te bepalen welke taak u krijgt zal de proefleider na de <strong>in</strong>structies een<br />
oefentaakje met u doen.<br />
U kunt uw cijferreeks op normaal volume uitspreken <strong>in</strong> de auto, de antwoorden worden via<br />
een microfoontje aan de proefleider doorgegeven. U hoeft dus niet extra hard te praten. Het is<br />
wel van belang dat u zo snel mogelijk antwoord geeft. Maar ook hier geldt: veilig op uw<br />
bestemm<strong>in</strong>g aankomen is het allerbelangrijkste!<br />
Mocht u tijdens de rit gedurende langere tijd stil moeten staan op de weg, dan moet het<br />
experiment opnieuw worden opgestart. Als u iets niet begrijpt, of vragen heeft over uw taak,<br />
kunt u deze voorafgaand aan het experiment stellen. Tijdens de uite<strong>in</strong>delijke rit is er geen<br />
mogelijkheid om vragen te stellen. Vragen over de uitkomsten kunt u naderhand aan de<br />
proefleider stellen.<br />
We gaan nu eerst een <strong>in</strong>troductierit rijden. U kunt nu het proefpersonenformulier<br />
ondertekenen en aan de proefleider aangeven dat u klaar bent om te beg<strong>in</strong>nen.
200 <strong>Driv<strong>in</strong>g</strong> <strong>Behaviour</strong> <strong>in</strong> <strong>Unexpected</strong> <strong>Situations</strong><br />
C.1 Questionnaire for the first driv<strong>in</strong>g simulator experiment (<strong>in</strong> Dutch)<br />
U heeft zojuist een experiment b<strong>in</strong>nen een stad gereden. Graag zouden wij uw men<strong>in</strong>g horen<br />
over de omgev<strong>in</strong>g waar<strong>in</strong> u heeft rondgereden, over het rijden <strong>in</strong> de rijsimulator en over<br />
opvallende zaken <strong>in</strong> het experiment. De vragenlijst bestaat uit drie korte delen. Beantwoordt u<br />
de vragen alstublieft zo eerlijk en volledig mogelijk. Aan het e<strong>in</strong>d van de vragenlijst is er<br />
ruimte voor extra opmerk<strong>in</strong>gen die niet bij de vragen aan de orde komen.<br />
Deel A. Voor en na het experiment<br />
1. Hoe voelde u zich voor aanvang van het experiment? Geef op onderstaande schaal aan<br />
welke term het beste bij uw gevoel past.<br />
a. Energiek x x x x x Vermoeid<br />
b. Gespannen x x x x x Ontspannen<br />
c. Ongezond x x x x x Gezond<br />
d. Draaierig x x x x x Niet draaierig<br />
e. Zeker x x x x x Onzeker<br />
f. Druk x x x x x Rustig<br />
2. Hoe voelde u zich na het experiment? Geef op onderstaande schaal aan welke term het<br />
beste bij uw gevoel past.<br />
a. Energiek x x x x x Vermoeid<br />
b. Gespannen x x x x x Ontspannen<br />
c. Ongezond x x x x x Gezond<br />
d. Draaierig x x x x x Niet draaierig<br />
e. Zeker x x x x x Onzeker<br />
f. Druk x x x x x Rustig<br />
Deel B. De omgev<strong>in</strong>g<br />
3. Wat vond u van de omgev<strong>in</strong>g waar<strong>in</strong> u reed?<br />
a. Mooi x x x x x Lelijk<br />
b. Simpel x x x x x Complex<br />
c. Saai x x x x x Spannend<br />
d. Onverwacht x x x x x Voorspelbaar<br />
e. Groot x x x x x Kle<strong>in</strong><br />
f. Niet leuk x x x x x Leuk<br />
4. Wat vond u van het andere verkeer dat <strong>in</strong> de stad rondreed?<br />
a. Mooi x x x x x Lelijk<br />
b. Simpel x x x x x Complex<br />
c. Saai x x x x x Spannend<br />
d. Onverwacht x x x x x Voorspelbaar<br />
e. Niet leuk x x x x x Leuk<br />
f. Veel verkeer x x x x x We<strong>in</strong>ig verkeer
Appendix C - Questionnaires for the driv<strong>in</strong>g simulator experiments 201<br />
Deel C. De rijtaak<br />
5. Wat vond u van de taak, namelijk het rondrijden <strong>in</strong> de stad?<br />
a. Gemakkelijk x x x x x Moeilijk<br />
b. Saai x x x x x Spannend<br />
c. Onverwacht x x x x x Voorspelbaar<br />
d. Niet leuk x x x x x Leuk<br />
6. Heeft u gereden zoals u normaal ook rijdt <strong>in</strong> de stad? Licht toe.<br />
…………………………………………………………………………………<br />
7. Wat vond u van het reageren op het rode lampje? Streep door wat niet van toepass<strong>in</strong>g is.<br />
Gemakkelijk / moeilijk<br />
8. Had het reageren op het rode lampje <strong>in</strong>vloed op uw rijgedrag? Licht toe.<br />
………………………………………………………………………………………….<br />
9. Is u verder nog iets opgevallen?<br />
…..................................……………………………………………………………….<br />
Two supplemental questions for participants driv<strong>in</strong>g with an additional task 4<br />
10. Wat vond u van de extra taak (oplossen van wiskundige sommen)? Streep door wat niet<br />
van toepass<strong>in</strong>g is.<br />
Gemakkelijk / moeilijk<br />
11. Had de extra taak (het oplossen van wiskundige sommen) <strong>in</strong>vloed op uw rijgedrag? Licht<br />
toe.<br />
………………………………………………………………………………………….<br />
4 These two questions were only <strong>in</strong>cluded <strong>in</strong> the questionnaires for participants driv<strong>in</strong>g with an additional task.
202 <strong>Driv<strong>in</strong>g</strong> <strong>Behaviour</strong> <strong>in</strong> <strong>Unexpected</strong> <strong>Situations</strong><br />
C.2 Questionnaire for the f<strong>in</strong>al driv<strong>in</strong>g simulator experiment (<strong>in</strong> Dutch)<br />
U heeft zojuist een experiment b<strong>in</strong>nen een stad gereden. Graag zouden wij uw men<strong>in</strong>g horen<br />
over de omgev<strong>in</strong>g waar<strong>in</strong> u heeft rondgereden, over het rijden <strong>in</strong> de rijsimulator en over<br />
opvallende zaken <strong>in</strong> het experiment. De vragenlijst bestaat uit drie korte delen. Beantwoordt u<br />
de vragen alstublieft zo eerlijk en volledig mogelijk. Aan het e<strong>in</strong>d van de vragenlijst is er<br />
ruimte voor extra opmerk<strong>in</strong>gen die niet bij de vragen aan de orde komen.<br />
De vragen zijn als volgt geformuleerd:<br />
Wat vond u van de omgev<strong>in</strong>g waar<strong>in</strong> u reed?<br />
Simpel X X X X X Complex<br />
U geeft op deze vraag antwoord door 1 kruisje te omcirkelen. Als u de omgev<strong>in</strong>g erg simpel<br />
vond ziet dat er dus als volgt uit:<br />
Simpel X X X X X Complex<br />
Dit doet u ook voor elke volgende term.<br />
Op de volgende pag<strong>in</strong>a staat de vragenlijst.
Appendix C - Questionnaires for the driv<strong>in</strong>g simulator experiments 203<br />
Deel A. Voor en na het experiment<br />
1. Hoe voelde u zich voor aanvang van het experiment? Geef op onderstaande schaal aan<br />
welke term het beste bij uw gevoel past.<br />
a. Energiek x x x x x Vermoeid<br />
b. Gespannen x x x x x Ontspannen<br />
c. Ongezond x x x x x Gezond<br />
2. Hoe voelde u zich na het experiment? Geef op onderstaande schaal aan welke term het<br />
beste bij uw gevoel past. Per term 1 cirkel aub.<br />
a. Energiek x x x x x Vermoeid<br />
b. Gespannen x x x x x Ontspannen<br />
c. Ongezond x x x x x Gezond<br />
Deel B. De omgev<strong>in</strong>g<br />
3. Wat vond u van de omgev<strong>in</strong>g waar<strong>in</strong> u reed? Per term 1 cirkel aub.<br />
b. Simpel x x x x x Complex<br />
c. Saai x x x x x Spannend<br />
d. Onverwacht x x x x x Voorspelbaar<br />
4. Wat vond u van het andere verkeer dat <strong>in</strong> de stad rondreed?<br />
b. Simpel x x x x x Complex<br />
c. Saai x x x x x Spannend<br />
d. Onverwacht x x x x x Voorspelbaar<br />
Deel C. De rijtaak<br />
5. Wat vond u van de taak, namelijk het rondrijden <strong>in</strong> de stad?<br />
a. Gemakkelijk x x x x x Moeilijk<br />
b. Saai x x x x x Spannend<br />
c. Onverwacht x x x x x Voorspelbaar<br />
6. Heeft u gereden zoals u normaal ook rijdt <strong>in</strong> de stad? Licht toe.<br />
…………………………………………………………………………………
204 <strong>Driv<strong>in</strong>g</strong> <strong>Behaviour</strong> <strong>in</strong> <strong>Unexpected</strong> <strong>Situations</strong><br />
7. Wat vond u van de extra taak (het opzeggen van de getallenreeks)? Streep door wat niet<br />
van toepass<strong>in</strong>g is.<br />
Gemakkelijk / moeilijk<br />
8. Had de extra taak (het opzeggen van een getallenreeks) <strong>in</strong>vloed op uw rijgedrag? Licht toe.<br />
…………………………………………………………………………………<br />
9. Wat vond u van het reageren op het rode lampje? Streep door wat niet van toepass<strong>in</strong>g is.<br />
Gemakkelijk / moeilijk<br />
10. Had het reageren op het rode lampje <strong>in</strong>vloed op uw rijgedrag? Licht toe.<br />
………………………………………………………………………………………….<br />
11. Is u verder nog iets opgevallen?<br />
…..................................……………………………………………………………….<br />
Ruimte voor overige opmerk<strong>in</strong>gen:<br />
………………………………………………………………………………………….
Appendix D - Detailed results for the driv<strong>in</strong>g simulator experiments 205<br />
D.1 Detailed results for the first driv<strong>in</strong>g simulator experiment<br />
Average speed (km/h)<br />
No additional workload Additional workload<br />
Mild Medium Hard Mild Medium Hard<br />
Drive 1 40.0272 36.4447 38.4956 47.6547 40.5308 36.6313<br />
Drive 2 42.9976 41.2981 42.6361 46.5756 44.3816 38.1676<br />
Drive 3 44.0543 41.7835 43.5687 48.5285 49.4622 40.4213<br />
Drive 4 45.0749 41.6551 43.2550 49.9198 49.9196 41.2283<br />
Standard deviation of speed<br />
No additional workload Additional workload<br />
Mild Medium Hard Mild Medium Hard<br />
Drive 1 6.1896 7.2366 5.4484 4.9312 6.8453 7.0996<br />
Drive 2 4.8579 5.2971 4.6944 2.9015 6.3802 5.6059<br />
Drive 3 4.2443 5.5803 4.2973 3.1069 4.4477 5.7484<br />
Drive 4 4.4444 5.5488 4.5319 3.6879 3.7123 5.3415<br />
Average distance headway (m)<br />
No additional workload Additional workload<br />
Mild Medium Hard Mild Medium Hard<br />
Drive 1 26.8089 31.7328 25.7831 21.5170 25.4200 30.0259<br />
Drive 2 24.6346 27.0289 26.0952 19.4746 21.5375 29.7059<br />
Drive 3 23.8055 26.2031 25.1392 20.2511 21.7155 27.0091<br />
Drive 4 23.8276 26.1492 25.7449 20.5026 20.3937 27.7688<br />
Standard deviation of distance headway<br />
No additional workload Additional workload<br />
Mild Medium Hard Mild Medium Hard<br />
Drive 1 6.3629 6.9375 6.8906 5.0284 5.9945 5.5917<br />
Drive 2 5.4193 7.2917 6.7266 3.9694 5.6076 9.9714<br />
Drive 3 5.0528 7.1261 9.1333 4.1949 4.8643 5.1750<br />
Drive 4 5.7263 7.7299 7.5491 4.0038 4.5986 6.1904<br />
Percentage of time driven with m<strong>in</strong>imum headway (< 19 m) (%)<br />
No additional workload Additional workload<br />
Mild Medium Hard Mild Medium Hard<br />
Drive 1 18.6872 5.8906 20.6826 47.4637 13.2420 5.5783<br />
Drive 2 25.5623 19.8430 20.4713 70.4058 52.3204 9.4258<br />
Drive 3 32.8839 19.2405 21.6318 48.1464 44.0339 11.7270<br />
Drive 4 34.1816 43.5169 24.7617 46.9346 56.1309 16.5987
206 <strong>Driv<strong>in</strong>g</strong> <strong>Behaviour</strong> <strong>in</strong> <strong>Unexpected</strong> <strong>Situations</strong><br />
Percentage of time driven with maximum headway (> 47 m) (%)<br />
No additional workload Additional workload<br />
Mild Medium Hard Mild Medium Hard<br />
Drive 1 6.1700 8.6493 2.8733 0.7757 2.5139 4.9457<br />
Drive 2 3.2061 4.1720 2.5285 0.2490 1.1268 4.3664<br />
Drive 3 4.7287 2.6860 1.7503 0.3160 0.3677 2.3648<br />
Drive 4 4.6911 2.2151 1.7184 0.6336 0.4797 3.7597<br />
Average lateral position (m)<br />
No additional workload Additional workload<br />
Mild Medium Hard Mild Medium Hard<br />
Drive 1 -0.1019 -0.4054 -0.2999 0.0610 0.2236 -0.0297<br />
Drive 2 -0.1175 -0.4275 -0.4401 -0.0542 0.3553 -0.1580<br />
Drive 3 -0.1617 -0.4609 -0.5188 0.0153 0.4053 -0.2315<br />
Drive 4 -0.0333 -0.5020 -0.4900 -0.0063 0.3400 -0.0651<br />
Standard deviation of lateral position<br />
No additional workload Additional workload<br />
Mild Medium Hard Mild Medium Hard<br />
Drive 1 0.9116 0.9385 0.7941 0.7189 0.7808 0.5888<br />
Drive 2 0.8516 0.8517 0.7066 0.6589 0.8847 0.7824<br />
Drive 3 0.8879 0.9680 0.7700 0.6791 0.7935 0.7122<br />
Drive 4 0.8546 0.9418 0.7346 0.6897 0.8569 0.6740<br />
Average lateral acceleration (m/s2)<br />
No additional workload Additional workload<br />
Mild Medium Hard Mild Medium Hard<br />
Drive 1 -0.0114 -0.0260 -0.0463 -0.0433 -0.0366 -0.0280<br />
Drive 2 -0.0085 -0.0494 -0.0390 -0.0357 -0.0469 -0.0415<br />
Drive 3 -0.0361 -0.0484 -0.0322 -0.0393 -0.0659 -0.0300<br />
Drive 4 -0.0168 -0.0423 -0.0193 -0.0584 -0.0658 -0.0371<br />
Standard deviation of lateral acceleration<br />
No additional workload Additional workload<br />
Mild Medium Hard Mild Medium Hard<br />
Drive 1 0.1766 0.1679 0.1955 0.2276 0.1903 0.1810<br />
Drive 2 0.2035 0.2313 0.1800 0.1942 0.2058 0.1955<br />
Drive 3 0.2055 0.2090 0.1968 0.1843 0.2381 0.1626<br />
Drive 4 0.1956 0.2149 0.1755 0.2142 0.2459 0.1700
Appendix D - Detailed results for the driv<strong>in</strong>g simulator experiments 207<br />
D.2 Detailed results for the f<strong>in</strong>al driv<strong>in</strong>g simulator experiment<br />
Average speed (km/h)<br />
Trial 1 Trial 2<br />
<strong>Driv<strong>in</strong>g</strong><br />
only<br />
Easy task<br />
Difficult<br />
task<br />
<strong>Driv<strong>in</strong>g</strong><br />
only<br />
Easy task<br />
Difficult<br />
task<br />
No brak<strong>in</strong>g 45.9334 46.4391 46.3886 46.6158 47.5703 46.3886<br />
Non-urgent 43.9211 46.9761 45.6634 44.5464 44.2937 45.1681<br />
Urgent 44.3900 45.2015 45.0505 43.3707 45.2567 45.5729<br />
Standard deviation of speed<br />
Trial 1 Trial 2<br />
<strong>Driv<strong>in</strong>g</strong><br />
only<br />
Easy task<br />
Difficult<br />
task<br />
<strong>Driv<strong>in</strong>g</strong><br />
only<br />
Easy task<br />
Difficult<br />
task<br />
No brak<strong>in</strong>g 7.1602 7.5770 7.9746 7.2320 5.9518 7.4191<br />
Non-urgent 10.6011 10.2922 8.7699 8.7561 9.4101 9.0882<br />
Urgent 10.7467 10.2165 10.7898 10.1710 10.3360 10.7645<br />
Average distance headway (m)<br />
Trial 1 Trial 2<br />
<strong>Driv<strong>in</strong>g</strong><br />
only<br />
Easy task<br />
Difficult<br />
task<br />
<strong>Driv<strong>in</strong>g</strong><br />
only<br />
Easy task<br />
Difficult<br />
task<br />
No brak<strong>in</strong>g 19.3612 16.8121 15.6190 17.1448 13.9086 18.3930<br />
Non-urgent 18.9422 12.4894 15.8229 18.1064 19.4994 15.7755<br />
Urgent 15.5645 14.3004 15.8595 18.3320 15.1290 13.8030<br />
Standard deviation of distance headway<br />
Trial 1 Trial 2<br />
<strong>Driv<strong>in</strong>g</strong><br />
only<br />
Easy task<br />
Difficult<br />
task<br />
<strong>Driv<strong>in</strong>g</strong><br />
only<br />
Easy task<br />
Difficult<br />
task<br />
No brak<strong>in</strong>g 5.9192 6.6664 5.7279 6.6324 4.7306 5.7677<br />
Non-urgent 7.0873 4.4424 5.8361 6.4014 6.8784 5.9053<br />
Urgent 5.9024 5.3289 5.6176 6.6269 5.8924 5.9527<br />
Average time headway (s)<br />
Trial 1 Trial 2<br />
<strong>Driv<strong>in</strong>g</strong><br />
only<br />
Easy task<br />
Difficult<br />
task<br />
<strong>Driv<strong>in</strong>g</strong><br />
only<br />
Easy task<br />
Difficult<br />
task<br />
No brak<strong>in</strong>g 1.5533 1.3440 1.2558 1.3757 1.0599 1.4614<br />
Non-urgent 1.6511 0.9917 1.2828 1.5010 1.6268 1.3151<br />
Urgent 1.3412 1.2080 1.3526 1.5787 1.2674 1.1305
208 <strong>Driv<strong>in</strong>g</strong> <strong>Behaviour</strong> <strong>in</strong> <strong>Unexpected</strong> <strong>Situations</strong><br />
Standard deviation of time headway<br />
Trial 1 Trial 2<br />
<strong>Driv<strong>in</strong>g</strong><br />
only<br />
Easy task<br />
Difficult<br />
task<br />
<strong>Driv<strong>in</strong>g</strong><br />
only<br />
Easy task<br />
Difficult<br />
task<br />
No brak<strong>in</strong>g 0.5331 0.5730 0.5930 0.5963 0.3576 0.5113<br />
Non-urgent 0.7730 0.3962 0.5281 0.5675 0.6309 0.5785<br />
Urgent 0.6711 0.6959 0.6918 0.5940 0.6680 0.6575<br />
Average lateral position (m)<br />
Trial 1 Trial 2<br />
<strong>Driv<strong>in</strong>g</strong><br />
only<br />
Easy task<br />
Difficult<br />
task<br />
<strong>Driv<strong>in</strong>g</strong><br />
only<br />
Easy task<br />
Difficult<br />
task<br />
No brak<strong>in</strong>g -0.1228 -0.1093 -0.0657 -0.1249 -0.0964 -0.0729<br />
Non-urgent -0.0860 -0.0588 -0.0892 -0.1314 -0.0893 -0.0798<br />
Urgent -0.1261 -0.0996 -0.0879 -0.1426 -0.1313 -0.1260<br />
Standard deviation of lateral position<br />
Trial 1 Trial 2<br />
<strong>Driv<strong>in</strong>g</strong><br />
only<br />
Easy task<br />
Difficult<br />
task<br />
<strong>Driv<strong>in</strong>g</strong><br />
only<br />
Easy task<br />
Difficult<br />
task<br />
No brak<strong>in</strong>g 0.1893 0.1760 0.1756 0.2177 0.1451 0.1625<br />
Non-urgent 0.1933 0.1050 0.1566 0.1472 0.1300 0.1707<br />
Urgent 0.1966 0.1234 0.1469 0.2010 0.1826 0.2012<br />
Average PDT reaction time (ms)<br />
Trial 1 Trial 2<br />
<strong>Driv<strong>in</strong>g</strong><br />
only<br />
Easy task<br />
Difficult<br />
task<br />
<strong>Driv<strong>in</strong>g</strong><br />
only<br />
Easy task<br />
Difficult<br />
task<br />
No brak<strong>in</strong>g 476.7632 703.9293 721.1339 501.6523 646.8817 669.3837<br />
Non-urgent 507.4741 634.30081 769.8309 539.0470 740.3438 773.8162<br />
Urgent 451.4472 670.6519 648.4776 457.9257 630.5175 725.5185<br />
Standard deviation of PDT reaction time<br />
Trial 1 Trial 2<br />
<strong>Driv<strong>in</strong>g</strong><br />
only<br />
Easy task<br />
Difficult<br />
task<br />
<strong>Driv<strong>in</strong>g</strong><br />
only<br />
Easy task<br />
Difficult<br />
task<br />
No brak<strong>in</strong>g 231.0332 405.4883 392.1251 276.4681 363.7348 357.3102<br />
Non-urgent 277.5164 307.4040 402.8719 289.9747 405.6547 411.9988<br />
Urgent 284.8046 361.1798 378.0401 222.8776 357.8870 387.3518
<strong>Driv<strong>in</strong>g</strong> behaviour <strong>in</strong> unexpected situations:<br />
Summary<br />
D<br />
riv<strong>in</strong>g can be very demand<strong>in</strong>g, especially <strong>in</strong> an urban environment. The road network<br />
<strong>in</strong> cities is often more complex than outside these cities, and it hosts many different<br />
road users: cars, pedestrians, cyclists, busses, trams, et cetera. Advanced Driver<br />
Assistance (ADA) Systems may contribute to mak<strong>in</strong>g driv<strong>in</strong>g safer, road use more efficient<br />
and the trip more comfortable. These systems support drivers <strong>in</strong> their driv<strong>in</strong>g task, prevent<strong>in</strong>g<br />
accidents by for <strong>in</strong>stance warn<strong>in</strong>g drivers when exceed<strong>in</strong>g the speed limit, or ma<strong>in</strong>ta<strong>in</strong><strong>in</strong>g a<br />
safe distance to other road users. The development of ADA Systems is ma<strong>in</strong>ly technologydriven,<br />
but designers could also benefit from understand<strong>in</strong>g what drivers need and how they<br />
<strong>in</strong>teract with the technology, additionally allow<strong>in</strong>g for human-centred development. For<br />
human-centred development of ADA Systems, it is crucial to understand driv<strong>in</strong>g behaviour<br />
both <strong>in</strong> normal circumstances and <strong>in</strong> reaction to unexpected and/ or dangerous situations. This<br />
thesis attempts to add new knowledge to what is already known about this by study<strong>in</strong>g the<br />
ways <strong>in</strong> which people drive on urban roads.<br />
A challeng<strong>in</strong>g aspect of driv<strong>in</strong>g <strong>in</strong> an urban environment is that drivers have to do many<br />
th<strong>in</strong>gs at the same time: know where they are go<strong>in</strong>g and how to get there, watch their speed,<br />
take turns, press the gas pedal and the brake, et cetera. Understand<strong>in</strong>g how people drive also<br />
entails understand<strong>in</strong>g how these different subtasks are organized and handled. An <strong>in</strong>fluential<br />
model developed <strong>in</strong> the early seventies of the previous century (Michon, 1971) describes the<br />
structure and characteristics of the driv<strong>in</strong>g task. Accord<strong>in</strong>g to this model, the driv<strong>in</strong>g task<br />
consists of three hierarchically ordered layers of subtasks.<br />
Strategic: concerned with trip goal and organization (e.g., dest<strong>in</strong>ation, route, time plann<strong>in</strong>g,<br />
target speed),<br />
Tactical: related to <strong>in</strong>teraction with the road and road users (e.g., mak<strong>in</strong>g turns,<br />
overtak<strong>in</strong>g, merg<strong>in</strong>g)<br />
Operational: concerned with operat<strong>in</strong>g the vehicle (e.g., brak<strong>in</strong>g, shift<strong>in</strong>g gear, steer<strong>in</strong>g)<br />
In normal driv<strong>in</strong>g, subtasks at one level are transferred top-down <strong>in</strong>to subtasks at the nearest<br />
lower level.<br />
Later Michon extended the model with bottom-up <strong>in</strong>teraction between task levels, which<br />
supposedly occurs <strong>in</strong> reaction to unexpected situations (Michon, 1985). For <strong>in</strong>stance, when a<br />
road is slippery and the car does not react normally to the steer<strong>in</strong>g wheel movements,<br />
rega<strong>in</strong><strong>in</strong>g control over the car (operational) is temporarily much more important than tak<strong>in</strong>g<br />
the planned turn (tactical) or gett<strong>in</strong>g to the dest<strong>in</strong>ation <strong>in</strong> time (strategic). This operational<br />
compensation can lead to changes at higher levels. Although the hierarchical model of the<br />
driv<strong>in</strong>g task (Michon, 1971, 1985) has been used by many to describe the structure of the<br />
driv<strong>in</strong>g task, research <strong>in</strong>to this bottom-up <strong>in</strong>fluence between levels of the driv<strong>in</strong>g task is not<br />
widespread. We aim to extend the current knowledge with this thesis. In the rema<strong>in</strong>der of this<br />
summary, the hierarchical model of the driv<strong>in</strong>g task (Michon, 1971, 1985) is referred to as<br />
‘the model’ or ‘the model of the driv<strong>in</strong>g task’.<br />
209
210 <strong>Driv<strong>in</strong>g</strong> <strong>Behaviour</strong> <strong>in</strong> <strong>Unexpected</strong> <strong>Situations</strong><br />
The thesis focuses on the question how drivers react to unexpected situations <strong>in</strong> an urban<br />
environment, and the effects of external aspects such as event urgency and mental workload.<br />
This was exam<strong>in</strong>ed <strong>in</strong> two large driv<strong>in</strong>g simulator experiments.<br />
First experiment<br />
The first large experiment tried to answer the question how people react to unexpected<br />
situations <strong>in</strong> an urban environment. In order to create these unexpected situations, it was first<br />
necessary to make sure that the participants had formed expectations about the situations to<br />
come. This experiment consisted of four drives, or trials, <strong>in</strong> each of which drivers crossed<br />
twenty <strong>in</strong>tersections. Drivers were asked to go straight on each <strong>in</strong>tersection. The traffic<br />
situations at all but two <strong>in</strong>tersections looked very much alike. As a result of this repetition,<br />
drivers built expectations about the route to follow, the <strong>in</strong>teractions with the other road users<br />
and the road, and how to respond to these repeat<strong>in</strong>g traffic situations. This showed <strong>in</strong> their<br />
driv<strong>in</strong>g behaviour and <strong>in</strong> their answers to questionnaires given to them after each trial.<br />
At two out of the eighty <strong>in</strong>tersections, someth<strong>in</strong>g unexpected happened. In one situation, a car<br />
from a left side street suddenly accelerated onto the road; <strong>in</strong> the other, the lead car braked<br />
suddenly. The seriousness of these safety-critical situations was varied between participants<br />
by deceleration force and distance between the vehicles after the event. The experiment was<br />
made more demand<strong>in</strong>g for half of the participants. Their mental workload was <strong>in</strong>creased by<br />
hav<strong>in</strong>g them perform a difficult arithmetic task (serial subtraction) out loud while driv<strong>in</strong>g. The<br />
driv<strong>in</strong>g simulator recorded the driv<strong>in</strong>g behaviour of the participants <strong>in</strong> terms of driv<strong>in</strong>g speed,<br />
distance to other road users and location on the road. Their mental workload was recorded<br />
us<strong>in</strong>g the Peripheral Detection Task.<br />
The model of the driv<strong>in</strong>g task (Michon, 1971, 1985) predicts that drivers compensate for the<br />
unexpected situations at the operational level, and that this translates <strong>in</strong>to a change <strong>in</strong> tactical<br />
subtasks. In other words, participants would have to switch from operational to tactical level<br />
<strong>in</strong> order to accurately brake or steer away to avoid an accident from happen<strong>in</strong>g, and this<br />
would temporarily lead to an adjusted driv<strong>in</strong>g style based on the type of compensation.<br />
<strong>Unexpected</strong> situations and compensation behaviour<br />
Participants <strong>in</strong>deed stated <strong>in</strong> the questionnaires that the trials with the unexpected situations<br />
were much less predictable than the regular trials, and their driv<strong>in</strong>g behaviour also <strong>in</strong>cluded<br />
compensation behaviour to the unexpected situations. They would brake hard and would drive<br />
more to the outside of their lane dur<strong>in</strong>g both unexpected situations. Furthermore, participants<br />
lowered their speed and <strong>in</strong>creased the distance between them and the car <strong>in</strong> front of them for<br />
some time after that car had startled them by brak<strong>in</strong>g suddenly. In other words, they<br />
temporarily stayed <strong>in</strong> the tactical mode to drive more cautiously after encounter<strong>in</strong>g an<br />
unexpected brak<strong>in</strong>g event. A more critical brak<strong>in</strong>g situation temporarily led to a more<br />
cautious driv<strong>in</strong>g style than a less critical brak<strong>in</strong>g event, and was also accompanied by more<br />
active brak<strong>in</strong>g than less critical events.
Summary 211<br />
The effects of mental workload<br />
The most strik<strong>in</strong>g effects were seen <strong>in</strong> the effects of mental workload. Drivers with high<br />
mental workload decelerated less than regular drivers when approach<strong>in</strong>g an <strong>in</strong>tersection.<br />
Unlike drivers without elevated mental workload, they drove <strong>in</strong> their habitual style after the<br />
less serious situations, and only reacted to situations that were very critical or unsafe. And<br />
when they did respond, they <strong>in</strong>itially reacted <strong>in</strong> the same cautious manner as did normal<br />
drivers, but fell back to their normal driv<strong>in</strong>g behaviour much faster than drivers who could<br />
completely focus on driv<strong>in</strong>g. F<strong>in</strong>ally, drivers with high workload also drove more to the left<br />
(<strong>in</strong>)side of their lane. These results all suggest the same: that drivers with higher workload are<br />
more occupied with their additional task and therefore pay less attention to the traffic<br />
situation, which leads to a more habitual driv<strong>in</strong>g style. They also do not respond noticeably to<br />
mildly urgent situations. However, when an unexpected situation is “urgent enough”, its effect<br />
appears to come through more strongly <strong>in</strong> mentally loaded drivers than <strong>in</strong> regular drivers.<br />
F<strong>in</strong>al experiment<br />
The first experiment revealed some highly <strong>in</strong>terest<strong>in</strong>g results, which led to a number of<br />
additional hypotheses about the effects of elevated mental workload on (the size and duration<br />
of) a change <strong>in</strong> driv<strong>in</strong>g style towards more defensive driv<strong>in</strong>g, and the effect of the urgency of<br />
safety-critical events. These additional hypotheses were tested <strong>in</strong> a f<strong>in</strong>al large driv<strong>in</strong>g<br />
simulator experiment.<br />
This second experiment was adjusted as compared to the first experiment. The four trials of<br />
the first experiment were extended and comb<strong>in</strong>ed <strong>in</strong>to two drives consist<strong>in</strong>g of three blocks of<br />
twenty <strong>in</strong>tersections each. As described, the first experiment only conta<strong>in</strong>ed difficult<br />
subtraction tasks to strongly elevate the mental workload of some of the drivers. To<br />
dist<strong>in</strong>guish more specifically between the effects of different levels of mental workload, an<br />
additional level was added to the setup. All participants had to perform one easy and one<br />
difficult subtraction task while driv<strong>in</strong>g. They all encountered the same type of safety-critical<br />
event, a brak<strong>in</strong>g lead vehicle, and this happened three times <strong>in</strong> total for each participant. To<br />
keep the experiment manageable, only two levels of urgency were set for the events.<br />
<strong>Behaviour</strong>al adaptation to the suddenly brak<strong>in</strong>g lead car<br />
It was found that drivers temporarily modified their speed after the sudden brak<strong>in</strong>g events,<br />
and that the urgency of the event did not affect this. When drivers could focus all of their<br />
attention on driv<strong>in</strong>g, they temporarily also <strong>in</strong>creased the distance to the (sometimes suddenly<br />
brak<strong>in</strong>g) lead car. However, while they were focuss<strong>in</strong>g on their subtraction task (no matter<br />
how difficult or easy this task was), they did not take these precautions.<br />
Task prioritization: keep<strong>in</strong>g safe driv<strong>in</strong>g manageable<br />
We found <strong>in</strong>terest<strong>in</strong>g differences <strong>in</strong> behavioural response to the vary<strong>in</strong>g levels of mental<br />
workload. The <strong>in</strong>termediate level of mental workload that was added to the setup of this<br />
experiment (easy subtraction task) gave rise to the largest effects on unsafe driv<strong>in</strong>g. Drivers
212 <strong>Driv<strong>in</strong>g</strong> <strong>Behaviour</strong> <strong>in</strong> <strong>Unexpected</strong> <strong>Situations</strong><br />
with this easy subtraction task drove much closer to their predecessor than drivers that could<br />
focus all of their attention on driv<strong>in</strong>g. <strong>Driv<strong>in</strong>g</strong> with the difficult task resulted <strong>in</strong> a headway<br />
that rema<strong>in</strong>ed <strong>in</strong> between these other two conditions. Drivers generally performed well on the<br />
easy subtraction task and much less on the difficult subtraction task (<strong>in</strong> terms of numbers of<br />
answers given and percentage of mistakes). This underperformance at the difficult subtraction<br />
task, comb<strong>in</strong>ed with their safer driv<strong>in</strong>g behaviour when do<strong>in</strong>g the difficult task, <strong>in</strong>dicates that<br />
they dropped effort <strong>in</strong> the difficult task and prioritized safe driv<strong>in</strong>g over perform<strong>in</strong>g well on<br />
the secondary task. Earlier studies had already shown that drivers might prioritize safe driv<strong>in</strong>g<br />
over secondary tasks when <strong>in</strong>structed to (e.g., De Waard, 1996) and when the external tasks<br />
are not relevant for safe driv<strong>in</strong>g (Cnossen et al., 2004). In addition to these f<strong>in</strong>d<strong>in</strong>gs, our<br />
experiments show that drivers also give priority to safe driv<strong>in</strong>g over external secondary tasks<br />
when the comb<strong>in</strong>ed task demands are too difficult to handle.<br />
Additional conclusions<br />
Hav<strong>in</strong>g drawn conclusions from both <strong>in</strong>dividual experiments, we also looked at the<br />
comb<strong>in</strong>ation of the two experiments and the related theory. This provided some additional<br />
conclusions on conscious driv<strong>in</strong>g versus automatic driv<strong>in</strong>g style, latent driver distraction, and<br />
the model of the driv<strong>in</strong>g task (Michon, 1971, 1985).<br />
Conscious control versus driv<strong>in</strong>g <strong>in</strong> an automatic fashion<br />
With sufficient experience, some daily multi-task<strong>in</strong>g activities can be performed <strong>in</strong> an<br />
automatic, habitual fashion, although they might sometimes still require conscious attention.<br />
This is also the case with driv<strong>in</strong>g. Perform<strong>in</strong>g (sub)tasks <strong>in</strong> an automatic manner may allow<br />
drivers to save attentional/ mental resources and become less tired. However, there always<br />
needs to be a good balance between automaticity and conscious control.<br />
Drivers were found to pay less attention to certa<strong>in</strong> crucial aspects of the driv<strong>in</strong>g task and drive<br />
<strong>in</strong> a more habitual manner when they are cognitively loaded. If any driver, cognitively loaded<br />
or not, faces an unexpected and safety-critical situation while driv<strong>in</strong>g <strong>in</strong> such an automatic<br />
manner, he or she should switch back to a more conscious control for the sake of safety. Our<br />
results show that drivers with <strong>in</strong>creased mental workload are highly reluctant to drop their<br />
habitual driv<strong>in</strong>g style. If they do f<strong>in</strong>ally change their driv<strong>in</strong>g style, it is only when the situation<br />
is highly safety-critical and urgent, and their cautionary response also lasts shorter than a<br />
response of normal drivers. Apparently it takes more to get people with high mental workload<br />
to abandon their automatic driv<strong>in</strong>g style and return to conscious driv<strong>in</strong>g than it does for<br />
people with normal workload. A certa<strong>in</strong> reluctance to totally drop all effort <strong>in</strong> the secondary<br />
task was noticeable <strong>in</strong> our experiments, which mimics everyday situations such as drivers on<br />
their (mobile) phone. The experiments also showed that the switch from automatized<br />
performance to conscious control is mostly restricted to tactical driv<strong>in</strong>g tasks, and occurs less<br />
<strong>in</strong> (generally highly automatized) operational subtasks.<br />
Latent driver distraction<br />
Accord<strong>in</strong>g to its def<strong>in</strong>ition, driver distraction occurs when there is a secondary task or activity<br />
which is given attention by the driver, through which driv<strong>in</strong>g performance dim<strong>in</strong>ishes.
Summary 213<br />
Traditionally, safety was determ<strong>in</strong>ed by measur<strong>in</strong>g the level of safety of the current situation,<br />
for <strong>in</strong>stance by us<strong>in</strong>g surrogate safety measures. However, this neglects the fact that be<strong>in</strong>g<br />
able to respond to an upcom<strong>in</strong>g safety hazard is also a part of safe driv<strong>in</strong>g. This thesis<br />
therefore <strong>in</strong>troduces the concept of latent driver distraction, a form of driver distraction that<br />
does not materialize <strong>in</strong> directly measurable unsafe driv<strong>in</strong>g behaviour, but does impair an<br />
adequate response to upcom<strong>in</strong>g safety hazards. We propose us<strong>in</strong>g the Peripheral Detection<br />
Task to assess this read<strong>in</strong>ess to respond and thus latent distraction.<br />
Reflections on the model of the driv<strong>in</strong>g task (Michon, 1971, 1985)<br />
Our experiments confirm the premise of the model of the driv<strong>in</strong>g task (Michon, 1971, 1985)<br />
that top-down <strong>in</strong>teraction between task levels temporarily changes <strong>in</strong>to bottom-up <strong>in</strong>teraction<br />
as a result of compensation for unexpected and safety-critical situations. However, it has not<br />
been established what exactly constitutes these unexpected situations and how unexpected or<br />
safety-critical these situations need to be. Our conclusions emphasize the relevance of this<br />
factor.<br />
Some of our results <strong>in</strong>dicate that the model can be extended when it comes to the impact of<br />
conscious attention on the part of the driver. If drivers focus on other th<strong>in</strong>gs than safe driv<strong>in</strong>g,<br />
bottom-up <strong>in</strong>teraction occurs only <strong>in</strong> response to highly dangerous situations <strong>in</strong> contrast to<br />
when drivers do pay full attention to driv<strong>in</strong>g. Additionally we found that the duration of this<br />
behavioural change is dependent on the level of mental workload that drivers have <strong>in</strong> such<br />
dual-task situations.<br />
In addition to describ<strong>in</strong>g the driv<strong>in</strong>g task, the model was <strong>in</strong>itially also proposed as a<br />
framework for a comprehensive driver model <strong>in</strong>clud<strong>in</strong>g cognition (Michon, 1985). A few<br />
comments can be made about us<strong>in</strong>g the model for this purpose. Researchers have to this po<strong>in</strong>t<br />
not agreed on the ways <strong>in</strong> which subtasks should be classified over the different task levels,<br />
and some subtasks seem to belong to more than one task level (e.g., speed control). Moreover,<br />
motivations and characteristics of drivers are not <strong>in</strong>cluded <strong>in</strong> the model but do play a large<br />
role <strong>in</strong> the way people perform their driv<strong>in</strong>g task. Some researchers have therefore suggested<br />
add<strong>in</strong>g a fourth level to the model, conta<strong>in</strong><strong>in</strong>g ‘goals for life and skills for liv<strong>in</strong>g’ (Hatakka et<br />
al., 2002). In addition to this, it rema<strong>in</strong>s unclear how related subtasks are connected between<br />
task levels and how they <strong>in</strong>fluence each other.<br />
We therefore conclude that the hierarchical model of the driv<strong>in</strong>g task (Michon, 1971, 1985),<br />
at this po<strong>in</strong>t only partly describes how people drive. A a framework for a comprehensive<br />
model of driv<strong>in</strong>g behaviour, the model of the driv<strong>in</strong>g task is <strong>in</strong>complete for the time be<strong>in</strong>g.<br />
However, with the aforementioned additions, the model still rema<strong>in</strong>s valuable for describ<strong>in</strong>g<br />
both the driv<strong>in</strong>g task itself and its complexity.
214 <strong>Driv<strong>in</strong>g</strong> <strong>Behaviour</strong> <strong>in</strong> <strong>Unexpected</strong> <strong>Situations</strong>
Rijgedrag <strong>in</strong> onverwachte situaties: Samenvatt<strong>in</strong>g<br />
A<br />
utorijden<br />
kan erg veeleisend zijn, met name <strong>in</strong> een stedelijke omgev<strong>in</strong>g. Het stedelijke<br />
weggennet<br />
is complex en er zijn veel verschillende typen weggebruikers: auto’s,<br />
fietsen,<br />
bussen, trams, et cetera. Geavanceerde bestuurdersondersteunende systemen,<br />
ook wel Advanced<br />
Driver Assistance (ADA) Systemen genoemd, zouden een bijdrage kunnen<br />
leveren om autorijden veiliger te maken, de weg efficiënter te benutten en de reis<br />
comfortabeler te maken. Deze systemen ondersteunen autobestuurders <strong>in</strong> hun rijtaak, waarbij<br />
ze aanrijd<strong>in</strong>gen voorkomen door bijvoorbeeld een waarschuw<strong>in</strong>g te geven als bestuurders te<br />
hard rijden of een veilige afstand tot andere weggebruikers aan te houden. De ontwikkel<strong>in</strong>g<br />
van ADA Systemen wordt voornamelijk gestimuleerd door ontwikkel<strong>in</strong>gen <strong>in</strong> de technologie.<br />
Indien ontwerpers van deze ADA Systemen zouden begrijpen wat bestuurders nodig hebben<br />
en hoe ze met de technologie omgaan, zou de gebruikersgerichte ontwikkel<strong>in</strong>g van de<br />
systemen hiervan kunnen profiteren. Voor een gebruikersgerichte ontwikkel<strong>in</strong>g is het cruciaal<br />
om te weten hoe mensen rijden, zowel <strong>in</strong> normale omstandigheden als <strong>in</strong> reactie op<br />
gevaarlijke en/ of onverwachte verkeerssituaties. Dit proefschrift doet een pog<strong>in</strong>g kennis toe<br />
te voegen aan wat al bekend is over deze gebruikersgerichte ontwikkel<strong>in</strong>g van ADA<br />
systemen, door te bestuderen hoe mensen op stedelijke wegen rijden.<br />
Een uitdagend aspect van autorijden <strong>in</strong> een stedelijke omgev<strong>in</strong>g is dat bestuurders veel d<strong>in</strong>gen<br />
tegelijk moeten doen. Ze moeten weten waar ze zijn, waar ze naartoe gaan en hoe ze daar<br />
moeten komen, hun snelheid <strong>in</strong> de gaten houden, de juiste afslag nemen, het gaspedaal en de<br />
rem bedienen, et cetera. Begrip over hoe mensen rijden v<strong>in</strong>dt mede zijn basis <strong>in</strong> kennis over<br />
de organisatie en uitvoer<strong>in</strong>g van deze verschillende soorten subtaken. In de jaren ’70 is er een<br />
<strong>in</strong>vloedrijk model voorgesteld dat de structuur en een aantal eigenschappen van de rijtaak<br />
omschrijft (Michon, 1971). Volgens dit model bestaat de rijtaak uit drie hiërarchisch<br />
geordende niveaus van subtaken:<br />
Strategisch: heeft betrekk<strong>in</strong>g op doel en organisatie van de reis (bijvoorbeeld bepalen van<br />
bestemm<strong>in</strong>g, route, en doelsnelheid)<br />
Tactisch: heeft betrekk<strong>in</strong>g op de <strong>in</strong>teractie met de weg en andere weggebruikers<br />
(bijvoorbeeld een afslag nemen, <strong>in</strong>halen, <strong>in</strong>voegen)<br />
Operationeel: heeft betrekk<strong>in</strong>g op het besturen van het voertuig (bijvoorbeeld remmen,<br />
schakelen, sturen)<br />
Bij normaal autorijden worden subtaken op een bepaald niveau top-down doorvertaald naar<br />
taken op het dichtstbijzijnde lager gelegen niveau.<br />
Michon breidde het model later uit met bottom-up <strong>in</strong>teractie tussen de taakniveaus, hetgeen<br />
volgens de verwacht<strong>in</strong>g zou gebeuren <strong>in</strong> reactie op onverwachte situaties (Michon, 1985). Als<br />
een weg bijvoorbeeld glad is en de auto niet normaal reageert op de stuurbeweg<strong>in</strong>gen, is het<br />
tijdelijk veel belangrijker om weer controle over de auto te krijgen (operationeel) dan om de<br />
geplande afslag te nemen (tactisch) of om op tijd op de bestemm<strong>in</strong>g aan te komen<br />
(strategisch). Deze operationele compensatie kan leiden tot verander<strong>in</strong>gen op hogere<br />
taakniveaus. Hoewel het model veelvuldig toegepast wordt om de structuur van de rijtaak te<br />
omschrijven, is er nog geen uitgebreid onderzoek gedaan naar deze bottom-up <strong>in</strong>vloed tussen<br />
215
216 <strong>Driv<strong>in</strong>g</strong> <strong>Behaviour</strong> <strong>in</strong> <strong>Unexpected</strong> <strong>Situations</strong><br />
de taakniveaus van de rijtaak. Dit proefschrift doet een pog<strong>in</strong>g de huidige stand van kennis<br />
hierover uit te breiden. In de rest van deze samenvatt<strong>in</strong>g noemen we dit model het model van<br />
de rijtaak.<br />
Dit proefschrift richt zich op de vraag hoe bestuurders reageren op onverwachte situaties <strong>in</strong> de<br />
stad, en welke effecten externe aspecten, zoals mentale werkbelast<strong>in</strong>g en de ernst van de<br />
onverwachte situatie, hierop hebben. Dit is onderzocht aan de hand van twee grote<br />
rijsimulator experimenten.<br />
Eerste experiment<br />
Het eerste grote rijsimulator experiment was bedoeld om een antwoord te v<strong>in</strong>den op de vraag<br />
hoe mensen reageren op onverwachte verkeerssituaties <strong>in</strong> de stad. Om ervoor te zorgen dat er<br />
onverwachte situaties ontstonden, moesten we eerst zorgen dat proefpersonen verwacht<strong>in</strong>gen<br />
vormden over de situaties waar<strong>in</strong> zij reden. Dit experiment bestond uit vier ritten waar<strong>in</strong> elke<br />
keer tw<strong>in</strong>tig kruispunten na elkaar werden overgestoken. Aan de deelnemers werd gevraagd<br />
om elke kruispunt rechtdoor over te steken. Op twee na leken alle tachtig kruispunten sterk op<br />
elkaar. Door deze herhal<strong>in</strong>g bouwden de deelnemers verwacht<strong>in</strong>gen op over de te volgen<br />
route, de <strong>in</strong>teracties met de andere weggebruikers en de weg, en over hoe te reageren op deze<br />
zich herhalende situaties. Dit bleek <strong>in</strong> hun rijgedrag en <strong>in</strong> de antwoorden die ze gaven op de<br />
vragenlijst die na elke rit aan ze werd gegeven.<br />
Op twee van de tachtig kruispunten gebeurde iets onverwachts. In de ene situatie trok een<br />
auto uit een l<strong>in</strong>ker zijstraat snel op en reed de weg op; <strong>in</strong> de andere remde de voorligger<br />
plotsel<strong>in</strong>g hard. De ernst van deze situaties werd tussen proefpersonen gevarieerd. Het<br />
experiment werd voor de helft van de proefpersonen nog moeilijker gemaakt. Hun mentale<br />
werkbelast<strong>in</strong>g werd verhoogd doordat ze hardop <strong>in</strong>gewikkelde rekensommen moesten maken<br />
(herhaald een getal van een ander groot getal aftrekken). De rijsimulator registreerde het<br />
rijgedrag van de proefpersonen: hun rijsnelheid, afstand tot andere weggebruikers en locatie<br />
op de weg. De mentale werkbelast<strong>in</strong>g werd gemeten met behulp van de Perifere Detectie<br />
Taak.<br />
Het model van de rijtaak (Michon, 1971, 1985) voorspelt dat bestuurders op operationeel<br />
niveau compenseren voor de omschreven onverwachte situaties, en dat dit zich zou<br />
doorvertalen naar een verander<strong>in</strong>g <strong>in</strong> tactische subtaken. In andere woorden, proefpersonen<br />
moesten de operationele taken laten doorwerken <strong>in</strong> de tactische rijtaken om op een zodanige<br />
manier te remmen of weg te sturen dat ze een aanrijd<strong>in</strong>g zouden voorkomen, en dit zou zich<br />
tijdelijk vertalen <strong>in</strong> een aangepaste rijstijl, afhankelijk van het type compensatie-acties.<br />
Onverwachte situaties en compensatie gedrag<br />
Proefpersonen gaven <strong>in</strong>derdaad aan dat ze de ritten met de onverwachte situaties een stuk<br />
m<strong>in</strong>der voorspelbaar vonden dan de normale ritten. Hun rijgedrag liet ook zien dat ze<br />
compenseerden voor de onverwachte situaties. Ze remden hard en reden meer aan de<br />
buitenkant van hun rijbaan tijdens beide onverwachte situaties. Na de plotsel<strong>in</strong>ge remactie van<br />
de voorligger pasten de proefpersonen bovendien tijdelijk hun snelheid naar beneden aan en<br />
lieten ze een grotere afstand tussen henzelf en de auto voor hen bestaan. Met andere woorden,<br />
ze bleven tijdelijk voorzichtiger rijden na deze onverwachte situatie. Na een ernstiger situatie
Samenvatt<strong>in</strong>g 217<br />
reden mensen nog voorzichtiger dan na een m<strong>in</strong>der ernstige situatie, en bovendien remden<br />
bestuurders dan ook vaker.<br />
De effecten van mentale werkbelast<strong>in</strong>g<br />
De opvallendste resultaten waren te zien bij de effecten van mentale werkbelast<strong>in</strong>g.<br />
Bestuurders die een hoge mentale werkbelast<strong>in</strong>g hadden remden m<strong>in</strong>der af als ze een<br />
kruispunt naderden dan normale bestuurders. Anders dan bestuurders die met normale<br />
werkbelast<strong>in</strong>g reden, bleven ze na m<strong>in</strong>der ernstige situaties met deze uit gewenn<strong>in</strong>g ontstane<br />
rijstijl rijden, en ze reageerden alleen op situaties die erg kritiek of onveilig waren. En als ze<br />
toch reageerden deden ze dat <strong>in</strong>itieel wel op dezelfde voorzichtige manier als gewone<br />
bestuurders, maar vielen ze sneller weer terug naar hun eerste rijstijl dan diezelfde normale<br />
bestuurders. Ten slotte bleek ook dat bestuurders met hoge mentale werklast meer aan de<br />
l<strong>in</strong>ker (b<strong>in</strong>nen)kant van hun rijbaan reden. Deze resultaten wijzen allemaal <strong>in</strong> dezelfde<br />
richt<strong>in</strong>g: dat bestuurders die een hoge mentale werkbelast<strong>in</strong>g hebben mentaal bezig zijn met<br />
de belastende taak en hun rijstijl meer op gewenn<strong>in</strong>g baseren omdat ze hun aandacht aan<br />
andere zaken dan autorijden en hun directe omgev<strong>in</strong>g besteden. Ze reageren ook niet<br />
zichtbaar op situaties die niet erg kritiek zijn. Als een onverwachte situatie echter “onveilig<br />
genoeg” is, lijkt het effect daarvan echter toch door te dr<strong>in</strong>gen, en zelfs sterker dan bij<br />
autobestuurders die geen hoge mentale werklast hebben.<br />
Tweede experiment<br />
Het eerste experiment leverde enkele zeer <strong>in</strong>teressante resultaten op, die leidden tot een aantal<br />
hypotheses over de effecten van verhoogde mentale werkbelast<strong>in</strong>g op (de grootte en duur van)<br />
een voorzichtiger rijstijl, en de effecten van de ernst van een onveilige situatie. Deze<br />
aanvullende hypotheses zijn vervolgens getest <strong>in</strong> een tweede uitgebreid rijsimulator<br />
experiment.<br />
De opzet van dit uite<strong>in</strong>delijke experiment werd aangepast ten opzichte van het eerste<br />
experiment. De vier ritten uit het eerste experiment werden uitgebreid en gecomb<strong>in</strong>eerd tot<br />
twee ritten, bestaand uit drie delen met elk tw<strong>in</strong>tig kruispunten. Zoals omschreven bevatte het<br />
eerste experiment alleen een moeilijk taakniveau voor de rekentaak. Om onderscheid te<br />
kunnen maken tussen de effecten van verschillende niveaus van mentale werkbelast<strong>in</strong>g werd<br />
een extra moeilijkheidsniveau toegevoegd aan de opzet. Proefpersonen moesten nu een<br />
gemakkelijke en een moeilijke rekentaak uitvoeren <strong>in</strong> elke rit. Ze kwamen nu allemaal<br />
dezelfde onverwachte situatie tegen, namelijk een plotsel<strong>in</strong>g remmende voorligger, en dit<br />
gebeurde <strong>in</strong> totaal drie keer voor elke deelnemer. Om het experiment beheersbaar te houden<br />
werd er gekozen voor twee vaste niveaus van ernst voor alle gebeurtenissen.<br />
Gedragsaanpass<strong>in</strong>g na de plotsel<strong>in</strong>g remmende voorligger<br />
Uit de resultaten bleek dat deelnemers tijdelijk hun snelheid aanpasten na de plotsel<strong>in</strong>ge<br />
remsituaties, en dat de ernst van de situaties hierop geen effect hadden. Als bestuurders hun<br />
volledige aandacht op het autorijden konden richten lieten ze ook tijdelijk wat meer afstand<br />
tussen henzelf en de auto voor hen (die dus af en toe plotsel<strong>in</strong>g remde) vallen. Als ze echter<br />
een rekentaak moesten uitvoeren, ongeacht hoe moeilijk deze taak was, namen ze deze<br />
voorzorgsmaatregelen niet.
218 <strong>Driv<strong>in</strong>g</strong> <strong>Behaviour</strong> <strong>in</strong> <strong>Unexpected</strong> <strong>Situations</strong><br />
Prioriteren van taken: hanteerbaar houden van veilig rijden<br />
We ontdekten <strong>in</strong> onze resultaten een aantal <strong>in</strong>teressante verschillen <strong>in</strong> gedrag tussen de<br />
verschillende niveaus van mentale werkbelast<strong>in</strong>g. Het middelste niveau van mentale werklast<br />
dat was toegevoegd aan de experimentele opzet ten opzichte van het eerste experiment<br />
(gemakkelijke rekentaak) bleek de grootste effecten op onveilig rijgedrag te hebben.<br />
Deelnemers met deze gemakkelijke rekentaak reden veel dichter bij hun voorligger dan<br />
deelnemers die zich volledig op het autorijden konden richten. Autorijden met de moeilijke<br />
rekentaak leidde er toe dat deelnemers een afstand aanhielden die het midden hield tussen<br />
volledig gefocust autorijden en autorijden met de gemakkelijke rekentaak. Over het algemeen<br />
presteerden de autobestuurders goed op de gemakkelijke rekentaak en een stuk slechter op de<br />
moeilijke rekentaak (gemeten als het aantal gegeven antwoorden en het percentage gemaakte<br />
fouten). Deze onderprestatie op de moeilijke extra taak, gecomb<strong>in</strong>eerd met het feit dat ze met<br />
die moeilijke taak veiliger reden dan met de gemakkelijke taak waar ze beter op presteerden,<br />
wijst er op dat ze m<strong>in</strong>der energie stopten <strong>in</strong> het uitvoeren van hun moeilijke rekentaak en<br />
veilig autorijden ten koste lieten gaan van hun prestatie op die extra taak. Uit eerdere studies<br />
was al gebleken dat autobestuurders veilig autorijden boven externe taken laten gaan als ze<br />
daartoe geïnstrueerd worden (De Waard, 1996) en als de externe taak niet relevant is voor<br />
veilig autorijden (Cnossen et al., 2004). In aanvull<strong>in</strong>g hierop hebben onze experimenten<br />
aangetoond dat autobestuurders ook voorrang geven aan veilig rijden boven het uitvoeren van<br />
een externe taak <strong>in</strong>dien de taken samen te moeilijke worden om te hanteren.<br />
Aanvullende conclusies<br />
We hebben onze conclusies niet slechts gebaseerd op de resultaten van de afzonderlijke<br />
experimenten, maar hebben ook gekeken naar de comb<strong>in</strong>atie van beide experimenten en de<br />
theorie die er achter zit. Dit leverde een aantal aanvullende conclusies op, over aandacht voor<br />
het rijden tegenover autorijden uit gewenn<strong>in</strong>g, over latente afleid<strong>in</strong>g tijdens het rijden, en over<br />
het model van de rijtaak (Michon, 1971, 1985).<br />
Bewuste controle versus automatisch rijgedrag<br />
Met voldoende oefen<strong>in</strong>g kan een groot aantal dagelijkse bezigheden die uit meerdere<br />
handel<strong>in</strong>gen bestaan vrijwel automatisch worden uitgevoerd, terwijl andere handel<strong>in</strong>gen<br />
bewust aandacht nodig hebben. Dit geldt ook voor autorijden. Taken uitvoeren op een<br />
automatische manier kan er voor zorgen dat bestuurders m<strong>in</strong>der mentale capaciteit gebruiken<br />
en m<strong>in</strong>der vermoeid worden. Er moet echter altijd een goede balans blijven tussen<br />
automatisch gedrag en bewuste controle.<br />
We vonden <strong>in</strong> onze resultaten dat bestuurders de neig<strong>in</strong>g hebben om m<strong>in</strong>der aandacht te<br />
besteden aan bepaalde cruciale rijtaken en meer gewoontegedreven rijgedrag vertoonden als<br />
ze mentaal belast zijn. Voor elke bestuurder, cognitief belast of niet, geldt dat het aan te<br />
bevelen is om bewuster de controle over de rijtaak te nemen wanneer er een onverwachte,<br />
gevaarlijke situatie gebeurt, om zo de situatie veilig en efficiënt af te handelen. Onze<br />
resultaten laten zien dat bestuurders met verhoogde mentale werkbelast<strong>in</strong>g hun<br />
gewoontegedrag niet snel loslaten. Als zij hun rijstijl dan uite<strong>in</strong>delijk veranderen, is dat alleen<br />
bij een situatie die zeer kritiek en urgent is, en hun voorzichtige reactie duurt ook korter dan<br />
als ze niet mentaal belast zouden zijn. Blijkbaar vergt het nog meer van mensen met een hoge
Samenvatt<strong>in</strong>g 219<br />
mentale werkbelast<strong>in</strong>g om hun automatische rijstijl om te zetten naar bewust autorijden dan<br />
het vraagt van mensen die niet mentaal belast zijn. Onze experimenten lieten zien dat mensen<br />
niet erg geneigd zijn om helemaal geen energie meer <strong>in</strong> de extra taak te steken. Dit lijkt<br />
overeen te komen met hoe het gaat <strong>in</strong> echte situaties, zoals wanneer bestuurders (mobiel) aan<br />
het bellen zijn. Ten slotte laten de experimenten ook zien dat de overgang van rijden op de<br />
automatische piloot naar bewuste controle met name voorbehouden is aan tactische rijtaken,<br />
en m<strong>in</strong>der voorkomt <strong>in</strong> (over het algemeen zeer sterk geautomatiseerde) operationele taken.<br />
Latente afleid<strong>in</strong>g tijdens het rijden<br />
Volgens de def<strong>in</strong>itie ontstaat afleid<strong>in</strong>g tijdens het rijden wanneer er een externe taak of<br />
activiteit is die aandacht krijgt van de bestuurder, waardoor de bestuurder m<strong>in</strong>der goed gaat<br />
rijden. Traditioneel werd er bij het vaststellen van of de bestuurder m<strong>in</strong>der goed reed gekeken<br />
naar de veiligheid van de huidige situatie. Dit laat echter buiten beschouw<strong>in</strong>g dat een<br />
onderdeel van veilig autorijden ook is om veilig te reageren op een mogelijke gevaarlijke<br />
situatie. Dit proefschrift <strong>in</strong>troduceert daarom een nieuw concept, latente afleid<strong>in</strong>g tijdens het<br />
rijden, een vorm van afleid<strong>in</strong>g die niet direct meetbaar tot uit<strong>in</strong>g komt <strong>in</strong> onveilig rijden maar<br />
<strong>in</strong> een beperkte mogelijkheid om adequaat te reageren op een mogelijke gevaarlijke situatie.<br />
We stellen voor om de Perifere Detectie Taak te gebruiken voor het vaststellen van deze<br />
mogelijkheid om te reageren, en dus van latente afleid<strong>in</strong>g tijdens het rijden.<br />
Het hiërarchische model van de rijtaak (Michon, 1971, 1985)<br />
Onze resultaten bevestigen de premisse van het model van de rijtaak (Michon, 1971, 1985)<br />
dat top-down <strong>in</strong>teractie tussen taakniveaus tijdelijk verandert naar bottom-up <strong>in</strong>teractie<br />
wanneer een bestuurder moet compenseren voor een onverwachte situatie. Het is echter nog<br />
niet duidelijk wat precies de bepalende factoren zijn van deze onverwachte situaties, en hoe<br />
onverwacht ze dienen te zijn om dit effect te hebben. Onze conclusies benadrukken de<br />
relevantie van deze factor.<br />
Enkele van onze resultaten wijzen er op dat het model van de rijtaak uitgebreid kan worden<br />
waar het gaat om de impact van bewuste aandacht van de bestuurder. Wanneer bestuurders<br />
bezig zijn met andere d<strong>in</strong>gen dan veilig rijden ontstaat bottom-up <strong>in</strong>teractie alleen bij zeer<br />
ernstige situaties, <strong>in</strong> tegenstell<strong>in</strong>g tot normale bestuurders. Hoe lang deze wijzig<strong>in</strong>g duurt is<br />
afhankelijk van het niveau van mentale werkbelast<strong>in</strong>g van de bestuurder <strong>in</strong> dit soort<br />
dubbeltaaksituaties.<br />
Behalve het omschrijven van de rijtaak was het model <strong>in</strong>itieel ook bedoeld als raamwerk voor<br />
een allesomvattend model van hoe mensen autorijden (Michon, 1985). Een aantal<br />
opmerk<strong>in</strong>gen hierover is op zijn plaats. Om te beg<strong>in</strong>nen zijn wetenschappers het niet eens<br />
over hoe de verschillende subtaken over de taakniveaus verdeeld moeten worden, en lijken<br />
sommige taken b<strong>in</strong>nen meer dan één taakniveau thuis te horen (bijvoorbeeld<br />
snelheidsgedrag). Bovendien spelen motivaties en eigenschappen van autobestuurders <strong>in</strong> de<br />
praktijk een grote rol <strong>in</strong> hoe ze rijden, maar zijn deze niet opgenomen <strong>in</strong> het model. Het is<br />
daarom door anderen voorgesteld om een extra niveau bovenop het strategische niveau toe te<br />
voegen, dat ‘Levensdoelen en lange termijn vaardigheden’ omvat (Hatakka et al., 2002).<br />
Daarnaast is het nog niet duidelijk hoe vergelijkbare taken tussen verschillende taakniveaus<br />
verbonden zijn en door elkaar beïnvloed worden.
220 <strong>Driv<strong>in</strong>g</strong> <strong>Behaviour</strong> <strong>in</strong> <strong>Unexpected</strong> <strong>Situations</strong><br />
We concluderen daarom dat het hiërarchische model van de rijtaak (Michon, 1971, 1985) <strong>in</strong><br />
de huidige staat slechts ten dele omschrijft hoe mensen autorijden. Het model is bovendien <strong>in</strong><br />
zijn huidige staat een <strong>in</strong>compleet raamwerk voor een allesomvattend model. Met de<br />
toevoeg<strong>in</strong>gen aan het model die <strong>in</strong> het proefschrift zijn voorgesteld kan het model wel<br />
waardevol zijn <strong>in</strong> het omschrijven van de rijtaak en zijn complexiteit.
Dankwoord<br />
Het dankwoord schijnt het onderdeel van een proefschrift te zijn dat het meest gelezen wordt,<br />
de paar pag<strong>in</strong>a’s die - hopelijk! - een doorkijkje kunnen bieden naar wat er zich onder de<br />
motorkap van het persoonlijke promotietraject heeft afgespeeld. Voor de promovendus is het<br />
dankwoord bovendien de enige plaats <strong>in</strong> het proefschrift waar niet alleen de logische<br />
redener<strong>in</strong>gen en getoetste resultaten maar ook de persoonlijke ervar<strong>in</strong>gen en gevoelens mogen<br />
doorkl<strong>in</strong>ken. En van achter mijn bureau kan ik de lezer meegeven dat het schrijven van een<br />
dankwoord, een activiteit waar ik al geruime tijd naar uitkeek omdat dat betekende dat het<br />
proefschrift af zou zijn, een heerlijke ervar<strong>in</strong>g is!<br />
Promoveren is voor vrijwel iedere promovendus bij tijd en wijle een eenzaam proces, maar<br />
gelukkig zijn er veel mensen geweest die mijn rit op hun eigen manier hebben weten te<br />
verlichten. Een aantal van deze mensen wil ik <strong>in</strong> het bijzonder bedanken voor hun wijze raad,<br />
<strong>in</strong>spiratie of belangrijke momenten van plezier bij het afleggen van deze weg.<br />
Bart, bedankt voor je steun, <strong>in</strong>spiratie en wijze raad, en de tweewekelijkse overleggen waar<strong>in</strong><br />
we konden sparren over ‘de volgende stap’. Jij was de brandstof die me vaak het beslissende<br />
zetje gaf om door te gaan. Je scherpe blik en je vertrouwen hebben mij laten zien dat het<br />
mogelijk was om de e<strong>in</strong>dstreep te halen - daar ben ik je erg dankbaar voor.<br />
Karel, jij was als koplampen <strong>in</strong> de mist - op momenten dat ik het <strong>in</strong>zicht (nog) even niet had<br />
wist jij altijd weer ergens een lichtpunt vandaan te toveren. Het ‘pareltje’ dat de def<strong>in</strong>itieve<br />
omslag betekende <strong>in</strong> mijn promotie was zonder jou misschien onderbelicht gebleven. De<br />
ijzersterke comb<strong>in</strong>atie van je humor en kritische eerlijkheid hebben me door menig<br />
<strong>in</strong>gewikkeld proces geleid. Heel erg bedankt!<br />
Richard, als aanjager en <strong>in</strong>spirator van dit project heb je je hart <strong>in</strong> het onderzoek gelegd en<br />
vele uren aan waardevolle begeleid<strong>in</strong>g geboden. Je bent daarmee de richt<strong>in</strong>gsborden van het<br />
onderzoek geweest: steeds wees je me weer wat het e<strong>in</strong>ddoel was en hoe ik daar kon komen.<br />
Bedankt voor je begeleid<strong>in</strong>g.<br />
Ik zat <strong>in</strong> de bijzondere positie dat ik ook nog een relatief grote groep externe begeleiders had<br />
die me steeds vakkundig hebben geadviseerd. Jeroen, Marika, Kerry, Peter, Wim, Rudi, jullie<br />
hebben me vaak nieuwe <strong>in</strong>zichten gegeven, en dankzij jullie gezamenlijke vermogen om<br />
verder dan de eerstvolgende hoek te kijken hebben jullie als een soort WILLWARN systeem<br />
(http://www.prevent-ip.org/willwarn) theoretische aanvar<strong>in</strong>gen weten te voorkomen.<br />
De proefpersonen <strong>in</strong> mijn experimenten hebben er voor gezorgd dat ik steeds stil stond bij wat<br />
er nou écht gebeurde <strong>in</strong> menselijk rijgedrag. Soms voelde het op het moment zelf alsof het<br />
tempo er uit g<strong>in</strong>g als ik een afwijkende bestuurder ontdekte, zoals bij een snelheidsdrempel,<br />
maar ik ben jullie dankbaar dat jullie je tijd en energie hebben <strong>in</strong>gezet om een kle<strong>in</strong> stukje<br />
aanvullende kennis over rijgedrag boven tafel te halen.<br />
221
222 <strong>Driv<strong>in</strong>g</strong> <strong>Behaviour</strong> <strong>in</strong> <strong>Unexpected</strong> <strong>Situations</strong><br />
Gedurende mijn promotietraject heb ik deel mogen uitmaken van drie bijzondere groepen<br />
collega’s: bij de UT, TNO, en de TU. Als een autoradio boden jullie vaak een goede<br />
comb<strong>in</strong>atie van vermaak en nuttige <strong>in</strong>formatie. Bedankt voor de lunches, thee,<br />
p<strong>in</strong>gponguitdag<strong>in</strong>gen, discussies en gezelligheid. Leonie, al zaten we dan niet bij dezelfde<br />
vakgroep, het voelde toch alsof je een directe collega was en het was leuk en nuttig om<br />
regelmatig onze TRANSUMO-reis af te stemmen. Op elke plek heb ik weer fijne<br />
secretaresses mogen treffen die altijd met raad en daad klaar stonden: bedankt voor jullie<br />
hulp! TRAIL Office, jullie waren super waardevol met de zeer geduldige beantwoord<strong>in</strong>g van<br />
mijn vele vragen over de regels omtrent de bested<strong>in</strong>g van prijzengeld, offertes, opmaak,<br />
masterclasses, etc. Al mijn kamergenoten (Bas, Tom, Richard, Ellen, Jeroen, Thomas, Chris<br />
en Femke) hebben allemaal een deeltje van de reis van dichtbij meegemaakt, en dat is mij <strong>in</strong><br />
ieder geval steeds goed bevallen. My dear AIDA friends: you also deserve your own l<strong>in</strong>es <strong>in</strong><br />
these acknowledgements. J<strong>in</strong>g, I am pretty sure I will never reach your level of<br />
Museumjaarkaart use, but you <strong>in</strong>spired me to at least try. Mohamed, I hope to see the place<br />
where the White Nile and the Blue Nile jo<strong>in</strong> together one day, and maybe you can be my<br />
(Dutch speak<strong>in</strong>g?) guide. Ook Wytze verdient het om hier apart genoemd te worden. Je<br />
positieve <strong>in</strong>steek en niet aflatende ondersteun<strong>in</strong>g hebben mijn eerste grote rijsimulatorexperiment<br />
aanzienlijk vlotter en vrolijker gemaakt. Mede dankzij jou hebben we<br />
daadwerkelijk kunnen draaien! Met veel plezier werk ik s<strong>in</strong>ds augustus 2010 bij het<br />
Kennis<strong>in</strong>stituut voor Mobiliteitsbeleid (KiM), waar ik ook een bijzonder <strong>in</strong>spirerende, heel<br />
erg gezellige en <strong>in</strong>houdelijk zeer sterke groep collega’s heb getroffen.<br />
Alle collega’s van de afgelopen jaren: heel erg bedankt.<br />
Kirsten: Koffie? Ik blijf toch maar bij thee! Van een bakje tot een sloot, van student tot steun,<br />
van ‘hoe moet dat nou’ tot ‘hora est’… Je hebt de rit kleur gegeven. Blijf zoals je bent!<br />
Marleen, jij was ontegenzeggelijk de alarmcentrale die altijd klaar stond met ondersteun<strong>in</strong>g,<br />
maar ook de vrolijke collega met wie ik ons beider successen kon vieren. Dat we elkaar na<br />
jaren weer tegenkwamen <strong>in</strong> Enschede mag dan toeval heten, dat je me straks bijstaat als mijn<br />
paranimf is dat absoluut niet. Ik ben je erg dankbaar.<br />
Lieve, grappige, slimme, serieuze en bijzondere vrienden, you all pimped my ride. Een paar<br />
speciale gevallen licht ik er graag uit. Mijn Gron<strong>in</strong>ger juweeltjes Aike, Gerda, Trieu, Arne,<br />
Marc, Saskia, Gabriël en Robert wil ik bedanken voor de vrolijke afleid<strong>in</strong>g, de scherpe<br />
discussies en de absurde plannen. Anita en Anke, jullie maakten Enschede van mijn<br />
woonplaats tot mijn thuis, maar ook <strong>in</strong> mijn nieuwe thuis <strong>in</strong> het westen van het land horen<br />
jullie er bij. Oók uit Enschede komt een speciale groep vrouwen met wie ik het promotieleven<br />
kon delen: de GW-aio’s (aka de JAAARclub). Fenne, Renske, Marieke en de rest, ik zal<br />
de avondjes met chocola, films, gesprekken over mannen (of nóóit meer mannen) en de<br />
logeerpartijen niet licht vergeten, en ik hoop dat we ze volhouden nu onze levens en<br />
woonplaatsen verder uit elkaar liggen.<br />
Rosal<strong>in</strong>de, met jouw artistieke talent ben je duidelijk veel meer dan een lijnentrekker. Bedankt<br />
voor de aandacht en energie die je hebt geïnvesteerd <strong>in</strong> het doorgronden van mijn proefschrift<br />
en het creëren van de omslagillustratie. Veel succes <strong>in</strong> je nieuwe carrière als illustrator!<br />
Rhowena, met je scherpe blik, leergierigheid, enthousiasme en mensenkennis heb jij een van<br />
mijn lastige experimenten als een soort verkeersregelaar <strong>in</strong> goede banen weten te leiden. Dat<br />
heb je voortreffelijk gedaan. Heel erg bedankt voor je hulp en je vrolijke <strong>in</strong>breng!
Dankwoord 223<br />
Familie Van der Meij, we hebben veel gezellige uren vol boeiende gesprekken en sportieve<br />
activiteiten gehad de afgelopen jaren. Via verschillende (soms zelfs <strong>in</strong>ternationale)<br />
omzwerv<strong>in</strong>gen komen onze wegen als <strong>in</strong> een verkeersknooppunt uite<strong>in</strong>delijk steeds weer<br />
mooi bij elkaar uit.<br />
Lieve oma, het feit dat iedereen <strong>in</strong> mijn omgev<strong>in</strong>g u kent, via de webcam, persoonlijk, of door<br />
mijn vele (vele, vele) verhalen, geeft al aan hoe belangrijk u bent voor mij. We noemen u<br />
altijd gekscherend het opperhoofd, maar voor mij bent u het navigatiesysteem (de ‘Bea’) dat<br />
me elke keer weer vertelt hoe ik thuis kan komen. Ik ben ongelooflijk trots dat ik dit<br />
e<strong>in</strong>dresultaat aan u kan laten zien!<br />
Ha Anne! Wat ben ik blij dat we weer <strong>in</strong> dezelfde stad wonen (of toch <strong>in</strong>eens weer<br />
woonden?). Je bent lief, slim, stoer, verrassend, humoristisch en zorgzaam, en daarmee steeds<br />
weer <strong>in</strong>spirerend. Bij jou zijn voelt als een heerlijke pitstop waar<strong>in</strong> ik weer helemaal kan<br />
opladen. We zullen er altijd voor elkaar zijn. Ik ben heel blij dat jij ook een fijne pitstop hebt<br />
gevonden <strong>in</strong> Jonne, die meteen naadloos <strong>in</strong> het team paste.<br />
Papa en mama, jullie zijn altijd het vertrekpunt. Dat het niet altijd vanzelfsprekend leek dat<br />
jullie straks op die eerste rij zitten maakt mijn gevoel van dankbaarheid eigenlijk alleen maar<br />
sterker. Ik ben ontzettend trots op jullie. Bedankt voor de fijne basis die jullie me hebben<br />
gegeven.<br />
Roel, jij was en bent er steeds voor me. Op de gekste momenten tover jij een glimlach op mijn<br />
gezicht. Ik schrijf dit stuk vol blijdschap dat jij mijn reispartner bent op deze spannende en<br />
mooie reis! Ik hou heel erg veel van je.<br />
N<strong>in</strong>a<br />
Den Haag, december 2011
224 <strong>Driv<strong>in</strong>g</strong> <strong>Behaviour</strong> <strong>in</strong> <strong>Unexpected</strong> <strong>Situations</strong>
About the Author<br />
Trijntje Willemien (N<strong>in</strong>a) Schaap was born <strong>in</strong> Leeuwarden, the<br />
Netherlands, on August 3 1979. She graduated from the Stedelijk<br />
Gymnasium <strong>in</strong> Leeuwarden <strong>in</strong> 1997 (pre-university degree) on a<br />
comb<strong>in</strong>ation of n<strong>in</strong>e subjects <strong>in</strong>clud<strong>in</strong>g exact sciences, Lat<strong>in</strong>, and<br />
Philosophy. In 1998 N<strong>in</strong>a started her academic education at the University<br />
of Gron<strong>in</strong>gen with a propaedeutic year <strong>in</strong> Psychology. She then went on to<br />
study Cognitive Science and Eng<strong>in</strong>eer<strong>in</strong>g and took the opportunity to take<br />
extracurricular courses <strong>in</strong> Philosophy of Science (University of Gron<strong>in</strong>gen)<br />
and Ethics (VU University Amsterdam).<br />
Dur<strong>in</strong>g her time <strong>in</strong> university, N<strong>in</strong>a was an active member of multiple student associations. As<br />
a member of the debat<strong>in</strong>g society ‘Current Affairs’ (Actualiteiten), part of the Dutch United<br />
Nations Student Association, she organized a number of debates on <strong>in</strong>ternational relations.<br />
She was also the <strong>in</strong>itiator and chair of the organiz<strong>in</strong>g committee for a career event on<br />
development cooperation, ‘Develop Your World’, which has s<strong>in</strong>ce been repeated successfully<br />
every year. Furthermore, N<strong>in</strong>a was a teach<strong>in</strong>g assistant for six courses, among others on<br />
Human Development & Adolescence, Observation Techniques, and Interview Techniques.<br />
N<strong>in</strong>a obta<strong>in</strong>ed her Master’s degree <strong>in</strong> 2005. Her Master’s thesis focused on visual search<strong>in</strong>g<br />
strategies and resulted <strong>in</strong> a newly developed layout for mobile telephone keyboards. Later that<br />
year, N<strong>in</strong>a jo<strong>in</strong>ed the Centre for Transport Studies (University of <strong>Twente</strong>) as a Ph.D.<br />
candidate. She conducted her research as a part of Knowledge centre AIDA (Applications of<br />
Intelligent Driver Assistance), a cooperation between the Centre for Transport Studies and the<br />
Netherlands Organization for Applied Scientific Research (TNO). N<strong>in</strong>a was awarded two<br />
prizes for her scientific work, and was nom<strong>in</strong>ated for two other awards. In addition to her<br />
research work, she reviewed <strong>in</strong>ternational conference papers, gave lectures at AIDA courses,<br />
and supervised Bachelor and Master students.<br />
S<strong>in</strong>ce August 2010, N<strong>in</strong>a is employed by the Netherlands Institute for Transport Policy<br />
Analysis (KiM) <strong>in</strong> The Hague. As an <strong>in</strong>dependent <strong>in</strong>stitute with<strong>in</strong> the M<strong>in</strong>istry of<br />
Infrastructure and the Environment, KiM carries out transport policy studies and analyses<br />
which are used to strengthen the strategic knowledge base for policy-mak<strong>in</strong>g. N<strong>in</strong>a<br />
participates <strong>in</strong> studies concern<strong>in</strong>g behavioural aspects of mobility.<br />
Although she greatly enjoys her professional life, N<strong>in</strong>a also has other <strong>in</strong>terests. She loves<br />
spend<strong>in</strong>g time with family and friends, discuss<strong>in</strong>g ethical issues, play<strong>in</strong>g board games, and<br />
watch<strong>in</strong>g The West W<strong>in</strong>g on DVD, as well as explor<strong>in</strong>g foreign cuis<strong>in</strong>es and hav<strong>in</strong>g new<br />
cul<strong>in</strong>ary experiences. She lives together with her partner Roel <strong>in</strong> The Hague, and they are<br />
plann<strong>in</strong>g their wedd<strong>in</strong>g.<br />
225
226 <strong>Driv<strong>in</strong>g</strong> <strong>Behaviour</strong> <strong>in</strong> <strong>Unexpected</strong> <strong>Situations</strong>
TRAIL Thesis Series<br />
The follow<strong>in</strong>g list conta<strong>in</strong>s the most recent dissertations <strong>in</strong> the TRAIL Thesis Series. For a<br />
complete overview of more than 100 titles see the TRAIL website: www.rsTRAIL.nl.<br />
The TRAIL Thesis Series is a series of the Netherlands TRAIL Research School on transport,<br />
<strong>in</strong>frastructure and logistics.<br />
Schaap, T.W., <strong>Driv<strong>in</strong>g</strong> <strong>Behaviour</strong> <strong>in</strong> <strong>Unexpected</strong> <strong>Situations</strong>: a study <strong>in</strong>to the effects of drivers’<br />
compensation behaviour to safety-critical situations and the effects of mental workload, event<br />
urgency and task prioritization, T2012/1, February 2012, TRAIL Thesis Series, the<br />
Netherlands<br />
Muizelaar, T.J., Non-recurrent Traffic <strong>Situations</strong> and Traffic Information: determ<strong>in</strong><strong>in</strong>g<br />
preferences and effects on route choice, T2011/16, December 2011, TRAIL Thesis Series, the<br />
Netherlands<br />
Cantarelli, C.C., Cost Overruns <strong>in</strong> Large-Scale Transportation Infrastructure Projects: a<br />
theoretical and empirical exploration for the Netherlands and Worldwide, T2011/15,<br />
November 2011, TRAIL Thesis Series, the Netherlands<br />
Vlies, A.V. van der, Rail Transport Risks and Urban Plann<strong>in</strong>g: solv<strong>in</strong>g deadlock situations<br />
between urban plann<strong>in</strong>g and rail transport of hazardous materials <strong>in</strong> the Netherlands,<br />
T2011/14, October 2011, TRAIL Thesis Series, the Netherlands<br />
Pas, J.W.G.M. van der, Clear<strong>in</strong>g the Road for ISA Implementation? Apply<strong>in</strong>g adaptive<br />
policymak<strong>in</strong>g for the implementation of <strong>in</strong>telligent speed adaptation, T2011/13, October<br />
2011, TRAIL Thesis Series, the Netherlands<br />
Zegeye, S.K., Model-Based Traffic Control for Susta<strong>in</strong>able Mobility, T2011/12, October<br />
2011, TRAIL Thesis Series, the Netherlands<br />
Máhr, T., Vehicle Rout<strong>in</strong>g under Uncerta<strong>in</strong>ty, T2011/11, September 2011, TRAIL Thesis<br />
Series, the Netherlands<br />
Pel, A.J., Transportation Modell<strong>in</strong>g for Large-scale Evacuations, T2011/10, July 2011,<br />
TRAIL Thesis Series, the Netherlands<br />
Zheng, F., Modell<strong>in</strong>g Urban Travel Times, T2011/9, July 2011, TRAIL Thesis Series, the<br />
Netherlands<br />
Vlassenroot, S.H.M., The Acceptability of In-vehicle Intelligent Speed Assistance (ISA)<br />
Systems: from trial support to public support, T2011/8, June 2011, TRAIL Thesis Series, the<br />
Netherlands<br />
227
228 <strong>Driv<strong>in</strong>g</strong> <strong>Behaviour</strong> <strong>in</strong> <strong>Unexpected</strong> <strong>Situations</strong><br />
Kroesen, M., Human Response to Aircraft Noise, T2011/7, June 2011, TRAIL Thesis Series,<br />
the Netherlands<br />
Nielsen, L.K., Roll<strong>in</strong>g Stock Reschedul<strong>in</strong>g <strong>in</strong> Passenger Railways: applications <strong>in</strong> short-term<br />
plann<strong>in</strong>g and <strong>in</strong> disruption management, T2011/6, May 2011, TRAIL Thesis Series, the<br />
Netherlands<br />
Q<strong>in</strong>g, O., New Approach to Fusion of Heterogeneous Traffic Data, T2011/5, May 2011,<br />
TRAIL Thesis Series, the Netherlands<br />
Walta, L., Gett<strong>in</strong>g ADAS on the Road: actors’ <strong>in</strong>teractions <strong>in</strong> Advanced Driver Assistance<br />
Systems deployment, T2011/4, April 2011, TRAIL Thesis Series, the Netherlands<br />
L<strong>in</strong>, S., Efficient Model Predictive Control for Large-Scale Urban Traffic Networks, T2011/3,<br />
April 2011, TRAIL Thesis Series, the Netherlands<br />
Oort, N. van, Service Reliability and Urban Public Transport Design, T2011/2, April 2011,<br />
TRAIL Thesis Series, the Netherlands<br />
Mahmod, M.K.M., Us<strong>in</strong>g Co-Operative Vehicle-Infrastructure Systems to Reduce Traffic<br />
Emissions and Improve Air Quality at Signalized Urban Intersections, T2011/1, March 2011,<br />
TRAIL Thesis Series, the Netherlands<br />
Corman, F., Real-Time Railway Traffic Management: dispatch<strong>in</strong>g <strong>in</strong> complex, large and busy<br />
railway networks, T2010/14, December 2010, TRAIL Thesis Series, the Netherlands<br />
Kwakkel, J., The Treatment of Uncerta<strong>in</strong>ty <strong>in</strong> Airport Strategic Plann<strong>in</strong>g, T2010/13,<br />
December 2010, TRAIL Thesis Series, the Netherlands<br />
Pang, Y., Intelligent Belt Conveyor Monitor<strong>in</strong>g and Control, T2010/12, December 2010,<br />
TRAIL Thesis Series, the Netherlands<br />
Kim, N.S., Intermodal Freight Transport on the Right Track? Environmental and economic<br />
performances and their trade-off, T2010/11, December 2010, TRAIL Thesis Series, the<br />
Netherlands<br />
Snelder, M., Design<strong>in</strong>g Robust Road Networks: a general design method applied to the<br />
Netherlands, T2010/10, December 2010, TRAIL Thesis Series, the Netherlands<br />
H<strong>in</strong>sbergen, C.P.IJ. van, Bayesian Data Assimilation for Improved Model<strong>in</strong>g of Road Traffic,<br />
T2010/9, November 2010, TRAIL Thesis Series, the Netherlands<br />
Zuurbier, F.S., Intelligent Route Guidance, T2010/8, November 2010, TRAIL Thesis Series,<br />
the Netherlands<br />
Larco Mart<strong>in</strong>elli, J.A., Incorporat<strong>in</strong>g Worker-Specific Factors <strong>in</strong> Operations Management<br />
Models, T2010/7, November 2010, TRAIL Thesis Series, the Netherlands<br />
Ham, J.C. van, Zeehavenontwikkel<strong>in</strong>g <strong>in</strong> Nederland: naar een beter beleidsvorm<strong>in</strong>gsproces,<br />
T2010/6, August 2010, TRAIL Thesis Series, the Netherlands.
Summary<br />
Do car drivers change their driv<strong>in</strong>g style after compensat<strong>in</strong>g for safetycritical<br />
events? What are the effects of mental workload? And how do<br />
drivers prioritize their driv<strong>in</strong>g (sub)tasks? This thesis aims to answer<br />
these questions by describ<strong>in</strong>g two large driv<strong>in</strong>g simulator experiments.<br />
The results show that drivers temporarily change their driv<strong>in</strong>g style after<br />
a safety-critical event; the duration of this change is affected by mental<br />
workload level. Drivers with <strong>in</strong>creased mental workload drive less<br />
cautiously and respond only to highly safety-critical events, but they do<br />
prioritize safe driv<strong>in</strong>g when this workload gets too high.<br />
About the Author<br />
T.W. (N<strong>in</strong>a) Schaap performed her doctoral research with<strong>in</strong> Knowledge centre<br />
AIDA, a cooperation between the Centre for Transport Studies at the University<br />
of <strong>Twente</strong> and TNO. She is currently employed by the Netherlands Institute for<br />
Transport Policy Analysis (KiM), where she is <strong>in</strong>volved <strong>in</strong> studies concerned<br />
with mobility behaviour. N<strong>in</strong>a holds a Master’s degree <strong>in</strong> Cognitive Science and<br />
Eng<strong>in</strong>eer<strong>in</strong>g from the University of Gron<strong>in</strong>gen.<br />
TRAIL Research School ISBN 978-90-5584-153-0