Before & After Reflow Characterization of FCBGA ... - IPC Outlook
Before & After Reflow Characterization of FCBGA ... - IPC Outlook
Before & After Reflow Characterization of FCBGA ... - IPC Outlook

You also want an ePaper? Increase the reach of your titles
YUMPU automatically turns print PDFs into web optimized ePapers that Google loves.
<strong>Before</strong> & <strong>After</strong> <strong>Reflow</strong> <strong>Characterization</strong> <strong>of</strong> <strong>FCBGA</strong> Voiding Utilizing High<br />
Resolution CT Scan, X-ray (2D & 3D) Imaging, and Cross Section with Digital<br />
Imaging<br />
ABSTRACT<br />
As originally published in the <strong>IPC</strong> APEX EXPO Proceedings.<br />
Gordon O’Hara, Matthew Vandiver, Jonathan Crilly / Nick Brinkh<strong>of</strong>f<br />
Flextronics Corporation / North Star Imaging<br />
Austin, Texas / Rogers, Minnesota<br />
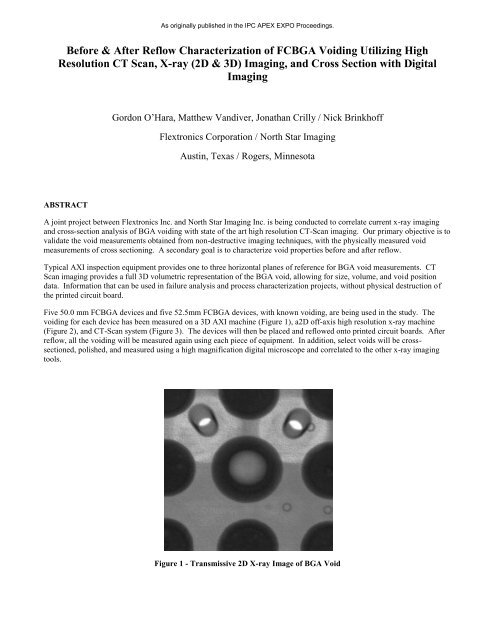
A joint project between Flextronics Inc. and North Star Imaging Inc. is being conducted to correlate current x-ray imaging<br />
and cross-section analysis <strong>of</strong> BGA voiding with state <strong>of</strong> the art high resolution CT-Scan imaging. Our primary objective is to<br />
validate the void measurements obtained from non-destructive imaging techniques, with the physically measured void<br />
measurements <strong>of</strong> cross sectioning. A secondary goal is to characterize void properties before and after reflow.<br />
Typical AXI inspection equipment provides one to three horizontal planes <strong>of</strong> reference for BGA void measurements. CT<br />
Scan imaging provides a full 3D volumetric representation <strong>of</strong> the BGA void, allowing for size, volume, and void position<br />
data. Information that can be used in failure analysis and process characterization projects, without physical destruction <strong>of</strong><br />
the printed circuit board.<br />
Five 50.0 mm <strong>FCBGA</strong> devices and five 52.5mm <strong>FCBGA</strong> devices, with known voiding, are being used in the study. The<br />
voiding for each device has been measured on a 3D AXI machine (Figure 1), a2D <strong>of</strong>f-axis high resolution x-ray machine<br />
(Figure 2), and CT-Scan system (Figure 3). The devices will then be placed and reflowed onto printed circuit boards. <strong>After</strong><br />
reflow, all the voiding will be measured again using each piece <strong>of</strong> equipment. In addition, select voids will be crosssectioned,<br />
polished, and measured using a high magnification digital microscope and correlated to the other x-ray imaging<br />
tools.<br />
Figure 1 - Transmissive 2D X-ray Image <strong>of</strong> BGA Void
INTRODUCTION<br />
As originally published in the <strong>IPC</strong> APEX EXPO Proceedings.<br />
Figure 2 - 3D AXI Mid-Ball Image <strong>of</strong> BGA Void<br />
Figure 3 - CT Scan surface model, with partial cross section, <strong>of</strong> BGA void<br />
As complex electronic assemblies become faster and faster, power with associated heat dissipation, signal integrity (SI) and<br />
reliability become more important than ever. Solder joint voiding can potentially impact all <strong>of</strong> these. With cost pressures on<br />
companies producing these types <strong>of</strong> products, it is more important than ever to be able to properly diagnose and characterize<br />
voiding in a non-destructive fashion. Proper characterization will allow for adequate troubleshooting and process<br />
development needed to minimize or eliminate voiding. In addition, non-destructive void analysis can be used in failure<br />
analysis cases.<br />
Over time, X-Ray technology used in the electronics industry has advanced from 2D transmissive, to 2D Off Axis, to 3D<br />
laminography, to 3D tomosynthesis. Resolution <strong>of</strong> x-ray tools has continued to advance along with the s<strong>of</strong>tware required for<br />
automated analysis. Use <strong>of</strong> these tools has allowed identification and measurements <strong>of</strong> the voids in solder joints. S<strong>of</strong>tware<br />
has allowed for automated inspection <strong>of</strong> the solder joints to quickly identify and measure up 100 % <strong>of</strong> the solder joints per<br />
component and per assembly in a timely manner. Typically, this s<strong>of</strong>tware allows for measurement at a specific point in the<br />
solder joint (i.e. PCB level, mid joint and Package level).<br />
While many improvements have been made in these tools (including resolution), smaller voids and true position <strong>of</strong> these<br />
voids has been difficult to see without actual cross sectioning. Now with the latest advancements in X-Ray technology, a full<br />
high resolution 3D image is available using Cat Scan technology. CT technology allows for infinite cross sectioning in a<br />
non-destructive fashion.
The first objective <strong>of</strong> this work will be to correlate the most common X-Ray technologies used by the electronics industry.<br />
Each technology will be correlated, not only to the newest CT Scan technology but also to actual cross sections on a variety<br />
<strong>of</strong> void examples.<br />
The second objective <strong>of</strong> this work will be to identify and characterize a variety <strong>of</strong> voids from incoming components through<br />
the SMT reflow process. Incoming components identified with solder voids will be subjected to a variety <strong>of</strong> reflow pr<strong>of</strong>ile<br />
styles to determine what happens to them relative to size and position. Images and measurements will be taken before and<br />
after reflow using all the traditional X-Ray tools along with CT Scan. <strong>After</strong> all imaging has been completed; actual cross<br />
sections will be taken for comparison. In addition, components with incoming voids will be subjected to reflow under<br />
vacuum in an attempt to remove the voids prior to assembly.<br />
METHODOLOGY<br />
As originally published in the <strong>IPC</strong> APEX EXPO Proceedings.<br />
Design and fabricate custom fixtures capable <strong>of</strong> holding 50 x 50 mm <strong>FCBGA</strong> and a 52.5 x 52.5 mm <strong>FCBGA</strong>’s in a dead bug<br />
position was needed for automated 3D inspection. Figure 4 shows the 10 up fixture while Figure 5 shows a close up view.<br />
Figure 4 – Fixture for automated 3D X-Ray inspection<br />
Figure 5 – Close up view <strong>of</strong> Fixture for automated 3D X-Ray inspection<br />
Assemble one SMT <strong>Reflow</strong> Pr<strong>of</strong>ile Board utilizing a large complex PCB with 50 x 50 mm and 52.5 x 52.5 mm <strong>FCBGA</strong>’s.
As originally published in the <strong>IPC</strong> APEX EXPO Proceedings.<br />
Create three different style pr<strong>of</strong>iles called Ramp to Peak (Figure 6), Long Soak (Figure 7) and Medium Soak (Figure 8)<br />
Figure 6 – Ramp to Peak SMT <strong>Reflow</strong> Pr<strong>of</strong>ile<br />
Figure 7 – Long Soak SMT <strong>Reflow</strong> Pr<strong>of</strong>ile<br />
Figure 8 – Medium Soak SMT <strong>Reflow</strong> Pr<strong>of</strong>ile
Follow process flow diagram show in Figure 9<br />
As originally published in the <strong>IPC</strong> APEX EXPO Proceedings.<br />
Figure 9 – Void Experiment Flow
VOID DETECTION METHODOLOGY<br />
As originally published in the <strong>IPC</strong> APEX EXPO Proceedings.<br />
Three typical tools will be used for the experiment including 3D AXI (Figure 10), 2D X-Ray (Figure 11), Cross-Sectioning<br />
(Figure 12) along with a fourth non-typical tool called High Resolution CT Scan (Figure 13)<br />
Figure 10 – 3D AXI Tool<br />
Figure 11 – 2D X-Ray Tool
As originally published in the <strong>IPC</strong> APEX EXPO Proceedings.<br />
Figure 12 – Cross-Sectioning Tool<br />
Figure 13 – High Resolution CT Scan Tool
Results<br />
As originally published in the <strong>IPC</strong> APEX EXPO Proceedings.<br />
Figures 14 and Figure 15 show examples <strong>of</strong> the images collected from the experiment.<br />
Figure 14 – Example 1 Of Images Collected using various tools<br />
Figure 15 – Example 2 Of Images Collected using various tools
As originally published in the <strong>IPC</strong> APEX EXPO Proceedings.<br />
Tables 1 through 4 show the various measurements for comparison along with images to help explain the data.<br />
Table 1 – 3D AXI Results<br />
Table 2 – 2D X-RayResults
As originally published in the <strong>IPC</strong> APEX EXPO Proceedings.<br />
Table 3 – Cross-Sectioning Results<br />
Table 4 – High Resolution Cat Scan Results
Table 5 shows the effect <strong>of</strong> the various pr<strong>of</strong>iles tried.<br />
As originally published in the <strong>IPC</strong> APEX EXPO Proceedings.<br />
Table 5 = Effect <strong>of</strong> Pr<strong>of</strong>iling On Void Growth<br />
Part <strong>of</strong> the experiment involved reflowing components in a Vapor Phase <strong>Reflow</strong> machine and turning on vacuum. Figure 16<br />
show some basic information about the oven used, chemistry and parameters.<br />
Figure 16 – Vapor Phase <strong>Reflow</strong> Details
As originally published in the <strong>IPC</strong> APEX EXPO Proceedings.<br />
Figure 17 shows the 2D X-Ray images before and after reflowing in the Vapor Phase oven using vacuum. 3D AXI was first<br />
used to confirm there were no detectable voids. 2D X-Ray images compare the same balls which confirm voids have mostly<br />
been removed beyond detection. CT Scans were not taken based on these results.<br />
Figure 17 – <strong>Before</strong> and <strong>After</strong> results from Vapor Phase testing
DISCUSSION<br />
As originally published in the <strong>IPC</strong> APEX EXPO Proceedings.<br />
From multiple void studies, it has been demonstrated that a soak style pr<strong>of</strong>ile can greatly reduce voiding. Figure 18 shows an<br />
example <strong>of</strong> a void study using data from 3D X-Ray. This study was conducted on OSP PCB finish in Nitrogen environment.<br />
While one vendor may work slightly better at a ramp style pr<strong>of</strong>ile, most tend to benefit from this style <strong>of</strong> pr<strong>of</strong>ile (confused –<br />
benefit from soak?). While SMT solder pastes are mostly designed to work in air, most work well in N2 and will survive a<br />
longer pr<strong>of</strong>ile which is what a soak style pr<strong>of</strong>ile would represent. If running in air, perhaps a ramp or intermediate pr<strong>of</strong>ile<br />
may work better so the vendor and part number <strong>of</strong> the SMT solder paste needs to be considered for the expected run<br />
environment.<br />
In this figure, the Y axis represents number <strong>of</strong> voids. X axis represents void size bin.<br />
Figure 18 – Example <strong>of</strong> void study using size distribution<br />
Based on the consistency <strong>of</strong> results from a variety <strong>of</strong> void studies in both SnPb and Pb Free, we concluded that a soak style<br />
pr<strong>of</strong>ile eliminates or greatly reduces voiding when compared to an Intermediate style or Ramp style reflow pr<strong>of</strong>ile. It is from<br />
this position that this experiment was conducted.<br />
Knowing and understanding the characteristics <strong>of</strong> voiding relative to a particular brand and part number <strong>of</strong> solder paste will<br />
point users to whether the reflow process and/or chemistry (SMT solder paste) is causing the voiding issue. Inspection <strong>of</strong><br />
incoming components will determine if voids are present on incoming parts. 2D or 3D x-ray can easily be used to inspect for<br />
voids on incoming components.
CONCLUSIONS<br />
As originally published in the <strong>IPC</strong> APEX EXPO Proceedings.<br />
Table 6 was created to summarize the key characteristics <strong>of</strong> each tool. A number was assigned to rank the various tools in<br />
these characteristics based on experience. Depending on eash user and type <strong>of</strong> products / business, these may change<br />
slightly. Also, a weighting factor could be applied. The color (red, gree & yellow) is an added visual indicator.<br />
Table 6 – Void Detection Tool Characteristic Rankings<br />
3D AXI is necessary to screen out significant quantities <strong>of</strong> components as data points, prior to further characterization<br />
Combination <strong>of</strong> available void detection technologies are needed for complete characterization <strong>of</strong> process and components,<br />
especially for increased complexity (i.e. via in pad, finer pitch, etc,,,)<br />
PCB and Component Design, <strong>Reflow</strong> pr<strong>of</strong>ile parameters as well as chemistry can all affect growth and positioning <strong>of</strong> voids<br />
High Resolution CT Imaging allows for a complete analysis <strong>of</strong> components before and after assembly in non-destructive<br />
manner<br />
While <strong>IPC</strong> 7095B introduced tables for void process indicators and troubleshooting and JEDEC Std 217 has a guideline for<br />
component voids allowed (pre-reflow), a clear joint industry specification needs to be considered to create better linkage<br />
between component manufacturing and PCB Assembly & Inspection
ACKNOWLEDGEMENTS<br />
Jonathan Crilly – Flextronics, Austin, Tx<br />
Eric Cruz – Flextronics, Austin, Tx<br />
Taylor Blair - Flextronics, Austin, Tx<br />
Nick Brinkh<strong>of</strong>f – North Star Imaging<br />
Florian Wuest – IBL Germany<br />
Jochen Lipp – IBL USA<br />
As originally published in the <strong>IPC</strong> APEX EXPO Proceedings.
As originally published in the <strong>IPC</strong> APEX EXPO Proceedings.<br />
<strong>Before</strong> and <strong>After</strong> <strong>Reflow</strong><br />
<strong>Characterization</strong> <strong>of</strong> FCBA Voiding<br />
Authors:<br />
Gordon O’Hara, Matthew Vandiver,<br />
Flextronics – Austin, TX
Contents<br />
• Background<br />
• Experiment Parameters<br />
• Tools for Void Identification<br />
• <strong>Before</strong> & <strong>After</strong> Void <strong>Characterization</strong><br />
• Process Considerations for Void Minimization<br />
• Void Removal<br />
• Conclusions<br />
As originally published in the <strong>IPC</strong> APEX EXPO Proceedings.
BACKGROUND<br />
As originally published in the <strong>IPC</strong> APEX EXPO Proceedings.
Background<br />
As originally published in the <strong>IPC</strong> APEX EXPO Proceedings.<br />
• 3% component level fallout at 3D AXI due to<br />
voids failing to meet customer requirements<br />
• Expensive component replacement cost<br />
• Voiding isolated to specific component type<br />
from single source supplier<br />
• Process and chemistry set characterized<br />
• Test results indicted incoming component<br />
issue<br />
• Developed tooling and AXI program for<br />
screening incoming material to
As originally published in the <strong>IPC</strong> APEX EXPO Proceedings.<br />
Process <strong>Characterization</strong>
As originally published in the <strong>IPC</strong> APEX EXPO Proceedings.<br />
Fixture for 3D AXI Screening
As originally published in the <strong>IPC</strong> APEX EXPO Proceedings.<br />
EXPERIMENT PARAMETERS
As originally published in the <strong>IPC</strong> APEX EXPO Proceedings.<br />
Experiment Flow Chart<br />
• 10 <strong>FCBGA</strong> ASICS used for Analysis<br />
• <strong>Before</strong> / <strong>After</strong> <strong>Reflow</strong> Void<br />
<strong>Characterization</strong><br />
• 2D X-ray<br />
• 3D AXI<br />
• High Resolution CT Imaging<br />
• <strong>After</strong> <strong>Reflow</strong> Cross-Sectioning
Void Detection Methodology<br />
As originally published in the <strong>IPC</strong> APEX EXPO Proceedings.<br />
TOOLS FOR VOID IDENTIFICATION
3D AXI<br />
Component Substrate<br />
Slice is parallel to PCB, and<br />
viewed from the top down<br />
Top Down View – User Defined Ball Height<br />
As originally published in the <strong>IPC</strong> APEX EXPO Proceedings.<br />
Mid-ball Slice<br />
Pad Slice<br />
• Top down view <strong>of</strong> PCB<br />
• Capable <strong>of</strong> multiple slices at user defined ball<br />
heights<br />
• Automated image analysis<br />
• Ball Diameter<br />
• Void %<br />
• Void Diameter<br />
• Pre-defined slices might not match actual<br />
void location<br />
• Void % is subjective based on programming<br />
parameters<br />
Mid-ball Slice<br />
Pad Slice
2D X-ray<br />
As originally published in the <strong>IPC</strong> APEX EXPO Proceedings.<br />
• Top down view <strong>of</strong> PCB<br />
• High resolution<br />
• Flat Image<br />
• View represents maximum ball size and<br />
maximum void size<br />
• Void size and ball diameter can change based on<br />
x-ray tube voltage / current<br />
View is looking down on PCB
Cross-Sectioning<br />
As originally published in the <strong>IPC</strong> APEX EXPO Proceedings.<br />
• View is typically perpendicular to PCB<br />
• Difficult to know where to stop grinding<br />
• Void size is dependent on amount <strong>of</strong> grinding<br />
• Measurements are accurate (preparation critical)<br />
• Destructive, expensive, and time consuming
As originally published in the <strong>IPC</strong> APEX EXPO Proceedings.<br />
High Resolution CT Scan<br />
• Non-destructive<br />
• Metrology - Full dimensional analysis <strong>of</strong> solder<br />
/ component characteristics<br />
• Infinite cross sectioning capability<br />
• Analysis is time consuming, with no automated<br />
analysis<br />
• Geared toward Failure Analysis<br />
• Costly for large form factors, up 36”x<br />
48”scannable area
As originally published in the <strong>IPC</strong> APEX EXPO Proceedings.<br />
BEFORE & AFTER VOID<br />
CHARACTERIZATION
<strong>Before</strong> / <strong>After</strong> – Example 1<br />
2D X-ray<br />
<strong>Before</strong> <strong>Reflow</strong><br />
<strong>After</strong> <strong>Reflow</strong><br />
3D AXI Cross Section<br />
<strong>Before</strong> <strong>Reflow</strong><br />
<strong>After</strong> <strong>Reflow</strong><br />
As originally published in the <strong>IPC</strong> APEX EXPO Proceedings.<br />
<strong>Before</strong> <strong>Reflow</strong><br />
<strong>After</strong> <strong>Reflow</strong><br />
CT Scan<br />
<strong>Before</strong> <strong>Reflow</strong><br />
<strong>After</strong> <strong>Reflow</strong>
<strong>Before</strong> / <strong>After</strong> – Example 2<br />
2D X-ray 3D AXI Cross Section CT Scan<br />
<strong>Before</strong> <strong>Reflow</strong><br />
<strong>After</strong> <strong>Reflow</strong><br />
<strong>Before</strong> <strong>Reflow</strong><br />
<strong>After</strong> <strong>Reflow</strong><br />
As originally published in the <strong>IPC</strong> APEX EXPO Proceedings.<br />
<strong>Before</strong> <strong>Reflow</strong><br />
<strong>After</strong> <strong>Reflow</strong><br />
<strong>Before</strong> <strong>Reflow</strong><br />
<strong>After</strong> <strong>Reflow</strong>
<strong>Before</strong> / <strong>After</strong> Results – 3D AXI<br />
3D AXI<br />
<strong>Before</strong><br />
<strong>Reflow</strong> - %<br />
Area Voided<br />
<strong>After</strong><br />
<strong>Reflow</strong> - %<br />
Area<br />
Voided<br />
% Void<br />
Area<br />
Increase<br />
Component Pin Location Oven Pr<strong>of</strong>ile<br />
Sample 1 37 Long Soak 19.92% 21.60% 8.43%<br />
Sample 1 122 Long Soak 18.57% 23.67% 27.45%<br />
Sample 2 6 Long Soak 15.12% 0.00% -100.00%<br />
Sample 2 318 Long Soak 13.15% 23.36% 77.64%<br />
Sample 2 733 Long Soak 12.04% 14.44% 19.93%<br />
Sample 2 2254 Long Soak 10.73% 0.00% -100.00%<br />
Sample 3 2090 Medium Soak 16.00% 41.57% 159.81%<br />
Sample 4 111 Medium Soak 19.40% 28.32% 45.98%<br />
Sample 5 363 Ramp to Peak 16.59% 19.38% 16.82%<br />
Sample 6 521 Ramp to Peak 13.10% 35.00% 167.18%<br />
Sample 6 1165 Ramp to Peak 10.73% 25.79% 140.35%<br />
Sample 6 1185 Ramp to Peak 10.73% 21.77% 102.89%<br />
Sample 6 1385 Ramp to Peak 18.77% 43.82% 133.46%<br />
Sample 6 1388 Ramp to Peak 15.72% 22.80% 45.04%<br />
Sample 7 917 Vapor Phase<br />
Vapor w /<br />
12.75%<br />
Sample 7 1174 Vacuum<br />
Vapor w /<br />
24.00%<br />
Sample 7 1679 Vacuum 12.00%<br />
Sample 8 366 Vapor Phase 22.43%<br />
Sample 8 2194 Vapor Phase<br />
Vapor w /<br />
12.37%<br />
Sample 9 275 Vacuum<br />
Vapor w /<br />
11.89%<br />
Sample 9 379 Vacuum 14.89%<br />
As originally published in the <strong>IPC</strong> APEX EXPO Proceedings.<br />
Pre-<strong>Reflow</strong> Post-<strong>Reflow</strong><br />
3D AXI<br />
Top Down<br />
Mid-ball View<br />
CT Scan<br />
Perpendicular<br />
view<br />
• Max void size position does not always align with<br />
pre-defined AXI slices
2D X-ray<br />
<strong>Before</strong> <strong>Reflow</strong><br />
- % Area<br />
Voided<br />
As originally published in the <strong>IPC</strong> APEX EXPO Proceedings.<br />
<strong>Before</strong> / <strong>After</strong> Results – 2D X-ray<br />
<strong>After</strong> <strong>Reflow</strong> -<br />
% Area<br />
Voided<br />
% Void Area<br />
Increase<br />
Component Pin Location Oven Pr<strong>of</strong>ile<br />
Sample 1 37 Long Soak 15.90% 16.40% 3.14%<br />
Sample 1 122 Long Soak 15.80% 15.20% -3.80%<br />
Sample 2 6 Long Soak 12.00% 0.00% -100.00%<br />
Sample 2 318 Long Soak 11.70% 15.70% 34.19%<br />
Sample 2 733 Long Soak 13.70% 16.00% 16.79%<br />
Sample 2 2254 Long Soak 11.80% 0.00% -100.00%<br />
Sample 3 2090 Medium Soak 17.00% 23.40% 37.65%<br />
Sample 4 111 Medium Soak 16.60% 18.10% 9.04%<br />
Sample 5 363 Ramp to Peak 11.60% 11.30% -2.59%<br />
Sample 6 521 Ramp to Peak 15.20% 20.10% 32.24%<br />
Sample 6 1165 Ramp to Peak 11.00% 15.40% 40.00%<br />
Sample 6 1185 Ramp to Peak 9.90% 11.10% 12.12%<br />
Sample 6 1385 Ramp to Peak 25.30% 28.50% 12.65%<br />
Sample 6 1388 Ramp to Peak 13.60% 17.10% 25.74%<br />
Sample 7 917 Vapor Phase<br />
Vapor w /<br />
16.80% 0.00% -100.00%<br />
Sample 7 1174 Vacuum<br />
Vapor w /<br />
11.74% 0.00% -100.00%<br />
Sample 7 1679 Vacuum 11.70% 0.00% -100.00%<br />
Sample 8 366 Vapor Phase 21.30%<br />
Sample 8 2194 Vapor Phase<br />
Vapor w /<br />
9.70%<br />
Sample 9 275 Vacuum<br />
Vapor w /<br />
11.40% 0.00%<br />
Sample 9 379 Vacuum 14.30% 0.00%<br />
Pre-<strong>Reflow</strong> Post-<strong>Reflow</strong><br />
• Max ball diameter, void diameter with only x,y void<br />
position information<br />
• Void diameter increase not proportional to void %<br />
area increase
As originally published in the <strong>IPC</strong> APEX EXPO Proceedings.<br />
<strong>Before</strong> / <strong>After</strong> Results – CT Scan<br />
CT Scan • CT Imaging allows for<br />
<strong>Before</strong> - Void <strong>Before</strong> - Void <strong>After</strong> - Void <strong>After</strong> - Void Y- Percent X -<br />
Percent Y -<br />
Dim<br />
Component Pin Location Oven Pr<strong>of</strong>ile X-Dim (um) Y-Dim (um) X-Dim (um) Dim (um) Dim Increase Increase<br />
Sample 1 37 Long Soak 228.73 264.25 265.39 317.90 16.0% 20.3%<br />
Sample 1 122 Long Soak 234.53 292.93 333.08 392.93 42.0% 34.1%<br />
Sample 2 6 Long Soak 171.42 182.96 176.91 204.34 3.2% 11.7%<br />
Sample 2 318 Long Soak 205.07 260.82 304.17 406.58 48.3% 55.9%<br />
Sample 2 733 Long Soak 221.06 255.09 311.70 391.72 41.0% 53.6%<br />
Sample 2 2254 Long Soak 205.43 273.83 245.52 338.25 19.5% 23.5%<br />
Sample 3 2090 Medium Soak 278.26 331.69 389.63 475.51 40.0% 43.4%<br />
Sample 4 111 Medium Soak 233.43 306.76 288.22 363.27 23.5% 18.4%<br />
Sample 5 363 Ramp to Peak 241.36 189.54 248.69 316.29 3.0% 66.9%<br />
Sample 6 521 Ramp to Peak 365.50 466.49<br />
Sample 6 1165 Ramp to Peak 395.58 270.45<br />
Sample 6 1185 Ramp to Peak<br />
Sample 6 1385 Ramp to Peak 414.28 478.52<br />
Sample 6 1388 Ramp to Peak<br />
complete void and ball<br />
characterization
Cross-Section Results<br />
Physcial Cross Section<br />
ComponentPin Location Oven Pr<strong>of</strong>ile Max Void X Void Y % Void Area<br />
Sample 1 37 Long Soak 183.69 171.48 11.2%<br />
Sample 1 122 Long Soak 169.22 161.46 10.0%<br />
Sample 2 6 Long Soak 195.94 219.36 14.6%<br />
Sample 2 318 Long Soak<br />
Sample 2 733 Long Soak<br />
Sample 2 2254 Long Soak<br />
Sample 3 2090 Medium Soak 207.07 193.75 15.5%<br />
Sample 4 111 Medium Soak 219.32 182.62 14.2%<br />
Sample 5 363 Ramp to Peak 213.75 203.77 15.0%<br />
Sample 6 521 Ramp to Peak<br />
Sample 6 1165 Ramp to Peak 283.92 302.87 29.6%<br />
Sample 6 1185 Ramp to Peak<br />
Sample 6 1385 Ramp to Peak 262.73 227.16 22.0%<br />
Sample 6 1388 Ramp to Peak 251.6 220.49 18.9%<br />
• Measurements are most accurate among utilized<br />
technologies<br />
• Difficult to know which direction to grind into ball without<br />
other x-ray tools as a guide<br />
• Difficult to grind parallel to component package<br />
• Easy to stop short, or grind past maximum void position<br />
As originally published in the <strong>IPC</strong> APEX EXPO Proceedings.
As originally published in the <strong>IPC</strong> APEX EXPO Proceedings.<br />
PROCESS CONSIDERATIONS<br />
FOR VOID MINIMIZATION
Oven <strong>Reflow</strong> Pr<strong>of</strong>iles<br />
Void Growth Analysis<br />
Pr<strong>of</strong>ile 2D X-ray<br />
Top Down<br />
Slice<br />
3D AXI<br />
Top Down<br />
Slice<br />
Long Soak 13% 33% 31%<br />
Medium Soak 23% 103% 31%<br />
Ramp to Peak 20% 101% 35%<br />
CT Scan<br />
Perp. Slice<br />
• X-ray void measurements are not 100% driven by increase /<br />
decrease in void size.<br />
• Measurements for x-ray are affected by void positioning within<br />
ball and changes in ball diameter.<br />
• Full void characterization requires both parallel and<br />
perpendicular slices through void area<br />
As originally published in the <strong>IPC</strong> APEX EXPO Proceedings.<br />
Long Soak<br />
Medium Soak<br />
Ramp to Peak
VOID REMOVAL<br />
As originally published in the <strong>IPC</strong> APEX EXPO Proceedings.
As originally published in the <strong>IPC</strong> APEX EXPO Proceedings.<br />
Vapor Phase Details<br />
Machine was batch with Galden 235 liquid<br />
Vacuum pressure = 20 mbar<br />
Vacuum duration = 15 sec
Void Removal<br />
<strong>Before</strong> <strong>Reflow</strong><br />
Void % = 16.80%<br />
Vapor Phase w/ Vacuum<br />
As originally published in the <strong>IPC</strong> APEX EXPO Proceedings.<br />
<strong>Before</strong> <strong>Reflow</strong><br />
Void % = 11.74%<br />
Vapor Phase w/ Vacuum<br />
<strong>Before</strong> <strong>Reflow</strong><br />
Void % = 11.40%<br />
Vapor Phase w/ Vacuum<br />
• Voids reduced / removed using<br />
vapor phase reflow <strong>of</strong> a dead-bug<br />
component under vacuum<br />
• Void reduction / removal causes<br />
minor deformation <strong>of</strong> ball diameter
CONCLUSIONS<br />
As originally published in the <strong>IPC</strong> APEX EXPO Proceedings.
Technology Comparison<br />
2D X-ray 3D AXI CT Scan Cross-Section<br />
Image Resolution 3 4 2 1<br />
Preparation Time 1 2 3 4<br />
Automation 2 1 3 4<br />
Measurement Accuracy 3 4 2 1<br />
Slice Qty & Position 4 2 1 3<br />
Analysis Time 2 1 3 4<br />
Void Location 4 3 1 2<br />
1 = Best 4 = Worst<br />
As originally published in the <strong>IPC</strong> APEX EXPO Proceedings.
As originally published in the <strong>IPC</strong> APEX EXPO Proceedings.<br />
Final Thoughts<br />
• 3D AXI is necessary to screen out significant quantities <strong>of</strong><br />
components as data points, prior to further characterization<br />
• Combination <strong>of</strong> available void detection technologies are needed for<br />
complete characterization <strong>of</strong> process and components, especially for<br />
increased complexity (i.e. via in pad, finer pitch, etc,,,)<br />
• PCB and Component Design, <strong>Reflow</strong> pr<strong>of</strong>ile parameters as well as<br />
chemistry can all affect growth and positioning <strong>of</strong> voids<br />
• High Resolution CT Imaging allows for a complete analysis <strong>of</strong><br />
components before and after assembly in non-destructive manner<br />
• While <strong>IPC</strong> 7095B introduced tables for void process indicators and<br />
troubleshooting and JEDEC Std 217 has a guideline for component<br />
voids allowed (pre-reflow), a clear joint industry specification needs to<br />
be considered to create better linkage between component<br />
manufacturing and PCB Assembly & Inspection
Acknowledgements<br />
• Jonathan Crilly – Flextronics<br />
• Eric Cruz – Flextronics<br />
• Taylor Blair - Flextronics<br />
• Nick Brinkh<strong>of</strong>f – North Star Imaging<br />
• Florian Wuest – IBL<br />
• Jochen Lipp - IBL<br />
As originally published in the <strong>IPC</strong> APEX EXPO Proceedings.
THANK YOU<br />
As originally published in the <strong>IPC</strong> APEX EXPO Proceedings.