great lakes dairy sheep symposium - the Department of Animal ...
great lakes dairy sheep symposium - the Department of Animal ...
great lakes dairy sheep symposium - the Department of Animal ...

Create successful ePaper yourself
Turn your PDF publications into a flip-book with our unique Google optimized e-Paper software.
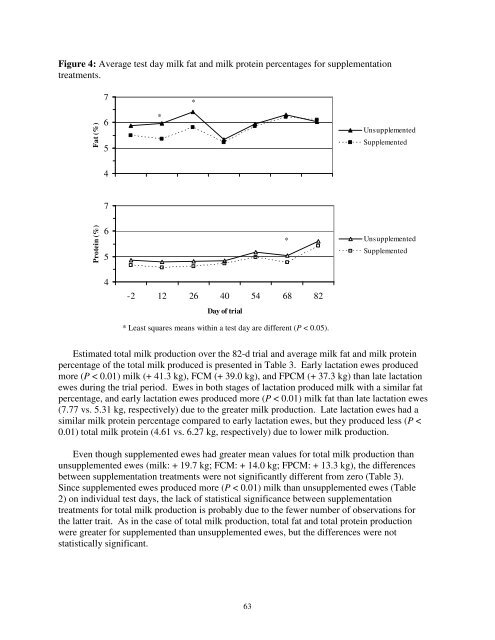
Figure 4: Average test day milk fat and milk protein percentages for supplementation<br />
treatments.<br />
Fat (%)<br />
Protein (%)<br />
7<br />
6<br />
5<br />
4<br />
7<br />
6<br />
5<br />
4<br />
*<br />
*<br />
*<br />
-2 12 26 40 54 68 82<br />
-2 12 26 40 54 68 82<br />
Day <strong>of</strong> trial<br />
* Least squares means within a test day are different (P < 0.05).<br />
63<br />
Unsupplemented<br />
Supplemented<br />
Unsupplemented<br />
Supplemented<br />
Estimated total milk production over <strong>the</strong> 82-d trial and average milk fat and milk protein<br />
percentage <strong>of</strong> <strong>the</strong> total milk produced is presented in Table 3. Early lactation ewes produced<br />
more (P < 0.01) milk (+ 41.3 kg), FCM (+ 39.0 kg), and FPCM (+ 37.3 kg) than late lactation<br />
ewes during <strong>the</strong> trial period. Ewes in both stages <strong>of</strong> lactation produced milk with a similar fat<br />
percentage, and early lactation ewes produced more (P < 0.01) milk fat than late lactation ewes<br />
(7.77 vs. 5.31 kg, respectively) due to <strong>the</strong> <strong>great</strong>er milk production. Late lactation ewes had a<br />
similar milk protein percentage compared to early lactation ewes, but <strong>the</strong>y produced less (P <<br />
0.01) total milk protein (4.61 vs. 6.27 kg, respectively) due to lower milk production.<br />
Even though supplemented ewes had <strong>great</strong>er mean values for total milk production than<br />
unsupplemented ewes (milk: + 19.7 kg; FCM: + 14.0 kg; FPCM: + 13.3 kg), <strong>the</strong> differences<br />
between supplementation treatments were not significantly different from zero (Table 3).<br />
Since supplemented ewes produced more (P < 0.01) milk than unsupplemented ewes (Table<br />
2) on individual test days, <strong>the</strong> lack <strong>of</strong> statistical significance between supplementation<br />
treatments for total milk production is probably due to <strong>the</strong> fewer number <strong>of</strong> observations for<br />
<strong>the</strong> latter trait. As in <strong>the</strong> case <strong>of</strong> total milk production, total fat and total protein production<br />
were <strong>great</strong>er for supplemented than unsupplemented ewes, but <strong>the</strong> differences were not<br />
statistically significant.<br />
*