- Page 1 and 2:
MEDICARE, MEDICAID, & HEALTH REFORM
- Page 3 and 4:
GENERAL INFORMATION TABLE OF CONTEN
- Page 5 and 6:
Last Updated: November 12, 2012 2.
- Page 7 and 8:
Ref. # 2. Task/Issue Person(s) CMS
- Page 9 and 10:
Ref. # II. POLICY Task/Issue Person
- Page 11 and 12:
Ref. # Task/Issue Person(s) 9. Stra
- Page 13 and 14:
Ref. # Task/Issue Person(s) 15. Eva
- Page 15 and 16:
IV. OUTREACH AND EDUCATION MMPC: SU
- Page 17 and 18:
Ref. # Task/Issue Person(s) 25. Med
- Page 19 and 20:
MMPC October 9, 2012 Teleconference
- Page 21 and 22:
To do List: -Myra will have draft b
- Page 23 and 24:
Internal Revenue Service Meeting No
- Page 25 and 26:
with a “interim/acting”. Can al
- Page 27 and 28:
8/7/12 DRAFT COMPANION TO ADDENDUM
- Page 29 and 30:
Indian Self-Determination and Educa
- Page 31 and 32:
Under federal law, There are privac
- Page 33 and 34:
1. Purpose of Addendum; Supersessio
- Page 35 and 36:
(1) ISDEAA, 25 USC §450 et seq.; (
- Page 37 and 38:
13. Medical Quality Assurance Requi
- Page 39 and 40:
edits on documents are due back fro
- Page 41 and 42:
d. CCIIO Philosophy - CCIIO is taki
- Page 43 and 44:
- I/T/U provider receives their all
- Page 45 and 46:
i. CMS rep. commented that an analy
- Page 47 and 48:
IHS TRIBAL SELF-GOVERNANCE ADVISORY
- Page 49 and 50:
Letter: Dr. Robert Petzel, Under Se
- Page 51 and 52:
October 17, 2012 Dr. Robert Petzel,
- Page 53 and 54:
A BILL To correct inconsistencies i
- Page 55 and 56:
California Rural Indian Health Boar
- Page 57 and 58:
As people have changes in employmen
- Page 59 and 60:
Indian eligibility determinations,
- Page 61 and 62:
v.7, 2012‐09‐23a ACA, (2) the s
- Page 63 and 64: Indian tribe means any Indian tribe
- Page 65 and 66: v.7, 2012‐09‐23a In issuing thi
- Page 67 and 68: (1) to ensure the highest possible
- Page 69 and 70: v.7, 2012‐09‐23a Delays in acc
- Page 71 and 72: v.7, 2012‐09‐23a 1997. The prov
- Page 73 and 74: v.7, 2012‐09‐23a 48 Enacted thr
- Page 75 and 76: Prepared by James Crouch MPH Chair,
- Page 77 and 78: Summary T he Indian Health Service
- Page 79 and 80: Summary providers that were either
- Page 81 and 82: Introduction Reliable determination
- Page 83 and 84: Analysis Groups IHS AIAN Methods Th
- Page 85 and 86: Methods group for the statistical m
- Page 87 and 88: Enrollees with no Payments Methods
- Page 89 and 90: Methods Table 5. Mean Medicaid and
- Page 91 and 92: Restricted Benefits Methods Enrolle
- Page 93 and 94: Age and Sex Methods Medical care pa
- Page 95 and 96: Methods Table 9. Findings for all s
- Page 97 and 98: Methods Map 1. 12 IHS Areas: Contra
- Page 99 and 100: Findings Figure 1. Adjustment of Me
- Page 101 and 102: Findings Payments are Higher for IH
- Page 103 and 104: Findings for Group 3 was $600 and W
- Page 105 and 106: Findings Unadjusted mean payments f
- Page 107 and 108: Findings Table 10. Unadjusted Mean
- Page 109 and 110: Findings Figure 13. Adjusted Mean T
- Page 111 and 112: Analysis Group Compiled Findings fo
- Page 113: Findings Adjusted Mean Payments for
- Page 117 and 118: Findings providers for services nee
- Page 119 and 120: Findings Figure 21. Medicaid Altern
- Page 121 and 122: Conclusions and Recommendations pro
- Page 123 and 124: Indian Health Service, 2012. Federa
- Page 125 and 126: Tribal Consultation Policy HHS 1. P
- Page 127 and 128: defined in Sections 8 and 9 of this
- Page 129 and 130: 2. Office of Intergovernmental Affa
- Page 131 and 132: will give equal consideration to th
- Page 133 and 134: provide Indian Tribes with a region
- Page 135 and 136: 4. Each Operating Division Head/Dep
- Page 137 and 138: Department’s ability to address i
- Page 139 and 140: 17. Sovereignty - The ultimate sour
- Page 141 and 142: 1. Selection of workgroup co-chairs
- Page 143 and 144: It is unclear if this was just an o
- Page 149 and 150: November 14 -15, 2012 TTAG FACE TO
- Page 151 and 152: AGENDA: Day 2 Thursday - Nov. 15, 2
- Page 153 and 154: Subpart G--Social Services Block Gr
- Page 155 and 156: organization applying for or receiv
- Page 157 and 158: members of a tribe receiving direct
- Page 159 and 160: is at or below the poverty line. (d
- Page 161 and 162: under this part. Grantees that rece
- Page 163 and 164: income home energy assistance progr
- Page 169 and 170:
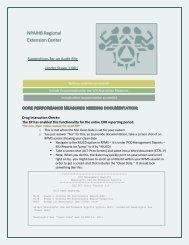
Need for Uniform Operational Guidan
- Page 171 and 172:
Dear Tribal Representatives, Octobe
- Page 173 and 174:
There is a strong correlation betwe
- Page 175 and 176:
Wed. Nov 14 th : SDPI National Call
- Page 177 and 178:
Future MMPC Meetings & Conference C
- Page 179 and 180:
Regulation Review and Impact Analys
- Page 181 and 182:
64. Policy on Conferring with Urban
- Page 183 and 184:
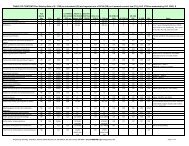
RRIAR Ref. # 1.c. 8. 9. 13. Short T
- Page 185 and 186:
RRIAR Ref. # 20. 23. 26. 28.a. Shor
- Page 187 and 188:
RRIAR Ref. # 43. 44. 46. 61. Short
- Page 189 and 190:
RRIAR Ref. # 83. 84. 85. 86. Short
- Page 191 and 192:
RRIAR Ref. # 2.c. 2.d. 3.a. Short T
- Page 193 and 194:
RRIAR Ref. # 4.b. 5. 10.a. 10.b. Sh
- Page 195 and 196:
RRIAR Ref. # 11.e. 11.f. 11.g. Shor
- Page 197 and 198:
RRIAR Ref. # 22. 24. 25.a. Short Ti
- Page 199 and 200:
RRIAR Ref. # 52.a. 52.b. 52.c. 57.
- Page 201 and 202:
RRIAR Ref. # 60.b. 60.c. 60.d. Shor
- Page 203 and 204:
RRIAR Ref. # 71.b. 72. 73. Short Ti
- Page 205 and 206:
RRIAR Ref. # 6.b. 6.c. 7.a. Short T
- Page 207 and 208:
RRIAR Ref. # 7.e. 7.f. 7.g. 12.a. S
- Page 209 and 210:
RRIAR Ref. # 29. 31.a. 31.b. 31.c.
- Page 211 and 212:
RRIAR Ref. # 39. 42. 45. 47. Short
- Page 213 and 214:
RRIAR Ref. # 54. 56. 63. 64. Short
- Page 215 and 216:
RRIAR Ref. # 69. 77. 88. Short Titl
- Page 217 and 218:
RRIAR Ref. # 92. 35. 36. 74. Short
- Page 219 and 220:
RRIAR Ref. # 94. 95. 96. 97. Short
- Page 221 and 222:
premium tax credit assistance and c
- Page 223 and 224:
Access to this benefit is criticall
- Page 225 and 226:
community providers for purposes of
- Page 227 and 228:
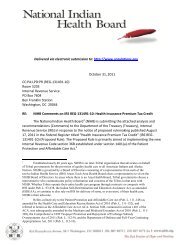
November 12, 2012 Centers for Medic
- Page 229 and 230:
_________ American Indian or Alaska
- Page 231 and 232:
November 9, 2012 Page 2 We are comm
- Page 233 and 234:
Tribal Consultation for Health Insu
- Page 235 and 236:
Background Analysis of Tribal Consu
- Page 237 and 238:
Analysis of Tribal Consultation Pol
- Page 239 and 240:
Analysis of Tribal Consultation Pol
- Page 241 and 242:
Analysis of Tribal Consultation Pol
- Page 243 and 244:
Analysis of Tribal Consultation Pol
- Page 245 and 246:
Analysis of Tribal Consultation Pol
- Page 247 and 248:
Analysis of Tribal Consultation Pol
- Page 249 and 250:
Analysis of Tribal Consultation Pol
- Page 251 and 252:
D. FFE Data Analysis of Tribal Cons
- Page 253 and 254:
John O'Brien Director, Healthcare &
- Page 255 and 256:
Draft Report: Currently being circu
- Page 257 and 258:
Draft Report: Currently being circu
- Page 259 and 260:
Draft Report: Currently being circu
- Page 261 and 262:
Draft Report: Currently being circu
- Page 263 and 264:
Draft Report: Currently being circu
- Page 265 and 266:
Draft Report: Currently being circu
- Page 267 and 268:
Draft Report: Currently being circu
- Page 269 and 270:
Draft Report: Currently being circu
- Page 271 and 272:
Draft Report: Currently being circu
- Page 273 and 274:
Draft Report: Currently being circu
- Page 275 and 276:
Draft Report: Currently being circu
- Page 277 and 278:
Draft Report: Currently being circu
- Page 279 and 280:
Draft Report: Currently being circu
- Page 281 and 282:
Draft Report: Currently being circu
- Page 283 and 284:
Draft Report: Currently being circu
- Page 285 and 286:
Draft Report: Currently being circu
- Page 287 and 288:
Draft Report: Currently being circu
- Page 289 and 290:
Draft Report: Currently being circu
- Page 291 and 292:
Draft Report: Currently being circu
- Page 293 and 294:
Draft Report: Currently being circu
- Page 295 and 296:
Draft Report: Currently being circu
- Page 297 and 298:
Draft Report: Currently being circu
- Page 299 and 300:
Draft Report: Currently being circu
- Page 301 and 302:
Draft Report: Currently being circu
- Page 303 and 304:
Draft Report: Currently being circu
- Page 305 and 306:
Draft Report: Currently being circu
- Page 307 and 308:
Draft Report: Currently being circu
- Page 309 and 310:
Draft Report: Currently being circu
- Page 311 and 312:
Draft Report: Currently being circu
- Page 313 and 314:
Draft Report: Currently being circu
- Page 315 and 316:
Draft Report: Currently being circu
- Page 317 and 318:
Draft Report: Currently being circu
- Page 319 and 320:
Draft Report: Currently being circu