- Page 1:
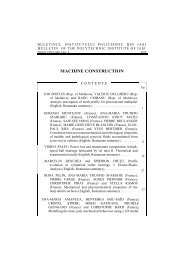
BULETINUL INSTITUTULUI POLITEHNIC D
- Page 5 and 6:
BULETINUL INSTITUTULUI POLITEHNIC D
- Page 7:
VICTOR COTOROS şi EMIL BUDESCU, As
- Page 10 and 11:
ALEXANDRU RADU, CONSTANTIN PANĂ an
- Page 13 and 14:
BULETINUL INSTITUTULUI POLITEHNIC D
- Page 15 and 16:
Bul. Inst. Polit. Iaşi, t. LVIII (
- Page 17 and 18:
Bul. Inst. Polit. Iaşi, t. LVIII (
- Page 19 and 20:
Bul. Inst. Polit. Iaşi, t. LVIII (
- Page 21 and 22:
Bul. Inst. Polit. Iaşi, t. LVIII (
- Page 23 and 24:
Bul. Inst. Polit. Iaşi, t. LVIII (
- Page 25 and 26:
Bul. Inst. Polit. Iaşi, t. LVIII (
- Page 27 and 28:
Bul. Inst. Polit. Iaşi, t. LVIII (
- Page 29 and 30:
Bul. Inst. Polit. Iaşi, t. LVIII (
- Page 31 and 32:
Bul. Inst. Polit. Iaşi, t. LVIII (
- Page 33 and 34:
Bul. Inst. Polit. Iaşi, t. LVIII (
- Page 35 and 36:
Bul. Inst. Polit. Iaşi, t. LVIII (
- Page 37 and 38:
Bul. Inst. Polit. Iaşi, t. LVIII (
- Page 39:
Bul. Inst. Polit. Iaşi, t. LVIII (
- Page 42 and 43:
30 Daniel Dragomir-Stanciu and Mari
- Page 44 and 45:
32 Daniel Dragomir-Stanciu and Mari
- Page 47 and 48:
BULETINUL INSTITUTULUI POLITEHNIC D
- Page 49 and 50:
Bul. Inst. Polit. Iaşi, t. LVIII (
- Page 51 and 52:
Bul. Inst. Polit. Iaşi, t. LVIII (
- Page 53 and 54:
Bul. Inst. Polit. Iaşi, t. LVIII (
- Page 55 and 56:
BULETINUL INSTITUTULUI POLITEHNIC D
- Page 57 and 58:
Bul. Inst. Polit. Iaşi, t. LVIII (
- Page 59 and 60:
Bul. Inst. Polit. Iaşi, t. LVIII (
- Page 61:
Bul. Inst. Polit. Iaşi, t. LVIII (
- Page 64 and 65:
52 Ionel Oprea and low viscosity ar
- Page 66 and 67:
54 Ionel Oprea COP PT Puterea speci
- Page 68 and 69:
56 Ionel Oprea 8. GWP - global warm
- Page 70 and 71:
58 Ionel Oprea suplimentari, cum ar
- Page 72 and 73:
60 Răzvan Florin Barzic et al. Cur
- Page 74 and 75:
62 Răzvan Florin Barzic et al. 3-
- Page 76 and 77:
64 Răzvan Florin Barzic et al. 3.
- Page 78 and 79:
66 Ionel Ivancu et al. the second s
- Page 80 and 81:
68 Ionel Ivancu et al. a b Fig. 4 -
- Page 82 and 83:
70 Ionel Ivancu et al. Gut J.A.W.,
- Page 84 and 85:
72 Ion Zabet and Graţiela-Maria Ţ
- Page 86 and 87:
74 Ion Zabet and Graţiela-Maria Ţ
- Page 88 and 89:
76 Ion Zabet and Graţiela-Maria Ţ
- Page 90 and 91:
78 Ion Zabet and Graţiela-Maria Ţ
- Page 92 and 93:
80 Ion Zabet and Graţiela-Maria Ţ
- Page 94 and 95:
82 Victor Pantilie et al. many rese
- Page 96 and 97:
84 Victor Pantilie et al. industria
- Page 98 and 99:
86 Victor Pantilie et al. Another i
- Page 100 and 101:
88 Victor Pantilie et al. At the en
- Page 102 and 103:
90 Victor Pantilie et al. Tang X.,
- Page 104 and 105:
92 Alexandru Radu et al. Furthermor
- Page 106 and 107:
94 Alexandru Radu et al. Spark timi
- Page 108 and 109:
96 Alexandru Radu et al. Fig. 3 - B
- Page 110 and 111:
98 Alexandru Radu et al. 4. The bes
- Page 113 and 114:
BULETINUL INSTITUTULUI POLITEHNIC D
- Page 115 and 116:
Bul. Inst. Polit. Iaşi, t. LVIII (
- Page 117 and 118:
Bul. Inst. Polit. Iaşi, t. LVIII (
- Page 119 and 120:
Bul. Inst. Polit. Iaşi, t. LVIII (
- Page 121 and 122:
BULETINUL INSTITUTULUI POLITEHNIC D
- Page 123 and 124:
Bul. Inst. Polit. Iaşi, t. LVIII (
- Page 125 and 126:
Bul. Inst. Polit. Iaşi, t. LVIII (
- Page 127:
Bul. Inst. Polit. Iaşi, t. LVIII (
- Page 130 and 131:
118 Eugen Rusu et al. in PM emissio
- Page 132 and 133:
120 Eugen Rusu et al. also be used
- Page 134 and 135:
122 Eugen Rusu et al. Fig. 3 - Maxi
- Page 136 and 137:
124 Eugen Rusu et al. Fig. 6 - HC e
- Page 138 and 139:
126 Eugen Rusu et al. Pe lângă ce
- Page 140 and 141:
128 Adrian Sabău et al. arguments
- Page 142 and 143:
130 Adrian Sabău et al. The energy
- Page 144 and 145:
132 Adrian Sabău et al. during fue
- Page 146 and 147:
134 Adrian Sabău et al. 11 T ⎛ 0
- Page 148 and 149:
136 Adrian Sabău et al. No experim
- Page 150 and 151:
138 Adrian Sabău et al. calculated
- Page 153 and 154:
BULETINUL INSTITUTULUI POLITEHNIC D
- Page 155 and 156:
Bul. Inst. Polit. Iaşi, t. LVIII (
- Page 157 and 158:
Bul. Inst. Polit. Iaşi, t. LVIII (
- Page 159 and 160:
Bul. Inst. Polit. Iaşi, t. LVIII (
- Page 161 and 162:
Bul. Inst. Polit. Iaşi, t. LVIII (
- Page 163:
Bul. Inst. Polit. Iaşi, t. LVIII (
- Page 166 and 167:
154 Marius Receanu et al. where: qr
- Page 168 and 169:
156 Marius Receanu et al. In Fig. 2
- Page 170 and 171: 158 Marius Receanu et al. the ambie
- Page 173 and 174: BULETINUL INSTITUTULUI POLITEHNIC D
- Page 175 and 176: Bul. Inst. Polit. Iaşi, t. LVIII (
- Page 177 and 178: Bul. Inst. Polit. Iaşi, t. LVIII (
- Page 179 and 180: Bul. Inst. Polit. Iaşi, t. LVIII (
- Page 181: Bul. Inst. Polit. Iaşi, t. LVIII (
- Page 184 and 185: 172 Mariana Lupchian Propulsion eng
- Page 186 and 187: 174 Mariana Lupchian Fig. 1 - The p
- Page 189 and 190: BULETINUL INSTITUTULUI POLITEHNIC D
- Page 191 and 192: Bul. Inst. Polit. Iaşi, t. LVIII (
- Page 193 and 194: Bul. Inst. Polit. Iaşi, t. LVIII (
- Page 195 and 196: Bul. Inst. Polit. Iaşi, t. LVIII (
- Page 197: Bul. Inst. Polit. Iaşi, t. LVIII (
- Page 200 and 201: 188 Costică Atanasiu et al. comput
- Page 202 and 203: 190 Costică Atanasiu et al. γ= ε
- Page 204 and 205: 192 Costică Atanasiu et al. The sa
- Page 206 and 207: 194 Costică Atanasiu et al. Fig. 1
- Page 208 and 209: 196 Costică Atanasiu et al. elasti
- Page 210 and 211: 198 Ovidiu Niţă et al. rejection
- Page 212 and 213: 200 Ovidiu Niţă et al. aluminium
- Page 214 and 215: 202 Ovidiu Niţă et al. a b Fig. 5
- Page 216 and 217: 204 Ovidiu Niţă et al. căreia ac
- Page 218 and 219: 206 Ovidiu Niţă and Vasile Braha
- Page 222 and 223: 210 Ovidiu Niţă and Vasile Braha
- Page 224 and 225: 212 Ovidiu Niţă and Vasile Braha
- Page 226 and 227: 214 Marian Teodor Popescu et al. 2.
- Page 228 and 229: 216 Marian Teodor Popescu et al. Sp
- Page 230 and 231: 218 Marian Teodor Popescu et al. Th
- Page 233 and 234: BULETINUL INSTITUTULUI POLITEHNIC D
- Page 235 and 236: Bul. Inst. Polit. Iaşi, t. LVIII (
- Page 237 and 238: Bul. Inst. Polit. Iaşi, t. LVIII (
- Page 239: Bul. Inst. Polit. Iaşi, t. LVIII (
- Page 242 and 243: 230 Victor Cotoros and Emil Budescu
- Page 244 and 245: 232 Victor Cotoros and Emil Budescu
- Page 246 and 247: 234 Victor Cotoros and Emil Budescu
- Page 248 and 249: 236 Victor Cotoros and Emil Budescu
- Page 250 and 251: 238 Victor Cotoros and Emil Budescu
- Page 252 and 253: 240 Victor Cotoros and Emil Budescu
- Page 255 and 256: BULETINUL INSTITUTULUI POLITEHNIC D
- Page 257 and 258: Bul. Inst. Polit. Iaşi, t. LVIII (
- Page 259 and 260: Bul. Inst. Polit. Iaşi, t. LVIII (
- Page 261 and 262: Bul. Inst. Polit. Iaşi, t. LVIII (
- Page 263 and 264: Bul. Inst. Polit. Iaşi, t. LVIII (
- Page 265 and 266: Bul. Inst. Polit. Iaşi, t. LVIII (
- Page 267 and 268: BULETINUL INSTITUTULUI POLITEHNIC D
- Page 269 and 270: Bul. Inst. Polit. Iaşi, t. LVIII (
- Page 271 and 272:
Bul. Inst. Polit. Iaşi, t. LVIII (
- Page 273 and 274:
Bul. Inst. Polit. Iaşi, t. LVIII (
- Page 275 and 276:
BULETINUL INSTITUTULUI POLITEHNIC D
- Page 277 and 278:
Bul. Inst. Polit. Iaşi, t. LVIII (
- Page 279 and 280:
Bul. Inst. Polit. Iaşi, t. LVIII (
- Page 281 and 282:
Bul. Inst. Polit. Iaşi, t. LVIII (
- Page 283 and 284:
BULETINUL INSTITUTULUI POLITEHNIC D
- Page 285 and 286:
Bul. Inst. Polit. Iaşi, t. LVIII (
- Page 287 and 288:
Bul. Inst. Polit. Iaşi, t. LVIII (
- Page 289 and 290:
BULETINUL INSTITUTULUI POLITEHNIC D
- Page 291 and 292:
Bul. Inst. Polit. Iaşi, t. LVIII (
- Page 293 and 294:
Bul. Inst. Polit. Iaşi, t. LVIII (
- Page 295 and 296:
BULETINUL INSTITUTULUI POLITEHNIC D
- Page 297 and 298:
PC Cell calibration Bul. Inst. Poli
- Page 299 and 300:
Bul. Inst. Polit. Iaşi, t. LVIII (
- Page 301 and 302:
Bul. Inst. Polit. Iaşi, t. LVIII (
- Page 303 and 304:
Bul. Inst. Polit. Iaşi, t. LVIII (
- Page 305 and 306:
Bul. Inst. Polit. Iaşi, t. LVIII (
- Page 307 and 308:
Bul. Inst. Polit. Iaşi, t. LVIII (
- Page 309 and 310:
Bul. Inst. Polit. Iaşi, t. LVIII (
- Page 311 and 312:
Bul. Inst. Polit. Iaşi, t. LVIII (
- Page 313 and 314:
Bul. Inst. Polit. Iaşi, t. LVIII (
- Page 315 and 316:
Bul. Inst. Polit. Iaşi, t. LVIII (
- Page 317:
Bul. Inst. Polit. Iaşi, t. LVIII (


