ESV.Twelfth.Int.Conf.Volume.ONE.PART.TWO
ESV.Twelfth.Int.Conf.Volume.ONE.PART.TWO
ESV.Twelfth.Int.Conf.Volume.ONE.PART.TWO

Create successful ePaper yourself
Turn your PDF publications into a flip-book with our unique Google optimized e-Paper software.
diagnosis and preventive maintenance. Both means will<br />
gain increasing importance in future as they help to reduce<br />
down times. And it is hardly exaggerated to say that trucks<br />
which suffer from the gap in the electronic data processing<br />
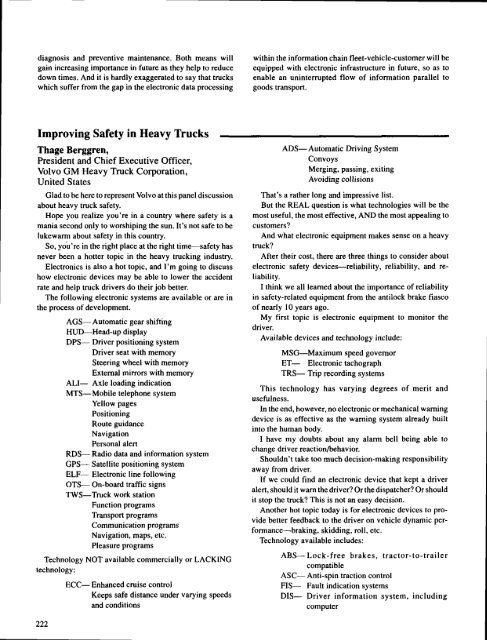
Improving Safety in Heavy Trucks<br />
Thage Berggren,<br />
President and Chief Executive Officer,<br />
Volvo GM Heavy Truck Corporation,<br />
United States<br />
Glad to be here to represent Volvo at this panel discussion<br />
about heavy truck safety.<br />
Hope you realize you're in a country where safety is a<br />
mania second only to worshiping the sun. It's not safe to be<br />
lukewarm about safety in this country.<br />
So, you're in the right place at the right time-safety has<br />
never been a hotter topic in the heavy trucking industry.<br />
Electronic$ is also a hot topic, and I'm going to discuss<br />
how electronic devices may be able to lower the accident<br />
rate and help truck drivers do their job better.<br />
The following electronic systems are available or are in<br />
the process of development.<br />
AGS- Automatic gear shifting<br />
HUD-Head-up display<br />
DPS- Driver positioning $y$tem<br />
Driver seat with memory<br />
Steering wheel with memory<br />
Extemal minors with memory<br />
ALI- Axle loading indication<br />
MTS-Mobile telephone system<br />
Yellow pages<br />
Positioning<br />
Route guidance<br />
Navigation<br />
Personal alert<br />
RDS- Radio data and information system<br />
GPS- Satellite positioning system<br />
ELF- Electronic line following<br />
OTS- On-board traffic signs<br />
TWS-Truck work station<br />
Function programs<br />
Transport programs<br />
Communication programs<br />
Navigation, maps, etc.<br />
Pleasure Programs<br />
Technology NOT available commercially or LACKING<br />
technology:<br />
222<br />
ECC- Enhanced cruise control<br />
Keeps safe distance under varying speeds<br />
and conditions<br />
within the information chain fleet-vehicle-customer will be<br />
equipped with electronic infrastructure in future, so as to<br />
enable an unintemrpted flow of information parallel to<br />
goods transport.<br />
ADS- Automatic Driving System<br />
Convoys<br />
Merging, passing, exiting<br />
Avoiding collisions<br />
That's a rather long and impressive list.<br />
But the REAL question is what technologies will be the<br />
most useful, the most effective, AND the most appealing to<br />
customers?<br />
And what electronic equipment makes sense on a heavy<br />
truck?<br />
After their cost, there are three things to consider about<br />
electronic safety devices-reliability, reliability, and reliability.<br />
I think we all leamed about the importance of reliability<br />
in safety-related equipment from the antilock brake fiasco<br />
ofnearly l0 years ago.<br />
My first topic is electronic equipment to monitor the<br />
driver.<br />
Available devices and technology include:<br />
MSG-Maximum speed governor<br />
ET- Electronictachograph<br />
TRS- Trip recording systems<br />
This technology has varying degrees of merit and<br />
usefulness.<br />
In the end, however, no electronic or mechanical warning<br />
device is as effective as the waming system already built<br />
into the human body.<br />
I have my doubts about any alarm bell being able to<br />
change driver reactionTbehavior.<br />
Shouldn't take too much decision-making responsibility<br />
away from driver.<br />
If we could find an electronic device that kept a driver<br />
alert, should it warn the driver? Or the dispatcher? Or should<br />
it stop the truck? This is not an easy decision.<br />
Another hot topic today is for electronic devices to provide<br />
better feedback to the driver on vehicle dynamic performance*braking,<br />
skidding, roll, etc.<br />
Technology available includes:<br />
ABS-Lock-free brakes, tractor-to-trailer<br />
compatible<br />
ASC- Anti-spin traction control<br />
FIS- Fault indication systems<br />
DIS- Driver information sy$tem, including<br />
computer
The increase in safety when applying electronics is<br />
caused by the fact that the driver is relieved of control<br />
functions which can be expressed by explicit algorithms. By<br />
way of example this is demonstrated in figure 2. In the<br />
middle it is indicated that in the conventional vehicle the<br />
driver himself acts as a controller who compares the target<br />
and actual data and continuously derives from them the<br />
adapted positioning commands. With the application of<br />
electronic control the driver's part is restricted to act as a<br />
pilot as indicated in the lower paft who prescribes the target<br />
data and leaves the execution as well as the reaction to<br />
disturbing factors to the electronic control. It is immediately<br />
evident that thus a capacity reserve is built up on the part of<br />
the driver, which is either available for superior guiding<br />
functions or helps to improve reaction and alertness in unforeseeable<br />
situations.<br />
One objection against the application of electronics in<br />
vehicles is the supposed unreliability. Two tendencies are to<br />
be seen which allow the conclusion that electronic control<br />
will equal the high degree of reliability which the other<br />
vehicle components have reached already. Within the field<br />
of electronics as such the development offers increasing<br />
possibilities to provide additional routines for recognizing<br />
and correcting failures already in the design phase. Besides,<br />
electronic systems are increasingly becoming integrated<br />
components of the vehicle whose requirements concerning<br />
housing or $urounding conditions can be considered in the<br />
design phase of the vehicle already.<br />
For a representative electronic system the anti-lock braking<br />
system, sound statistical data as to reliability are available.<br />
This system has been under observation for the longest<br />
period of time as it was introduced for commercial vehicles<br />
in '83. If one examines the causes of the individual failures,<br />
the wiring hamess and the connection plugs are found to be<br />
the major trouble sources (figure 3). This statistic also includes<br />
one-shot troubles which take place under irreproducible<br />
conditions. From this it is evident that increasing<br />
the reliability means primarily increasing the soundness<br />
of the electro-mechanical connections.<br />
Irt the beginning it was pointed out that the purpose of<br />
electronics is to act as a controller in the place ofthe driver.<br />
As a precondition for this it is necessary to get a better<br />
insight in the human control mechanism. Practically it is<br />
hard to prove as the test conditions cannot be reproduced<br />
with sufficient accuracy and above all observations beyond<br />
the dynamic limit or in critical driving situations can only be<br />
performed to a limited degree. In this situation the Mercedes-Benz<br />
Driving Simulator in Berlin constitutes an efficient<br />
development tool (figure 4). Based on hardware which<br />
reaches the boundaries of the technical possibilities available<br />
today all sensual impressions----optical acoustical or<br />
mechanical-are simulated as realistically as possible so<br />
a$ to te$t the reaction of the driver under the desired<br />
conditions.<br />
Of the many interesting studies regarding vehicle dynamics<br />
or driver behaviour under stress conditions, some studies<br />
of the appropriate failure mode are mentioned in connection<br />
with the development of 4-wheel steering or fully active<br />
suspension control. The purpose was to determine which<br />
loss ofcontrol under certain critical driving conditions can<br />
be compensated for by the driver and which intrinsic safe<br />
performance is needed.<br />
A study which seems to be rather curious at a first glance<br />
should also be mentioned, namely to gain a deeper understanding<br />
of the drivers of tank trucks. The simulation of a<br />
real accident during which a car had a partially offset headon<br />
collision with a tank truck was intended to prove whether<br />
the driver of the tank truck would have had a chance to<br />
evade the car by a sufficiently quick steering manoeuvre<br />
without endangering himself by leaving the road. The influence<br />
of the moving liquid and the resultant shifting of the<br />
center of gravity was of major importance since it was<br />
assumed that the fuel tank and its chambers were filled to<br />
only two-thirds.<br />
Figure 5 shows the real accident situation above, in the<br />
middle and in the lower part two $cenes in the driving<br />
simulator which illustrate how the accident happened as<br />
seen by the truck driver. Figure 6 shows the steering performance<br />
of 3 characteristic drivers during the collision. Additionally<br />
the truck speed and the maximum steering angle<br />
speed are indicated. Driver I was the only one out of 20 who<br />
managed to avoid both colliding with the car and leaving the<br />
road. Driver 2 as a representative of the average succeeded<br />
only in avoiding the collision, but he came off the road.<br />
Finally driver 3 shows the pattem of a driver who maintains<br />
the highest speed. Although he generated the highest steering<br />
angle speed he did not succeed in staying on the road.<br />
This example shows very clearly that certain studies cannot<br />
be made at all without the driving simulator. An evalua'<br />
tion of statistical data-a method which is often used to get a<br />
deeper understanding of specific behaviour pattems
SLC- Air suspension leveling conrrol<br />
ASS- Active suspension systems<br />
Another area of interest are the electronic and conventional<br />
devices that show potential for improved direct and<br />
indirect driver field of view.<br />
Probably the most important device is larger windshields.<br />
Increasing glass area, changing to curved windshields and<br />
making corner posts slimmer have improved driver visibility<br />
greatly.<br />
But increasing the greenhouse area means decreasing the<br />
amount of metal in the cab. This makes protecting the driver<br />
more difficult-and leads to the conclusion that a steel cab<br />
is the best way to make the driver more secure.<br />
Improved aerodynamics also increase visibility by producing<br />
sloping hoods and rounded fenders.<br />
Another conventional solution is electric mirrors-mirrors<br />
adjustable by a flick of a switch that produce a wider<br />
field of vision for the driver. Devices that keep these minors<br />
clean and defogged also are impofiant to safety.<br />
Head-up display technology also improves the driver's<br />
field of view. With readings projecred on rhe windshield, he<br />
can monitor instruments and still keep his eyes on the road.<br />
Also important is television monitors, which are especially<br />
good for eliminating blind spots.<br />
A final item to consider is if a too-comfortable cab affect<br />
a driver's alertness.<br />
Unfortunately, this is not yet a problem.<br />
We've come a long way in improving cab design and<br />
environment but there's a long way to go.<br />
Trucks must b€ designed to provide a certain level of<br />
creature comforts for drivers.<br />
This is what I call the man-machine concept.<br />
Cabs must be designed so they are comfortable, convenient<br />
and logical. They must be designed to eliminate any<br />
chances of driver error that might lead to accidents.<br />
Increased cab volumes in the U.S.-a direct result of the<br />
1982 Surface Transportation Act--ended restrictions on the<br />
overall length of tractor-trailer combinations.<br />
These roomier cabs made driving easier, more convenient.<br />
Cabs should be designed to require a certain level of<br />
effort, a certain level of participation from the driver.<br />
There must be enough for a driver to do to keep him alert<br />
but not too much to do to distract him from driving safely.<br />
Too much automation could induce boredom.<br />
Sound frequency research have made progress in finding<br />
the "right"<br />
frequencies to keep drivers alen and reducing<br />
noise-induced fatigue.<br />
For example, low-frequency sounds puts drivers to sleep,<br />
while high-frequency sounds cause fatigue. So the effective<br />
cab design must find a happy sound frequency medium.<br />
Vibrations can cause discomfort and fatigue.<br />
The body tolerates vertical vibration better than horizontal<br />
vibration. Suspensions and seat designs can reduce vertical<br />
vibrations and increase comfort.<br />
But further advances in braking and acceleration have to<br />
be refined to reduce horizontal vibration. But research has<br />
determined that you shouldn't isolate the driver from the<br />
feel of the road too much.<br />
While much is possible to reduce accidents and make the<br />
operation of trucks safer, I'd like to close by making a few<br />
important points.<br />
L Accident prevention is the key safety goal of truck<br />
manufacturers. Volvo Truck's Accident Investigation Team<br />
has been in operation for 25 years studying how engineering<br />
and manufacturing improvements can help avoid accidents.<br />
2. Safety has little impact of cost lF safety features are<br />
designed into the truck rather than being added on.<br />
3. There are a number of electronic devices that could<br />
help prevent truck accidents-IF used right. We must establish<br />
our priorities in adopting safety features and devices in<br />
trucks.<br />
While we can't put a price tag on human life, there is a<br />
price tag on commercial vehicles.<br />
4. It is the markerplace that will ultimately determine<br />
WHICH safery technology it will accept and WHEN it will<br />
accept them.<br />
In the meanwhile, we in manufacturing will continue to<br />
protect drivers with current safety devices:<br />
Three-point safety belt<br />
Cab safety cage principle<br />
Steering wheel redesign<br />
Pedal area redesign<br />
Better dash layout<br />
Reinforced firewalls<br />
Better-protected brake hoses<br />
We believe in gradual, realistic advances in engineering<br />
and govemment regulation that results in significant advances<br />
in improving equipment and reducing accidents.<br />
223
Safety Situation of Heavy Thuck Occupants in TFaffic Accidents<br />
Written Only Papers<br />
Dietmar Otte,<br />
Traffic Accident Research Unit,<br />
Medical University Hannover (FRG)<br />
Hermann Appel,<br />
Institut of Vehicle Engineering,<br />
Technical University Berlin (FRG)<br />
Abstract<br />
Two hundred sixteen accidents of trucks with the permissible<br />
gross-weight of ovet 7 tons were analyzed- These<br />
accidents were documented by a scientific research team,<br />
directly at the scene of the accident. The injury situation of<br />
the truck passengers and the injury risk from these trucks for<br />
other traffic participants is described. A high safety standard<br />
for truck passengers is apparent, but only in collision<br />
with accident parties of lower weight categories.<br />
<strong>Int</strong>roduction<br />
The injury risk for truck passengers increases in<br />
collisions with parties of higher weight categories. The<br />
correlation between AIS and mass factor is also analyeed-<br />
Feasible measures for the minimization of accident<br />
con$equences were demonstrated, especially for<br />
modification of the outside truck structures.<br />
Within the total picture of all traffic accidents, trucks are<br />
noted for tittle accident participation and also for less injury<br />
severity for truck passengers. Truck passengers represent<br />
only 2.3 percent of the number of all traffic victims (figure<br />
l). On an average only 0.17 percent of injured truck<br />
passengers can be assigned to each truck accident with<br />
personal and extensive material damage (figure 2)' In<br />
comparison with other traffic participants, no great injury<br />
risk is apparent for truck passengers. This evidently high<br />
safety standard of trucks seems to minimize the need for<br />
preventive measures like safety belts, safety steeringwheels<br />
and for modifications of energy-absorbing<br />
structures of the passenger compartment. The proportion of<br />
personal injuries resulting from accidents with trucks<br />
lllA ltrt n*, {8ttt9 huil dnd l.lllrtl Pflo|lt<br />
Floure 1. Dlstrlbutlon ol traftlc Fartlclpants of all Inlured<br />
peisona. $ource: D€Psrtment of Stgtlstlcs FRG.<br />
zu<br />
trrA rrr,<br />
.ash pdrtlslpd"tt tgffiffi*,4<br />
FIoure 2, Ouots of Inlured persons and accldentg each<br />
pa*rtlclpants.<br />
Source: Ddpartmint of Statisti€ FRG.<br />
Floure 3. Portion of accidents wlth psrsonal Inlury (100% = all<br />
ac*cldents of sach panlclpant).-Source: Departmenl ol<br />
Statlstlcs FHG.<br />
(figure 3) clearly shows the danger to which other traffic<br />
participants are exposed by trucks. Similar to car accidents<br />
with a proportion of 48.6 percent personal damage, truck<br />
accidents result in 42.8 percent of personal damage. This<br />
means that priority must be given for measures to ensure the<br />
passive safety of trucks.<br />
Objective<br />
ln order to determine the need for such measures and to<br />
evaluate the safety of todays trucks, an analysis of the<br />
accident event is necessary. A rough orientation of the<br />
accident situation, like the frequency of certain accident<br />
types and locations can be taken from statistical reports<br />
which are based on police records. These are collected at the<br />
Statistic Federal Office at Wiesbaden (West Germany) for<br />
the whole of the German Federal Republic (SIBA 1)' They<br />
provide an excellent general view of the federal and<br />
regional accident situation and help to recognize<br />
fundamental focal points. But an optimum of reduction of<br />
accident causes and accident consequences is only possible<br />
after cognition and evaluation of injury-causing facts, of<br />
typical kinematic movement procedures and a
comprehensive description of the individual injuries<br />
sustained. Such a detailed accident analysis of individual<br />
cases is available in Germany by the research project<br />
*'Investigations at the scene of the accident," for which a<br />
specially trained team documents accident characteristics.<br />
independent of police investigations.<br />
Working method and data recording<br />
In the greater vicinity of Hannover (West Germany), an<br />
interdisciplinary research team, consisting of doctors and<br />
engineers drives to the scene of an accident, immediately<br />
after the accident has taken place. They are informed of the<br />
accident by the central rescue headquarters. The accident<br />
site is approached in vehicles equipped with blue light and<br />
sirene. On arrival they immediately start collecting information<br />
about accident traces, vehicle deformations and impact<br />
points on persons. With a stereoscopic camera, true^toscale<br />
drawings are produced which make a reconstruction<br />
and an analysis of the accident and collision phases possible.<br />
Otte (2) and Dilling (3) give a detailed description of the<br />
procedure. Injuries are documented in detail (4), according<br />
to type, localization and severity degree AIS.<br />
From these investigations 216 accidents concerning<br />
trucks with the permissible gross weight of 7.5 metric tons<br />
were at our disposal for evaluation. Figure 4 shows the<br />
distribution of the collision parries, divided inro weight<br />
categories. The most frequently registered truck accidents<br />
are those with cars (40.3 percenr). Multiple collisions are<br />
with 14.4 frcrcenr of all collisions remarkably frequenr,<br />
especially for truck-trailers ( 19.8 percent) and tractor-trail-<br />
er units (13.6 percent).<br />
In this case more than two objects or<br />
traffic participants respectively are involved as collision<br />
partners in one accident.<br />
!ollltlon-<br />
pdrll|cr<br />
lolril<br />
t4-l<br />
vehlcle llpe<br />
lruck<br />
r,rl - rrl<br />
a{l<br />
Itucl<br />
> ltl<br />
frtt I<br />
lr!llar<br />
unll<br />
atr<br />
rml*<br />
lrctlrr<br />
unll<br />
tx,<br />
lolql lnl tl6 zl 6l t6<br />
ll<br />
!dt<br />
rueh<br />
pcde!lrlttn<br />
oblrcl<br />
muluplc<br />
to.l<br />
lr.t<br />
t6.t<br />
r.l<br />
t.t<br />
lr.l<br />
70,r tt.t tt.r tt,t<br />
lt.t 2',.6 lt.t tr.o<br />
f.f 7t,6 tr.r zo.E<br />
- 6.t t.0 r.t<br />
1., 9.1<br />
f .t tr,r l9.t lt,6<br />
Flgure4. Golllrlon-partners of trucks u 7,5t (10O96=ail vshtctcs<br />
sEch truck colloctlyc).<br />
Special features of the accident situation<br />
Truck accident$ yary according to the different types of<br />
trucks. Accidents with trucks of lower weight categories are<br />
more frequent inside towns, whereas accidents with heavy<br />
truck-trailer and semi-trailer units are more frequent outside<br />
town limits, especially on motorways. On federal highways<br />
accidents with truck-tractor trains were observed in 34.1<br />
percent and with truck trains to 47.7 percenr (figure 5),<br />
while approximately only l8 percent of the involved trucks<br />
on federal highways belonged to the weight cfltegory below<br />
13 tons. In comparison, the truck weight category between<br />
7.5 tons to 13.0 tons on highways represents with g.l percent<br />
only a very small proportion of accidents. In town<br />
districts, however, it represents fl proportion of 36. I percent<br />
of all accident vehicles.<br />
htghwcy country urbsn<br />
femltrqller<br />
unlt<br />
trcrller unlt<br />
truclr > l3t<br />
truclr 7.5t-l3t<br />
Flgure 5. Reglonal locallzatlon ol truck (ts 7,5 t)-accldcntacsnss<br />
(lfil% = cach area).<br />
lnrpdcl-drcd lmpscl-ares trucft<br />
rollklo,n-Fqilnil tro$t rldc tc€t olharr<br />
cgl 47.17" (r- ll<br />
Itfirl<br />
rldc<br />
ragl<br />
olh.rl<br />
lrucfr Z3.l%<br />
(!.{lt<br />
lroill<br />
rldr<br />
,aaz<br />
olhcri<br />
lwo-wheeler<br />
19,1"/,<br />
lrurl<br />
rlrlt<br />
latlt<br />
othrn<br />
(i:i.<br />
t7.o%<br />
?9.5%<br />
t.0t6<br />
2.t%<br />
to.9tt<br />
9.3%<br />
23,t%<br />
1.57.<br />
r3.9%<br />
l{.r%<br />
9.t7,<br />
!.+%<br />
lt.t%<br />
2.3t6<br />
la.o16 25.6%<br />
1.ru,<br />
L27,<br />
{t.7%<br />
l3,e%<br />
,,.87.<br />
t.3%<br />
I,tt6<br />
2.87.<br />
t.t7.<br />
l.l'6<br />
2.t%<br />
pedeslr.5,97 8I.87o 9.t% 9.lYo<br />
obfcct4.3,% t?.54/n 50.0% 12.5t6<br />
Flgure 6. lmpacl-areas on the truck ln rllailon to the lmpact<br />
arcac of lhe colllslon partnerr (1fit% = slt cotilelone dech<br />
partner).
The collision types of trucks are determined by the varying<br />
accident situations.<br />
The collision constellations of the truck are shown in<br />
figure 6. Trucks collide mainly frontal. This fact is verified<br />
by the graphical illustration of detailed impact points in<br />
figure 7.<br />
lront tolcl! n-94 (50,8%)<br />
lell eenlri rlghl<br />
?t.3<br />
ffiil<br />
Il.g r effil<br />
ilt:f,',rE$ rlffi<br />
Hm<br />
n.16 (35.6*)<br />
wldc-ldccd<br />
I8,2 sl.e<br />
tegEEEEEEEEEEEEEEEt<br />
tots$ n-27 ll+.97e,<br />
n-a (6.9t)<br />
ffi eottto ol eyeltsts/Pedestrtans<br />
Flgure 7. lmpact areas on the truck In detsll detcription.<br />
In frontal collisions, cars are most frequently hit laterally<br />
by trucks (29.5 percent). In comparison, many collisions of<br />
trucks against trucks occur with front and rear involvement<br />
(23.3 percent plus 25.6 percent). Two-wheel users frequently<br />
collide frontally with the side of trucks (41.7 percent).<br />
Pedestrians are hit frontally to a percentage of 81.{t.<br />
The side area of the truck shows the rear region, especially<br />
the rear axle region as a frequent impact point. The rear<br />
226<br />
region of the truck sides, especially the rear axle region, is a<br />
frequent impact point (see figure 7).<br />
Injury situation<br />
Injury severity<br />
The description of the injury severity is based on the<br />
MAIS (maximum AIS) which includes all severity degrees<br />
from 0 = uninjured to 6 = dead. It describes the maximum<br />
severity degree ofeach single injury. Ofthe 261 truck passengers<br />
documented in the case collective of accidents with<br />
personal damage mentioned here, 85.4 percent remained<br />
uninjured. In comparison, only 10.3 percent of uninjured<br />
were registered for the collision parties (figure 8). 38.5<br />
percent of the collision partners sustained slight injuries<br />
(MAIS l/2), but 23.1 percent received severe or most serious<br />
injuries (MAIS 5/6). With truck passengers injuries of<br />
severity degrees 5/6 were found in only 0.4 percent (n=l).<br />
This clearly demonstrates the injury risk for traffic participants<br />
in collision with trucks. External traffic participants<br />
like two-wheel users and pedestrians are especially exposed<br />
(figure 9). ln collision constellations with these traffic participants<br />
no truck passelgenr were injured, but no extemal<br />
traffic participants remained uninjured. Two-wheel users<br />
are especially at risk. 39.5 percent of them received most<br />
severe injuries (MAIS 5/6) and 42.1 percent of them were<br />
seriously injured (MAIS 3/4). Pedestrians also sustained in<br />
two-thirds of the cases serious injuries (MAIS exceeding 2).<br />
tnlury- lruclt<br />
MAIS<br />
dll occupqnli<br />
+tal<br />
0 ro 86.4%<br />
u2<br />
f,<br />
Eolllslon-pdrlner<br />
I<br />
occupdnl|/<br />
lrilo-rf,hril-rtdcrr/<br />
trrdlrlrlonl ,*- rro<br />
to.t*<br />
tt.rz 38.5%<br />
3t4 2.7% 24.2%<br />
5t6 0.4"/o ?,3,.le/c<br />
Flgure 8. Inlury-severlty-grades for occupsnts ol trucks (t 7, 5<br />
t) and theh colllelon-partners.<br />
MAIS<br />
lructr F cdr ruck Hlwo-wh€€lE<br />
trucl- rFt b.lld IrueI- lrtsl-<br />
Ddqlrldn<br />
loldl<br />
0<br />
n.l0a n-tl<br />
t5.{% ET<br />
n-{l<br />
E<br />
n.3l h.It<br />
@<br />
h.ll<br />
u7<br />
3t4<br />
1.9% ffi,n G<br />
[<br />
l".n'- f,..on<br />
",'*<br />
E<br />
laz,r%<br />
b E*.<br />
5t6 15,+% ffi''*<br />
1,..0*<br />
Figure 9. Injurity-severlty-grsd6s ot occupants of trucks (> 7,5<br />
t) and their colllslon-psrtner$.
Injured truck passengers were as a rule registered only in<br />
collisions with vehicles and objects (figure 9/10). No severe<br />
or most serious injuries (MAIS exceeding 2) could be observed<br />
for 104 truck occupants, in collisions with cars. Only<br />
L9 percent of the truck occupants sustained injuries, but<br />
only 15.4 percent of the belt-wearing car passengers remained<br />
uninjured and one third of them sustained serious<br />
injuries MAIS exceeding2 (32.7 percenr). Injuries to rruck<br />
passengers in single accidents of trucks were observed to 50<br />
percent, but exclusively of severity degrees l/2. In collisions<br />
between truck$, a significantly greater injury risk ex-<br />
ists for truck passengers, especially when the mass of the<br />
collision parties is quite similar. Figure l0 demonstrates the<br />
fact that in accidents of trucks with collision parties of lesser<br />
mass, for instance of the weight category less than 3.5 tons,<br />
passengers in trucks up to 7.5 tons remained to 84.2 percent<br />
uninjured. Here severity degrees MAIS 5/6 were not observed.<br />
In comparison passengers in trucks of weight category<br />
from 7.5 tons onward in collision with vehicles of the<br />
same weight category remained in only 52.6 percent uninjured,<br />
7.9 percent of them were seriously injured (MAIS<br />
3/4) and 2.6 percent were most seriously injured or killed<br />
(MArS 5/6).<br />
Influence of weight relation<br />
The statistic-mathematical proof about the connection<br />
between the danger to truck passengers by the mass relation<br />
of the collision parties is verified when applying the relation<br />
'Weight<br />
of truck from 7.5 tons onward to the weight of the<br />
collision partner' and the injury severity MAIS caused by<br />
the accident for this type (figure I l). This so-called mass<br />
factor was on the one hand determined for the passengers of<br />
the collision partner of the truck (figure I l-left graphic)<br />
and on the other hand for the passenger of the truck (figure<br />
I l-right graphic). With a mass relation of approximarely<br />
5, this means for the pa$sengers of the collision partner that<br />
they will probably remain uninjured in the accidenr. The<br />
injury probability in the arithmetic middle should be expected<br />
for a mass relation of approximately 3, but as shown<br />
in the run of the curve, a similar injury probability exists for<br />
all severity degrees.<br />
cCllrlil tsucl*lrucl rt,tl lruIFlrel
the pelvis/abdomen and thorax region for pedestrians' Ttvowheel<br />
users are very much at risk for fractures of the cervical<br />
vertebra (26.3 percent of two-wheel users). Noticeable<br />
are neck injuries, also with car passengers, who to 20'4<br />
percent sustained these injuries. In other traffic collisions'<br />
car passengers very rarely suffer neck injuries (Rether, 5).<br />
Passengers of trucks of the weight category less than 3'5<br />
tons also sustain substantial injuries to the whole body.<br />
Injury causes<br />
Passengers of trucks from 7.5 tons onward are mainly<br />
injured by parts of the vehicle front (figure l3), such as the<br />
windscreen (to 18.8 percent), the dashboard (36.8 percent),<br />
and the front foot-room ( I I .3 percent). Due to the fact that<br />
passengers of trucks weighing less than 7.5 tons are more<br />
often laterally impacted, the percentage of lateral interior<br />
structures as injury-causing parts is increasing (10.2 percent),<br />
while injuries caused by the dashboard and windscreen<br />
region are observed to a lesser degree. For lighter as<br />
well as for heavier trucks frequent injury causes are found<br />
outside the vehicle (for both collectives over l3 percent).<br />
Injuries sustained by truck passengers are mainly of a less<br />
serious kind. Approximately 85 percent are of severity degrees<br />
AIS I and 2. Severe injuries are quite rare in heavy<br />
trucks. In trucks weighing less than 7.5 tons injury severity<br />
degrees from AIS I upward are more frequent. This is<br />
especially the case in lateral collisions, by lateral interior<br />
parts as well as by parts outside the vehicle.<br />
ccura ol lnlury<br />
dsrhHH<br />
Itml lrg Fan<br />
lFlatld-lclarcl<br />
lnl.rld-ast<br />
thrflil lllllngr<br />
oulrld. vrhlqlr<br />
olhrr<br />
lolcl<br />
txl<br />
lr,l<br />
tfrt<br />
lruch r t.5l<br />
qll dEupsll<br />
lr.i<br />
6.J<br />
al<br />
t.t<br />
t(l<br />
e3<br />
ru urlrn >:<br />
10{I0<br />
9t.t t t<br />
tdo.0<br />
I00,0<br />
IOO.0<br />
t00,0<br />
tt9 1l.r<br />
t0.0 140<br />
tn ur le3<br />
Irftt < t,tl<br />
oll *EuFdrll<br />
lolql<br />
r- li!<br />
ttl<br />
rl.5<br />
tt.l<br />
,.2<br />
l0.t<br />
L6<br />
r,!<br />
It.1<br />
tt,6<br />
ru vrlrr >r<br />
F llcx +<br />
n,, 1l<br />
to.t rt l<br />
tt r u.i<br />
6d' 55.5<br />
too.!<br />
loo.o<br />
to.6 tt.a<br />
,l,t r|'l<br />
rll<br />
E-oGuFnlt<br />
9,0<br />
,1'<br />
4r<br />
tl.J<br />
t.0<br />
tl.t<br />
4.6<br />
tt6<br />
t$l-b.ilrd<br />
tu urlrn '<br />
te6 u,a<br />
,Lt n.9<br />
t .5 tl.a<br />
dr.! trc<br />
teo t[o<br />
tt.0 lt.o<br />
tt,t 04.,<br />
lo,t lr.t<br />
Floure 13. Cauees of lnlurlst for trafflc members In traffic accl'<br />
d6-nts wlth trucks z 7,5 I and Indlcatlon of the severltygrades.<br />
Car passengers are distinctly more severely injured, even<br />
with belt usage. 73.8 percent of the injuries are of severity<br />
degree AIS I and 2. Mainly regarded as injury causes are<br />
parts of the dashboard (to 26.7 percent), lateral compafiment<br />
parts (21.3 percent) and also by parts of the interior<br />
like steering wheel and safety belt (11.8 percent). Injuries<br />
caused by the belt are exclusively soft-part injuries, due to<br />
the close fitting belt strap holding the body. For belt-wearing<br />
car passengers 4.6 percent of all injuries are still inflicted<br />
by parts outside the vehicle. This may be due to extensive<br />
intrusions and deformations of the passenger<br />
compartment of cars colliding with trucks. Figure 14 shows<br />
228<br />
the injury situation of two-wheel users and pedestrians in<br />
collision with trucks from 7.5 tons upward and demonstrates<br />
that pedestrians as a rule sustain injuries by the truck<br />
side, which proves to be especially dangerous for this group<br />
of traffic participants, in view of protruding, often edEY<br />
structures. 29 percent (20.5 and 8.5 percent respectively) of<br />
two-wheel users sustain injuries by side structures of trucks.<br />
Injuries due to overrolling are also quite frequent, i'e.23.7<br />
percent of injuries inflicted on two-wheel users and even<br />
63.4 percent of injuries to pedestrians are induced by over*<br />
rolling. These injuries are often serious (for two-wheel<br />
users 38.2 percent exceeding AIS I, pedestrians 52.5 percent<br />
exceeding AIS l).<br />
:dus6 ol lfllury<br />
rollover<br />
toqd gurlEte<br />
lront €nd<br />
wlnd!dreen rcglon<br />
sldc<br />
regl<br />
rpcctllc lruch-pqrl5<br />
own lwo-wheeler<br />
own h6lmsl<br />
olhcts<br />
lolql<br />
n. lE6<br />
69,{<br />
ls.{<br />
t1o<br />
p6d6rlrldnr<br />
6,6<br />
ojo<br />
,.,<br />
lnlurT-sevcrlll<br />
AIS r/2lArs >2<br />
- 100% -<br />
47.5 52.5<br />
88,0 lu.0<br />
'o: il:'<br />
s3.3 6&7<br />
100.0<br />
100.o<br />
lnlurles<br />
loldl<br />
n- 618;<br />
23.7<br />
22,.O<br />
'j<br />
e0.5<br />
$.9<br />
?,f<br />
8.5<br />
i,l<br />
0,6<br />
nturY-swerllI<br />
us vtltts >t<br />
F<br />
61.6 3E,t<br />
8t.7 le.3<br />
66.0 34,O<br />
6t.t 3r.,<br />
6tr0 36,0<br />
i7.8 t2.2<br />
84,1 15,9<br />
87.6 l2.S<br />
100.0<br />
Fioure 14. Cauees of iniurles In trsfflc sccldent wlth trucks E 7'<br />
5 fand Indlcatlon of the- severlty-grades'<br />
Discussion and consequences<br />
216 trucks of a weight category from 7.5 tons upward<br />
were documented, reconstructed and analyzed by investigations<br />
at the scene of the accident. For the analysis impact<br />
points, vehicle deformations and mass proportions of the<br />
collision parties were examined and compared with the<br />
injury severity of truck passengers and collision pafiner.<br />
For passengers of trucks from 7.5 tons onward, a high<br />
standard of safety is evident. Only in collisions with vehicles<br />
of a heavier weight category the situation becomes<br />
dangerous for truck passengers. The significant influence of<br />
mass relations between collision parties on the injury probability<br />
and severity could be established within the framework<br />
of this study. All analyses did show that there is much<br />
more safety for truck pas$engers in heavy truck trains and<br />
truck-trailer units than in trucks of lighter weight categories.<br />
for instance the solo truck of less than 3.5 tons. This<br />
calls for meartures to achieve more safety for passengers,<br />
especially as far as the last mentioned truck group is concerned.<br />
As these vehicle groups are to a high percentage also<br />
involved in pedestrian collisions (see Otte, 6) and cause one<br />
third of accidents inside towns and closed areas, special<br />
measures are necessary for the safeguarding of extemal<br />
traffic participants. For the lighter trucks especially, modification<br />
concepts for the passenger comPartments like<br />
those installed in cars are necessary. The use of safety belts<br />
should also be obligatory for them.
A high injury risk is evident for car passengers, especially<br />
when the passenger compartment is part of the deformation<br />
area. Even for belt-wearing pas$engers a greater than average<br />
injury risk still remains. This may be due ro high vehicle<br />
front and also to the relatively small amount of energy<br />
absorption of the lateral car $tructures. Collisions between<br />
trucks and external traffic participants are regarded a$ e$pecially<br />
dangerous. While pedestrians are usually hit by the<br />
box-type shape of the truck and consequently sustain partly<br />
very serious injuries to the whole body, two-wheel users<br />
often receive very serious injuries by the side of trucks.<br />
There is a pronounced high risk for the momentous overroll<br />
injuries, mainly for pedestrians due to the high ground<br />
space. The, as a rule unprotected side of trucks makes an<br />
underdriving of the vehicle body for the two-wheeler possible.<br />
Edgy frame structures are an additional injury risk.<br />
The above analysis ofreal accidents emphasizes the need<br />
for modification measures for trucks. In view of the cognitions<br />
derived from our investigations, these should be as<br />
follows:<br />
For the protection of external traffic participants like<br />
pedestrians, cyclists and riders of motorized two wheelers:<br />
r I pulled down truck front to reduce the danger of<br />
underdriving and eliminate the danger of<br />
overrolling.<br />
r An energy-absorbing front area, for instance by<br />
special inserted impact regions on frequent impact<br />
points, for the reduction ofhead, thorax, and<br />
leg injuries for these traffic participants.<br />
r The bumper of trucks should have a thick rubber<br />
covering, if possible in foot-rest level of the twowheeler,<br />
in order to ensure more protection<br />
against tibia injuries at low impact speed.<br />
r Side and rear protection to eliminate underdriving<br />
of two-wheelers between the axles and truck<br />
body. Only such underdriving protections should<br />
be used that cover the side regions completely.<br />
Gaps and edgy conceptions (type of frame fixture)<br />
make an entangling with the two-wheelerpossible<br />
and the resulting injury severity could not b€ reduced,<br />
for instance in the case of a possible head<br />
impact with edgy frame structures.<br />
r The elimination of edgy vehicle parts which are<br />
especially injury causing with disposal and agricultural<br />
vehicles.<br />
For the protection ofother vehicles, especially cars:<br />
r Height adaption of energy-transmitting regions<br />
and implementation of energy-absorption regions<br />
on trucks, for the reduction of impact force by the<br />
truck also. This would lead to a compatible collision<br />
constellation.<br />
For the protection of truck pfls$engers<br />
themselves:<br />
r Establishing of a safety standard similar to that for<br />
cars. Basically, the same safety standard should<br />
be created for truck passengers as for cars; i.e.<br />
energy absorbing front structure, reinforcing of<br />
the passenger compartment, covering of the dashboard,<br />
fixing of safety steering wheels and first<br />
and foremost fixing and use of safety belts in<br />
automatic 3-point quality for all truck passengers.<br />
References<br />
(l) Statistisches Bundesamt Wiesbaden StraBenverkehrsunfiille<br />
1987. Fachserie 8. Verkehr Reihe 3.3<br />
Verlag Kohlhammer, Mainz (1988).<br />
(2) Otte, D. et al, Erhebungen am Unfallort, Unfall-und<br />
Sicherheitsforschung, Heft 37, Bundesanstalt fitr<br />
StraBenwesen, Bergisch Cladbach ( 1982).<br />
(3) Dilling, J.; Otte, D., Die Bedeutung drtlicher<br />
Unfallerhebungen, im Rahmen der Unfallfor$chung,<br />
Unfall.-und Sicherheitsforschung, StraBenverkehr, Heft 56,<br />
Bundesanstalt ftir StraBenwesen, 5948, 1986.<br />
(4) American Association forAutomotive Medicine, The<br />
Abbreviated Injury Scale-Revision 1985, Morton Grove,<br />
Illinois, USA (1985).<br />
(5) Rether, J.; Otte, D., Verletzungen der<br />
Halswirbelsiiule, beim Verkehrsunfall, Unfallheilkunde 87,<br />
52f530, 1984.<br />
(6) Otte, D., Collision Situations and Consequences of<br />
Injuries in Accidents of Heavy Trucks, Proc. OECD<br />
Sympos.<br />
"The Role of Heavy Freight Vehicles in Traffic<br />
Accidents", Mon$eal (Canada), 28.-30. April 1988.<br />
Improvements in the Fronto-Frontal Collision between Personal Vehicle (PV) and<br />
Heavy Duty Vehicle (HDV)<br />
Written Only Paper<br />
Pierre Soret,<br />
Renault Vehicules Industriels<br />
Abstract<br />
Safety is a major objective in the program of the<br />
experimental HDV Virages specifically to obtain<br />
improvements in the case of the fronto-frontal collision<br />
between a PV and a HDV.<br />
The architecture and the structure of the tractor have been<br />
designed in this aim.<br />
To evaluate the obtained performances:<br />
r Choiced a typical PV in the market.<br />
r Studied and defined criteria of dammage for the<br />
structure and for the occupants of the car.<br />
r Realized crashes of thi$ PV instrumented as usual<br />
with 2 dummies installed in it: first, againsr a<br />
$topped serial HDV as reference, and second,<br />
229
against a simulated front part of the experimental<br />
vehicle Virages. Crashes have been realized in<br />
different cases of speed for the car.<br />
r Compared the results of the two types of crash<br />
tests and evaluated the gains obtained by the<br />
experimental vehicle Virages'<br />
<strong>Int</strong>roduction<br />
The programme of the experimental HDV Virages<br />
includes the improvement of active and passive security.<br />
Among the subjects of this improvement the reduction of<br />
the gravity of the fronto-frontal collision between an HDV<br />
and a PV is an important one, because this type of collision<br />
is the most frequent and the most severe in the collisions<br />
between these vehicles. More, this type of collision creates<br />
the greater number of injuries and deaths among the road<br />
users when a HDV is concemed. So the programme Virages<br />
includes tests to evaluate the improvement made about this<br />
subject.<br />
Conditions of the Tests<br />
The study of the circumstances of such accidents<br />
demonstrates that the collisions may concern either the total<br />
width or a variable part of the cars. In all the cases it is<br />
always the driver's side of the car which is concerned' A two<br />
third of the width collision is the most representatiYe case.<br />
ln many cases the paths of the vehicles are $lightly<br />
parallel.<br />
The speeds of the vehicles at the moment of the collision<br />
are unknown because, at present, there are no means to have<br />
a seriou$ evaluation of these. Therefore we choose to take<br />
the speeds as the main parameter of evaluation.<br />
In the study no element proved that the repartition of the<br />
speeds between the vehicles has an influence on the results<br />
of the collision. So it was possible to choose to have the<br />
HDV in a steady state situation. This simplified<br />
considerably the running of the tests and permitted only the<br />
use of just a front part of vehicle Virages set on a wall.<br />
?t3<br />
widlh<br />
of bh he<br />
car<br />
t-l\<br />
-J<br />
Flgure 1. Tests condltlona<br />
230<br />
#<br />
-|-l<br />
l-l<br />
t-l<br />
#.+<br />
mean$ of two or three tests, the speed which conduct to the<br />
limits of the chosen criteria. This is the speed limit for this<br />
arTangement of vehicles. So, different speed limits can be<br />
defined for the arrangement of different HVD with the same<br />
car. These speed limits characterize the behaviour of these<br />
HDV concerning the reference chosen car.<br />
In conclusion, the behaviour of Virages was evaluated by<br />
comparison with a representative one of the current HDV<br />
tractor in France: the R 310. 19 T from Renault Vdhicules<br />
lndustriels.<br />
Taking in account, first, that the analysis ofaccidents did<br />
not prove a particular PV was concerned, Second, that there<br />
was no barrier available for the purpose of such tests, we<br />
decided to choose a R 9 Renault which is a reuresentative<br />
medium car in France.<br />
Results of the tests<br />
The tests were conducted at three different speeds in the<br />
case of the collision against the R 310. They quantify the<br />
variation of the criteria versus the speed variation. It is<br />
possible to conclude that the speed limit for this case is<br />
approximately 59 kmTh (36,6 nph). As a matter of fact, at<br />
this speed, the HIC and D I criteria for the driver reach the<br />
maximum permitted levels (see figures 3 and 4). The other<br />
criteria and those for the front passenger are acceptable<br />
(figures 5 and 6).<br />
s0 57 s9<br />
Flgure 3. D 1 Crlterlon vsluos aftEr teEta<br />
50 57<br />
Flgure 4. HIG Grltcrlon valucs<br />
59<br />
60<br />
50<br />
20<br />
50 57 59 66<br />
FIgure 5. Thorar ecc6leretlon crltorlon valuss<br />
57 s9<br />
Flgure 6. Femurr ttraln crllerlon valuea<br />
At 66 km/h (41 mph) no limit level is reached in the<br />
collision ofthe car against Virages for all the criteria, but the<br />
gap is small in the case of the HIC of the driver.<br />
An improvement of the speed limit from 59 to 66 km/h or<br />
more has been made with Virages.<br />
Conclusions<br />
The height of the rigid parts of the actual HDV is the<br />
reason of the severity of the collision with PV. The working<br />
parts of the car run under the bumper and the frame of the<br />
HDV. They are only pressed against the ground till they<br />
Flgure 7. Posltlon ol the rlgld parts ol a PV end an actual HDV<br />
23l
each the front axle or the tyres. The bumper of the HDV<br />
may penetrate in the in-door space of the car (figure 7).<br />
The improvements made in the vehicle Virages are<br />
(figure 8):<br />
232<br />
r bumper and rigid parts of the frame at the $ame<br />
height as the height ofthe working parts ofthe car<br />
r reduced front over hang of the HDV = the tyres<br />
limit the deformation of the bumper<br />
r reduction ofthe roughness ofthe bumper and the<br />
rigid parrs of the HDV.<br />
In conclusion, such changes in the way to construct the<br />
front of a HDV allow a significant improvement in the speed<br />
limit of a collision between a HDV and a PV.<br />
J<br />
l<br />
Figure 8. Poeltlon of the rigld partE ol a PV and of Vlragea
Technical Session 2A<br />
Frontal Crash Protection<br />
Chairmanr Kennerly Diggs, United States<br />
Analysis of Frontal Crash Safety Performance of Passenger Cars, Light Tfucks<br />
and Vans and an Outline of Future Research Requirements<br />
James R. Hackney, William T. Hollowell, and<br />
Daniel S. Cohen<br />
United States Department of Transportation,<br />
National Hi ghway Traffic Safety Administration<br />
Abstract<br />
Since 1979, almost three hundred vehicle crash tests have<br />
been conducted in the New Car Assessment Program<br />
(NCAP). Parameters from the crash tests of the vehicles are<br />
presented. Analysis of these parameter$ relative to the frontal<br />
crash safety are performed. The studies are conducted<br />
with fleet weighted populations and include both passenger<br />
cars and light trucks and vans. Comparisons of vehicle<br />
performance are made which suppon the feasibility of potentially<br />
improved safety levels within the vehicle.<br />
Based on the potential for improved safety and on recent<br />
projections of fatalities and injuries by the National Highway<br />
Traffic Safety Adminisrration, an outline of possible<br />
future frontal crashwonhiness research is presented.<br />
<strong>Int</strong>roduction<br />
Since 1979, the National Highway Traffic Safety<br />
Administration (NHTSA) has conducted crash tests of 233<br />
different makes and models of passenger cars (PCs) and 4l<br />
light trucks and vans (LTVs) in the New Car Assessment<br />
Program (NCAP). Each of these vehicles was crashed into a<br />
rigid barrier at a test speed of 35 mph. This is five mph faster<br />
than the prescribed speed for compliance with Federal<br />
Motor Vehicle Safety Standards (FMVSS). The NCAP is an<br />
experimental consumer information program which<br />
develops data on frontal crashes. In this program, a given<br />
vehicle is tested once at the nominal test speed of 35 mph<br />
with restrained and instrumented 50th percentile part 572<br />
dummies in the driver and right front seat pa$senger<br />
locations. The crash test$ are designed to indicate, for<br />
vehicles within the same weight class, the relative levels of<br />
occupant protection and vehicle safety in this crash<br />
condition. The data from these tests provide NHTSA with<br />
the most extensive set of frontal crashworthiness<br />
information ever assembled on production vehicles.<br />
At the Tenth <strong>Int</strong>ernational Technical <strong>Conf</strong>erence on<br />
Experimental Safety Vehicles, a review of the data from the<br />
NCAP vehicles which had been tested was presented (l).*<br />
This report updates the data contained in that review with<br />
the results from an additional 102 vehicles which have been<br />
tested through model year (MY) 1988. In addition to<br />
*Numbers in parcntheses dcsignate refercnces at end of paper<br />
presenting similar tables and charts as in the 1985 paper, this<br />
update provides trends and analyses which are based on<br />
fleet weighted observations and provides comparisons of<br />
PC to LTV parameters. The fleet of tested vehicles<br />
estimated to be on the roads in 1988 consists of over 37<br />
million PCs and almost 9 million LTVs. Comparison of the<br />
performance of the tested 198 I PC fleet to the tested 1988<br />
PC fleet shows a significant improvement in potential safety<br />
performance for restrained occupants in high speed frontal<br />
crashes. Comparisons of specific late model (MY 1986 to<br />
1988) vehicles within each weight class indicate the<br />
potential for significant safety improvements for the future<br />
vehicle fleet.<br />
The analyses ofthese frontal crash data and projections of<br />
fatalities and injuries are the basis for an outline of future<br />
frontal crashwonhiness research activ ities. These activities<br />
will study the projected remaining safety problem after the<br />
full implementation of Federal Motor Vehicle Safety<br />
Standard (FMVSS) 208. It is projected that even with the<br />
significant benefits of FMVSS 208 and mandatory use laws,<br />
more than 10,000 fatalities and 120,000 moderate to seyere<br />
injuries will still occur in frontal crashes each year in the<br />
United States. (Note: From the FMVSS 208 Final Rule<br />
notice in the Federal Register (2), mid-point estimates of<br />
benefits show a reduction of over 6.000 fatalities and over<br />
100,000 moderate to critical injuries per year when all<br />
pas$enger cars in the fleet meet FMVSS 208 requirements).<br />
TFends From the Anthropomorphic<br />
Dummy Responses<br />
In each of the NCAP tests, Part 572 anthropomorphic<br />
dummies are located in the driver and right front passenger<br />
seats of the vehicles. Standard in$trumentation includes:<br />
triaxial accelerometers in the head and chest. and load cells<br />
in the right and left femurs. The head injury criteria (HIC),<br />
three millisecond clip chest accelerations (Chest Gs) in gs,<br />
and femur loads are derived from the accelerometer and<br />
load cell outputs as specified in FMVSS 208.t Only the HIC<br />
and Chest Gs will be used in this section to examine the<br />
trends of the dummy responses.<br />
Some of the analyses in the following sections will<br />
separate the vehicles into two performance groups to allow<br />
easier comparisons and trend studies. Performance Group I<br />
consists of vehicles in which no dummy response exceeded<br />
a HIC of 1250 or a Chest C of 70. Performance Group 2<br />
consists of vehicles in which at least one dummy response<br />
exceeded these values.<br />
I In response to a petition, in I 986, the NHTSA revised rhe procedure for calculating<br />
HIC such that the maxirnum timt intcrval did not dxceed 36 milliseconds. Prior year<br />
HIC values in the NCAP tests have not been changed. Howevet, the effect of the<br />
change was examined and is insignificant relative to the analyses in this paper.
The analyses for the dummy responses and for many of<br />
the other parameters in the following sections of this paper<br />
are done forboth the unweighted and weighted NCAP data.<br />
The unweighted data are the data from actual vehicles<br />
which have been tested. The weighted data are these data<br />
which have been weighted by the estimated distribution of<br />
the tested vehicle in the fleet for a given year. This estimated<br />
distribution is derived from total vehicle registrations for<br />
1979 to 1986 models with vehicles identical to the test<br />
vehicles as retrieved from Polk's Annual National Vehicle<br />
Population Profiles. For 1987 and 1988 models the<br />
registrations are estimated from vehicle sales reported by<br />
Automotive News. To compute accumulated vehicle<br />
registrations through the model years survival rates shown<br />
in table I are used. These rates are derived from the Polk<br />
data.<br />
o I<br />
Table 1. Survlval ratss derived lrom Polk reglttration data.<br />
v€htcle A6E I 2 5 I<br />
Suwival Rste 0.998 0.984 o.972 o.958 0.932 0.895 0.84I 0.769<br />
Analysis of PC dummy responses<br />
Table 2 contains<br />
HIC and Chest Gs<br />
r 200<br />
L t000<br />
6<br />
o<br />
a<br />
t<br />
u<br />
I<br />
o<br />
,R<br />
the average and median values of the<br />
of the driver and passenger dummies<br />
Driver H lCs<br />
600<br />
t979 t9A0 t96t tg62 tt6J t9t. 19A5 1986 rgtt<br />
15<br />
{o<br />
JO<br />
t979 1980<br />
-**<br />
- greighted Avcrsgc<br />
t<br />
-<br />
l..l6wc;EhtEd Avcrog!<br />
-<br />
'Wcight.d Ucdiqn<br />
\<br />
- -- -<br />
I<br />
Llnw.ightcd u"wrightcd Medidn Mtu<br />
-*<br />
_*ts<br />
Lofcrl Modrl Ycor<br />
Driver Chest Gs<br />
l-':"'el:lT.:1":<br />
- wiighttd AvGrofli<br />
Unwiight.d Av6roga<br />
- - WAightad M.diff<br />
- - Unwalghtad Mtdlod<br />
r9a2 1983 r9E4 1985 1966 1967 t9t8<br />
Ldfi3l Modrl Y.or<br />
Flgure 1. Comparlson of dummy resPon$os for NCAP Psssonger cars'<br />
234<br />
through the ten MYs for PCs. This table also gives the<br />
cumulative number of tested vehicles and the representative<br />
tested fleet. Figure I depicts these data in graphical form.<br />
These data indicate a significant trend of lower responses<br />
from 1979 to 1988 for unweighted and weighted data.<br />
Table 2. Averagee snd medians of occuPant HlCs and chest<br />
Gs-paaaengsr cars,<br />
o<br />
I<br />
r ?oo<br />
$ rooo<br />
a<br />
D<br />
I<br />
t<br />
o<br />
xodrl<br />
Yr*tr<br />
1919<br />
1979.80<br />
1979.81<br />
1979- 8?<br />
1979 - 83<br />
1979 - E4<br />
1979.85<br />
1979.86<br />
L979-81<br />
7979.88<br />
tud.t<br />
YsarE<br />
800<br />
a<br />
I<br />
o<br />
$ 4 5<br />
a<br />
6<br />
ca<br />
f+o<br />
E<br />
I<br />
Drlvsf<br />
HIC<br />
L210 1056<br />
1279 1088<br />
12?1 IOTE<br />
1166 976<br />
Irzs 960<br />
rr01 939<br />
1118 941<br />
1095 91I<br />
1084 897<br />
1065 894<br />
Drtvcr<br />
HIC<br />
Frrr.n8tr<br />
HIC<br />
Unerlahtrd<br />
1,21t tt63<br />
r29! 1179<br />
L241 1171<br />
1168 1033<br />
1132 1031<br />
1093<br />
I0l0<br />
to76 962<br />
1054 945<br />
1016 884<br />
977 836<br />
T+l8,hted<br />
PrrranSat<br />
HIC<br />
Av. ll|d Av€ hd<br />
197 9 1045 955 1121 1033<br />
1979.80 1071 965 1124 994<br />
1979.8 I IO40 939 1097 994<br />
t979-82 1016 939 1081 991<br />
I979 - 83 9E5 910 1049 9I9<br />
1979. E4 964 87t 996 865<br />
r979.85 941 649 966 859<br />
1979.86 926 845 936 829<br />
t979-87 917 826 903 799<br />
1979-88 903 E02 867 718<br />
Drtvrt<br />
Chart C<br />
56 59<br />
57 s4<br />
56 54<br />
53 51<br />
53 50<br />
s2 50<br />
31 50<br />
51 50<br />
51 50<br />
51 50<br />
Drtvsr<br />
Chest G<br />
53 54<br />
5L 52<br />
54 52<br />
53 50<br />
s2 50<br />
51 48<br />
50 48<br />
49 4E<br />
49 48<br />
49 47<br />
- Wciqht.d Avfog.<br />
UnFiightcC Avtrqg.<br />
- - w.ightd M.dlcn<br />
- - Unsr'ghttd u.dion<br />
600<br />
I 979 tgao tg8l 1962 1983 r98+ rg85 1986 1987<br />
Lotarl llodd Yasr<br />
F.r.cn8Gr<br />
freat C Nsbcr<br />
4A 45<br />
50 46<br />
49 45<br />
46 41<br />
45 43<br />
45 43<br />
44 42<br />
44 42<br />
44 47<br />
30<br />
51<br />
54<br />
EE<br />
t02<br />
133<br />
180<br />
?06<br />
233<br />
Parrin8rr<br />
ch€lt c NCAF<br />
FlG6t<br />
4t 45<br />
48 45<br />
4t 45<br />
47 45<br />
4L 42<br />
43 40<br />
42 40<br />
42 40<br />
41 40<br />
Passenger H lGs<br />
Paesenger Ch€st Gs<br />
- Wrightld Avlrqgc<br />
Unwcightrd Avarogc<br />
- - Wclghtrd Ucdion<br />
-. UnwliqhtGd Midiqn<br />
e197900<br />
52375 39<br />
7A219EO<br />
10407385<br />
12441 425<br />
17065150<br />
21709065<br />
27O6O6r3<br />
3r924r96<br />
37044106<br />
1982 19SJ t98{ 1965 t966 t967 1968<br />
Ldtrrl llodrl Y.dr
B6<br />
I<br />
H l o<br />
A<br />
f<br />
eg { !<br />
I<br />
E<br />
I r o<br />
E<br />
t""<br />
E<br />
6so<br />
a<br />
E<br />
E,o<br />
E<br />
a<br />
Figure 2.<br />
llaet.<br />
It.s l9ll rlll lsl itu ttlt t9ta 19t7 tel<br />
ilodrl ysr cf Vrhlcl. Ft.rt<br />
Safety performance trBnds of NCAP pas$enger car<br />
Figure 2 shows the percent of the weighted vehicles in<br />
Performance Group 2. This plot indicates that the portion of<br />
the tested vehicle fleet with the higher dummy responses<br />
hasdecreased from 5 I percent in 1979 to 28 percent in 1988.<br />
It may also be noted that 43Vo of the PCs mer FMVSS 208<br />
requirements even at the higher test speed.<br />
Comparison of the l98l fleet to the 1988 fleet<br />
From a comparison of two fleet years, l98l and 1988, the<br />
distributions of the Performance Croups can be $tudied in<br />
figure 3. The data in this figure show a significant shifr to<br />
lower level responses has occurred from the l98l to 1988<br />
fleet. Similar trends for the weighted and unweighted data<br />
are apparent. The l98l weighted passenger car fleet contains<br />
eight million vehicles and the 1988 fleet contains over<br />
g<br />
ro<br />
[.o<br />
E<br />
$<br />
Ftrfcrmonct GrouF<br />
Flgure 3. Comparleon of lg81 vs 198E NGAP PG fleets.<br />
37 million vehicles. The l98l unweighted fleet contains 64<br />
vehicles and the 1988 unweighted fleet contains 233<br />
vehicles.<br />
The distributions of the weighted fleets by weight class<br />
(l) are shown in figure 4. The four weight classes aresmall<br />
(curb weight below 2,450 lb.), compact (curb weight<br />
2,451 to 2,950), intermediate (curb weight 2,951 to<br />
3,450 lb.), and large (curb weight above 3,451 lb.). The<br />
average weight of vehicles of the 8l fleet is 3278 lbs and the<br />
average weight of the 88 fleet is 3 189 lbs. (Noter The decision<br />
to compare the 198 I fleet to the 1988 fleet is based on<br />
the assumption that after three years of the NCAP that<br />
enough time had elapsed for the rnanufacturers to become<br />
responsive to the test data. Similar comparison can be made<br />
for any other fleet year).<br />
G lgal Pf, Fl!!t (Weiqhtsd)<br />
E:l rc88 FC Frcdi (wi,qhr!d)<br />
Flgure 4. Dlstrlbutlon ol 81 and 86 NCAP llaets (by vehlcle<br />
welght class).<br />
Weig hted Unweighted<br />
P.rlc.m€ncr Croup
PC dummy performance by weight class<br />
The real world safety risk is dependent on the weight of<br />
the vehicle (i.e. from the laws of physics, in a two vehicle<br />
frontal impact, the lighter vehicle will experience the larger<br />
velocity change). In the following paragraphs the NCAP<br />
vehicles are separated into the four weight classes as previously<br />
defined ( I ). The dummy responses and design parameters<br />
of each weight class will be examined.<br />
The following analyses are conducted only to compare<br />
the performance of different weight class vehicles in the<br />
single vehicle crash into a fixed rigid banier (which may<br />
also be viewed as a crash of two identical vehicles colliding<br />
head-on with each vehicle traveling at 35 mph). In this<br />
crash, each vehicle must dissipate its own kinetic energy.<br />
These analyses do not imply that performance in these tests<br />
are indicative of the risks across weight classes. It has been<br />
documented (4) that the occupants of smaller vehicles are at<br />
greater rink than those of larger vehicles due to the traffic<br />
mix.<br />
Table 3 contains the average and median values of the<br />
HIC and Chest Gs of the driver and passenger dummies for<br />
the four weight classes. This table also gives the number of<br />
tested vehicles and the size of the weighted fleet for each<br />
weight class. These data show minor differences across<br />
weight classes.<br />
Trble 3. Averagee and medlans of occupant HICs and chest<br />
Gs-pas8eng€r cars by welght claaa.<br />
Uc ltht<br />
CIar6<br />
sMll<br />
CqEpac t<br />
<strong>Int</strong>eEd<br />
IrrEc<br />
g. tght<br />
Clilr<br />
gMIl<br />
Coqrct<br />
<strong>Int</strong>.md<br />
InrE.<br />
To further examine differences in performance between<br />
weight classes, figure 5 wa$ generated which compares the<br />
weight classes in the Performance Group 2. The information<br />
in this figure indicates better performance of the heavier<br />
vehicles for the unweighted data. However, when the data<br />
are weighted by the vehicle registrations, these performance<br />
differences are reduced. This indicates that especially in the<br />
small weight class that the poorer performing vehicles have<br />
the lower sales volume. From closer examination of the<br />
individual vehicle data, it also found that many of the poorer<br />
performing small cars were tested in the early years of the<br />
NCAP and that attrition is gradually eliminating these from<br />
the fleet.<br />
Analysis of LTV dummy responses<br />
LTVs were not included in the NCAP tesring unril MY<br />
1983. Since then, 4l LTVs have been tesred. Due to the<br />
236<br />
Drlvar<br />
HIC<br />
PsEeFfitar<br />
HIC<br />
tlffitght.d<br />
Drlvar<br />
ChEt c<br />
AS H.d Avs l,tsd Av. Med Awe lt d<br />
1097 974<br />
1072 845<br />
1008 880<br />
1037 954<br />
Drlvef<br />
HIC<br />
1090 959<br />
936 77r<br />
885 778<br />
887 808<br />
Paaaangar<br />
HIO<br />
tleltht€d<br />
49 47<br />
5t 5l<br />
5t 50<br />
Drlwr<br />
Chrrt C<br />
Psda6nB.r<br />
Ch.rt C llwbef<br />
Terted<br />
L5 4!<br />
L2 4I<br />
41 42<br />
43 4r<br />
Avc Hsd Av€ lt d Ave Hed Avc Hed<br />
882<br />
918<br />
905<br />
9L7<br />
708<br />
810<br />
784<br />
882<br />
921 821<br />
802 653<br />
802 752<br />
1094 1084<br />
49 47<br />
47 46<br />
51 50<br />
49 45<br />
EO<br />
77<br />
41<br />
23<br />
Prsrenger<br />
chc8t G TICAP<br />
FI..t<br />
42 40<br />
39 38<br />
4t 40<br />
46 47<br />
r2254210<br />
tt322t7Q<br />
79439I1<br />
3523265<br />
Fi<br />
N<br />
[ -<br />
6 -<br />
E<br />
?<br />
q<br />
(J<br />
o<br />
Conpact lntsrhEdioic ( o/ge<br />
Flgure 5, PCs in perlormance group 2 (by welght claae).<br />
lable l. Averagea and medians of occupsnt HlCs and chest<br />
Gs-llght trucks and vang<br />
LI1t<br />
Tlr.<br />
l{F/r<br />
PUc<br />
VAilt<br />
Drlvcr<br />
HIC<br />
PaaBGngsr<br />
HIC<br />
Unwctghted<br />
Drlver<br />
Cheat G<br />
Ave Hed AvG H+d Ave H€d Av. Kcd<br />
1023 950<br />
1201 rr47<br />
1565 1432<br />
1148 1134<br />
1065 754<br />
1108 II23<br />
51 49<br />
55 57<br />
59 55<br />
Totrl 1282 rl00 r067 56 54 47<br />
LTV<br />
IYp6<br />
uE\tr<br />
PUg<br />
vrJf<br />
Drlvar<br />
HIC<br />
l{rlghted<br />
PatsenSet<br />
HIC<br />
Drlvsr<br />
oheet c<br />
PssasntGr<br />
Ch.rt C Nwber<br />
Teeted<br />
45 48<br />
47 41<br />
49 41<br />
Ave l{6d Avc Hed Avs HGd Avc l{ed<br />
869 850<br />
1t0I 7L47<br />
7362 984<br />
1309 1321<br />
979 699<br />
1100 7798<br />
50 48<br />
53 50<br />
sparsity of data, data for individual MYs may not be signifi*<br />
cant. However, the 4l tested LTVs represent over 9 million<br />
vehicles in the 1988 fleet and more than 30Vo of IJIY registrations<br />
since MY 1983. Therefore. it is concluded that the<br />
total tested fleet data can provide significant data for examining<br />
the dummy responses. Table 4 gives the averages and<br />
medians of the LTVs. In comparing these values to the 1988<br />
PC fleet values in table 2, it is noted that the dummy respon$es<br />
in the LTV fleet are approximately 207o higher for<br />
both HICs and l07o higher for Chest Gs.<br />
Figure 6 shows the di$tribution of the PC fleet and the<br />
LTV fleet in the two performance groups. For the LTVs,<br />
567o of the unweighted fleet and 457o of the weighted fleet<br />
are in Performance Croup 2. For the PCs, these values are<br />
387o and 25Vo.The comparison in this figure of the performance<br />
group distributions points out the large difference in<br />
the test performance between LTVs and PCs.<br />
The LTVs can be examined in three categories: light duty<br />
trucks, vans, and multi-purpose vehicles. Table 4 also provides<br />
the dummy response values in these categories. From<br />
observing the average values, it is noted that the vans had<br />
the dummies with the highest HIC and Chest G responses of<br />
the three categories.<br />
These data indicate that the frontal crash test performance<br />
is not as good for LTVs as for PCs. However, the manufacturers<br />
have shown the capability of producing reasonably<br />
good performers in all the LTV categories. In fact, I I of the<br />
43 LTVs meer rhe requiremenrs of FMVSS 208 ar the higher<br />
crash speed.<br />
l0<br />
I4<br />
FsrEenget<br />
Ch6rt C NOAP<br />
Fleet<br />
44 43<br />
45 45<br />
50 ttj<br />
r46139?<br />
4869077<br />
2431951<br />
Totsl 1135 985 1067 1071 52 50 46 45 8162420
Pdormonor Qrggp<br />
Flgure 6. Comparlson of LTV and PC flests.<br />
Vehicle Design Parameters<br />
As in the previous paper (l), parameters of safety belt<br />
performance, steering assembly effects, and structural<br />
performance have been tabulated. In the following<br />
examination of these data, any changes which have<br />
occurred in trends from the first paper will be noted and<br />
comparisons to the LTV fleet will be made.<br />
Belt performance pflrameters<br />
Presently 33 States and the District of Columbia have<br />
mandatory use laws. These laws along with the emphasis on<br />
belt use by the manufacturers and safety groups have raised<br />
the usage rate observed in a NHTSA 19 city survey from<br />
less than ZOVo in the early 1980s to more than 457o in 1988.<br />
In addition, the requirements of FMVSS 208 to provide<br />
passive protection in PCs have led to the introduction of<br />
automatic belt systems in a large number of PC makes and<br />
models since 1985. Front seat occupants of PCs equipped<br />
with these automatic belt systems have a belt usage rate of<br />
about 857o. Under these conditions, the optimum design of<br />
the safety belt system is more important than ever before.<br />
Two primary functions of the belt system$ are to prevent<br />
or minimize occupant contact with interior surfaces and to<br />
maintain the occupant in the vehicle during a crash event.<br />
Belt system parameters which can affect these functions in a<br />
crash event include the time to onset load on the occupant,<br />
the rate of loading, and the peak load. The onset time is the<br />
time at which the torso belt load reaches 20O lb. The rate is<br />
the increase in load for each millisecond from 200 lb. to<br />
nominally 1,000 lb. A typical illustration of these parameters<br />
is shown in figure 7. These parameters have been calcu-<br />
P.rfcrEcdca Grilp<br />
Iated for all the NCAP tests. The average onset time for PCs<br />
is 35 ms and for LTVs 30 ms. The average rate is 47 lbs/ms<br />
for PCs and 58 lbs/ms for LTVs.<br />
2000<br />
@<br />
1 750<br />
1 500<br />
o<br />
t<br />
tooo<br />
,l rro<br />
250<br />
o<br />
Ftsure 7. lttu'tratton "t b"ifiilH'0Tfr1","r".<br />
Steering assembly effects<br />
Even for the belt restrained occupant, head contact with<br />
interior vehicle components can lead to serious injuries. For<br />
the driver, the steering assembly is the most likely area of<br />
contact. In the NCAP 35 mph tests, very few of the dummies<br />
in the driver location were restrained sufficiently to avoid<br />
contact with some portion of the steering assembly. Sl%o (63<br />
of 205) of the driver dummies experienced head contacts<br />
into the steering assembly that placed the vehicle in Performance<br />
Group 2. For the small PC class,387a (30 of 79) were<br />
in Group 2, for the compacts 297o (19 of 65), for the intermediates,<br />
26Vo (l I of 42), and for the large PCs 167o (3 of<br />
l9). The LTVs show an even higher probability of severe<br />
head to steering assembly contacts with 46To (18 of 39<br />
vehicles) in Performance Croup 2.It is also noted that the<br />
237
average velocity change due to this contact is higher for the<br />
LTVs than for PCs (15.4 mph as compared to 13.3 mph).<br />
The severity of these steering assembly impacts is dependent<br />
on several vehicle performance parameters including:<br />
r The intrusion of the steering assembly into the<br />
companment<br />
r The area of the steering assembly which the head<br />
impacts and the force*deflection characteristics of<br />
the contact surface<br />
r The amount that the belt system reduces the ve-<br />
locity of the occupant before contact occurs<br />
r The effects of the structural performance that also<br />
can lead to differences in head contact velocities.<br />
In addition to these performances parameters, the driver<br />
location relative to vehicle interior components may contribute<br />
to possible head contacts. In figure 8, the distances<br />
from the driver to the vehicle interior are defined. These<br />
distances apply to the Part 572 dummy as seated according<br />
to the NCAP test procedure. Average values are given in<br />
table 5. Only minor differences are noted between the<br />
weight classes of the PCs. However, the head to header and<br />
Flgure 8. Drlver locstlon relstlvo to yehlcle lnterlor.<br />
Table 5. Average dlmenelonc for drlvgr locetlons.<br />
WetBht<br />
CIarr<br />
snsIl<br />
Conpact<br />
<strong>Int</strong>snediate<br />
IrrEe<br />
AII PCe<br />
AlI LTIIg<br />
238<br />
HGad to<br />
Headet<br />
14 .50<br />
14. 14<br />
14.66<br />
l4. ll<br />
18 .04<br />
Drlvgr bcetfon (lncher)<br />
Heed to<br />
lJlndrh t6 Id<br />
19 .42<br />
I9. 36<br />
19,s8<br />
20.44<br />
19.53<br />
Ch6st to Knee to<br />
Dash<br />
L4.94<br />
14. 50<br />
14. 20<br />
l1 cc<br />
14. 56<br />
13-55<br />
6.12<br />
5.70<br />
6.29<br />
6.80<br />
6 .09<br />
6 .46<br />
head to windshield distances are significantly greater for<br />
LTVs when compared to PC$.<br />
From examination of the tested vehicles which have airbag<br />
supplementary re$traint systems, no indications of serious<br />
head to steering assembly impacts were found. As noted<br />
in the FMVSS 208 Final Rule (2), ". . . the most effective<br />
system is an airbag plus a lap and shoulder belt . . . Airbags<br />
with lap belts also provide better protection at higher $peeds<br />
than safety belts do, and they will provide better protection<br />
against debilitating injuries (e.g. brain and facial injuries)<br />
than safety belts". With many of the PC manufacturers<br />
providing the driver airbag as $tandard equipment in the<br />
near future. the data from the NCAP indicate that a reduction<br />
in head and facial injuries in frontal impacts for these<br />
vehicles may be expected. However for LTVs, unless manufacturers<br />
take action to improve the level of safety performance,<br />
the data indicate that head to steering assembly<br />
impacts for belt restrained occupants may be a continuing<br />
problem.<br />
Structural performance parameters<br />
The third vehicle attribute which has been previously<br />
examined from the NCAP data and is updated here is the<br />
performance of the frontal structure. During a crash, the<br />
frontal structure needs to provide a reasonable occupant<br />
compartment deceleration signature (crash pulse) and a collapse<br />
mode that does not allow excessive intrusion into the<br />
occupant space.<br />
The crash pulses of the NCAP vehicles are measured by<br />
accelerometers located in the occupant compartments.<br />
From these crash pulses, approximate force-crush curves<br />
are generated using the acceleration time data and the vehicle<br />
test weight. The parameters of interest from these forcecrush<br />
curves include the peak dynamic force, crush at this<br />
peak force, an estimated linear "stiffness", and the peak<br />
dynamic crush. The ayerage$ of these parameters and the<br />
test weights for PCs and LTVs are given in table 6. For PCs,<br />
nominally, an increasing peak force and increasing crush<br />
occur with increasing test weight.<br />
ForLTVs, significant differences are noted in all parameters<br />
when compared to PCs with much higher peak force and<br />
stiffness and lower crush. This comparison points out two<br />
problems:<br />
L In single vehicle frontal crashes, LTVs present a more<br />
severe environment to the occupant and a more difficult<br />
design problem for the safety engineer.<br />
2. In multi-vehicle crashes were LTVs collide with PCs,<br />
PCs will dissipate more of the kinetic energy, crush more,<br />
and have more compartment intrqsion than the LTVs.<br />
Table 6. Average vsluee of structural pardmeters.<br />
T. tSht<br />
chrt<br />
Sratt<br />
Coqact<br />
<strong>Int</strong>sil<br />
IrrBG<br />
AI1<br />
AII<br />
PCs<br />
LnI<br />
TcNt Wettht<br />
(Ibr)<br />
2J71<br />
3128<br />
3631<br />
4327<br />
3145<br />
3899<br />
Drtv€r bcEElon ( lnchil)<br />
P6!k Forc!<br />
(lbs)<br />
82094<br />
94073<br />
rl92e7<br />
12309?<br />
97477<br />
144113<br />
"Btlffncr4i<br />
(Ib'/tn)<br />
3795<br />
3848<br />
4509<br />
4259<br />
399 7<br />
t2397<br />
Dtsp g Psal<br />
Forc. (ln)<br />
25.8<br />
27.3<br />
29 .3<br />
25.2<br />
kxtnw Dttp<br />
(rn)<br />
27,t<br />
30,3<br />
30. I<br />
33, 2<br />
29.5<br />
23 .8
Recent TFends and Reseflrch Directions<br />
Recent trends<br />
The above paragraphs have presented and discussed<br />
some of the occupant response trends and parameters of all<br />
tested vehicles. It may be of interest to examine these trends<br />
relative to a select group of the more recent vehicles which<br />
have very low dummy responses. In MYs 86, 87, and 88, 33<br />
PCs had dummy response$ in which the HICs were less 90O<br />
and the Chest Gs were less than 55. These 33 PCs are 45Va of<br />
the tested PCs since MY 85. Of the PCs tested prior to MY<br />
86, only 287o had dummy responses in these lower levels. In<br />
comparison to the FMVSS 208 requirement$, 557o of the<br />
PCs in these three MYs met all requirements as compared to<br />
36Vo in the previous seven years.<br />
The 33 late model PCs which fell in the lower response<br />
levels are distributed evenly among the small, compact, and<br />
intermediate weight classes. The restraint systems in these<br />
vehicles include standard three point belts, two and three<br />
point automatic belts, and driver airbags. The manufacturers<br />
of these vehicles include both domestic and foreign.<br />
The performance of these vehicles strongly indicate the<br />
capability and the increasing trend of the manufacturers to<br />
incorporate design parameters in their vehicles which produce<br />
low dummy responses in the 35 mph NCAP test.<br />
Research directions<br />
Presently, FMVSS 208 requires a minimum level of protection<br />
for PC occupants in frontal crashes up to 30 mph.<br />
The lives and injuries which will be saved by FMVSS 208<br />
are very significant. (Note: From the FMVSS 208 Final<br />
Rule notice in the Federal Register (2), mid-point estimate$<br />
of benefits show a reduction in all crash modes of over 6,000<br />
fatalities and over 100,m0 moderate to critical injuries per<br />
year when all passenger cars in the fleet meet FMVSS 208<br />
requirements). However, recent NHTSA projections of fatalities<br />
and injuries estimate that even after the fult application<br />
of the passive restraint requirements of FMVSS 208 to<br />
both PCs and LTVs, frontal impacts will account forapproximately<br />
10,000 fatalities and 120,0fi) AIS 2-5 injuries. A<br />
problem of this magnitude demands that we pursue research<br />
to address it.<br />
Safety problem<br />
FMVSS 208 has brought with it an increasing array of<br />
different types of automatic restraint sysrems in today's<br />
production vehicles. It is necessary to track the real world<br />
collision experience of these vehicles to better define new<br />
safety program directions and to refine existing program<br />
areas.<br />
As we examine the field performance of restraint $ystems,<br />
we will identify the safety problem at three crash<br />
severity ranges-low, moderate, and high speed impacts.<br />
Low speed impacts are defined as those below l5 mph (the<br />
nominal threshold for air bag deployment), moderate-level<br />
impacts are defined as between l5 and 30 mph (the range in<br />
which FMVSS 208 systems are expected to be most effective),<br />
and high speed impacts are defined as greater than 30<br />
mph.<br />
Real world crash data analysis will be conducted to determine<br />
the magnitude of the safety problem and the type of<br />
crash, vehicles involved, and human factors associated with<br />
the specific safety problems. These analyses will attempt to<br />
reach the following goals:<br />
l Setting priorities in terms of which types of crash<br />
events, types of vehicles, or occupant characteristics<br />
account for the highest percentage of serious injuries<br />
and fatalities.<br />
2. Evaluation of effectiveness of different safety<br />
concepts including air bag and automatic belt restraint<br />
systems in the crash environment.<br />
3. Injury mechanism identification including the<br />
body regions injured and the source of the injuries for<br />
specific safety areas.<br />
4. Identification of laboratory te$t conditions based<br />
on the crashes that account for the most serious<br />
injuries.<br />
The Fatal Accidenr Reporting System (FARS), NASS,<br />
State files, foreign files, and the special investigations will<br />
be used to conduct these analyses.<br />
Crash testing and sled testing<br />
While the above data analyses will provide useful guidance,<br />
it will be several years before sufficient accident data<br />
are collected to make definitive statements of the effectiveness<br />
of the restraint $ystems and the remaining fronml safety<br />
problem. Testing offers the most immediate means of determining<br />
answer$. Tests can provide early identification as to<br />
the possible limits of performance for a variety of restraint<br />
systems.<br />
A laboratory testing program could be designed to provide<br />
information in the following areas:<br />
I. Establishing baseline conditions for different<br />
types of automatic restraint systems under different<br />
crash conditions including different impact speeds,<br />
off-set conditions, and angle impacts.<br />
2. Determining upper bounds of the effectiveness of<br />
different types of automatic restraint systcm$ for different<br />
crash conditions.<br />
3. Evaluating the effect ofdifferent vehicle and occupant<br />
factors such as seating position, seating posture,<br />
seat adjustment, etc. on the performance of automatic<br />
restraint systems.<br />
Biomechanics research<br />
Projects in biomechanics will be directed toward improving<br />
and expanding injury criteria and human $urrogate capabilities.<br />
Present test devices could be modified to allow<br />
additional measurements for as$essing different injury<br />
modes and for extending injury measurement capabilities to<br />
other body regions.<br />
239
Component testing of restraint slstems and<br />
frontal interior surfaces<br />
As shown in the NCAP tests and as determined from data<br />
studies, occupant contact with the frontal interior surfaces is<br />
still possible even in vehicles equipped with automatic restraint<br />
systems. Testing in this area could establish the properties<br />
of restraint systems and frontal interior surfaces.<br />
The purpose of this data collection effort is to establish a<br />
baseline related to the material properties of these comPonents<br />
to aid in the identification of possible countermeasure$<br />
and to provide input data for occupant simulation<br />
models.<br />
Vehicle structures models and occupant<br />
simulation models<br />
Vehicle structures models and occupant simulation models<br />
will be upgraded to allow parameter studies to be conducted<br />
to assist in the identification of the problems, in the<br />
development of test procedures, and in the development of<br />
potential countermeasures.<br />
Summary<br />
After ten years of testing in NCAP, significant trends<br />
toward improved dummy responses can be noted for the PC<br />
fleet. Average HIC and Chest G values have decreased by<br />
l0 to20To and PCs which are in Performance Group 2 (i.e.<br />
HIC greater than 1250 and/or Chest G greater than 70) in the<br />
weighted fleet have dropped from 5l7o to less than25Vo.<br />
437o of the tested PCs meet FMVSS 208 requirements in the<br />
NCAP test conditions.<br />
When comparing unweighted dummy respon$es across<br />
four PC weight classes, some degradation in safety<br />
performance can be noted from the large PC to the small PC-<br />
However, the weighted fleet indicates that the poorer<br />
performing small PCs are also the lower sales volume PCs.<br />
Within the weighted fleet, the level of safety performance of<br />
the small PCs may not be significantly less than the larger<br />
vehicles for the given test conditions.<br />
In examining the LTV dummy responses and comparing<br />
them to the PC performance, HICs and Chest Cs for the<br />
LTVs are approximately l0 to 207o higher than for the PCs.<br />
457o of the weighted LTV fleet are in Performance Group 2<br />
as compared toL|Vo of the weighted PC fleet. Even though<br />
LTVs have higher dummy responses than PCs, the<br />
manufacturers have demonstrated the capability to provide<br />
improved performance since 28Vo of the tested LTVs meet<br />
FMVSS 208 requirements in the NCAP test conditions.<br />
Vehicle design parameters associated with safety belts,<br />
$teering assemblies, and frontal structure are examined and<br />
comparisons between PC and LTV characteristics are made.<br />
For PCs, the average onset time for the occuPant to begin<br />
loading the belt is 35 ms and the average rate of loading is 47<br />
lbs/ms. For LTVg, these values are 30 ms and 58 lbs/ ms.<br />
The steering assembly effects indicate that on the aYerage<br />
more severe head contacts occur in LTVs than in PCs. The<br />
average velocity change of the head due to steering<br />
240<br />
assembly impact is 15.4 mph for LTVs and 13.3 for PCs.<br />
46Vo of the LTVs are placed in the higher response group<br />
due to head to steering assembly contacts. Only 3 l7o of the<br />
PCs are placed in the higher respon$e group due to these<br />
contacts.<br />
Much higher peak force and linear stiffness and<br />
significantly lower crush are noted in the frontal structures<br />
for LTVs than for PCs. The peak force is 50Vo greater for<br />
LTVs and the stiffness is three times that of the average PC.<br />
The average maximum crush is approximately 24 inches for<br />
LTVs and is almost 30 inches for the PCs. This comparison<br />
points out two problems:<br />
L In single vehicle frontal crashes, LTVs present a<br />
more severe environment to the occupant and a more<br />
difficult design problem for the safety engineer.<br />
2. In multi-vehicle crashes where LTVs collide with<br />
PCs, PCs will dissipate more of the kinetic energy,<br />
cru$h more, and have more compartment intrusion<br />
rhan the LTVs.<br />
In an examination of the late model PCs (MYs 86, 87, and<br />
88). it is found that 33 PCs (457o of the tested PCs since MY<br />
85) had dummy responses in the level I and 2 groups. The<br />
33 late model PCs are distributed evenly among the small,<br />
compact, and intermediate weight classes. All types of<br />
re$traint systems and domestic and foreign made vehicles<br />
are included. The performance of these vehicles strongly<br />
indicate the capability and the increasing trend of the<br />
manufacturers to incorporate design parameter$ in their<br />
vehicles which produce low dummy response$ in the 35<br />
mph NCAP test.<br />
Based on a recent NHTSA projection of fatalities and<br />
injuries and the existing performance of passenger vehicles<br />
as determined from the NCAR an outline of potential future<br />
research activities for enhanced frontal protection is<br />
presented. These activities include:<br />
l. A study to determine the existence and magnitude<br />
of any safety problems in frontal impacts after the<br />
implementation of FMVSS 208.<br />
2. A laboratory testing program which consists of<br />
full scale crash and sled testing.<br />
3. Continued projects in biomechanics to improve<br />
and expand injury criteria and human $urrogate<br />
capabilities.<br />
4. Continued projects in component testing to<br />
establish the properties of restraint systems and frontal<br />
interior surfaces.<br />
5. Application of structures models and occupant<br />
simulation models to extend the results of the<br />
laboratory test$ and to assist in the problem<br />
identification, te$t procedures and countermeasures<br />
development.<br />
References<br />
(1) Hackney, James, and Carlin Ellyson, "A Review of<br />
the Effects of Belt Systems, Steering Assemblies, and<br />
Structural Design on the Safety of Vehicles in the New Car
Assessment Program," Proceedings Tenth <strong>Int</strong>ernational<br />
Technical <strong>Conf</strong>erence on Experimental Safety Vehicles, pp<br />
38H13. 1985.<br />
(2) 49 CFR Part 571, Federal Motor Vehicle Safety<br />
Standard; Occupant Crash Protection, pp 28962-29010,<br />
Federal Register, vol.49, No. 138, July 17, 1984.<br />
(3) Hackney, James, and Vincent "The<br />
Quarles, New Car<br />
Assessment Program-Status and Effect," Proceedings<br />
Ninth <strong>Int</strong>ernational Technical <strong>Conf</strong>erence on Experimental<br />
Safety Vehicles, pp 809-824, 1982.<br />
(4) Cenelli, Ezio C., *'Risk of Fatal Injury in Vehicles of<br />
Different Size," NHTSA Report DOT HS 806-653, November<br />
1984.<br />
Inadequacy of 0" Barrier Test With Real World Frontal Accidents<br />
C. Thomas, S. Koltchakian, C. Thrriere,<br />
Laboratoire de Physiologie et de Biomdcanique,<br />
Associd h Peugeot S.A./Renault,<br />
France<br />
C. Got, A, Patel,<br />
Institut de Recherches Orthopddiques<br />
France<br />
Abstract<br />
The representativity of a global frontal impact must be<br />
assessed in relation to its concordance with the characteristics<br />
of frontal impacts in real world accidents in order to<br />
guarantee that the progress accomplished will be effectively<br />
translated on the road.<br />
The survey is based on the technical and medical investigation<br />
into 746 cars and 403 occupants restrained by 3,point<br />
seatbelts involved in severe frontal impacts with velocity<br />
change equal to or greater than 40 km/h.<br />
Precise descriptions are made of overlaps of front end<br />
with obstacle, deformation geometries, intrusion levels into<br />
the passenger compartment in terms of velocity change<br />
(delta-V) and mean acceleration (E m) of the car.<br />
The frequency and the severity of injuries to front occupants<br />
are analysed in terms of the relationship of the impact<br />
with 0o banier and 30o oblique barrier tests.<br />
The results show that the 0o barrier test does not reproduce<br />
mean acceleration values, intrusion levels or risks<br />
incurred by the majority of belted occupants.<br />
Deformations of vehicles. mean accelerations and conditions<br />
under which serious injuries occur with the largest<br />
number of belted occupants in real world frontal impact<br />
conditions, justify the choice of the 30" oblique barrier test<br />
as the most representative test.<br />
<strong>Int</strong>roduction<br />
Frontal impact is, by far, the one causing the most deaths<br />
and serious injuries in real world accidents.<br />
That is why, as far back as the sixties, before extensive<br />
surveys were conducted and the principal results made<br />
known, it was decided in the United States that frontal<br />
impact against a wall perpendicular to the trajectory of the<br />
vehicle, herein called 0", would be the reference statutorv<br />
test.<br />
In the light of the first results of the Peugeor S.A./Renault<br />
accident survey, begun in 1970 (l)*, it did not take long to<br />
realize that at least 7IVo of frontal impacts were<br />
asymmetrical.<br />
Since the objective was to improve the secondary safety<br />
of cars by taking the reality of accidents into account, it<br />
consequently seemed logical to the French manufacturers to<br />
wonder about the representativity of the 0" barrier (2),<br />
propose a method for analysis of severity of frontal<br />
collisions (3), justify their preference for a test against an<br />
oblique wall forming an angle of 30" with the "0o barrier,"<br />
namely I 20" with the longitudinal centre-line of the vehicle<br />
(4), provide accidentological justifications (5), present the<br />
results of the test whereby an experimental vehicle hits a 30"<br />
barrier at 70 km/h (6), confirm their choice in favour of the<br />
30o barrier (7) and even deplore not having been listened to<br />
(8).<br />
As far back as 1976, K. Friedman (9) substantiated the<br />
a$sertion that 9OVo of all frontal deformations were<br />
asymmetrical in the United States. At the same time, an<br />
English survey (10), based on an analysis of 143 impacted<br />
cars, concluded in the interest of an impact test at 50 km/h<br />
against a barrier with overlap of between 25 and SOVo, on<br />
account of the fact that 56Vo of the directions of impact are<br />
Iongitudinal to the nearest I0o and that 53 of the cars<br />
presented an overlap with the obstacle of 25 to SOVo.<br />
Recently, Daimler-Benz ( I I ) gave support to the interest of<br />
this test, taking into account a32Vo frequency of the "30 to<br />
507o" overlaps among the 822 vehicles of its make involved<br />
in frontal impacts and for which the front end overlap has<br />
been able to be quantified. Let us specify that this test is<br />
presented more as a tool for development of front end<br />
structure than as statutory alternative (12).<br />
It was therefore interesting to bring up to date and specify<br />
the principal data regarding relationships with experimental<br />
frontal tests, based on a sample of severe real world<br />
accidents.<br />
Method Used<br />
Our survey files on real world accidents were used as<br />
basis and were sorted in order to select cars equipped with<br />
3-point restraint seatbelts involved in severe frontal impacts<br />
with velocity change (delta-V) greater than or equal to 40<br />
24r
km/h. The estimation of the violence of the impact (delta-V<br />
E mean) used is that described in various publications (5,<br />
l3).<br />
The distributions of overlaps and deformation geometries<br />
are first of all described. These greatly contribute to the<br />
relationships with frontal tests such as 0o barrier and 30'<br />
barrier. The analysis is completed by examinations, in terms<br />
of delta-V of the levels of mean acceleration attained and<br />
the frequencies of critical intrusion into the pa$senger<br />
compartment.<br />
The risks of injury evaluated according to the AIS scale<br />
( l4) of belted front occupants only in this sample are studied<br />
in terms of the relationship with frontal tests.<br />
Distribution of deformations of cars subjected<br />
to severe frontal impact<br />
Since 1970, 3976 cars subjected to frontal impact have<br />
been analysed both from the technical and the medical<br />
viewpoints by the team making investigations into real<br />
world accidents.<br />
Without exclusion, this survey was conducted on all car<br />
accidents occurring in the same geographic zone to the West<br />
of Paris and causing injuries to at least one car occupant.<br />
This region, consisting of urban and rural zones, comprises<br />
different types of road networks (including motorways).<br />
Retrospective analysis sometimes shows that the most seri*<br />
ous accidents are over-represented in the sample. In particular,<br />
the mortality rate is double that observed at national<br />
scale. Let us specify that the $urvey did not cover only cars<br />
of French make. The share of cars of foreign make is very<br />
close to that observed at French national scale.<br />
Insofar as a truly representative frontal impact mu$t enable<br />
the protection offered by seatbelts to advance even<br />
further, it is important that the description of the accident is<br />
not biased by a large number of low-violence, and therefore<br />
not very severe, impacts for belted occupants. That is why,<br />
to be precise and pertinent, it is important that the subsample<br />
retained takes only cars into account that have been<br />
subjected to a delta-V at least equal to or greater than the<br />
threshold of appearance of the majority of serious and fatal<br />
lesions on belted front occupants. These occur in 85Vo of<br />
cases with delta-V greater than or equal to 40 krn/h, which<br />
already constitutes a high, but neces$ary violence threshold,<br />
taking into account the objective sought after.<br />
Besides this, the deformations must involve the front end<br />
over its full height.<br />
This amounts to eliminating 3230 cars from the basic<br />
sample that meet the following criteria, sorted in<br />
succession:<br />
. cars not equipped with 3-point restraint seatbelts-470<br />
cars hitting an overhanging obstacle (generally,<br />
commercial vehicle under-run)-3 I 9<br />
cars for which dissipated energy against deformable<br />
obstacle is not known-263<br />
*Numbers in parEnthcses designate rcferences at end of paper<br />
242<br />
cars for which opposing vehicle has not been examined-Z37<br />
cars involved in front-to-front impacts between<br />
cars "with glance-off," i.e. with complete stoppage<br />
of the vehicle at a distance of more than l0<br />
metres beyond the other car-140<br />
(Note: The equivalent speed against the barrieralso<br />
called equivalent energy speed (E.E.S)-is<br />
greater than or equal to 40 km/I for 8l cars. In 40<br />
of the 81 cases, the overlap with the opposing car<br />
was of the " l/4 track type").<br />
Cars with delta-V estimated at less than 40<br />
km/h-1601<br />
The sample thus selected includes 746 cars whose deformation<br />
characteristics are quantified and the impact violences<br />
estimated.<br />
The overlap of the front end of the car with the obstacle is<br />
Flgurc 1. Clds$lflcatlon code lor frant damage locatlon8.
described by using a classification code (figure l) derived<br />
from the "Collision Deformation Classification" (SAE<br />
J224, March 1980).<br />
This improved code defines not only the overlap of the<br />
front end with the obstacle, but also takes into account the<br />
involvement of the side-member(s) in the energy dissipation<br />
process. This complementary data is necessary for understanding<br />
the behaviour of the structure undergoing frontal<br />
impact, the finality of which is above all preservation of<br />
the passenger compartment. To simplify the distribution of<br />
overlaps, the most frequent left-hand side deformations<br />
have been grouped together with right-hand side<br />
deformations.<br />
Distribution of types of overlap and obstacles encountered<br />
is given in table l. Distributed deformations, orthogonal<br />
or oblique, involving the whole of the front end of the<br />
cars, represent less than one third of the cases (213[7a6). On<br />
the other hand, cars subjected to partial overlap with the<br />
obstacle, involving half or more of the front end ( l/2 track<br />
and 2/3 track) are the most numerous. This group alone<br />
represents almost half (3511746) of the total sample,<br />
The majority of the obstacles encountered are cars (503<br />
cases), followed by stationary obstacles (199 cases) and<br />
commercial vehicles (44 cases without under-run, generally<br />
against commercial vehicle roadwheels). Let us note, inci-<br />
dentally, that more than half the cars of the sample studied<br />
were involved in a front-to-front collision with another car.<br />
The relationship with a type of test cannot only be determined<br />
on the sole basis of overlap of the vehicle with the<br />
obstacle. It is therefore necessary to complete the data by:<br />
deformation geometry, mean acceleration level, and to examine<br />
their consequences in terms of intrusion into the<br />
passenger companment.<br />
Distribution of types of overlap and deformation geometry<br />
are given in table 2.<br />
Damage is classified into four categories, according to<br />
whether deformation of the impacted vehicle is rectangular<br />
(i.e, perpendicular to the longitudinal centre-line ofthe ve-<br />
Tablc 1. Dletrlbutlon of cara sublected to delta-V > 40 km/h accordlng to type of overlap and type ol obstacle.<br />
f rmt-front<br />
Clrl front-rld.<br />
front-rur<br />
trrc,/brldr plrr<br />
(rnd<br />
Strtlomry<br />
obctaclc<br />
rrll<br />
othrrc<br />
col I lrlonr)<br />
Cmrclal vrhiclu<br />
Table 2. Dl$trlbutlon ol cars sublected lo delta-v > 40 km/h accordlng to type of overlap and type ol delormatlon.<br />
rrctrngulrr<br />
t tB'<br />
IYPEB obllq|lf<br />
16' to ,l{l'<br />
Af mkrr<br />
){t.<br />
oEF(nilTl(ta plnpolnt<br />
Dlrtrtbrltd<br />
(Do)<br />
Dlrtrlbutrd<br />
(or )<br />
121<br />
35<br />
3<br />
6<br />
22<br />
5<br />
2/$ trrck<br />
(YeZo)<br />
2/3 track<br />
(YoZr<br />
)<br />
12E<br />
I<br />
3<br />
r0<br />
tg<br />
0<br />
IYPE OF OYENI.AP<br />
l/2 trrcx<br />
(Hz{)<br />
TYPEIF WERTAP<br />
1/2 treck<br />
(Yr Z,r )<br />
1/3 trrok<br />
(LrRr)<br />
l/3 trtck<br />
(LrRr)<br />
l/4 trrck<br />
(toRo)<br />
l,/4 track<br />
(LoRc)<br />
c.ntrrl<br />
(Co)<br />
IOTAL<br />
130 l0 tl I 0 0 ta0<br />
E3 ta6 r11 t3 0 0 E43<br />
0 l5 16 30 u 0 r0a<br />
0 t? {6 3'o t8 IE la3<br />
TOTAT 213 t00 rE2 e2 l2 IE t8<br />
t03 65<br />
4l<br />
t4 0<br />
30<br />
I<br />
2<br />
3l<br />
il<br />
t<br />
37<br />
I<br />
t<br />
Critrrl<br />
(Cc)<br />
0<br />
0<br />
0<br />
TOTAT<br />
r6 T ta I 3 I 4tl<br />
TOTAL 213 r60 162 g2 12 It 7{0<br />
20 71<br />
1C<br />
I<br />
0<br />
434<br />
s3<br />
10<br />
| 2tl<br />
6i<br />
I<br />
243
hicle) or, on the contrary, oblique by approximately 30" on<br />
the one hand or more than 40" on the other. Pinpoint impacts<br />
against trees, poles or posts of all sizes are classified<br />
separately.<br />
It appears that 30o oblique deformations are most represented<br />
(343 cars), followed by rectangular deformation<br />
(166 cars), pinpoint deformation (133 cars) and finally 40"<br />
or more oblique deformation (104 cars).<br />
A first attempt at comparison with experimental tests (0'<br />
barrier, 30o barrier, impact$ against posts or others) can be<br />
made at this stage of the analysis.<br />
lmpacts related to the "0" barrier" test assume that the<br />
overlap is distributed over the full front end of the car and<br />
that the deformation is rectangular (to the nearest tlSo).<br />
Both these conditions are met by | 30 cars only. The mean<br />
acceleration levels must also be of the same magnitude as<br />
those recorded in the "0o barrier" tests for a given test<br />
speed.<br />
t5<br />
E<br />
I<br />
cl<br />
H<br />
{<br />
Srs<br />
lil<br />
(t<br />
o {<br />
z<br />
{<br />
lrJ<br />
I<br />
/<br />
''/<br />
' .--- I<br />
. / + + / l<br />
.: t-/t' ./<br />
i i,4 +' r .,"<br />
( i' ; ..i. ,,''. . /<br />
l. /ri.,..i.. . r,nt'' /<br />
i. / t....r .,/! ..-./<br />
l' / .-. t.. ,./.'.. . J<br />
L: t,..' ,/<br />
lr lilri:| .r.<br />
/<br />
i. l: ,' ':/<br />
l^ l: .'/ ''.^)t.<br />
/'<br />
lil::j"'' ./<br />
$-'fi""<br />
it!':t"" ,<br />
l.:' ,/<br />
./<br />
\. " ,'/ . FEAL r*o AccroEHrB<br />
I / +EAHHIEHTeaTE<br />
V - - rso EAL ACCIDEFTTE<br />
-- 77 EAffiIEF rEat8<br />
.,J<br />
40 !o Eo 79 E0 EO<br />
TEET EFEED Of, VELOCITY CHANcE (TN Kn/h)<br />
Fioure 2. Dlstrlbution of the mean acceleratlon ol vehicles ac'<br />
co*rding to: thc veloclty change in real lmpscts rglated to 0'tesl'<br />
the tetl apeed for 0" barrler fests.<br />
The severity of these impacts in the "Velocity change<br />
(delta-V)/mean acceleration (a)" diagram is given in figure<br />
2. Comparison with the severity of the "0" barrier" tests is<br />
presented in the same figure by using the results of 77<br />
experimental tests on the most representative cars of the<br />
impacted vehicles. For the latter, the velocity taken into<br />
account is the experimental test speed, so a$ to remain<br />
homogenous with real world accidents, where the rebound<br />
speed is unknown. The result is that the cloud of points<br />
representing the "0o barrier" tests is off-set by approximately<br />
5 g towards the highest mean accelerations. Finally,<br />
only half(66/l 30) ofthe cars presenting a rectangular defor-<br />
244<br />
/<br />
mation geometry distributed over the full front end give rise<br />
to mean acceleration levels comparable with those recorded<br />
in the "0o barrier" tests. Several reasons explain this result:<br />
. Only 33 of the 130 cars hit rigid, almost undeformable<br />
obstacles, such as walls or commercial<br />
vehicle roadwheels.<br />
r In 64 out of the 97 impacts against another car, the<br />
mean accelerations of vehicles in real world accidents<br />
are lower than in the 0" barrier test, as;<br />
r The hit areas ofthe opposing vehicle are less stiff<br />
(side doors-I7 cases----or rear end-3 cases).<br />
r The opposing vehicle hit front-on presents either<br />
oblique deformation-26 cases-or different architecture<br />
enabling imbrication of the most rigid<br />
members, without real crushing as in the 0'barrier<br />
test-18 cases.<br />
r Finally, the deformation geometry is rarely perfectly<br />
rectangular and symmetrical in real world<br />
accidents. The fact of assuming obliquity capable<br />
of attaining a maximum of 15" on the front end<br />
contributes towards increasing the maximum<br />
crush somewhat and consequently reduces the<br />
mean level of acceleration.<br />
Impacts related to the " 30o barrier " test are cars comprising<br />
an oblique deformation geometry of between 15o and<br />
40" and involving at least halfthe front end ofthe car. In this<br />
configuration, the deformation energy is dissipated by the<br />
centre and the side of the car. The most strained members of<br />
the front end unit are basically the side-member located on<br />
the side of the impact, body side and the power unit.<br />
If reference is made to table 2, it appears that oblique<br />
deformation geometries at 30o, with either distributed overlap<br />
(83 cases),<br />
"2/3 track" overlap (126 cases), or "UZ<br />
track" overlap (l I I cases), constitute a very homogeneous<br />
group both by types of deformation observed and by mean<br />
acceleration levels at given delta-V. Figure 3 gives the envelopes<br />
of the cases related to the " 30" barrier" test according<br />
to which the overlap is of the distributed type, 2/3 track type<br />
or even ll2 track type. A great similarity of acceleration<br />
levels with delta-V between 40 and 60 km/h is to be observed.<br />
Beyond that, for a few rare case$, acceleration levels<br />
are recorded that are greater than the mean connected with<br />
large overlap on the one hand or with impacts against obstacles<br />
that are relatively stiffer than the average front end units<br />
of the cars on the other hand.<br />
In orderto compare real world accidents related to the 30"<br />
barrier test and experimental " 30" barrier " tests, we applied<br />
the same method as that used in real world accidents for<br />
calculating the mean acceleration. The squared experimental<br />
test speed is divided by twice the maximum residual<br />
crush of the front end increased by 2OVo to take elastic<br />
recovery into account. Figure 4 gives the test speed and the<br />
mean acceleration of 8l cars tested against a 30o barrier.<br />
The scatter ofpoints representing the 320 cars related to<br />
the "30" barrier" test involved in real world accidents is<br />
delimited by dotted lines. The shaded area represents 48<br />
cars subjected to low accelerations in real world accidents.
|I<br />
E<br />
g<br />
tH<br />
F<br />
f; lrl<br />
lu<br />
o<br />
(J<br />
{<br />
7<br />
{t<br />
ul<br />
I<br />
TOTAL OVEfI-IP (tl-Bgl<br />
+ +, --- E/g FHfi{T-EHD oVEH-AP (H-reE)<br />
r r. - t./c FHoflt-EhE ovEH-Ap N-rttl<br />
'f<br />
tt<br />
f .. il<br />
rr*<br />
tt+*++ +++"<br />
lhflrt .'t r +dit. r"<br />
i. ;o1*.. 'r. i ,.,, '<br />
l.rlcqfr tr r.'r<br />
VELOCITY cHAftr (ln KrL/h,<br />
Flgure 3. Severlty ol lmpacts (veloclty chsng€, mean acceltration<br />
ol vehlcles) for 320 rsal frontal lmpacts related to 30'test.<br />
Apart from these cases, it emerges that, for the272 remaining<br />
cases, namely 85Vo of the sample of the 320 real cases<br />
related to the 30" barrier, reasonable adequacy exists between<br />
the mean acceleration levels recorded in real world<br />
accidents and in experimental "30" barrier" testing.<br />
In total, the relationship with the "30" barrier" test concerns<br />
320 cars, namely 42Vo of the 746 cars of the sample.<br />
This high percentage marks out the "30o barrier" test as the<br />
most representative test for restituting the deformations of<br />
cars subjected to a delta-V of more than 40 km[r. This result<br />
is due to the fact that the "30o barrier" test characterizes<br />
front-to-front collisions of highway reality parricularly<br />
well. 234 cars presenting deformations related to the 30o<br />
barrier test were involved in this type of configuration. This<br />
represents 73Eo (2341320) of the cars with deformations<br />
bordering on the "30o barrier" test and close on 607o<br />
(2341434) of the cars of the sample involved in frontto-front<br />
collisions (see table l).<br />
One single test, whatever it may be, cannot obviously<br />
cover the range of overlaps observed in real world<br />
accidents.<br />
Other remaining cases concern 39Vo (295t746) of all the<br />
cars of the sample. They are distributed as follows, by type<br />
of overlap (see table 2):<br />
t "<br />
ll4 track overlap" concem 72 cars, namely l0ola<br />
of the total sample analysed. The deformations<br />
involve the front roadwheel and support together<br />
with the entire side of the passenger compartment.<br />
The severity of these impacts in terms of velocity<br />
change and mean acceleration is generally lower<br />
than in the remainder of the accidents on account<br />
't<br />
I'<br />
E<br />
EH<br />
F<br />
{<br />
ilI tE<br />
UJ<br />
.J<br />
(t<br />
{<br />
z<br />
||r<br />
I<br />
t0<br />
+ so' ilffirEn rEBT<br />
- - HE L IOH-O ACCIDEHTE 0{-940)<br />
- to' IAffiIEF TEETA (H-el)<br />
so {Q EO SO<br />
TEET 3PEEO OR VELOCITY<br />
7Q gO AO<br />
CHAHBE (In Eil./h}<br />
Flgure 4. Dlstrlbutlon of lhe mean accelcrstlon ol vehlcles ac.<br />
cordlng to: the veloclty change ln real impactt r€lsted to 30'<br />
test, the teEt Bpeed tor 30. barrler lest8,<br />
of glance-off of the vehicle from the ob$tacle<br />
(above all in violent impacts) and the significance<br />
of residual crush.<br />
t "ll3<br />
track" overlaps are observed in 9? cases.<br />
The deformation geometries observed are quite<br />
different and could not be reproduced by one single<br />
test. The most frequently analysed are oblique<br />
and on account of this give rise to limited deformation<br />
of the end of the side-member. Only in the<br />
remaining cases (rectangular or pinpoint deformations),<br />
has the side-member been strained<br />
without bending and the amount of crushing is<br />
close to the maximum residual crush on the<br />
vehicle.<br />
t "l/2<br />
and 213 track" overlaps concern I 14 vehicles<br />
outside the cases related to the -'30" barrier"<br />
test. Here again, the deformation geometries involving<br />
roughly half the car are very dissimilar.<br />
Among these cases, the most numerous result<br />
from impacts against stationary obstacles such as<br />
large trees, bridge parapets or ditch sides.<br />
r Finally, centered poles concern only l8 cars.<br />
For the same delta-V, type of overlap and deformation<br />
geometry of the front end lead to quite different strains on<br />
the structure of the front end unit, which greatly influence<br />
the level of resistance of the passenger compartment.<br />
Frequencies of intrusion into the passenger compartment<br />
are analysed for the three main types of deformation encountered<br />
in real world accidents, which are:<br />
. impacts related to the "30o barrier" (320 cases),<br />
24s
off-set impacts (164 cases). The l/3 track and l/4<br />
track overlaps are covered here.<br />
r impacts related to the "0o barrier" (130 cases).<br />
During development of a vehicle, efforts are made to<br />
re$pect the integrity of the passenger compartment in order<br />
to preserve A DECELERATION SPACE for the re$trained<br />
occupant (and not survival space as is too often indicated)'<br />
<strong>Int</strong>rusion is quantified in the real world accidents of our<br />
sample by rearward displacement of the Iower windscreen<br />
header at A pillar level. As will subsequently be seen, since<br />
belted occupants are concerned, the risk is considerably<br />
aggravated when the reduction in deceleration space thus<br />
measured exceed$ 250 mm. Figure 5 gives the frequency of<br />
intrusions exceeding this value in classes of delta-V for the<br />
three types of most represented impacts. Critical intrusion<br />
frequencies differ distinctly from one type of impact to<br />
another. Thus, in the 51-60 km/h delta-V class, critical<br />
intrusions represent only 37o of the cases for impacts related<br />
to the 0o barrier against 29Va for those related to the 30"<br />
barrier and 60Vo in the case of the most off-set imPacts' It<br />
will be seen later that reductions in passenger compartment<br />
space constitute a significant limitation to the maximum<br />
efficiency of seatbelts. That is why it is important that a<br />
representative frontal impact used within a statutory frame-<br />
246<br />
eroportions (%) of cars<br />
with paeeenger<br />
intrueion<br />
compartment<br />
eb<br />
work verifies, among other things, the resistance of the<br />
passenger compartment. lt is undeniable that a test with<br />
overlap ofthe " l/3 track" type would present the advantage<br />
of concentrating efforts on thi$ single aspect provided that<br />
protection criteria are met.<br />
But solutions would risk being adapted to a low proportion<br />
ofcases, taking into consideration the $tatistic reality of<br />
accidents. In fact, out of 100 "critical" intrusions (rearward<br />
displacement of lower windscreen header > 250 mm), the<br />
largest number (38) occuned with impacts related to the<br />
"30"<br />
barrier" against 3l with<br />
"l/3<br />
or l/4 track" off-set<br />
impacts, 6 with impacts related to the 0" barrier and finally<br />
25 distributed among the various types of remaining<br />
deformations.<br />
Finally, the 30" banier test presents the following advantages<br />
from the sole viewpoint of accident analysis:<br />
r higher proportion of cars involved in severe impacts<br />
(3201746, namely 42Vo intotal),<br />
. realistic mean acceleration, restituted to 857o by<br />
the experimental test,<br />
. asymmetrical deformation of the car giving rise to<br />
a significant risk of critical intrusion with delta-V<br />
between 5l and 60 km/h,<br />
r larger number of cases of critical intrusion<br />
d"#<br />
",""<br />
q$<br />
""-'<br />
-or":<br />
-v<br />
delta-V<br />
40*50 51-60 61-70 >70<br />
Figure S. Frequenclea oJ <strong>Int</strong>ruslon (resnrard dlaplacoment ol the lowor windscreen hoader at A pillar level > 250 mm) by delta'V<br />
clCsses for thb throe doformatlon typeE'<br />
( in<br />
km/h)
Belted occupants involved in severe frontal<br />
impacts<br />
This second part aims to specify the risks incurred by<br />
belted front occupants in road accidents in terms of the<br />
different relationships with experimental frontal tests.<br />
A sample of 403 occupants taken from the first part of the<br />
survey was selected according to the following criteria;<br />
r front seat occupants without overload from rear<br />
pa$senger,<br />
. wearers of inertia reel seatbelts (or correctlv adjusted<br />
static seatbelts),<br />
r delta-V between 40 and 70 km/h.<br />
The distribution of the global gravity of lesions according<br />
to the place occupied in relation to the type of related impacts<br />
(table 3) reveals that:<br />
r Impacts bordering on the "30o barrier" test embrace<br />
the majority of recorded serious victims<br />
since they constitute 43Eo (39191) of the seriously<br />
injured (M.AIS 34-5) and half of those killed<br />
(10/20).<br />
r Impacts related to the "0" barrier" test represent<br />
23Vo of the seriously injured and concem 4 of the<br />
recorded 20 killed.<br />
r Gravity and mortality rates of occupant$ per types<br />
of related impact are similar, apart from off-set<br />
impacts with "l/3 or l/4 track" overlap, where<br />
they are less. This is due to the absence ofcases in<br />
the 6l-70 km/h delta-V class on account of the<br />
significant glance-off of cars in relation to the<br />
obstacle.<br />
Aggravation of risks connected with intrusion at equivalent<br />
delta-V appears clearly in the analysis of real world<br />
Table 3. Dlttrlbutlon of slobal sravlty ol leglons for 403 bcltsd<br />
occunant$ Involved In sEvere liontallmpacts (40 s delta-v < 70<br />
tm/h) accordlng to placeoccupled In relatlon to typssof relatBd<br />
lmpEcts.<br />
''t/1<br />
R. I rt.d<br />
lructt<br />
"rc."<br />
.t<br />
Ut-lricl-<br />
gfiD|rt<br />
ALIOdETHER<br />
r.AIS MIYERE FfrOT.T<br />
PA88ESER8<br />
0- t-2<br />
3-{-6<br />
xt t l.d<br />
TOTAL<br />
rr-2<br />
3-'a-6<br />
(t I l.d<br />
IOTAL<br />
(Fl-?<br />
3-4-6<br />
Kt I lnl<br />
T0rA[<br />
G-t-2<br />
3*,Fs<br />
Xl I lill<br />
roTAl,<br />
0-r-2<br />
F,FE<br />
Xl I l..l<br />
TOIAT<br />
3,4<br />
r6<br />
I<br />
87<br />
26<br />
I<br />
6t<br />
6<br />
2<br />
23<br />
13<br />
I<br />
rec<br />
0e<br />
r5<br />
60<br />
121<br />
62<br />
'all<br />
273<br />
t3<br />
6<br />
3<br />
40<br />
t3<br />
2<br />
21<br />
6<br />
o<br />
t0<br />
a<br />
0<br />
t0<br />
et 6<br />
2Z<br />
s6<br />
33<br />
20<br />
r3l,<br />
IOTAL<br />
11<br />
2l 1<br />
tl<br />
te?<br />
3t<br />
10<br />
l?c<br />
t9<br />
l4<br />
2<br />
3t<br />
rl a<br />
c6<br />
60<br />
2t2<br />
el<br />
t0 'altJ<br />
accidents, while it does not pre$ent any major problem in the<br />
0" barrier experimental tests.<br />
<strong>Int</strong>rusion is quantified by the rearward displacement of<br />
the lower windscreen header closest to the occupant. This is<br />
qualified as "critical" when the displacement exceeds 250<br />
mm.<br />
A "critical" intrusion has been recorded for only l1Vo of<br />
the occupants (see table 4). All delta-V's intermingled, it<br />
concerns 6Vo of the slightly injured, 25Vo of the seriously<br />
injured and 807o of the killed. As from a delta-V of 5l-60<br />
km/h, the number of serious victims with critical intrusion<br />
( l3 seriously injured and 4 killed) is almost as great as when<br />
the intrusion is moderate or nil (19 seriously injured and I<br />
killed).<br />
Tsble 4. Dlatrlbutlon of 403 bslted occupsnts by claaaea of<br />
della-V ln relatlon to lhe <strong>Int</strong>ruslon.<br />
<strong>Int</strong>ruttd laval<br />
(rildrrd dlsle<br />
cnnt ol lffir<br />
Ylndrcr[n hrrdar)<br />
Lll or rddarrta<br />
(( 2S0 r)<br />
c/tttfil<br />
(re60:)<br />
oYrrrl I<br />
ravarlty<br />
r.AI8 o-r-e<br />
x.AI8 3-4-6<br />
Xt I lrd<br />
TOTAT<br />
t{.4I8 Ft-2<br />
l.AI8 3-{-6<br />
Kt I l.d lolAL<br />
o.lt&V (ln h,/h)<br />
rO-60 51-t0 cr-70 r0rAL<br />
20r<br />
2A<br />
t<br />
236<br />
f<br />
I<br />
0 1{<br />
56<br />
r0 I<br />
76<br />
t3 4 26<br />
I<br />
ID<br />
?<br />
32<br />
z<br />
,<br />
t2 2t<br />
f--'l pasaenger comPartment<br />
Le8enq : U lntruBiond aso mm Nr?:i:::i::;Tgil:t."'<br />
.I1 L\\\\\I<br />
:t9.<br />
I NSSSSN<br />
40-50<br />
CIaE66a of<br />
."^ N\\\<br />
I N\\\\<br />
5r-60<br />
vclocity chenge<br />
( in kh/h)<br />
t?6<br />
ia<br />
a<br />
t7<br />
zl<br />
t0<br />
61-70<br />
Flgure 6. Gravlty rate by classee of veloclty change lor 403<br />
belled front occupanls accordlng to passenger companment<br />
lntruslon.<br />
Aggravation of the risk connected with intrusion at comparable<br />
delta-V is particularly obvious when the gravity<br />
rates (M.AIS l3limplied) presented in figure 6 are examined.<br />
In the 40-50 km/h and 5 140 km/h delta-V classes, the<br />
gravity rates in case of critical intrusion are respectively<br />
multiplied by 4. I and 2.8 compared with occupants undergoing<br />
nil or moderate intrusion. The 1z test shows that the<br />
differences observed are highly significant at the .05 threshold.<br />
In the 5l-60 km/h and 6l-70 km/h delta-V classes, the<br />
mortality rates (killed/implied) are multiplied by l0 when<br />
the occupants suffer "critical"<br />
intrusion, but the difference<br />
is not significant, on account of the low numbers involved.<br />
247
Comparison of risks with impacts related to<br />
tt0o barrier" and tt30o<br />
barrier" tests<br />
To be strict, comparison of the global gravities of lesions<br />
in the two samples should take into account the three physical<br />
parameters recorded at the time of real world accidents,<br />
which are: velocity change (delta-V); mean acceleration<br />
(fl); intrusion level (critical or not).<br />
Figure 7 gives this information for drivers according to<br />
whether the impact is related to the 0" barrier or the 30"<br />
barrier. On this side of 60 km/h. it is to be observed: that no<br />
death occurs in either sample; that for the seriously injured,<br />
the risk depends either on the mean acceleration level (0'<br />
banier), or because of the fact of critical intrusion (30o<br />
barrier).<br />
it<br />
c18<br />
g<br />
E<br />
cl<br />
H<br />
Irg<br />
E<br />
tg<br />
d IJ<br />
(,<br />
< 8<br />
z<br />
il<br />
I<br />
BlE<br />
C<br />
g<br />
E tTI<br />
rt<br />
G<br />
ltl<br />
IT<br />
t<br />
S e<br />
T<br />
H<br />
Floure 7. M.AIS of belted drlvers according to Yeloclty change!<br />
m6an acceleratlon of vehicle and intruslon for impact$ related<br />
to 0'test or 30'test.<br />
The lowest gravity rates are recorded in the absence of<br />
intrusion. They are.l0 (8/80) and.24 (10/41) respectively<br />
for drivers involved in impacts related to the 30" barrier and<br />
the 0" barrier. This difference is explained by a lower level<br />
of mean acceleration (approximately 4 g) to the benefit of<br />
drivers involved in "30" barrier" impacts.<br />
On the other hand, this advantage is completely wiped out<br />
in impacts related to the 30'barrier when the driver suffers<br />
critical intrusion. The gravity rate attains .36 (5/14). The<br />
difference with drivers related to the 30'barrier not suffer-<br />
248<br />
IIfACTS ffi-ATED TO O.TEST<br />
Fffi ELTEII OFIVEFS.<br />
. t AItr o-l-E<br />
+ HAIS 9-rl-6<br />
T KILLEP<br />
VELOCTTY CHAHEE (Tn K[/h)<br />
II#ACTS FELATEII TO 30. TEST<br />
FM EELTED OFIVERS,<br />
. XAIE o-t-e<br />
+ HAIE E-4-E<br />
x KILLED<br />
o lrlTr{ INTFUEIO}I<br />
YELOCITY Cl{Al*lEE (rn Krn./h)<br />
ing considerable intrusion is highly significant at the .05<br />
threshold (x2 = 6.61 ).<br />
With delta-V between 60 and 70 km/h, in spite of mean<br />
accelerations ofbetween l5 and 2l g, three out ofthe nine<br />
drivers involved in impact bordering on the 0" barrier did<br />
not suffer serious injury. The only killed was 42 years of age<br />
in a car subjected to considerable passenger compartment<br />
intrusion. Once again, for drivers whose impact is related to<br />
the 30" barrier, the balance is connected with presence or<br />
absence of critical intrusion.<br />
Out of l4 drivers, victims of critical intrusion between l0<br />
and 14 g mean acceleration, 8 were killed, 5 seriously injured<br />
(M.AIS 3-4-5) and only I was slightly injured<br />
(M.AIS l-2). In the absence of intrusion, the balance is<br />
more favourable since out of the l2 drivers concerned, the<br />
records show 0 killed, I seriously injured and 4 slightly<br />
injured. Since front passengers were involved (see figure 8),<br />
no case ofdirect intrusion took place on the occupant on this<br />
side of a delta-V of 60 km/h, either among cases related to<br />
the 0" barrier or among those related to the 30" barrier. The<br />
gravity rates of these front passengers are .16 (7 144) in cases<br />
bordering on the 30' barrier and higher, .23 (417) for cases<br />
assimilated to the 0" barrier. These rates are very similar to<br />
those observed for drivers under the same conditions (.10<br />
and .24 respectively).<br />
With delta-V between 60 and 70 km/h, high gravity is to<br />
6<br />
c l E<br />
6H<br />
Ers<br />
tr<br />
UT<br />
UJ<br />
.J<br />
o<br />
r t B<br />
z<br />
4<br />
lrl<br />
I<br />
6rE<br />
t<br />
g<br />
z<br />
Ers<br />
{<br />
fi<br />
lrJ<br />
IJ<br />
S e<br />
z<br />
{<br />
trl<br />
E<br />
IIfACTS FEIATED TO O. TEST<br />
FOH BELTED FHONT.PASSEI{GEtri.<br />
VELOCITY CHANGE (TN Kfi./N)<br />
IHFACTS HELATED TO S{T.TEST<br />
FOH BELTED FtrT{T-PASSE}EEFS.<br />
r l<br />
. HAIE o-l-e<br />
+ HAIE E-4-E<br />
|. KILLED<br />
O HTTH IHTruBION<br />
VELOCITY CHANBE (IN KNlh)<br />
Fioure L M.AIS ol belted front-passengers according to veloc'<br />
Itv-chanoe. mean accelerstion bf vehicle and <strong>Int</strong>rusl-on lor impicts<br />
related to 0'test or 30'test.
e observed (l killed and 4 seriously injured) for the 5<br />
pas$engers involved in impacts related to the 0o banier. This<br />
gravity appear$ less with the I I passengers involved in<br />
impacts related to the 30" barrier, who did not suffer intru*<br />
sion (l killed, 5 seriously injured and 5 slightly injured) on<br />
account of lower mean accelerations.<br />
Distribution of injuries by bodily area<br />
Non-minor injuries (AIS > 2 and AIS > 3) are given by<br />
bodily area (figure 9) for 261 ofthe 273 drivers and 126 of<br />
the 130 front passengers.<br />
fi otnrr,<br />
'.]<br />
':J<br />
DRIr/ERS (N- 261)<br />
|<br />
,*n""r" rcr.t;d to 30r test [l :lH::t<br />
LJ oo tcat<br />
tTHORAX I'PPER -ffih<br />
DOR$O ABITo|IEN PELVIS I4UEN<br />
LIXBS LTITBAR<br />
SPINE<br />
LD,qS<br />
FROI{I PA$$ENGEN$ 126 )<br />
*%ru-ffi-k LIEA,D H8tr ?HORN( Dofi3o rmmx pnlvrs<br />
UPPEN<br />
LIXBS<br />
LU;BAN<br />
SPUC<br />
ITgER<br />
LIIGS<br />
Flguru 9. AIS l 2 snd AIS r 3 Inlury dlatrlbutlon$ for belted<br />
drlvera and F.F. pas8angers by bodfly ar6as accordlns to the<br />
slmllarlty to 0. or 30" bariler terts (frodtal lmpEcts lrom:10 to 70<br />
km/h of delta-v).<br />
The exact balance of lesions arising at the time of immediate<br />
death is not known, failing authorization to perform<br />
autopsies. This concerns l2 drivers suffering critical intrusion<br />
(of which 6 in impacts related to the 30o barrier) and 4<br />
passengers (2 in impacts related to the 0o barrier without<br />
intrusion and 2 in impacts related to the 30" barrier of which<br />
I with intrusion). Consequently, it must be bome in mind<br />
that the frequency and the gravity of the injuries to drivers<br />
suffering critical intrusion is under-estimated in what<br />
follows.<br />
Among drivers, the majority of the lesions of moderate<br />
severity or more (AIS > 2) involve the head followed by the<br />
limbs. On the other hand, regarding injuries AIS > 3, the<br />
classification is reversed. This is explained by the very high<br />
frequency of AIS 2 lesions to the head, such as brief loss of<br />
consciousness or simple fracture of the maxillo-facial area,<br />
while open fractures of the limbs with AIS 3 rating are<br />
relatively more numerous-<br />
For belted passengers, the abdomen followed by the thorax<br />
constitute the bodily areas most frequently attained by<br />
serious lesions.<br />
Globally, both with drivers and passengers, the share of<br />
injuries arising from impacts related to the 0" barrier is fairly<br />
stable (between 20 and 307o) from one bodily area to another,<br />
apart from a few rare exceptions. This finding in fact<br />
hides considerable differences in risk connected with the<br />
types of related impacts.<br />
Table 5 gives the AIS > 2 and AIS 2 3 injury rates by<br />
bodily area according to the place occupied in terms of the<br />
related impact according to whether or not there was critical<br />
intrusion into the pas$enger compartment. On account of<br />
the low numbers in certain categories of cases with high<br />
intrusion, 3 drivers in impacts related to the 0" barrier and 7<br />
passengers (2 in 30" barrierand 5 with otherclassifications)<br />
do not appear.<br />
Tsble 5. AIS > and d'AlS > 3 rates bv bodllv area of belted<br />
drlv€rs and lront Dasaanq€ra accordlno to tvoe of frontsl<br />
lmpact and <strong>Int</strong>rusldn (frontll Impact$ : c0-kmlh-i delta-V < 70<br />
km/h).<br />
r H€rO<br />
r IECX<br />
. TTERAX<br />
r (rFfEF I<br />
Ll|fs)<br />
. otnSo<br />
LUfAfi<br />
SFIItE<br />
r A8tldlEll<br />
r PEIVIS<br />
r L(IER )<br />
LtnS)<br />
r HCIO<br />
. tEcx<br />
I rHnAI<br />
r UeeEr )<br />
LIr.08)<br />
.|Xnflt )<br />
Luita )<br />
8FiltEt )<br />
r AEllOa€l<br />
. PELYIS<br />
r L(ilER )<br />
LIr.S8)<br />
A - AI8 f2<br />
atiIVERS<br />
,"t,o'ilT# Oth.il<br />
(n=s)<br />
(n=e3)<br />
|<br />
.50 l.re<br />
0 l.0r<br />
,t6 | .06<br />
'ei<br />
I'<br />
.0e .0,<br />
|<br />
.116 | .01<br />
ii<br />
11.00<br />
ll 0<br />
ll .04<br />
ll .04<br />
tl<br />
tl<br />
ll.0r<br />
tl<br />
ll:li ll .re<br />
tl<br />
| :ll<br />
( n:t{t)<br />
.22<br />
.02<br />
.03<br />
.t2<br />
,01<br />
,02<br />
,01<br />
,t6<br />
0<br />
.01<br />
0<br />
.03<br />
0<br />
.01<br />
o<br />
.05<br />
Crlt lc.l<br />
<strong>Int</strong>rurl m<br />
l.ll t0'<br />
(n:tl)<br />
. 'ai<br />
.0,1<br />
. t4<br />
.tt<br />
o<br />
. ta<br />
.m<br />
. tl<br />
.06<br />
. t'a<br />
.tl<br />
0<br />
.t4<br />
.11<br />
.71<br />
.tt<br />
0<br />
.06<br />
Ffio*r P|sSErlEtS<br />
tll or ld tntrutto<br />
|!ll 50'<br />
(n'61)<br />
,zz<br />
0<br />
.tt6<br />
,t4<br />
otharr<br />
( n'at )<br />
,tt<br />
,0e<br />
,l5<br />
'1f<br />
The lessons to be drawn from this table are the following,<br />
per bodily area:<br />
t Head: The AIS > 2 lesion rate with drivers is<br />
comparable in real world accident related to the 0'<br />
barrier (.50) and in impacts with critical intrusion<br />
(.45 and .50). The rates of serious and fatal injuries<br />
(AIS > 3) are higher in the cases of critical<br />
o<br />
0<br />
.06<br />
.1t<br />
. tt<br />
0<br />
.tl<br />
0<br />
.06<br />
0<br />
.10<br />
.0'l<br />
.lo<br />
.0e<br />
0<br />
.04<br />
,06<br />
o<br />
.10<br />
.06<br />
.12<br />
.04<br />
.02<br />
.02<br />
0<br />
,02<br />
.0i<br />
0<br />
,02<br />
,02<br />
.02<br />
249
intrusion (.14 and .19) than in cases related to the<br />
0o barrier (.06r.<br />
t Thorax: The highest AIS > 2 and ) 3 lesion rates<br />
are observed for passengers involved in impacts<br />
related to the 0o barrier.<br />
. Upper /imbs; The highest risks are observed in<br />
cases of critical intrusion.<br />
t Abdomen.'The lesion rate is only lower with drivers<br />
involved in asymmetrical impact without<br />
intrusion.<br />
r Pelvis: The risk is only really present with drivers<br />
involved in impacts related to the 30" barrier with<br />
critical intrusion.<br />
t Lower limbs:The AIS > 2 or 3 risks are only very<br />
high among drivers suffering critical intrusion.<br />
In short, for all bodily areas (except the thorax), it appears<br />
that the risks are always higher when the driver is victim of<br />
critical intrusion into the passenger compartment. These<br />
risks exceed those observed in impacts related to the 0"<br />
barrier, which themselves remain higher than the gravity<br />
rates recorded in other impacts where there was no significant<br />
reduction of the pa$senger compartment space.<br />
Let us finally point out that 47Vo (68/146) of all the<br />
serious and fatal injuries (AIS E 3) are observed in impacts<br />
related to the 30o barrier against 24Vo in impacts related to<br />
the 0o barrier and 29Vo distributed among the various remaining<br />
types of impact.<br />
Discussion<br />
The 0" barrier test i$ widely used in both American and<br />
European standards. It is primarily supported by the<br />
NHTSA (15), which estimates that a 0o barrier test is<br />
preferable to a test against an oblique barrier insofar as the<br />
latter may constitute an obstacle to the development of<br />
inflatable air-bags. J. Hackney ( l6), taking the NCSS file as<br />
basis, adds that the risks connected with directions of 12<br />
o'clock impacts with deformation distributed over the<br />
entire front end are higher in real world frontal impact. Our<br />
survey shows that this is not exact in the case of belted<br />
occupant$ victims of a significant reduction in passenger<br />
compartment space.<br />
But what is desirable for any regulation is moreover<br />
absolutely essential for a system of inter-classification of<br />
vehicles, especially if its objective is comparative data on<br />
potential vehicle safety. In the United States, prediction of<br />
the safety level of tested cars is based on impact against<br />
orthogonal barrier within the framework of the New Car<br />
Assessment Program. The explanation of the divergences<br />
between this program, also called "Crashworthiness<br />
Rating," and real world accidents has been sought in terms<br />
ofrepresentativity ofthe test and consistency ofthe criteria<br />
measured on dummies with reference to the injuries<br />
observed in real world accidents (17, 18, 19,20). It appears<br />
that recourse to an asymmetrical test of the impact against<br />
"30"<br />
barrier" type and the addition of supplementary<br />
protection criteria concerning the quality of pelvic restraint<br />
250<br />
and facial protection are minimal improvements to be made.<br />
In Europe, at statutory scale, two initiatives $upporting<br />
the 30o barrier test were taken in the pa$t but were not<br />
concretized. As far back a 1974, the European Committee<br />
for Experimental Vehicles (21) declared itself in favour of a<br />
global asymmetrical test (30" barrier or 50dlo off-set banier).<br />
The other initiative is a draft regulation for global frontal<br />
impact with test against 30'barrier drawn up in 1983 under<br />
the care of the European Economic Commission. This<br />
document (22), adopted by a group of vehicle<br />
manufacturing experts, wanted to con$titute a statutory<br />
altemative to the often ancient regulations at present in<br />
force.<br />
The asymmetrical test against off-set banier with overlap<br />
in the region of 40Vo above all aims to verify that the<br />
behaviour of the front end structure of the car does not lead<br />
to critical intrusion without however resorting to<br />
rigidification of the front unit of the car to such an extent<br />
that the tolerances of the occupants risk being exceeded,<br />
especially in symmetrical impacts. Analysis of real world<br />
accidents clearly indicates that efforts must be made to<br />
attain this object. However, it is necessary to emphasize<br />
here that the largest number of critical intrusions is not<br />
observed in impacts of the " l/3 or l/4 track" type, but occur<br />
in cases where overlap with the obstacle is greater than or<br />
equal to half the front end of the car.<br />
The interest of a statutory te$t i$ to propose one single<br />
global procedure aiming to faithfully restitute the attendant<br />
risks. connected with intrusion on the one hand and<br />
accleration on the other hand, suffered by the majority of<br />
seriously injured and killed belted occupants. This means<br />
that the deformations of the vehicle must be programmed<br />
taking two complementary criteria into consideration:<br />
r integrity of the passenger compartment under<br />
asymmetrical impact conditions,<br />
r compliance with protection criteria measured on<br />
dummies.<br />
With more than 4OVo of serious victims involved in<br />
impacts related to the 30" barrier, it appears that this test<br />
constitutes the berrt compromise that can be made to<br />
advance the protection offered in frontal impact.<br />
Since the subject was voluntarily limited to the study of<br />
real world accidents. reference should be made to the work<br />
of G. Stcherbatcheff for a comparative survey of different<br />
frontal te$ts at experimental scale (23).<br />
Conclusions<br />
Analysis of a sample comprising 746 impacted vehicles<br />
ofall makes and 403 front occupants restrained by seatbelts,<br />
involved in velocity changes (delta-V's) equal to or greater<br />
than 40 km/h shows that:<br />
. Only lTVo of the cars present deformation related<br />
to the 0" barrier and mean accelerations<br />
undergone by these vehicles are less than those<br />
obtained with the 0o barrier test in half the cases.
The strict relationship to the 0o barrier test is<br />
therefore only observed for less than l07o of<br />
frontal real world impacts.<br />
r Killed and seriously injured belted occupants in<br />
impacts related to the 0" barrier represent less than<br />
a quarter of all the serious victims of the sample.<br />
r Risks of AIS E 3 lesions to drivers are lower in<br />
impacts related to the 0o barrier than in impacts<br />
with critical intrusion into the passenger<br />
compartment observed in asymmetrical impacts.<br />
r Majority of the cars involved in real world frontto-front<br />
road accidents present deformations and<br />
mean accelerations comparable with those<br />
observed against the 30o barrier.<br />
. Impacts related to the 30o barrier represent 427o of<br />
the cars studied, 43Vo of $eriously injured belted<br />
victims and half the killed belted victims.<br />
r With delta-V between 40 and 60 km/h, intrusion<br />
multiplies the risk of being seriously injured by 4.<br />
r Largest number of severe intrusions into the<br />
passenger compartment is recorded in impacts<br />
related to the 30" barrier.<br />
In short, it appears that the global frontal impact test<br />
against 30o barrier effectively constitutes the best<br />
compromise that can be made to translate risks of intrusion<br />
and the exceeding of tolerances observed in reality with the<br />
largest number of seriously injured belted victims within<br />
one same test.<br />
References<br />
(l) F. Hartemann, "Enqu€te midicale et technique sur les<br />
accidents de la route", Inginieurs de I'Automobile, 1972,<br />
n" 12<br />
(2) C. TarriEre, "De la rCalitd des blessures aux critEres<br />
pris en compte dans les tests de sdcurit0", Ingdnieurs de<br />
I'Automobile, 1972, n" 12.<br />
(3) P. Ventre, J. Provensal, "Proposition d'une mCthode<br />
d'analyse et de classification des sdvCritds de collisions en<br />
accidents riels", IRCOBI <strong>Conf</strong>erence, Amsterdam, June<br />
26.1973.<br />
(4) P. Ventre, "Proposal Methodology for Drawing-up<br />
Efficient Regulations", 4th <strong>Int</strong>ernational Congress on<br />
Automotive Safety, San Francisco, July l,t-16, 1975.;<br />
(5) C. Tarribre, A. Fayon, F. Hartemann, "The<br />
Contribution of Physical Analysis of Accidents Towards<br />
<strong>Int</strong>erpretation of Severe Traffic Trauma", l9th Stapp Car<br />
Crash <strong>Conf</strong>erence, San Diego, November l7-19, 1975.<br />
(6) R.H. Arendt, "Crash Test Performance of Renault<br />
Basic Research Vehicle",6th <strong>ESV</strong> <strong>Conf</strong>erence, Washington<br />
DC, October 12-15, 1976.<br />
(7) J.A. Desbois, *'Peugeot Status Report", 6th <strong>ESV</strong><br />
<strong>Conf</strong>erence, Washington DC, October l2-15, 1976.<br />
(8) P. Ventre, "Renault Status Report", 6th <strong>ESV</strong><br />
<strong>Conf</strong>erence, Washington DC, October l2-15, 1976.<br />
(9) K. Friedman, "Phase II RSV Accident Analyses<br />
Techniques", 6th <strong>ESV</strong> <strong>Conf</strong>erence, Washington DC,<br />
ocrober l2-15. 1976.<br />
(10) B.S. Riley and C.P. Radley, "Traffic Accidents to<br />
Cars with Directions of Impact from the Front and the<br />
Side", 6th <strong>ESV</strong> <strong>Conf</strong>erence, Washington DC, October 12-<br />
15. t976.<br />
(ll) F. Zeidler, H.H. Schreier and R. Stadelmann,<br />
"Accident Research and Accident Reconstruction by the<br />
EES-Accident Reconstruction Method", SAE Congress,<br />
Detroit, Michigan, Feb. 25-March I, 1985.<br />
(12) L. Criisch, K.H. Baumann, H. Holtze and W.<br />
Schwede, "Safety Performance of Passenger Cars<br />
Designed to Accommodate Frontal Impacts with Partial<br />
Barrier Overlap", SAE Congress, Detroit, Michigan, Feb.<br />
Z7-March 3, 1989, SAE Paper 890 748.<br />
(13) Laboratory of Physiology and Biomechanics<br />
Associated with Peugeot S.A./Renault "Assessment of<br />
Crash Severity", Published at the Workshop on assessment<br />
of crash severity, Cothenburg, Sweden, September 1984.<br />
(14) American Association for Automotive Medicine,<br />
"Abbreviated Injury Scale-l980 revision".<br />
(15) NHTSA, "FMVSS 208", Docket74.l4, Notice 38,<br />
April 1985.<br />
(16) J. Hackney, "Comparison of 0o and Oblique Tests",<br />
l0th <strong>ESV</strong> <strong>Conf</strong>erence, Oxford, England, July l-4, 1985.<br />
(17) J.R. Stewart and E.A. Rodgman, "Comparisons of<br />
NCAP Crash Test Results with Driver Injury Rates in<br />
Highway Crashes", Final Report, October 1984, H.S.R.C.'<br />
University of North Carolina, Chapel Hill, N.C. 27514,<br />
U.S.A.<br />
(18) C. Thomas, F. Hartemann, J.Y. Fordt-Bruno, C.<br />
TarriEre. C. Chillon. C. Hufschmitt, C. Got and A. Patel,<br />
"Crashworthiness<br />
Rating System and Accident Data:<br />
Convergences and Divergences", SAE <strong>Int</strong>ernational<br />
Congress and Exposition, P14l, Advances in belt restraint<br />
systems, Detroit, Michigan, U.S.A., Feb. 27-March 2,<br />
1984.<br />
(19) J. Provensal, F. Hartemann and C. TarriEre, "Five<br />
years of New Car Assessment Program: balance and current<br />
conclusions<br />
", Proceedings of l0th <strong>Int</strong>emational Technical<br />
<strong>Conf</strong>erence on Experimental Safety, Oxford, England, July<br />
14. 1985.<br />
(20) C. TarriBre, "Comment amCliorer I'addquation<br />
entre la protection Cvalu€e dans les tests et la sdcuritC rdelle<br />
con$tatde sur la route", Proceedings of lrr'Eme <strong>Conf</strong>drence<br />
Canadienne Multi-disciplinaire sur la Sdcuritd RoutiEre,<br />
Montrdal, 26-28 mai 1985.<br />
(21) H. Taylor, "EEVC Status Report," 5th <strong>Int</strong>emational<br />
<strong>ESV</strong> <strong>Conf</strong>erence. London. June 1974.<br />
(22) Nations Unies-Commission Economique pour<br />
I'Europe, "Projet de rdglement sur le choc frontal global",<br />
TRANS/SCI1WP29/R237, Revision I du 24 ao0t 1983.<br />
(23) G. Stcherbatcheff, "Frontal Crash Tests and<br />
Compatibility", l2th <strong>ESV</strong> <strong>Conf</strong>erence, Gothenburg,<br />
Sweden. Mav 29-June 2. 1989.<br />
251
Reference Frontal Impact<br />
G. Stcherbatcheff, R. Dornez and D. Pouget,<br />
Renault<br />
Abstract<br />
Automotive structural design is influenced by the choice<br />
of a method for evaluating the protection level provided by a<br />
vehicle in frontal impact. This choice influences the vehicle's<br />
performance in real accidents.<br />
This paper compares different reference frontal collisions;<br />
offset car-to-car impact with 507o overlap on the left<br />
side; 30' angled barrier impact on the left side with or<br />
without anti-slip system; offset half-barrier impact with<br />
45Vo overlap on the left side; and impact against 0" angled<br />
barriers.<br />
I clc (rr lo rf Yitlr dftttl 2<br />
3<br />
f iltld !*tiff<br />
r{||| ifi t{t<br />
I.<br />
lN AC<br />
5 .rr: 0.fltlad brrft vitt clfrrl 6 ]AB<br />
FIgure 1. lmpact conflgulallons.<br />
252<br />
IJJJJJJJJJI<br />
l0r rdr{ rnr.<br />
lfx#d brri.r<br />
4rl xti rlit rltfrE<br />
ts ||d|{ lrrhr<br />
These different impact configurations are compared in<br />
terms of $tructure and test dummy injury criteria by main<br />
component analysis of the data. The configurations are<br />
evaluated from the viewpoint ofrepresentatives ofreal road<br />
conditions. The question is posed as to their influence on<br />
compatibility, especially in side collisions.<br />
<strong>Int</strong>roduction<br />
Thirty-nine frontal collisions against various barriers and<br />
car-to-car were performed and analyzed. The vehicles<br />
selected are five recent models of the Renault range. The six<br />
configurations, tested at 56 km/h, are shown in figure l.<br />
The first configuration, impact between two identical<br />
vehicles, aims at simulating a category of collisions<br />
representing 60Vo of severe injuries in frontal impact. The<br />
impact against a 30o angled barrier corresponds to a planned<br />
European standard. The offset half-barrier is a barrier used<br />
by certain laboratories and car makers for the development<br />
of their vehicles. The impact against a 0" angled barrier<br />
corresponds to European Standard ECE l2 and U.S.<br />
Standards FMVSS 204 and 208, the statutory speed being<br />
48.3 km/h instead of 56 km/l which is the speed taken into<br />
account in this study.<br />
Methodology<br />
For each of the 39 tests. 22 factors were selected<br />
describing the test conditions, structural deformations and<br />
test dummy injury criteria.<br />
The 858 (39 X 22) data items are presented in reduced<br />
form in table l. Table 2 shows the mean values of these<br />
factors for each test configuration.<br />
Above all, however, this data was subjected to analysis<br />
with the SPAD software (Portable System for Data<br />
Analysis) (1).*<br />
In view of the number offactors adopted and the scatter of<br />
certain factors, 39 tests may seem a limited number for<br />
precise analysis. However, it will be noted that the software<br />
used provides indicators allowing evaluation of the analysis<br />
validity level and also shows factors poorly represented in<br />
the data set and for which no conclusions can be reduced.<br />
It is clearly advisable to increase the data set with time so<br />
as to verify that the conclusions drawn from the 39 tests are<br />
confirmed.<br />
Factors flnalyzed<br />
All the tests were performed at a speed of 56 km/h, which<br />
was a constant in the study. The slight fluctuations in test<br />
speed around 56 kmlh do not affect the study results, and<br />
this was verified beforehand.<br />
The first two factors listed below describe the test conditions,<br />
while the other 20 factors indicate the te$t results.<br />
N.B.: Factors l, 2 and 4 are qualitative (or illustrative)<br />
factors which do not contribute to calculation of the main<br />
axis, unlike the other factors which are quantitative. However,<br />
these qualitative factors, when projected onto the main<br />
*Numbers in parentheses designate rcfetences at end of paper.
Table 1. Test reaults (for each quantltatlve fsctor, the mean calculated on all tests ls equsl to 100).<br />
i<br />
I<br />
I<br />
t<br />
I<br />
I<br />
I<br />
I<br />
I<br />
a<br />
I<br />
t<br />
I<br />
I<br />
t<br />
t<br />
t<br />
I<br />
{ I<br />
{<br />
J<br />
t<br />
I<br />
5<br />
I<br />
I<br />
I<br />
I<br />
I<br />
I<br />
;s.<br />
2 H<br />
i<br />
I<br />
I<br />
I<br />
s<br />
I<br />
I<br />
5<br />
I<br />
I<br />
I<br />
t<br />
I<br />
,<br />
I<br />
a<br />
I<br />
I<br />
I<br />
I<br />
{<br />
I<br />
8<br />
t<br />
I<br />
I I<br />
t<br />
I<br />
I<br />
a<br />
{<br />
r<br />
f<br />
a:<br />
fl<br />
v<br />
]<br />
r0i<br />
fl<br />
E<br />
t<br />
ll<br />
ti<br />
]<br />
tl<br />
lll<br />
rll<br />
T<br />
ll<br />
T<br />
tz<br />
?{<br />
l0l<br />
tl<br />
1<br />
t<br />
!a<br />
E<br />
I<br />
at<br />
rol<br />
td<br />
tol<br />
It<br />
lt;<br />
]<br />
nl<br />
l+<br />
llaad<br />
l. Ulnl lrr<br />
I<br />
Y<br />
Y<br />
i<br />
I<br />
T<br />
I<br />
Y<br />
I<br />
f<br />
f,<br />
I<br />
I<br />
t<br />
I<br />
Y<br />
I<br />
I<br />
Y<br />
t<br />
t<br />
I<br />
t<br />
I<br />
I<br />
I<br />
t<br />
Y<br />
I<br />
I<br />
I<br />
r<br />
t<br />
I<br />
t<br />
t<br />
rl<br />
il<br />
r01<br />
J'<br />
I<br />
Itl<br />
t<br />
rd<br />
I<br />
I<br />
7l<br />
tl<br />
tl<br />
E<br />
tlt<br />
lf, 7l<br />
T I<br />
lg<br />
I<br />
rta<br />
t?<br />
r0l<br />
IC<br />
T<br />
l:<br />
7l<br />
I<br />
td<br />
IT<br />
ul<br />
tfl T<br />
tl<br />
tot<br />
t0l<br />
Tfl<br />
lol<br />
n<br />
ll<br />
rfi T<br />
til<br />
I<br />
I<br />
I<br />
?t<br />
?l<br />
ltt<br />
lf,<br />
.rl<br />
I<br />
Ir(<br />
l0l<br />
lol<br />
n t<br />
T<br />
n<br />
F TT<br />
rtl<br />
lll<br />
ls<br />
l0t<br />
t<br />
rd,l<br />
Ill<br />
l0t<br />
rl<br />
lol<br />
la<br />
rl<br />
fl ll<br />
tl<br />
ll<br />
il<br />
f(<br />
I<br />
lu il<br />
t{<br />
T<br />
la<br />
tl<br />
at<br />
DI<br />
lll<br />
r.l<br />
rl<br />
It<br />
ta<br />
lf,<br />
tl<br />
tl<br />
ru<br />
ll<br />
rI<br />
n<br />
rl<br />
tl<br />
ltl<br />
H<br />
aa<br />
lf<br />
ul<br />
tal<br />
!<br />
Itl<br />
It<br />
lll<br />
fi<br />
fl<br />
J<br />
t3<br />
{t<br />
lf 3<br />
fl<br />
n,<br />
3<br />
t,<br />
!<br />
I<br />
t:<br />
?l<br />
lt,<br />
ll<br />
t<br />
f<br />
t<br />
lr<br />
l0l<br />
ll:<br />
a<br />
tl<br />
al<br />
tl<br />
a fl<br />
frt<br />
Pralc<br />
'I<br />
|.<br />
ll<br />
fl<br />
It<br />
tl<br />
||<br />
a<br />
fl<br />
IC<br />
fi<br />
{<br />
ll{ tt<br />
lll<br />
Itl<br />
?l<br />
I<br />
tl<br />
lq t<br />
an<br />
tl<br />
rll<br />
lol<br />
5t<br />
ttI<br />
?l<br />
T<br />
t<br />
t!<br />
l?l<br />
ttl<br />
lrr<br />
lrI<br />
rll<br />
tt!<br />
llr<br />
t<br />
ill 3<br />
3 t<br />
t<br />
t<br />
t<br />
I<br />
E<br />
E<br />
t<br />
ll1<br />
lll<br />
l1<br />
r0l<br />
I<br />
lol<br />
l0r<br />
l0l<br />
li<br />
llr<br />
lc<br />
E<br />
l{l<br />
tl<br />
It<br />
ll<br />
l.<br />
U(<br />
ul<br />
ttl<br />
tn<br />
I<br />
tl !<br />
ll<br />
?<br />
!<br />
||l<br />
It<br />
It<br />
tl<br />
ll{<br />
l{t<br />
til<br />
lt<br />
It<br />
ltl<br />
I$ x<br />
tr<br />
CT<br />
t?l<br />
rfl<br />
Itr<br />
I<br />
II<br />
t{<br />
ltl<br />
u<br />
rt(<br />
tl<br />
ul<br />
H llt<br />
lo{<br />
al<br />
tl<br />
!<br />
l<br />
tl<br />
n<br />
L<br />
|8!<br />
l0l<br />
?l<br />
t<br />
l0l<br />
tl<br />
|.<br />
|{<br />
x<br />
lrl<br />
lll<br />
tl<br />
t<br />
t<br />
T<br />
to{<br />
s{<br />
tl<br />
I<br />
tol<br />
77<br />
It{<br />
fl<br />
tl<br />
lc t5<br />
lx<br />
ul<br />
tl<br />
ut<br />
ull<br />
t4<br />
qr<br />
t<br />
tt<br />
tl<br />
l{<br />
u[<br />
rfi<br />
rol<br />
t<br />
i<br />
l|1<br />
rtr<br />
llt<br />
TT<br />
lol<br />
f<br />
t<br />
T<br />
l0l<br />
lfi<br />
I<br />
fl<br />
rt<br />
lr<br />
IOt<br />
l9t<br />
tl<br />
4<br />
lsl<br />
lll<br />
lol<br />
l8{<br />
tl<br />
ld<br />
tl<br />
r!<br />
tl<br />
T<br />
fl<br />
t!<br />
ttl.<br />
cFa! rt vl l0tt ill[ |lffirlf<br />
rdl<br />
Table 2. Test regultg: mean values of sach quantitatlve faclor for €sch impact conflguratlon (lor each quantltatlv€ fsctor, ths mean<br />
calculatsd on all te$ts ls equal to 100)<br />
tsrd<br />
Dt|tC<br />
tl<br />
t1<br />
l0i<br />
lr<br />
t{<br />
rll<br />
Factor<br />
No. Labcl<br />
I<br />
r0{<br />
l0l<br />
ut<br />
l|l<br />
ul<br />
ltl<br />
I<br />
I<br />
lfi<br />
lda<br />
lil<br />
tt<br />
||<br />
lr t<br />
tli<br />
lll<br />
I<br />
r0r<br />
t<br />
lrl<br />
llI<br />
l0l<br />
fi<br />
ll<br />
3<br />
rll<br />
lq<br />
lri<br />
tf,<br />
t<br />
t<br />
il<br />
ll<br />
tl<br />
I<br />
lq<br />
tl<br />
t8l<br />
tlt<br />
rl|<br />
ru tt<br />
|r<br />
d<br />
ll?<br />
u0<br />
lot<br />
rol<br />
lll<br />
ll:<br />
fl<br />
l0i<br />
td<br />
rl(<br />
rll<br />
lll<br />
t0i<br />
t'<br />
11<br />
ttt<br />
T<br />
r0f<br />
tll<br />
T<br />
|{<br />
tl<br />
tr<br />
tl<br />
ll<br />
tl<br />
I<br />
I<br />
It<br />
lr1<br />
ttl<br />
rT I?l<br />
ll<br />
frl<br />
IE<br />
tl<br />
rt<br />
I.t<br />
t<br />
tl!<br />
T<br />
5<br />
IG<br />
fl<br />
tt!<br />
?t<br />
|{<br />
t tal<br />
It<br />
lfi<br />
ll<br />
$<br />
ltl<br />
'l<br />
ttt<br />
EJ<br />
Ir I<br />
{li<br />
r|l<br />
ral<br />
I<br />
ril<br />
f,<br />
)t<br />
.'fl1<br />
-r|il<br />
-lll<br />
-r|i<br />
{ll<br />
-1rt/<br />
Dllvtl ttltErclfl ll ?ll.x llAl.tltl ll aEcrl I Pttx. DltE ttl<br />
ul<br />
tl<br />
t6<br />
l0r<br />
tt<br />
rtr<br />
Irul<br />
tl<br />
H<br />
tl<br />
l0l<br />
9t<br />
Itt<br />
tEuH<br />
la<br />
?t<br />
tl<br />
ttl<br />
rq<br />
J<br />
lil<br />
ll:<br />
f<br />
I<br />
fi<br />
a1<br />
lral<br />
pflrc<br />
tl<br />
?l<br />
lfl<br />
ltt<br />
lri<br />
rai<br />
T<br />
r<br />
l0l<br />
l0t<br />
ft<br />
tta<br />
t[uH<br />
t1<br />
lfi<br />
t{<br />
t0{<br />
tl<br />
llrl<br />
t1<br />
tl<br />
tl<br />
le|<br />
fl<br />
tt:<br />
tlD GRt.i<br />
llJ l0l<br />
ll0 rq<br />
l0t l0:<br />
It tc<br />
u0 ll:<br />
tt .|<br />
Yharlt-rtZ<br />
Ilr Itl<br />
ltt ltt<br />
rgt tl<br />
lfi tl<br />
rfl l?3<br />
u<br />
-tDl<br />
rt1<br />
ttr<br />
rifi<br />
-tl<br />
a<br />
l0t<br />
?1<br />
l1<br />
l1<br />
tq<br />
rfi<br />
YI<br />
T<br />
I<br />
tl<br />
ll(<br />
t<br />
t rtt<br />
I<br />
t<br />
I<br />
*<br />
lfi<br />
td<br />
crtr r{D(L<br />
r{<br />
ct<br />
il<br />
ll(<br />
lrl<br />
tr<br />
flrwrll<br />
Edl<br />
-ll<br />
.{A<br />
'Ut<br />
-|fl<br />
-s<br />
{ I<br />
.Il<br />
-trl<br />
al<br />
- ttl<br />
3rl<br />
-xl<br />
{<br />
It<br />
lli<br />
-tl<br />
tttY Fr|| d.d Ltrata I I I<br />
fd3t condltloB<br />
N, A, Ref Test cffiflguFrtion<br />
30 A8<br />
caF-to-car wlth ofrrat<br />
30' esrcd buFi.r (rtsdrd<br />
brrricr)<br />
30 sH 3 30' uslGd bsri$ PIus rlde Ydl<br />
30 HS 4<br />
30' rr[IGd btf,Fl.r Yttlt<br />
stt-rllD ryrtf<br />
OFTS 5 0' utl.d buFirr rlth offrct<br />
oB 6<br />
fl.4. r -:l Vrhtcl. tyF.<br />
O' fiul.d bsrlrr (itsdrt{<br />
b|frlcF)<br />
axes, give the analysis its full value.<br />
(a): Values resulting from film analysis (figure 2).<br />
(b); Definitions of mean decelerations until engine stoppage<br />
and until maximum vehicle crush (figure 3).<br />
tll<br />
fl<br />
11<br />
llt<br />
lli<br />
ril<br />
lc lr<br />
f<br />
tl<br />
fi<br />
rfl<br />
t tl<br />
f,<br />
tl<br />
?l<br />
lc 3<br />
tl<br />
||<br />
tl<br />
lq<br />
I<br />
t:<br />
lq<br />
t<br />
lot<br />
lfl<br />
l{ a/<br />
lal<br />
lll<br />
f,<br />
lr<br />
rt(<br />
rot<br />
rlj<br />
lll<br />
?t<br />
?l<br />
fi<br />
rl<br />
tl<br />
lci<br />
I<br />
tl<br />
'l<br />
t{<br />
?1<br />
I<br />
rfi<br />
t!<br />
lll<br />
I<br />
lll<br />
lll t1<br />
riE<br />
l||<br />
t<br />
tl<br />
lfl s<br />
I<br />
ll<br />
lr<br />
?1<br />
tl<br />
?l<br />
tlt<br />
ll,i<br />
l{i<br />
ltl<br />
t{l<br />
rtl<br />
ts<br />
lrl<br />
L<br />
T<br />
|r<br />
H<br />
lr<br />
ltl<br />
I<br />
I<br />
n<br />
tl<br />
J<br />
tl<br />
I<br />
la<br />
f<br />
t<br />
fl<br />
tl<br />
t!<br />
t<br />
I<br />
li<br />
ll<br />
lu I<br />
$<br />
lol<br />
tq tl<br />
lol<br />
s<br />
l{<br />
rI<br />
t?l<br />
l$<br />
lri<br />
rll<br />
Iq<br />
t<br />
rrl<br />
Itl<br />
tu<br />
l|1<br />
Iti<br />
lll<br />
ril<br />
l7l<br />
It<br />
{l<br />
t{<br />
tq<br />
tl<br />
3l<br />
ll<br />
7i<br />
tt<br />
{l<br />
l<br />
f<br />
lo{<br />
l0{<br />
lll<br />
ll<br />
tf<br />
ru<br />
r3<br />
lla t|<br />
x<br />
la<br />
tl<br />
tt<br />
t{<br />
I<br />
tu<br />
lll<br />
lll<br />
t<br />
r}<br />
ul<br />
lrl<br />
ltt<br />
r0r<br />
llt<br />
{<br />
T<br />
tot<br />
lll<br />
?l<br />
fl<br />
t<br />
a<br />
tl<br />
I<br />
l1<br />
?!<br />
rq<br />
l0r<br />
ltl<br />
t<br />
tI<br />
ui<br />
I<br />
ltr<br />
It<br />
f,<br />
lll<br />
tl<br />
a;<br />
?i<br />
Il<br />
ll<br />
tdr<br />
lI|<br />
11<br />
t1<br />
tli<br />
Itl<br />
tt<br />
(c); Passenger compartment integrity: maximum permanent<br />
intrusion of the windshield lower cross member and<br />
firewall (figure 4).<br />
Quantitative factorsi Main results<br />
Main axes and correlation circle<br />
A main component analysis is performed on all the data<br />
for the 39 tests. Each test is assigned an identical weight.<br />
Processing involves a transfer from a space of dimension<br />
n = l9 (number of quantitative factors) to a main plane l-2<br />
(annex I ) which provides an optimum representation of the<br />
data set in terms of inertia (figure 5).<br />
In the case under study, the l-2 plane found seems quite<br />
satisfactory and should be a good representation of real<br />
conditions, since these axes repre$ent 587o ofthe total inertia,<br />
whereas it is common, in data analysis, to represent only<br />
about 307o. Axis I by itself represents 43Vo of the inertia,<br />
and axis 2 represents | 5o/o. Tt,e other axes have an inertia of<br />
less than l07o (figure 6).<br />
253
Tut Frultr<br />
IlEL.r<br />
J DIIIC Drl%r ilutru EIC<br />
4 Y (or il)<br />
H6rrl lDact (or m hilil l|prct)<br />
6 thr ' rtErlns ulHl<br />
5 Dltl Y R [*IN th6ro<br />
6 DIU3 IR 3 || tldrir<br />
tlulM l.ft fff lorc6<br />
I DNF XulN ltlht fru fo*r<br />
9 9ET' lBNcnBGr ilulro HIC<br />
10 9fl t R rulu thoru<br />
DIF xut|u IGft fdr foE€<br />
12 Pnr XulE rt8ht lffir foE6<br />
Vrhlclc<br />
13 t2 Tlil rt ehtch wlrlclc cruh l| rutrs (r)<br />
r6<br />
rB al<br />
r9 .2<br />
20 t<br />
ZL<br />
22<br />
d!d fitr<br />
'}I<br />
l?l<br />
I<br />
I<br />
I<br />
I<br />
drs. H*lffi fihlcle crush (a)<br />
t<br />
Lm8{tu.llnal ront of which<br />
rt riri t2 (r)<br />
Trffiwse w#nt of whiclc<br />
rt tts tl (i)<br />
thdtt vchlcli rotitton rt tlE t2 (r)<br />
pdH<br />
pdf<br />
.$P<br />
I li\<br />
t<br />
I I<br />
I<br />
lbar \tahlcli dtrrlurtlffi utll<br />
m8tn rtoppqiE (b)<br />
lbs vahtcl. d.cilultlon fH cils{ir ttofprt<br />
utll u, shlcld cruh (rt ttr t2)(b)<br />
t s rrdrlclc drcditat{ott sttl<br />
trs € (b)<br />
lt*lrlt Dtrrfirfirt ttrtulm ol thr llndthlau<br />
Iffir cffir nrbar (c)<br />
llulE p.ffit lntruto$ of tI|<br />
frffiitl (c)<br />
I rrh<br />
r|| dtililir ruh{rr|rl0-ll<br />
\ l<br />
l l<br />
\l<br />
lr<br />
II<br />
I<br />
I<br />
I<br />
thJr<br />
llrrrltrJwt rtr{r||<br />
(flh rnddrl<br />
Yirir<br />
Flgure 2. Vehlcle klnematlcs. Deflnltlon of maxlmum cruah,<br />
longitudinal and transv€rse movsments and rotation.<br />
254<br />
I<br />
rl<br />
I<br />
rl<br />
ItlntrUl<br />
rl=lild r2:,Wr2, r=y413gg<br />
dl dmrr-61 dmrr<br />
Figure 3. Vehicle klnematlcs: deflnltlon ol mean deceleratlon<br />
vsluee.<br />
Flgure 4. <strong>Int</strong>egrity ol the vehlcle'$ passenger compartmGntr<br />
locatlon of permanent<br />
d€formation,<br />
The correlation circle of radius I makes possible the<br />
following:<br />
I<br />
I<br />
,<br />
,<br />
I<br />
'r rr*-----l I<br />
I<br />
I<br />
I<br />
I<br />
I<br />
I<br />
,<br />
I<br />
i-_*_____-i<br />
Dae. r drrr brdtallrl FE mil adl*Itlil * tb L'f r*r4.hLld<br />
ffi raLr<br />
ia.l+ r rds. bnaltrdli.l Ftlmnt a.f*Drbi C tlr llrnl<br />
(a) Viewing, in the l-2 plane, of factors poorly represented<br />
in that plane and therefore unusable on first<br />
analysis. Their image points are close to the centre of<br />
the circle.<br />
In the present case, 4 factors should be eliminated:<br />
driver and passenger femur forces. Their "bad" repre-<br />
sentation is probably due to excess scatter of femur<br />
forces and/or their small amplitude.
D0tr \<br />
+ \<br />
Ddt<br />
Ar'r 2 !l57rj<br />
Flgure 5, FeProsantatlon ol quantltatlve lactors and correlstlon clrcls In the mrln plane 1-2.<br />
Ft'r<br />
+<br />
/<br />
,/<br />
| + +<br />
P|rrc<br />
Otx 1<br />
+-l<br />
/ stHt<br />
/ {<br />
/ ,<br />
/ rl<br />
+<br />
Anlt&37r1
l1<br />
s<br />
It<br />
lo<br />
It<br />
t0<br />
t<br />
0<br />
Flgure 6. Contrlbutlon of lhe main axes to totsl in€rtla.<br />
(b) Selection of the most significant factors, i'e.,<br />
those closest to the circle of radius l, since they contribute<br />
extensively to the inertias of the main axes<br />
I and 2. Factor$ located within the circle of radius 0.7<br />
are not in the main plane and cannot be used on first<br />
analysis.<br />
(c) Revelation of (positively or negatively) correlated<br />
factor$ and independent factors'<br />
Positively conelated factors are grouped clo$e together:<br />
e.9., dmax, x, Y, t2.<br />
Some of these factors could be eliminated for subsequent<br />
analyses.<br />
Negatively correlated factors are diametrically opposite:<br />
e.g., a2, dmax.<br />
Independent factors are located on radii perpendicular to<br />
one another: thetz and dmax.<br />
Main correlations<br />
The main axis of the l-2 diagram, bearing 43Vo of the<br />
inertia, gives the main physical parameters of impacts performed<br />
at constant speed, namely, mean vehicle deceleration<br />
and a2 during the second phase of the impact, and<br />
negatively correlated factors such as crush and duration of<br />
impact.<br />
The secondary axis on the l-2 diagram, bearing l1Vo of<br />
the inenia, gives the rotation factor thetz, but especially, as<br />
shown in a subsequent study performed with additional<br />
256<br />
t0 ll tt tr ta tl tr lt tl It<br />
factors not included in the present analysis, the vehicles'<br />
weight.<br />
Insofar as concerns the vehicle occupants, very good<br />
correlation of driver head and thorax injury criteria (DHIC'<br />
DTH, DTH3) is observed with deceleration a2' The driver<br />
"is<br />
canied" by the axis of the impact.<br />
The passenger head and thorax criteria (PHIC, PTH)'<br />
although correlated, are Iocated on an axis at 45" relative to<br />
the axis of the impact. This results in sensitivity of these<br />
criteria not only to vehicle deceleration but also to parameters<br />
located on the secondary axis. One possible interpretation<br />
is the influence of vehicle rotation on passenger movements,<br />
allowing for the direction of Iateral restraint of the<br />
passenger shoulder-belt relative to the axis of the vehicle-<br />
In addition to these main results, the following observations<br />
can be made;<br />
r Mean deceleration a calculated one total crush is<br />
slightly offset relative to main axis I. This deviation<br />
is due to the position of al , still further offset,<br />
al being linked to the vehicle's $tructural<br />
$trength, but also, through its correlation with<br />
thetz, to the type of barrier causing rotation and<br />
involving a variable share of the vehicle's front<br />
structure,<br />
r Vehicle longitudinal movement x is naturally correlated<br />
to crush. but also to transverse move-
ment y. This latter relation, in accordance with the<br />
kinematics of impact in the case of 30" and 0"<br />
angled barriers, is more difficult to interpret for<br />
car-to-car impacts and impacts against offset<br />
half-barriers.<br />
r Passenger compartment integrity, pdw and pdf, is<br />
located on an axis at 45o relative to the crush. The<br />
intrusion/crash relation is natural. With respect to<br />
the intrusion component on axis No. 2, this is<br />
linked to the vehicle's architecture via the<br />
relation:<br />
<strong>Int</strong>rusion = Crush-Engine compartment clearance.<br />
To summarize, the correlation circle shows the following<br />
main directions:<br />
r Vehicle deceleration and deformation. driver<br />
lnJury cntena.<br />
Vehicle weight and rotation (figure 7).<br />
Figure 7. Directions ol the physical charactsrlstlcs of lmpact<br />
ln the maln plane 1-2.<br />
Qualitative factor; Type of impact<br />
conliguration<br />
The 6 impact configuration (qualitative factor) were superimposed<br />
on thequantitative factors in the main plane l-2.<br />
Representation of a qudlitative factor by its modalities<br />
(figure 8)<br />
Each modality (specific impact configuration) of a factor<br />
is characterized by its position relative to all the quantitative<br />
factors. By projecting it on the l-2 plane, its relation with<br />
the various quantitative factors located in that plane can be<br />
characterized.<br />
The diagram in Figure 9 is interpreted as follows:<br />
The Centre O corresponds to the mean of all tests for each<br />
quantitative and qualitative factor.<br />
A Point P which is the image of a quantitative factor<br />
(physical characteristics of the structure or test dummy) is<br />
located at a distance close to unity from the centre O, or,<br />
again, at a standard deviation of O in non-reduced form, the<br />
standard deviation being calculated on all values of the<br />
factor.<br />
Figure 8. $upcrposillon of qualitatiye factor$ on quantltatlye<br />
laclors In thd maln plane l-2.<br />
;ET =oar. 6F- 6'<br />
oFFS<br />
dP<br />
pdt<br />
FT-: *m ntn d fr.rdl hlffBln<br />
-<br />
h off$r trd.ilahntirt.<br />
ldl rffid{dtlhr{lilE$i<br />
h ll hil rdiirdlir,<br />
6t : rlniard drrblhfr aa tfufl<br />
htlrJa.r,<br />
. +*t*<br />
Flgure 9. Characterl?atlon of an lmpact conflguratlon accord-<br />
Ing to s qusntltatlve fsctor.<br />
The Characteristir:.r Point H of the mean of an impact<br />
configuration according to a quantitative factor (physical<br />
characteristics ofthe impact) can be obtained by projecting<br />
point M, which is the image of the mean of impact configuration<br />
results on the straight line OP. The relation OH/OP<br />
indicates, in non-reduced form, as a number of standard<br />
deviations relative to the mean of the factor for all 39 impacts,<br />
how the vehicle behaves depending on the factor in<br />
question.<br />
N.B.; This is strictly true only if point P is in the l-2 plane<br />
and therefore located on the correlation circle.<br />
Example: For the firewall intrusion factor and the OFFS<br />
impact configuration (offset half-barrier), the characteristics<br />
point is located at approximately 1.5 standard deviations<br />
from the general mean of all firewall intrusions, indicating<br />
the severity of this type of impact with respect to<br />
passenger compafi ment integrity.<br />
Comparison of impact conftguration<br />
The distribution of impact configurations in figure 8 calls<br />
for the following initial comments:<br />
r The impact against a 0' angled barrier appears<br />
greatly offset relative to the other impact configurations.<br />
It is characterized by high levels of deceleration<br />
in the initial and final phases of the<br />
251
impact, and by slight crushes and intrusions in the<br />
passenger companment.<br />
This configuration is located more than 5 standard deviations<br />
away from the general mean. As such, it is completely<br />
different from all the other configurations and is characterized<br />
by high driver and passenger injury criteria.<br />
r The images of the other impact configurations' 30<br />
AB, 30 SW 30 NS, OFFS and C/C, show similarity<br />
between the OFFS and C/C configurations<br />
on the one hand, and between 30 AB and 30 SW<br />
on the other hand. The 30 NS impact is located<br />
between these two pairs of impact configurations,<br />
but slightty offset along the axis of acceleration.<br />
. The configuration pair 30 AB and 30 SW is characterized<br />
in relation to the otherconfigurations by<br />
slight accelerations at the start of impact, strong<br />
rotation and relatively slight passenger compartment<br />
intrusions. The thorax criteria at 30 AB and<br />
30 SW are similar to those for the other configurations,<br />
except for OAB which is more severe'<br />
r The impact configuration pair OFFS and C/C is<br />
characterized in relation to the other configurations,<br />
except for OAB, by a higher mean acceleration<br />
at the start of impact, high crush levels and<br />
especially strong intrusions. The thorax criteria in<br />
OFFS and C/C are similar to the other configurations<br />
except for OAB, which is more severe.<br />
r <strong>Conf</strong>iguration 30 NS is distinguished from the 30<br />
AB, 30 SW OFFS and C/C configurations by<br />
slightly greater vehicle deceleration, especially at<br />
the end of impact, and by passenger compartment<br />
intrusions which are intermediate between 30 AB<br />
and 30 SW on the one hand, and between OFFS<br />
and C/C on the other hand'<br />
In this 3ONS configuration, the thorax criteria are similar<br />
to the other configurations except for OAB.<br />
Head/steering wheel impact<br />
Head/steering wheel impacts are a qualitative factor, as is<br />
the "impact configuration: factor. These two factors are<br />
dealt with in the same way in the l*2 plane.<br />
For the 39 tests, 32 head/steering wheel impacts are<br />
recorded.<br />
The "balance of head/steering wheel impact" image is<br />
located in the vicinity of the 30 AB impact (5 cases out of 7<br />
without head/steering wheel impact). The "head/steering<br />
wheel impact" image is offset towards the C/C configurations<br />
(8 head/steering wheel impacts for l0 impacts) and<br />
especially 30 SW 30 NS, OFFS and OAB (100d/o of<br />
head/steering wheel impacts).<br />
The location of head/steering wheel impacts in collisions<br />
"with<br />
head impact" differs depending on the type of impact:<br />
in a longitudinal vertical plane passing through the<br />
centre of the steering wheel in OAB impacts, or against the<br />
steering wheel spokes and rim in 30 SW 30 NS, OFFS and<br />
C/C impacts.<br />
258<br />
Frontal Impact in Real Road Conditions<br />
The six impact configurations of which the characteristics<br />
have been analyzed with respect to structure and injury<br />
criteria should be compared with real road conditions' The<br />
above data is based on the accidentological survey performed<br />
by the PSA-Renault Association (APR).<br />
Type of barrier (tahle 3).<br />
Accidentological data show that of the fatalities in car<br />
frontal impacts, 38Vo are due to impacts against the rigid<br />
fixed barriers, while 36Vo arc due to cat-to*car collisions.<br />
This breakdown is different for the population of severe<br />
injuries: 24o/o against fixed barriers and 597o car-to-car.<br />
Table 3. Frontsl impact: PsA-Fensult statistics concernlng<br />
pas$Gnger<br />
car occuPant8.<br />
f,itllcd<br />
gavirult lnjuEd<br />
F|rod<br />
obitacL<br />
3716<br />
24p<br />
Obrt aL<br />
Prrrirntar<br />
CE<br />
36,5<br />
69r5<br />
IrucL<br />
?5rg<br />
re,3<br />
Front structure deformation (Jigure I0).<br />
In severe frontal collisions, the APR accidentological<br />
survey shows that:<br />
ffs f!!1<br />
FT--]<br />
I r I l r l I<br />
r t<br />
t t t l<br />
--1-/+<br />
22V.<br />
,*rtt**tt";<br />
t | | t<br />
t t t t<br />
*;<br />
AV>10 krn/h<br />
*=<br />
t'"t"n--.,,,<br />
100<br />
100<br />
t<br />
l<br />
t<br />
l<br />
t<br />
t<br />
l<br />
l<br />
*;<br />
Flgure 10. Car clagsiflcatlon according to lront struclure de'<br />
foimatlon. PSA-Henault statistlcs concerning Passenger<br />
cars,<br />
r The 507o offset and 70Vo offset configurations<br />
represent 47Vo of accidented vehicles at velocity<br />
changes greater than 40 km/h;<br />
r There are more accidents involving at least 707o<br />
vehicle offset(28Vo) than accidents involving less<br />
IhaI 5lo/o offset (?ZVo):<br />
r Deformation of the vehicle front face is oblique,<br />
ranging between 15" and 40o in46Vo ofcases, and<br />
non-oblique (
Velocity change<br />
The breakdown ofsevere injuries and fatalities according<br />
to velocity change is as follows (APR survey):<br />
Delta-V<br />
50 km/h > 50Vo of severe injuries<br />
54 km/h > SOVI of severe injuries + fatalities<br />
65 km/h > 50Vo of fatalities<br />
Mean Deceleration<br />
44Vo of fatalities and 487o of severe injuries correspond to<br />
impacts at a mean deceleration ranging between 9 and l29:<br />
r Median of severe injuries: l0 g at a delta-V of 50<br />
km/h<br />
r Medianoffatalities: l3 gatadelta-Vof65kmih.<br />
Trajectory of car occupants<br />
The direction of movement of the occupant relative to the<br />
axis of the vehicle provides an indication concerning the<br />
direction of the forces exerted on the structure.<br />
In over 'lOVo<br />
of cases, the occupants trajectories are located<br />
at ll5' relative to the axis of the vehicle (table 4).<br />
Table 4. Dlrectlon ol vehlcle occupant tralectory rslatlve to vehlcle<br />
arls ln trontsl colllelons.<br />
Drlvar<br />
PeD8.r<br />
Illbd<br />
gtvrFlr inJuEd<br />
f,llhd<br />
Erv.Ely hJurrd<br />
-{E' te -16<br />
ll Eourr<br />
33t<br />
21r<br />
l4t<br />
20x<br />
H eadl steering wheel impacts<br />
-l!' tc +lt'<br />
l2 gouil<br />
7rr<br />
72x<br />
77x<br />
741<br />
+16' to +{6<br />
I Hour<br />
The frequency of head/steering wheel impacts in frontal<br />
collisions is an additional item of information helping to<br />
specify the direction of the occupant's trajectory"<br />
For a collision of violence ranging between 40 and 60 km/<br />
h velocity change, the frequency of head/steering wheel<br />
impacts is 507o.<br />
Reference impact: discussion<br />
The selection ofa single reference configuration for frontal<br />
impact with dummies is an important factor with a view<br />
on the planned test standards. The barrier and the impact<br />
velocity must be defined.<br />
In the present study, the collision between a deformable<br />
moving barrier of given mass has intentionally not been<br />
taken into account. This configuration would result in<br />
excessive scatter of the speed variation between vehicles<br />
tested, depending on their weight. Collisions between heavy<br />
vehicles and a fixed barrier at high velocity change would<br />
not be represented in this type ofcollision, due to the excessively<br />
small velocity change in relation to a much lighter<br />
moving barrier.<br />
0r<br />
7l<br />
9t<br />
6r<br />
The C/C configuration will not be adopted, since it has<br />
the disadvantage of consuming two vehicles, which is economically<br />
prohibitive at the prototype te$t stage.<br />
The comparison of experimental results for the 30 AB, 30<br />
SW 30 NS, OFFS and OAB configurations with accidentological<br />
data shows that an impact against a 0'angled plane<br />
barrier (OAB) is not representative of real road conditions,<br />
for the following reasons (2):<br />
r Excessive mean vehicle deceleration at a given<br />
velocity change;<br />
r Unrepresentativeness of vehicle front structure<br />
deformations;<br />
r Low intrusion at a given velocity change;<br />
r Direction of forces on the vehicle oriented at 0o<br />
with a head/steering wheel impact frequency of<br />
1007o, which contradicts real road conditions<br />
where a frequency of 50Vo is observed.<br />
The other impact configurations (30 AB, 30 SW 30 NS<br />
and OFFS) are closer to real accidentological conditions.<br />
The experimental study shows that the 30 AB and 30 SW<br />
configurations are relatively similar to one another in terms<br />
of structure and dummy injury criteria. The 30 AB configuration<br />
seems better from the viewpoint of test implementation,<br />
the distance from the lateral barrier being hard to check<br />
very precisely in the 30 SW configuration.<br />
From a comparison of the 3 configurations 30 AB, 30 NS<br />
and OFFS with real accidentological conditions, it can be<br />
concluded that they have good representativeness in terms<br />
of front structural deformation, intrusion, and mean<br />
deceleration.<br />
Each of these configurations gives priority to one of the<br />
factors characterizing the impact.<br />
The OFFS impact configuration accentuates intrusion,<br />
front structural deformation being closer to a 507o offset<br />
than a 70Vo offset. <strong>Conf</strong>igurations 30 AB and 30 NS are<br />
closer to the structural deformations most commonly represented<br />
in real accidents. The mean direction of forces exerted<br />
on the structure in real accidents and resulting in a 50Vo<br />
frequency of head/steering wheel impacts is probably intermediate<br />
between the direction of forces exerted on vehicles<br />
in 30 AB and 30 NS impacts (head/steering wheel impacts:<br />
l\Vo and 1007o respectively). The deviations between the<br />
results achieved on thorax in the three configurations are<br />
within ll0Vo (3O NS) > OFFS > 30 AB).<br />
At the end of this study, it seems that the configuration<br />
most repre$entative of real road conditions is impact against<br />
a 30' angled barrier, the coefficient of friction at the interface<br />
between the barrier and the vehicle front face remaining<br />
to be specified.<br />
The speed of collision is an important item of information,<br />
defining the desired protection level.<br />
An impact speed of 56 km/h against a 30" angled barrier<br />
would cover over 507o of severe injuries and fatalities.<br />
259
The experimental study showed the difficulty of control-<br />
ling the frequency of head/steering wheel impacts. In the<br />
case of a head/steering wheel impact, only one point of the<br />
steering wheel is concerned, and this is inadequate to verify<br />
the steering wheel's qualities. This is why it seems advisable<br />
to supplement the impact with dummies by an additional<br />
test on the entire steering wheel, of the "component test"<br />
type, which remains to be defined.<br />
Reference impact and compatihility<br />
Numerous studies have emphasized the importance of<br />
inter-vehicle compatibility in frontal and side impacts. The<br />
notions of compatibility of weight, stiffness and architecture<br />
in frontal and side impacts have been illustrated (3), (4),<br />
(5).<br />
The choice of a single reference frontal impact, while it<br />
may represent a progress, could not solve the complex problems<br />
posed by stiffness and architecture compatibility, especially<br />
in side impacts. Further to the proposals made at the<br />
I lth <strong>ESV</strong> <strong>Conf</strong>erence (5), thorough studies should be continued<br />
along these lines.<br />
Conclusion<br />
Thirty-nine experimental frontal collisions were<br />
performed against various barriers to define a reference<br />
configuration established on the basis of a comparison with<br />
accidentological data.<br />
An analysis of the data by means of a specific software<br />
was performed for all the test data.<br />
This analysis showed a reference plane incorporating<br />
53Vo of inertias and allowing a study of the correlations<br />
between vehicle and dummy parameters'<br />
This study shows that one impact configuration, the<br />
orthogonal barrier, is very strongly offset relative to<br />
collisions against an angled barrier, offset half-barrier and<br />
car-to-car impacts, and also relative to real accidentological<br />
conditions.<br />
The collision against a 30" angled banier $eems most<br />
representative of real accidentological conditions, with the<br />
coefficient of friction between the banier and the vehicle<br />
front face remaining to be specified.<br />
A speed of 56 km/h could cover over SOVo of severe<br />
injuries and fatalities in frontal impacts.<br />
It seems advisable to supplement the global impact tests<br />
with dummies by an additional test on the entire steering<br />
wheel, of the "component test" type, which remains to be<br />
defined.<br />
The choice of a single reference configuration in frontal<br />
impact, while it represents a progressr could not by itself<br />
solve the complex problems posed by inter-vehicle<br />
architecture and stiffness compatibility, especially in side<br />
impacts. More detailed studies should be continued along<br />
these lines.<br />
260<br />
Main component analysis-all factors are quantitative<br />
and continuous:<br />
Xtj = t"tt result i for factor j<br />
All factors are centred and reduced:<br />
*ii=@ oxj<br />
Computation of main axis of inertia defining the l-2<br />
plane. The summation of the euclidean distances between<br />
all couples of tests is maximized:<br />
fector<br />
(xij-ri';1 "<br />
Analysis of the image of the factors in the l-2 plane:<br />
r Factors close to the correlation circle are in the l*<br />
2 plane<br />
r Factors inside the circle ofradius 0.7 are not in the<br />
plane and are not taken into account for the<br />
analysis<br />
r The correlation between two points is:<br />
Conelation (Xj,Xj') = Cos(oxj,oxj').llxj1l.I IXj'I I<br />
xj"<br />
jr19<br />
drr { j-r<br />
corr(IJTXJ')=1<br />
cott(XJ'NJ")=0<br />
Annu I
References<br />
(l) SPAD.N,<br />
"SystBme<br />
Portable pour I'Analyse des<br />
Donndes", L. Lebart, A. Morineau, T. Lambert-CISIA.<br />
(2) J. Provensal, "Five<br />
Years of New Car Assessment<br />
Program: Balance and Current Conclusions", lOth <strong>ESV</strong><br />
<strong>Conf</strong>erence, Oxford, July 1985.<br />
(3) P. Ventre, "Homogeneous Safety Amid<br />
Experimental Investigation of Rear Seat Submarining<br />
Thomas F. Maclaughlin, Lisa K. Sullivan<br />
National Highway Traffic Safety Administration<br />
Christopher S. O'Connor,<br />
Transportation Research Center of Ohior<br />
Abstract<br />
An experimental investigation was conducted to<br />
determine the effects of certain seating and restraint<br />
parameter$ on the tendency for an adult rear $eat passenger<br />
to submarine<br />
(i.e., for the lap belt to ride over the pelvic iliac<br />
crest$ and penetrate the abdomen) in a 30 mph delta-v<br />
frontal collision. Fourparameters were investigated:<br />
type of<br />
restraint (lap belt only or three-point belt), seat cushion<br />
stiffness, seat cushion height, and lap belt angle (within the<br />
range from 20 to 75 degrees, as specified in FMVSS 210,<br />
"Seat Belt Assembly Anchorages"). The experiments were<br />
done on the HYGE sled, using a Hybrid III dummy with a<br />
"submarining pelvis" which contains three load cells<br />
mounted on each iliac crest to indicate lap belt location. The<br />
test matrix was a fractional factorial design, which enabled<br />
determination of the statistical significance of the<br />
parameters on submarining tendency and other occupant<br />
responses. Lap belt angle was found to be a highly<br />
significant parameter-the shallower the angle, the greater<br />
the submarining tendency. The tendency to submarine also<br />
appeared to be greater for three-point belted occupants than<br />
for lap-only belted occupants, although lap belt forces were<br />
much less for three-point belts. Results indicated that only<br />
one injury (AIS l) would have occurred out of six cases of<br />
submarining in three-point belts.<br />
<strong>Int</strong>roduction<br />
United States FMVSS No. 210, "Seat Belt Assembly<br />
Anchorages", requires that the lap belt angle from the<br />
Seating Reference Point (SRP) to the anchorage fall within<br />
the range from 20o to 75o relative to the horizontal.<br />
Although front seat lap belt angles are typically close to 75o,<br />
rear seat installations in a number of cars, particularly small<br />
cars, have lap belt angles near 20". Accident data indicate<br />
Heterogeneous Car Population", 3rd <strong>ESV</strong> <strong>Conf</strong>erence,<br />
Washington, May 1972.<br />
(4) P. Ventre, "Proposal for Test Evaluation of<br />
Compatibility Between Very Different Passenger Cars",<br />
4th <strong>ESV</strong> <strong>Conf</strong>erence, Kyoto, March 1973.<br />
(5) G. Stcherbatcheff, "Compatibility<br />
in Side<br />
Collisions", I I th <strong>ESV</strong> <strong>Conf</strong>erence, Washington, May 1987.<br />
that, with the lap belt angle at or near 20o, there may be a<br />
possibility that rear seat occupants will slide under the lap<br />
belt (submarine), exposing themselve$ to abdominal<br />
injuries. Other parameters, such as seat cushion stiffness,<br />
the presence of a shoulder belt, etc., also may influence<br />
submarining tendency and other occupant re$ponses.<br />
We conducted a sled te$t program to determine (l) what<br />
parameters are significant in causing rear seat occupant<br />
submarining and (2) the effects of the more significant<br />
parameters on the occurrence of submarining and on other<br />
dummy responses. Prior to testing, we reviewed current<br />
literature to identify parameters which are believed to<br />
contribute to occupant submarining, and which are<br />
reproducible and repeatable<br />
in a controlled test situation. A<br />
listing (not necessarily all-inclusive) of parameters which<br />
appear to affect the tendency of the occupant to submarine is<br />
contained in table l. Based on this review, the following<br />
factors were chosen for investigation: (l) type of restraint,<br />
(2) seat cushion stiffness, (3) seat cushion height, and (4) lap<br />
belt angle. These four factors were incorporated into a<br />
generic HYCE sled buck, allowing forthe simulation of the<br />
rear occupant compartment of any vehicle. A series of 22<br />
HYCE sled tests was then performed. For more details than<br />
are contained in this paper, the reader should see the project<br />
final report (l).*<br />
Table 1. Psrametsr8<br />
lhat Itfect $ubmarlnlng<br />
A. Belt Parameters:<br />
l. Lap Only versus Lap/Shoulder Restraint<br />
2. Lap Belt Angle in Side View<br />
3. Lap Belt Angle in Top View<br />
4. Retractor Force<br />
5. Slack in the Lap Belt<br />
6. Slack in the Shoulder Harness<br />
7. Hysteresis in the Shoulder Hamess Webbing<br />
8. Location of the Buckle<br />
9. Latch Plate Design<br />
10. Shoulder Belt Anchor Location<br />
I l. Lap and Shoulder Belt Lengths<br />
rCunently with the Ford Motor Company *Numhcrs in parentheses designate refercnces trt end of papcr
B. Seat Parameters:<br />
L Angle of the Seat Cushion<br />
2. Stiffness of the Seat Cushion<br />
3. Friction Coefficient between Occupant and Cushion<br />
4. Angle of the Seat Back<br />
5. Seat Height<br />
C. Constraint Forces:<br />
I. Restraint on Knees by Front Seat Back<br />
2. Toe Board Restraint<br />
D. Irrput Forces and Accelerations:<br />
l. Time History of the Deceleration<br />
2. Deceleration Maenitude<br />
E. Occupant Parameters:<br />
1. Amount of Clothing on the Occupant<br />
2. Friction Coefficient between Occupant and Belt<br />
3. Initial Position of the Occupant<br />
4. Size of the Occupant<br />
5. "Relative Bigness" of the Occupant (Weight<br />
divided by Height cubed)<br />
6. Slope and Stiffness of the Abdomen<br />
7. Locations of the Centers of Mass of the Body<br />
8. Orientation of the Sartorius<br />
9. Joint Stiffnesses and Damping Coefficients<br />
10. Contraction of the Quadriceps Muscle<br />
Test matrix design<br />
The sled test matrix was designed to provide the most<br />
information possible about the $tatistical significance of the<br />
four factors in causing rear seat occupant submarining. The<br />
four factors and their levels were;<br />
Table 1. Parameler8 thst sffect $ubmarlnlng<br />
Factor l4wl<br />
tlrpr or restrrrn.<br />
}|:"llllrllt{.r,<br />
dedt cu'hlqn Etlffnes'<br />
ilfl I quntrftsd rn trs.ar<br />
ss,r hcishr ** I<br />
hfEh J<br />
S::l*tl:lf::"::.<br />
"serc Hclght D€cetuIn€tlonn<br />
lep b6lt af,ald 20'<br />
(off horlrof,tal) 34"<br />
:i:<br />
Three of the factors were tested at two levels; the fourfh<br />
factor, lap belt angle, had five levels. The matrix is shown in<br />
figure l, where conducted tests are designated by '*X's".<br />
One repeat test was conducted to provide a basis forestimating<br />
experimental error, which was desirable to statistically<br />
analyze results.<br />
This matrix is called a "half-factorial" or "half*replicate"<br />
because it calls for testing under only half the conditions<br />
present. The main features of factorial experimental<br />
designs are that (l) they allow the effects of independent<br />
variables on the dependent variable to be determined quan-<br />
262<br />
Flgure 1. Sled test mslrix,<br />
titatively (statistically) and (2) they allow determination of<br />
interaction effects among independent variables. (For example,<br />
knowing the "first order", or "two-way", interaction<br />
effect between lap belt angle and seat cushion stiffness<br />
provides an answer to the question: Is the effect oflap belt<br />
angle on submarining different for soft seat cushions than<br />
for stiff?). In half-factorial designs, such as ours, some of<br />
the main effects and two-way interactions are confounded<br />
with higher-order interactions. It is assumed, because it is<br />
usually true, that any effect seen is due to the lower-order<br />
interaction; i.e., that higher-order interactions are negligible<br />
compared with main and two-way interaction effects.<br />
Our primary interest was in the factor Belt Angle. Thus,<br />
we designed the sled test matrix to obtain statistical information<br />
about the four main effects and the two-way interactions<br />
involving the main effect Belt Angle (Belt Angle/Belt<br />
Tlpe, Belt Angle/Seat Height and Belt Angle/Cushion Stiffness).<br />
Information about all other interactions was not discernable<br />
due to the confounding present.<br />
For the statistical analyses (presented later in the paper),<br />
the null hypothesis was that the four main effects do not<br />
have an effect on the causation of occupant submarining or<br />
other responses of interest. The level of significance for<br />
rejecting that hypothesis was chosen tobe SVo (57o is generally<br />
used in analyses of this type). Thus, if the "p-value"<br />
from the analysis was 57o or less, the risk of rejecting the<br />
null hypothesis when it was in fact true is minimal and we<br />
are confident in saying that the factor in question does have<br />
an effect on submarining. In addition, we felt that levels of<br />
significance in the 57o to approximately lSEo range indicated<br />
"marginal" significance (i.e., we were unwilling to<br />
accept unconditionally the hypothesis that no effect existed,<br />
if the analysis indicated an 85Vo chance of an effect being<br />
present).<br />
HYGE sled buck<br />
We determined the values of several parameters in current<br />
vehicles Io enable fabrication of a "generic" HYGE<br />
sled test buck. Nine parameters were selected which described<br />
the geometry of the rear passenger compartment<br />
(see figure 2). On the basis of 1986 sales figures and vehicle<br />
availahility, we selected ten domestic and imported automobiles<br />
in different weight categories to determine average
L-AO<br />
L-3<br />
L-41<br />
L-48<br />
L-50<br />
L-5r<br />
H-31<br />
h<br />
d<br />
- -<br />
Flont Scrt BacL AnIl.<br />
Front of R.rr 3.rt t|ck to BeL of Front SorE Bmlr<br />
RGrtr s.at Brck AnEh<br />
E.rE occr+.nt Kilaa PlEt to Front S6at lrcl<br />
Frotrr Occr4tst H-Pt. to Lrr OGduSst H-Ft,<br />
f,e$ Oscr+mt H-Pt. to Hr.l pt. Dl|te.<br />
Rcar 0ccrry6t H-Ft. to H,6iI pt. Vtrtlc.I |tlrtea<br />
v.rtlcrl Dl|t.rr ftfi 16rr Occr.prntrr H-Pt. to fop of Ftmt<br />
3.rt tack<br />
tlrpth of Lrr 8.rt cMhton fril Front Edt. of cuhlon to<br />
occupantrr H-Pt.<br />
Flguro 2. Paaeenger reat compartm€nt g€ometry parameters.<br />
values for the nine parameters.<br />
The vehicles were as<br />
follows;<br />
Weight<br />
category<br />
I<br />
I<br />
2<br />
2<br />
2<br />
3<br />
4<br />
4<br />
5<br />
5<br />
vehicle<br />
1985 Ford Escort<br />
I984 Honda Accord<br />
1985 Pontiac Grand Am<br />
1985 Pontiac Sunbird<br />
1983 Toyota Camry<br />
1985 Chrysler New Yorker<br />
1985 Olds Ciera<br />
1986 Ford Taurus<br />
1983 Volvo GL<br />
1986 Buick Electra<br />
The average values for the<br />
below;<br />
Specification<br />
L40<br />
r_3<br />
L4l<br />
L48<br />
L-50<br />
L-51<br />
H-31<br />
h<br />
d<br />
1986<br />
sales po.sition:<br />
#6 domestic<br />
#3 imported<br />
#4 domestic<br />
#3 domestic<br />
#l import€d<br />
#9 domestic<br />
#l domestic<br />
#5 domestic<br />
#8 imponed<br />
#l I domestic<br />
nine parameters<br />
are listed<br />
average:<br />
25.5"<br />
26.76"<br />
25.5"<br />
2.23"<br />
3l.g l"<br />
35.94'<br />
t0.67"<br />
r7.97"<br />
15.69"<br />
The seat belt hardware consisted of the standard, automatic-locking<br />
type retractor generally used in the rear outboard<br />
seating positions. The original manufacturer's webbing<br />
was removed and replaced with a 5-bar webbing from<br />
one roll to minimize webbing differences. The same type of<br />
retractor was used for both the lap only and the three-point<br />
belts. The "D" ring chosen for the three-point belts was the<br />
locking type----over one half of the vehicles randomly surveyed<br />
had this type of "D" ring. Belt $ystems were replaced<br />
after each te$t to ensure integrity of each system. Load cells<br />
were used to record the inboard and outboard lap belt loads<br />
and the shoulder belt load, where applicable.<br />
The Escort front bucket seat was chosen to represent the<br />
average front $eat in overall height and seat back angle.<br />
Although not measured, its seat back stiffness appeared to<br />
be typical of most car seats; there was very little structure to<br />
resist rear occupant knee penetration. The Escort seat was<br />
replaced after each test to ensure an undamaged surface for<br />
the occupant to contact. The HYGE sled buck, in a pretest<br />
set-up, is shown in figure 3.<br />
Flgure 3. HYGE sled t€st sst-up.<br />
Seat cushion stiffness determination<br />
The stiffness values for the seat cushions were determined<br />
to identify the "softest" and "hardest" seats from<br />
the l0 vehicles selected above. Each rear seat cushion was<br />
tested in two places: (l) at the centerofthe occupant seated<br />
position and (2) on the forward edge of the cushion. Figure 4<br />
shows the forward position te$t set-up. The apparatus consisted<br />
of a hand-pumped hydraulic jack with a load cell and<br />
string potentiometer ailached. The load was applied at a rate<br />
of approximately l" per minute through a universal swivel<br />
joint to an 8" diameter plate. Force applied to the plate and<br />
Flgure 4. Cughlon force-deflectlon teet ssl-up (lorward<br />
poaltlon).
vertical displacement of the plate into the cushion were<br />
measured.<br />
Force versus deflection curyes for all l0 vehicles are<br />
shown in figures 5 and 6. The Toyota Camry cushion was<br />
one of the stiffest, and the Buick Electra cushion was one of<br />
the softest; therefore, these two were selected for use in the<br />
sled test matrix.<br />
j<br />
3<br />
o<br />
0<br />
o<br />
L<br />
FIgure 5. Sest stlffneea at center (in loadlng).<br />
0<br />
o<br />
L<br />
g,o 0,5 1.0 1.5 e.0 e. s 3.0 3. s<br />
0isplacemenL<br />
0isplacement<br />
tin)<br />
Flgure 6. Seat Btlffness at front (ln loadlng).<br />
Seat height determination<br />
q.0<br />
The vehicle rear seat height was measured as the vertical<br />
distance from the Seating Reference Point (SRP) to the<br />
occupant's resting heel position ("H*31" in figure 2). We<br />
obtained these values for a total of 3l vehicles (the l0<br />
vehicles selected above plus a random sample of 2l vehicles).<br />
They were non-uniformly distributed; only 6.574 of<br />
the sample were in the 5.5"-9.5" range and 93'5o/o were in<br />
the 9.5"-13.5". The median range values for these two<br />
groups were 7.5" and I1.5", respectively. The final height<br />
values chosen were 8'/ and 12".<br />
Crash pulse simulation<br />
The sled tests were conducted at a test velocity of 30 mph<br />
using a half-sine pulse. The pulse duration was approximately<br />
100 msec, resulting in peak sled accelerations of<br />
approximately 22 G's. This crash simulation pulse was<br />
based on similar pulses used for other occupant submarining<br />
studies performed by Adomeit (2, 3) and DeJeammes<br />
(4).<br />
264<br />
g,g 0. s t.s r,5 ?.s<br />
0isPlacement<br />
Vol vo rrt<br />
----+l- ci*. nt<br />
**El*trr nrt<br />
+cF! taat<br />
+G.H Ar mrt<br />
#Eccrt ceat<br />
+tr6ird mrt<br />
+tku YFkF *.t<br />
-----*-Fccrd |0r<br />
-- Tuua taai<br />
Hybrid III<br />
The anthropomorphic test device used for the sled series<br />
was the Hybrid III 50th percentile male dummy' A simple<br />
procedure was developed for seating the dummy such that<br />
its seated portture in the rear seat would appear more natural<br />
than was obtained by using the standard FMVSS 208 seating<br />
procedure, developed primarily for front seating. First, a<br />
male human subject (approximately 50th percentile) was<br />
instructed to sit in a "normal and comfortable" position in a<br />
typical automobile rear seat. The dummy was then placed<br />
next to the subject, and its posture adjusted to simulate that<br />
of the human. This was repeated with three other human<br />
subjects. The procedure which resulted was to seat the dummy<br />
initially according to FMVSS ?08, then move the pelvis<br />
forward enough to allow a space of about 2 inches between<br />
the rear seat back and the buttocks of the dummy.<br />
Instrumentation for the Hybrid III consisted of:<br />
r Triaxial accelerometer packages in the head, thorax<br />
and pelvis.<br />
r Femur load cells and knee shear transducers in the<br />
legs.<br />
r The "submarining" pelvis, consisting of three<br />
load bolts distributed along the anterior surfaces<br />
of the right and left ilium.<br />
. Denton six-axis upper neck load cell.<br />
r Abdominal air bladder insert.<br />
Filtering of the data consisted of SAE Class 1000 for the<br />
head accelerometer data, SAE Class 600 for neck forces and<br />
moment$, pelvic load bolts and femur loads and SAE Class<br />
180 for thorax and pelvic accelerometer data and knee<br />
shears. The abdominal bladder insert data and all of the seat<br />
belt loads were filtered using a SAE Class 60 filter-<br />
Prior to this project, an air pressure abdominal bladder<br />
insert for the Hybrid III dummy (5) was developed for<br />
measuring the depth and rate of steering wheel penetration<br />
into the abdominal region. We used the bladder insert during<br />
this project in an attempt to (l) determine if and when<br />
submarining occurred, and (2) mea$ure the amount of abdominal<br />
penetration caused by the belt when submarining<br />
occurs, hoping to determine the severity of the submarining'<br />
We found that, in its present form, the insert did not clearly<br />
indicate occurrence of submarining or penetration resulting<br />
from submarining, and would need more development work<br />
for this application. Therefore, it is not discussed further in<br />
this paper (see reference l).<br />
Sled test results<br />
A summary of the test conditions and whether or not<br />
submarining occurred are contained in table 2' Test #843<br />
wa$ to have been a three-point test. However, the retractor<br />
failed to lock during the test making the test 'tuspect for<br />
consideration in the matrix. Thus, the matrix contains 2l<br />
tests-2O of different conditions and I repeat test.<br />
Of these 2l tests, full submarining occurred in 9 tests,<br />
"one-sided"<br />
submarining in 2 tests and submarining did not<br />
occur in 10 tests. In general, we were able to detect very
Table 2. Sled tsst condlllona and results.<br />
I T6st I s.rr BGlr lEGrt t ltl S.rt I Bcrr l8ubr|rlnttgl f 16 of I<br />
tro.<br />
! !<br />
Typ6 | Antlr lo$hrmlH.rthtl occut r is'rtmrrnrngj<br />
!--:::'!-:-------:-!-::'.....1-------l------l----...----t-----------i<br />
| 843 | * hp Onlyl 20 It t. I sdft I ttr | y.r I s7 u6c i<br />
r------t---------'-t---------t----...t..----t-----------i-----,-----i<br />
| 844 l11tr.6-polntl 20 D.r. I Sofr I Itr | Fr | 42 u6c i<br />
r------t---"'------t---------t---"---t------t----------.t,--,-------l<br />
| 845 lltr66-potntl 75 D.r, I Eofr I In I y.r I 12 ucc i<br />
t------t-----------t---------t-------t------t-----------t----,-,-,--l<br />
l#8461 lapontylTsltrt.l sofrlHtshl ffi | l| i<br />
l'-:-:-l---'-'-----l---------l-------l-----'l-----------t-----------l<br />
I 853 | Irp only | 20 Drg. | ltoft I HtEh I y6r i 58 -.. i<br />
! -':::-l:'------:--<br />
! -::.-.---l ------- | ------ 1...-------- | ----------- i<br />
I E9l lThrao,potntl 20 Dit. I Hffrt I Hrth I yir j 43 .r.. i<br />
t------t-----------t---------t-------t------t--...---,--t-----------i<br />
| 89? llhr6a-polntl 75 D.E, I Hffd I HrCt I m i Xr i<br />
l--:::-!"-----:----!-::--'---l-------l------l------'----t-----------i<br />
lsgSllrponlylTsD.t, lHffdlInl m i nr i<br />
l'- :--l-----------1...------l-------l----.-l- i-----------i<br />
I f894 | lap only | 20 D6t. I thfd I Ifl | y$ | 4l u6c I<br />
I--:---l----------'l---------l---.---l'-----l-----------t- ---------l<br />
| 895 lThrrc-pottrrl47.5 ILg.l lterrt I Htth I t/2 yte i 75 raac i<br />
r------r-----------t---------t-------t,-----t---.-------t-----------l<br />
| 896 lThr66-potnrl47.5 Dr6.l Soft I In I yGr i 55 -.. i<br />
!--:::'!-"'---:-:--!::-:-.-'-l-------l------l-----'-----t-----------l<br />
| 897 | Irp only 147.5 Dct.l Hrrd I rtr | m I l{A i<br />
l--:::-l--------'.-l---------l-------l'-----l-----------l-----------l<br />
| 898 | tap odly 147.5 nrg.l soft I Hrth | rc i xr i<br />
l--::--l-----'-'---l---------l----'--l------l-----------l---,-------i<br />
| 899 lrtrer-poltrr|47.5 ltr8.l HrEd I Hrth | rc i Xe i<br />
l--:::-t-----------t---------t-------t,-,---t-----------t---<br />
_____,_l<br />
| 904 | Irp only | 34 Deg. I soft I Hlgh I nd i rrr i<br />
t--:__-t-----------t---------t-------t*--,--t-----------t---_ _ __--l<br />
| 905 | hp only | 14 Drg. I Hrrd I rav I t., i tz rcac i<br />
l-':::-l-----------l---------l-------l----'-l-----------t--- -----,-l<br />
| 906 llhrae-potntl 34 D6g. I Soft I Ifl | yrr i aZ uac i<br />
! --:::-<br />
!:------':-- l':--'---- | -'-'--- l------l----:------ t -----------<br />
porated three factors: ( I ) how high on the pelvis belt loading<br />
occurred, (2) whether submarining, when it did occur, was<br />
one-sided or two-sided and (3) the time of initial indication<br />
of submarining.<br />
The rating scheme consisted of six categories, which are<br />
listed below (although somewhat arbitrary, selection of the<br />
time intervals in categories 4-6 was based on the natural<br />
grouping that occurred in the experiments):<br />
L No submarining occurred; loads on pelvic lower<br />
load bolts only.<br />
2. No submarining occurred; loads on pelvic lower<br />
and middle load bolts ozly.<br />
3. One-sided submarining occurred.<br />
4. Full (two-sided) submarining occurred; initial<br />
submarining in 7(F-79 msec.<br />
5. Full (two-sided) submarining occuned; initial<br />
submarining in 50-59 msec.<br />
6. Full (two-sided) submarining occurred; initial<br />
submarining in 4G49 msec.<br />
In none of our tests did loading occur on the upper-most<br />
pelvic load cells without submarining occuning; nor did<br />
r<br />
| 907 lThrer-polnrl 34 Dag. I Herd I Htth I Lt/z ye, i SZ r*" submarining initiate in the time frame i<br />
of 6(F49 msec in any<br />
l-':---l-----'-----l---------l-.-----l------t----.------t-----------i<br />
| 9081 l,!ponlyl6lDrt,l Hrrdl rni of our tests.<br />
I lIA i<br />
!-':::'l-'----:'---l'::.-----l-------l------l-----------t-----------l Each of the 2l tests was rated according to the above<br />
| 9091 lrponlyl6lDrg.l BofrlHrEhl m i xe i<br />
l--::--l---'-'--'--l---------l-------l------t-'---------t----------<br />
i scheme. The categorization results of the tendency for occu-<br />
| 910 lrtrcr-polntl 6I D.B, I H.rd I HrEh I no I NA i pant submarining are shown in the matrix format in figure 7.<br />
t------t-----------t----,----t-------t------t-----------i-------_-_i<br />
| 911 lrhrGo-potntl 61 D6t. I Soft I Itr | yrr j sn mec i<br />
t------t----'------t---------t-------t------t-----------t____----_-l<br />
* - fI *rs to hav6 b6rn r thrG6-polfiti ritrrctor frlldd to lock.<br />
# - lap B6lt brok. ht6 ln dvrnr (eftrr 80 ucc).<br />
clearly the occurrence of submarining from the films, the<br />
lap belt force-time response$ and the force-time responses<br />
of the load-measuring bolts on the pelvis (three located on<br />
each side).<br />
In addition to noting whether submarining occurred or<br />
not, the following five elements were analyzed:<br />
Tendency for rear seat occupant submarining.<br />
Occupant head forward (X) velocity.<br />
Occupant Head Injury Criterion (HIC).<br />
Occupant peak chest acceleration.<br />
Peak chest deflection for three-point belted<br />
occupants.<br />
Tendency<br />
for rear seat occupant suhmarining<br />
In addition to noting simply whether or not submarining<br />
occurred under certain conditions, we devised a rating<br />
method to indicate the "tendency" for submarining to occur.<br />
By "tendency", we mefln (l) if submarining did not<br />
occur, how close it came to occurring and (2) if it did occur,<br />
whether it was on both sides, and how early it was in the<br />
crash event. As a measure of the near-occurTence<br />
of submarining,<br />
we determined the location of the lap belt on the<br />
pelvic iliac crests, as indicated by the pelvic load cell bolts.<br />
From our literature review, time of occurrence. and whether<br />
one- or two-sided, were seen to be important indicators of<br />
submarining tendency. The rating method, therefore, incor-<br />
"4"<br />
't4 \<br />
c..<br />
\q,. I<br />
t. \\n<br />
|<br />
'**"<br />
'' -"., .1" l" 1.,, l"; l;<br />
I- l:l: l '.l ' I ' l ' l ..<br />
r \ | 'l* | I | |<br />
rlF rrs rrfi I<br />
I I *" l*<br />
i,i f""H,i,['r*.,"'*<br />
''. r . r. r6.rnrt nrFrd; t* F Flvi.<br />
I tu.i# rlhrl^rN d.v.r*.<br />
;l;<br />
;i il*<br />
1,,,,,,,,,1,;,i;,,,,1,,,,,,,,,),,,,,,,,,1,,,,,,,,,t,,,,,,,,,i,,,,,,<br />
l r * r t l<br />
|-" |;",. lo' ,1; .1; ;l; ;l; ;<br />
| | I : | r l r l r l l<br />
i ' ilii iil'ir$i iE llril f#Ei nririi i#iilifr ; il'fi it iii ii*,<br />
Flgure 7. Tandency<br />
lor aubmarlnlng.<br />
The categorization results were analyzed statistically to<br />
determine which of the four main factors and two-way interactions<br />
were significant. Figure 8 presents the four main<br />
effects of the test matrix. Each bar represents the average<br />
response for all tests conducted at the particular level (e.g.,<br />
lap only) of the particular factor (e.g., Belt Type). Three of<br />
the factors have two levels each; one (Belt Angle) has five<br />
levels. If the difference between the average responses of<br />
different levels of a factor is "sufficiently large" compared<br />
with the response variances and the error estimate, then the<br />
statistical analysis will indicate that the main effect of that<br />
factor is "significant". Whether or not the main effect was<br />
265
found to be statistically significant is indicated beneath the<br />
effect, along with the p-value (as a percentage). Belt Angle,<br />
Belt Tlpe and Seat Height all had highly significant effects<br />
on the tendency to submarine. (Significance levels were less<br />
than l%). Cushion Stiffness had a marginal effect (l0.l1Vo<br />
significance level). No two-way interactions of main effects<br />
were significant (i.e., the effect a particular factor had on the<br />
submarining tendency was the same regardless of the level<br />
of other factors).<br />
o<br />
E r<br />
c<br />
E<br />
h<br />
t 8<br />
I<br />
c<br />
S e<br />
o<br />
F<br />
Figure 8. Tendency lor roar seat occuPant rubmarlnlng,<br />
The data indicating submarining tendency are presented<br />
in more detail in figures 9, 10, I I and 12. Each point in<br />
figures 9, l0 and I I represents an aYerage of two tests (or<br />
three, when the repeatability test result was included), chosen<br />
to illustrate particular main and interaction effects.<br />
In figure 9, lap-only and three-point belt results are plotted<br />
separately. It is clear that submarining tendency is differ-<br />
ent for the two restraint types (i.e., the Belt Tlpe main effect<br />
is significant). Also, lap belt angle strongly affects submarining<br />
tendency for both restraint types, indicating the absence<br />
of a Belt Angle/Belt Tlpe interaction effect.<br />
t<br />
llrr-PL lrlt<br />
+<br />
s<br />
..s<br />
t.<br />
a<br />
Er<br />
$,<br />
E<br />
14 o||U lS<br />
"'{r.*<br />
td UF $dirdr<br />
lErnd. *ilrffi<br />
L+ Edt figh<br />
r o.tfr<br />
- ofif<br />
Orgts)<br />
Flgure L Tendency lor submarlnlng versu$ lap belt angle for<br />
belt type.<br />
In figure 10, results are shown separately forthe low and<br />
high seat heights. Submarining tendency differs for the two<br />
$eat heights, but is strongly influenced by lap belt angle for<br />
both heights (similar to Belt Type results in figure 9).<br />
Figure I I suggests similar trends for the factor Cushion<br />
Stiffness. However, separation of the two curves is less<br />
266<br />
Erlt Typr<br />
Angli<br />
Y$ - 0.721 Yrr - o.olli<br />
Hrlght Curhlon<br />
Vif - O.E9!i Msrllhil -<br />
I 0.77*<br />
f.<br />
!r<br />
g'<br />
I<br />
+t.E<br />
Lt tdt rlrb (D.F.)<br />
T*Hlt*ftliln- [|S<br />
l* r.d. filEH r o,flf<br />
Flgure 10. Tendency for submarlnlng veraua lap belt angle for<br />
$eat helght.<br />
distinct, indicating marginal difference between the two<br />
cushion stiffnesses in the submarining tendency versus lap<br />
belt angle relationship (as was indicated in the statistical<br />
analysis).<br />
g<br />
f,.<br />
i,<br />
i:<br />
I{ {7't tl<br />
|.oF ldt Atg|r (Drgu)<br />
qC$n trtrt lltliil.r r<br />
Htht ftr||cilFr 00ll<br />
toB Cflilc|r<br />
+<br />
Hr{ Cfltit<br />
Flgure 11. Tendency for submarlnlng v€raus ldp bcll angle for<br />
cushlon Btlflnsss.<br />
Figure 12 contains the results for each individual test. An<br />
interesting observation, which puts some degree of uncertainty<br />
on trends discussed thus far, is that three of the curyes<br />
fall closely together, while the fourth is very different. One<br />
could conclude from this that the relationship between submarining<br />
tendency and lap belt angle is the same, regardless<br />
of type of restraint or seat cushion stiffness or seat height,<br />
except when the low seat is combined with the soft cushion.<br />
If this were true, it would indicate that the two-way interaction<br />
effect, Seat Height/Cushion Stiffness, is significant.<br />
This effect is confounded with the main effect of Belt Tlpe,<br />
and, as previously stated, when confounding occurs, we<br />
have assumed that the observed effect is due to the lower-order<br />
interaction (i.e., the higher-order interaction effect<br />
is negligible). It is possible that this assumption is incorrect;<br />
however, we feel that is highly unlikely, since both logic and<br />
past experience indicate that submarining is more likely to<br />
occur in a three-point belt than in a lap-only belt. The only<br />
way to know for sure, however, would be to conduct more<br />
tests in the matrix.
f:<br />
t<br />
R<br />
T,<br />
Lt Ertt AnCr (Dryr)<br />
flgg_re t!. Tendency for submarlning ysraus lap belt angle for<br />
bslt type/seat helghvcushlon rtlffness.<br />
There is another issue which raises some uncertainty; the<br />
effect of seat height on submarining tendency, as observed<br />
in the sled tests, may have questionable validity. The Hybrid<br />
III dummy has a fixed angle between the lower spine and the<br />
upper legs. Therefore, when fhe dummy is placed in the<br />
lowered seat, the pelvis rotates with the upper leg, exaggerating<br />
the pelvic angle and predisposing the dummy to<br />
submarining more than is likely for the human. (The reader<br />
should bear in mind that the feet are constrained against<br />
moving forward by the front seat).<br />
Occupant head forward (X) velocity<br />
The occupant's head forward velocity was derived by film<br />
analysis---digitizing the l" target at the head C.G. Iocation<br />
and obtaining both longitudinal and vertical displacements<br />
of the C.C. The longitudinal head trajectory was differentiated<br />
to obtain the corresponding velocity.<br />
Prior to testing, the occupant's head was located, on average,<br />
slightly over 20" behind the Escort front seat back.<br />
Therefore, 20" was considered the maximum distance the<br />
head could travel without impacting the front seat back.<br />
When the occupant was restrained by the three-poirrt belt,<br />
maximum head excursion was less than 20". When restrained<br />
by the lap belt only, his head travelled ar leasr 29".<br />
Thus, head impact was considered a possibility only for the<br />
lap-only belt system.<br />
!-#rr-t.st-dtl<br />
r..*hriB*<br />
I *E.l.li<br />
iu,FrHbldr<br />
Flgure 13. Head loward (X) veloclty (mph).<br />
In figure I 3, longitudinal head velocities are presenred in<br />
the matrix format. For the three-point belt, the velocities are<br />
maximum values, and range from l8 to 25 mph. For each lap<br />
belt only test, the longitudinal component of head velocity<br />
was determined at the point at which the head had travelled<br />
forward 20" lthe rearmost point at which head impact might<br />
occur). These are the values which appear in figure l3 for<br />
the lap belt only; they ranged from 26 ro over 33 mph, and,<br />
therefore, were considerably greater than maximum noncontact<br />
head velocities for the three-point belt restrained<br />
occupantrr,<br />
Flgure.l4- Fffect of lap brlt angle on head longltudlnal veloctty<br />
by restralnt.<br />
iliFifr'ffi*<br />
LS H firaL<br />
Y[ ' a,fll<br />
Flgure 15. Head Inlury crlt€rlon (HlC).<br />
ts lrli lflL<br />
h. at,ttt<br />
Since our main concem in analyzing head motion was<br />
to det€rmine potential contact velocities, we statistically<br />
analyzed head velocities separately for the lap-only and<br />
three-point belt restrained occupants. These results, shown<br />
in figure 14, indicate<br />
that Belt Angle has a small but significant<br />
affect on the head velocity of lap belt restrained occupants,<br />
at the point at which head impact may occur; but does<br />
not affect maximum head velocity of three-point belt<br />
restrained occupants. Also, this figure clearly shows that<br />
head velocities at 20" of excursion for the lap-only tests<br />
greatly exceed maximum head velocities for the three-point<br />
tests.<br />
267
Head injury criterion (HIC)<br />
The HIC was determined using the head C.C. resultant<br />
acceleration. Figure l5 contains the HIC values for the sled<br />
series.<br />
The statistical analysis indicated that none of the four<br />
main effects or interactions appear to have a strong effect on<br />
the occupant's HIC value, which is shown by the bar charts<br />
in figure 16. However, the difference between the average<br />
lap-only and the three-Point belt HIC's is substantial, and, at<br />
a 15.630/o level of significance, is considered marginally<br />
significant. HIC values, separated by Belt Tlpe and plotted<br />
against Belt Angle, are presented in figure I 7. These curves,<br />
and the individual HIC values shown in figure 15, show that<br />
HIC was far more erratic for occupants restrained by the lap<br />
belt only. Observations of the films indicated the reason;<br />
head contact occulTed in nine ofthe ten tests involving lap<br />
belt only, but did not occur in any of the eleven three-point<br />
belt tests. (Specifically, the head contacted either the front<br />
seat back or the dummy's knee in test 853, 893, 894, 897,<br />
898, 904, 905, 908 and 909.<br />
o<br />
;<br />
ta00<br />
| 600<br />
| 200<br />
e00<br />
Brlt TyFr Angh<br />
Mrrglnrl - l5.69tt il6 - 72.19%<br />
Hilght curhlon<br />
No - 35,51t N6. 65,43t<br />
Flgure 16. Head Infury crlt€lla for rear seal occuPants.<br />
s000<br />
20<br />
3n<br />
,.o rrn lt,t ,o.",".r<br />
Figure 17. Head injury criterlon (HlQ) lor rear seat occupsnts.<br />
Occupant peak chest acceleration<br />
The occupant'$ peak chest resultant accelerations are<br />
summarized in figure 18.<br />
The statistical results are shown in figure 19. Cushion<br />
was the only main effect which was shown to be significant<br />
in effecting the chest acceleration, with a p-value of 2-5To.<br />
268<br />
61<br />
The remaining main effects and interactions were nol<br />
sienificant.<br />
Brlt Typ. Anglr llrlght cu8hlon<br />
ilo-e0.13't ilo-34.70% Nd-60.74% Yrr-2.5o'{<br />
Flgure 19. Peak chest accel€ration for rear Eest occuPants'<br />
Peak chest deflection<br />
for three-point belted<br />
occupants<br />
The peak chest deflections are summarized in figure 20<br />
for those tests where a three-point belt system was used. lt is<br />
interesting that the two tests where submarining did not<br />
occur resulted in the least amount of chest deflection.<br />
The statistical results are displayed in figure 2l ' Note that<br />
only I main effect is present in the statistical model-Belt<br />
Angf e. It is significant, with ap-value of l.llo/o. Seat Height<br />
.,F:r-1.0tt(Hrddl<br />
r.i*hhkd<br />
r . F l*rnr[<br />
t2 - h.rl#l*hr[<br />
Flgure 20. Peak chest deflection (lnches) lor three-point only,
and Cushion Stiffness are confounded, so the main effect<br />
due to either one cannot be discriminated without more<br />
testing. <strong>Int</strong>erestingly, the confounded main effect is significant,<br />
with a p-value of l.3lVo, indicating that one of the<br />
factors, or a combination of the factors (low seat and soft<br />
cushion versus high seat and hard cushion) is significant.<br />
a<br />
E oE<br />
o<br />
o<br />
E<br />
,.illli',*<br />
Figure 21. Chsst d€flsctlon for lap/shoulder belted rear seat<br />
occupantg,<br />
Abdominal<br />
injury severity<br />
Leung, et al., (6) conducted l0 sled tests, in which human<br />
cadavers were restrained by three-point belts, to develop an<br />
abdominal injury criterion associated with submarining.<br />
Nominal sled velocity was 30 mph and peak decelerations<br />
ranged from 2 I to 30 g. Most of the cadavers were tested in a<br />
rear seat configuration. Upper and lower shoulder belt loads<br />
and inboard and outboard lap belt loads were recorded.<br />
Autopsies were performed.<br />
They observed a relationship between post-submarining<br />
peak force on the lap belt (average of both sides), normalized<br />
with respect to the mass of the part 572 dummy, and<br />
abdominal injury severity. This relationship, reproduced<br />
from Reference 6 and shown in figure 22, represents an<br />
approximate injury criterion which can be applied to our<br />
three-point belt test results. The criterion should not be<br />
applied to tests involving lap belt only, because the lap belt<br />
would be expected to penetrate a different region of the<br />
abdomen, causing injury to different organs, and, therefore,<br />
a different overall injury severity for a given force, than<br />
would occur in a three-point belt system.<br />
E<br />
T<br />
3 t<br />
i<br />
t<br />
I<br />
t<br />
kv.rnyer^iffid5Fhr tJD<br />
tr .''sruH<br />
Flgure 22, Relatlonshlp between the standsrdlzed tenelon of<br />
the lap-beltr (after rubmarlnlng) and th€ abdomen AlS.<br />
Lap belt forces (average ofboth sides) from all ofour sled<br />
tests are shown in figure 23. For tests where submarining<br />
did not occur, values shown are maximum forces. For tests<br />
with submarining, values shown are the highest forces that<br />
were generated after submarining (full or half) occurred. No<br />
statistical analyses were performed on lap belt force because<br />
differences in injury consequences of high belt forces<br />
would be expected to greatly vary, depending on whether or<br />
not submarining occurs. As expected, maximum values<br />
(from tests with no submarining) were much higher for the<br />
lap-only belt (2ff)0 to 30fi) lbs or 8.9 km to 13.4 km) than<br />
for the three-point belt (approximately 14fi) lbs or 6.2 km).<br />
Post-submarining belt forces for the lap-only belts having<br />
the shallowest angles (20' and 34") were comparable in<br />
magnitude to peak forces that resulted in tests with no submarining.<br />
Maximum belt forces after full submarining in<br />
the three-point system ranged from 240 to 700 lbs ( l. I km ro<br />
3.1km).<br />
ilfrh;iH_"*'<br />
Flgure 23. Peak lap belt lorces (both sldes averaged) (tba).<br />
For the three-point belt tests, injury severities (AIS levels)<br />
were obtained from the post-submarining lap belt<br />
forces, by means of the relationship in figure 22. These are<br />
presented in figure 24,and indicate that, although full submarining<br />
occurred in six out of the eleven tests, only one<br />
injury would have occurred and it would have been of minor<br />
severity (AlS I ). (Although not specifically stated in reference<br />
6, it is assumed that the lap belt force/injury relationship<br />
of figure 22 applies only for full submarining).<br />
i,#;r'0 (|*rdEt<br />
I t*rnt{kd<br />
r , F blnt[<br />
r/? - h.rrs nErnrfl<br />
Flgure E4. Inlury aeverlty (AlS) for three-polnt only.
Summary and Conclusions<br />
Based upon the results of the sled test series, the following<br />
summary and conclusions are made about the occurrence<br />
of submarining for rear seat occupants:<br />
l. The occurrence of submarining, in general, was<br />
very clearly detected by observing test films, forcetime<br />
responses of the load cells mounted in the submarining<br />
pelvis and force-time responses of lap and<br />
shoulder belt load cells.<br />
2. Of the four factors investigated in the test matrix,<br />
Lap Belt Angle has a statistically highly significant<br />
effect on the tendency for submarining to occur. Belt<br />
Tlpe (lap belt only versus three-point belt) and Seat<br />
Height appear also to have a significantz effect on, and<br />
Cushion Stiffness appears to marginally affect, submarining<br />
tendency. (While the effect of Lap Belt Angle is<br />
clear, a small degree of uncertainty exists with regard<br />
to the effects of the other factors, because of the confounding<br />
inherent in half-factorial designs).<br />
a. The shallower the angle (off horizontal), the<br />
greater the tendency for submarining to occur. A lap<br />
belt angle of approximately 45o appears to be a transition,<br />
below which the tendency for submarining to<br />
occur increases rapidly with decreasing angle.<br />
b. The tendency to submarine appears to be greater<br />
for three-point belted occupant$ than for lap belt<br />
only occupants. This appears, from the films, to be<br />
due to the shoulder belt ( I ) pulling up on the lap belt<br />
and (2) preventing forward jackknifing motion of<br />
the upper torso.<br />
c. It appears that submarining tends to occur more<br />
frequently when the height between the occupant's<br />
H-Pt. and heel resting position is low (8") than when<br />
that height is relatively high (l?"). The probable<br />
explanation for this is that with the lower heiSht, the<br />
occupant's pelvis is rotated rearward more than at<br />
the higher height. However, the effect of seat height<br />
on submarining tendency is questionable, due to<br />
lack of leg articulation in the Hybrid III dummy, and<br />
the resulting uncertainty regarding the dummy properly<br />
duplicating the human pelvis orientation for low<br />
seating heights. We feel the dummy's pelvis probably<br />
was rotated more in the lower seat than a human's<br />
would be, exaggerating the pelvic angle and<br />
predisposing the dummy to submarining more than<br />
is likely for the human.<br />
d. Although statistical significance is marginal,<br />
submarining tendency appears to be greater for the<br />
softer seat cushion.<br />
3. Forward head excursions and velocities were<br />
much greater for dummies in lap belts only than in<br />
three-point belts. Lap belt only restrained dummies<br />
had head velocities around 30 mph at a point represent-<br />
r Throughout rhe Summary and Conclusions, the tem "significant" or "signifi-<br />
caflce" is used to denote statistical signiflcance.<br />
270<br />
ing the rearmost location of a front seat back; they<br />
appeared to be slightly higher for steeper lap belt angles.<br />
Head excursionrt of three-point belt restrained<br />
dummies were less than that which would cause head<br />
contact; maximum head velocities were approximately<br />
2l-22mph.<br />
4. HIC value$ were marginally higher, and more<br />
variable due to some head/front seat back contacts and<br />
head/knee contacts, for dummies in lap-only belts than<br />
in three-point belts. HIC's averaged approximately<br />
1400 in the lap-only restraint, and 920 in three-point<br />
belts.<br />
5. Peak chest acceleration values were significantly<br />
affected only by seat cushion stiffness, averaging just<br />
under 60 g's for the hard cushion andjust under45 g's<br />
for the soft cushion.<br />
6. Peak chest deflections (three-point belt re$trained<br />
dummies only) were significantly affected by lap belt<br />
angle, ranging from about 2.1 inches for the $teepest<br />
angle to around 3 inches for the shallowest angles. The<br />
two tests where submarining did not occur resulted in<br />
the least amount of chest deflection.<br />
7. Maximum post-submarining lap belt forces of<br />
2839 and 2233 lbs occurred for the lap-only belts hav-<br />
ing the shallowest angles (20o and 34o, respectively).<br />
8. Maximum lap belt forces after full submarining in<br />
the three-point belt system ranged from 240 to 700 lbs.<br />
9. A useful, though approximate, injury criterion<br />
exists for evaluating severity of submarining for threepoint<br />
belt restrained occupants only. Injury severity<br />
can be inferred from peak lap belt forces that occur<br />
after full (two-sided) submarining (6). Although full<br />
submarining occurred in six out of eleven tests involving<br />
three-point belts, only one injury (AIS I ) was indi-<br />
cated. No criterion appears to exist for determining<br />
submarining severity when only a lap belt is worn;<br />
therefore, no conclusions can be made regarding sub-<br />
marining injury severity in lap-only belted occupants.<br />
Acknowledgments<br />
The views and findings in this paper are those of the<br />
authors and do not necessarily represent the policy of the<br />
NHTSA.<br />
The authors are grateful to Rodney Herriott, Doug Hayes,<br />
William Gwilliams, Claude Melton and Timothy Schock for<br />
their technical support in the fabrication ofthe test buck and<br />
processing of test data.<br />
A special thanks goes to Susan Weiser for the preparation<br />
of the manuscript.
References<br />
(l) Maclaughlin, T.F., Sullivan, L.K., and O'Connor,<br />
C.S.,<br />
"Rear Seat Submarining Investigation," DOT HS 807<br />
347, National Technical Information Service, Springfield,<br />
VA 22161, May 1988.<br />
(2) Adomeit, D. and Heger, A., "Motion Sequence<br />
Criteria and Design Proposals for Restraint Devices in<br />
Order to Avoid Unfavorable Biomechanic Conditions and<br />
Submarining", SAE Paper 751 146.<br />
(3) Adomeit, D., "Seat Design-A Significant Factor for<br />
Safety Belt Effectiveness", SAE Paper 791004.<br />
(4) DeJeammes, M., et al, "Factors Influencing the<br />
Estimation of Submarining on the Dummy", SAE Paper<br />
8l1021.<br />
(5) Mooney, M.T. and Collins, J.A., "Abdominal<br />
Penetration Measurement Insert for the Hybrid III<br />
Dummy", SAE Paper No. 860653, SAE <strong>Int</strong>ernational<br />
Congress & Exposition, Detroit, Michigan, February 24-<br />
28. 1986.<br />
(6) Leung, Y.C., et al, "Submarining<br />
Injuries of Three-<br />
Point Belted Occupants in Frontal Collisions-Description,<br />
Mechanisms and Protection", SAE Paper 821158.<br />
An Experimental Study of Crashworthiness of Vehicle Front Structure<br />
Akihiro Miyajima, Noboru Takahashi,<br />
Gyoichi Hataya,<br />
Subaru Engineering Division,<br />
Fuji Heavy Industries Ltd.<br />
Abstract<br />
Frontal impact test data of vehicles which have various<br />
front structure configuration are analyzed, and relationship<br />
between crashworthiness and occupant injury level is<br />
discussed.<br />
Specific displacement, R (ratio of actual to free vehicle<br />
displacement) is introduced as an index for estimating the<br />
crashworthiness of front structure. Value of R at a certain<br />
time (here t = 40 msec) can represent the feature of<br />
crashworthiness in earlier period of impact and has close<br />
correlation with occupant injury level. To keep less R value,<br />
that is, to keep less vehicle displacement in earlier period of<br />
impact is effective to reduce injury severity.<br />
Presumed value of R is also obtained by computer<br />
simulation. [t could give an indication for predicting<br />
occupant protection performance with certain exactness in<br />
the first stage of vehicle body design.<br />
<strong>Int</strong>roduction<br />
Vehicle crashworthiness is, needless to say, one of the<br />
most important factors which influence the occupant injury<br />
severity, as well as the performance of restraint systems.<br />
Many studies have been done theoretically and/or<br />
experimentally on this subject (Reference l, 2, 3, 4).<br />
Recently, large scale deformation analysis of vehicle<br />
structure by super-computer has come to be widely used to<br />
estimate crashworthiness, while occupant injury level is<br />
predicted by two- or three-dimensional victim behavior<br />
analysis (Reference 5, 6.).<br />
In order to provide appropriate crashworthiness at the<br />
early stage of vehicle development it is essential to e$tabli$h<br />
a simple and effective means to estimate the crashworthiness<br />
and to confirm its validity. From this point of<br />
view, as a practical approach, we analyzed impact test data<br />
of various vehicles, examined the relationship between<br />
occupant injury level and vehicle crashworthiness in earlier<br />
period of impact, and tried to introduce an index to be used<br />
to evaluate conveniently the crash performance of a vehicle<br />
front structure. We also compared this index with the<br />
calculated value by computer simulation.<br />
Vehicle Crashworthiness and Occupant<br />
Injury Level<br />
Vehicle deceleration curve<br />
Analysis of vehicle deceleration curve in a collision test<br />
is one of the mo$t frequently used means to eyaluate the<br />
crashworthiness. Vehicle deceleration is determined by<br />
impact speed, vehicle weight, stiffness of front structure<br />
members and configuration of rigid components, such as<br />
engine and drive train.<br />
Figure I shows certain vehicle deceleration curves in 30<br />
mph frontal impact tests on fixed barrier (measurement; on<br />
rear trunk floor). Specification of test vehicles is shown on<br />
Table l, where dimension a is the length of the front end<br />
(distance between the top of bumper and frontbulkhead), b<br />
is the distance from the top to powerplant, and c is the<br />
distance from the top to side frame (majorenergy-absorbing<br />
member).<br />
50 l0O raec<br />
rue<br />
Flgure 1. Vehlcle decelerallon ln 30 mph frontal lmpact test on<br />
flxed berrler.<br />
Basic diinensions and body structure of vehicle A and B<br />
are the same. but dimension b is not identical because of<br />
carrying different engine. Vehicle C has smaller body and<br />
powerplant compared with A and B.<br />
Difference of deceleration curve is derived from these<br />
differences of construction. Deceleration of vehicle A is<br />
27r
Table 1. Test vehlcle tpeclflcatlons<br />
bFct .Fd (hA) €.6 4E.r 49. r<br />
l.rrcrr v.rsht (E) r, a9' 1. Bl<br />
&lo4rtlo! ol !!rt htt<br />
hrlloltrlly o!tsrrt, 46t61 Horfuoltlllt oPo6.d. tutl<br />
r,3F r,2s 9r0<br />
JF 4m<br />
l@ !60 l?0<br />
115 725 415<br />
fr 1, 6l<br />
rd ril 6t<br />
t-Hs<br />
i{'!-{-<br />
H*-=+ V<br />
l i- ---1<br />
lower in -"r,,*, o*.,"0 ilt#;e that of vehicle c is<br />
higher. Vehicle B is the medium. Between these three cases,<br />
however, there are no big differences of the highest peak<br />
value of deceleration.<br />
Occupant injury level<br />
Occupant injury indices at the test of these three vehicles<br />
(mean value of several test cases) are shown in figure 2. We<br />
used passenger side data to eliminate the influence of secondary<br />
impact by steering post. From these data we can<br />
conclude that occupant injury level is higher when the vehicle<br />
has relatively lower deceleration in earlier period of<br />
impact (vehicle A), and on the other hand, we can expect<br />
lower injury level if it has higher deceleration in earlier<br />
period of impact (vehicle C). Vehicle B has the middle value<br />
of A and C.<br />
Flgure 2. Comparlaon of Inlury level of three lest vehlcles.<br />
Numerical expression of crashworthiness<br />
When discussing vehicle crash process, displacement is<br />
more convenient than deceleration to compare different<br />
vehicles.<br />
Figure 3 shows the vehicle displacement, S, to time, and<br />
Figure 4 shows its non-dimensional expression, R = S/Sc.<br />
Sc is the free displacement (viftual displacement) at 40<br />
msec, according to the impact speed. The time of 40 msec is<br />
adopted for convenience's sake. In the case of 30 mph to 35<br />
mph impact, value of free displacement, Sc = 0.53 m to 0.62<br />
272<br />
t<br />
m is close to the crash stroke, that is, effective energy<br />
absorbing deformation of compact/subcompact class vehicle.<br />
Accordingly, the vehicle displacement expressed as the<br />
ratio to this value is convenient to roughly estimate the<br />
crashworthiness.<br />
Flgure 3. Vehlcls displacement.<br />
vehtcle A. vo = \8.6 h/h<br />
lr0<br />
Celculatlon of n<br />
In this sense value of R may be called specific displacement,<br />
and less value of R to time means higher crushresistant<br />
characteristic in earlier period of impact.<br />
In the case of the three vehicles, as shown in figure 4,<br />
values of R are not so much diff'erent at 20 msec. At 30 msec,<br />
A and B has nearly the same, and C has less R value. At 40<br />
msec, where A(0.847) > B (0.795) > C (0.758), difference<br />
becomes distinct.<br />
& EEEC<br />
Flgure 4. Comparlaon of crashworthiness by non-dlm6nsional<br />
exPre99ron.<br />
Flgure 5. Inlluence ol drlve traln snd Impsct apeed<br />
(baaed on<br />
vehlcle A).
We also examined by test influence of different drive<br />
train configuration and different impact speed, in the case of<br />
the same body construction. The results show no significant<br />
difference ofR value in any case (figure 5). Consequently,<br />
with R value, we can quantitatively evaluate the basic characteristics<br />
of vehicle crashworthiness in relation to displacement<br />
and/or time.<br />
R value and occupant injury level<br />
In order to clarify the relationship between R value and<br />
occupant injury level, we examined test data of seventeen<br />
cases of 30 and 35 mph frontal crash of subcompact class<br />
passenger car,<br />
As shown in figure 6, a close correlation exists between<br />
the value ofR at 40 msec and occupant injury index, chest 3<br />
msec-G (correlation factor k = 0.9 l2).<br />
Figure 7 shows HIC versus R value at 40 msec for the<br />
same test data. Though it i$ not so much obvious as chest G,<br />
there is a tendency that HIC decreases as the value of R<br />
reduces (correlation factor k = 0.693).<br />
From the facts mentioned above, R value at 40 msec can<br />
be utilized as a practical index ofcrashworthiness for 30 to<br />
35 mph impact. Thus a bodystructure which has lower R<br />
value is preferable from the viewpoint of occupant<br />
protection.<br />
o<br />
d<br />
E<br />
E<br />
e<br />
E<br />
o<br />
Flgure S. Gorrelatlon botwo€n R at 40 mssc and chest 3 msec G.<br />
o k - 0.69,<br />
Flgure 7. Correlatlon between R at 40 maec and HlC.<br />
R value and ride-down effect<br />
Vehicfe l0nphl]5npt<br />
A o I<br />
B A A<br />
Ride-down effect generally increases with advance of the<br />
beginning of restraint of occupant with seat belt. We also<br />
examined the relationship between R value and ride-down<br />
effect.<br />
Figure 8 illustrates the vehicle deceleration and chest G<br />
of dummy versus vehicle displacement in frontal impact<br />
tests of the vehicle A, B, and C. The highest peak of chest G<br />
occurs immediately before the ultimate displacement. Rise<br />
up point of chest G (Sl), that is, beginning of occupant<br />
restraint is 300 mm for A. 230 mm for B and 195 mm for C<br />
re$pectively. Shaded area in figure I is expressed as<br />
E<br />
o<br />
r*t<br />
E -\ e ds .<br />
s1<br />
Vehiete A Drruy cheBt<br />
\ i<br />
:<br />
SI Se 500 m<br />
Vehlcle illsplBcment, g<br />
Flgure 8. Vehlcle and dummy chest deceleratlon vE. vshlcls<br />
dlaplacemant.<br />
k - -0,819<br />
rs2 '-\r.<br />
(-u. )'<br />
Flgure 9. Correletlon between R and rlde-down elfect.<br />
This value is proportional to the kinetic energy of dummy<br />
absorbed by deformation ofvehicle body in the period from<br />
the beginning of restraint (Sl) to the displacement at 40<br />
msec (S2), namely, the amount of ride-down effect.<br />
i<br />
273
Using the same test data shown in figures 6 and 7, relationship<br />
between E and R is obtained and $hown in figure 9,<br />
where E is corrected equivalent for 30 mph (48.3 km/h)<br />
impact. Correlation factor is k = -0.849, and less R value (t =<br />
40 msec) gives bigger ride-down effect.<br />
Computer Analysis of Crashworthiness<br />
As an index of vehicle crashworthiness, we calculated the<br />
value of R by mathematical simulation and compared with<br />
experimental data.<br />
The program employed forcomputation is DYCAST/GC<br />
Code (Reference 7, 8).<br />
Model<br />
The analyzed model is based on the vehicle B. For computation,<br />
engine hood, fenders and auxiliary Parts are neglected<br />
(figure l0). Components and members involved are<br />
substituted to finite elements as follows:<br />
r Sumpsl-non-linearspringelement<br />
. Side f14ns-nsn-linear spring element and beam<br />
. Crossmember-beam<br />
r Panel-shell<br />
r Powe{plant-rigidbody<br />
r Tire
Test data for the calculation model vehicle<br />
We also conducted impact test with the very vehicle used<br />
as the model for calculation. The results are shown in figure<br />
l2 and figure I 3 in comparison with calculation. Crash and<br />
displacement mode are fairly similar to that of calculation.<br />
R value at 40 msec obtained from the test data is 0.839,<br />
which has good coincidence with the calculated R value.<br />
From this experience, analysis with DYCAST simulation<br />
model seems to be useful for estimating vehicle<br />
crashworthiness.<br />
I<br />
Flgure 14. Vehlcle dl$placement In slmulatlon and cxperlm€nt.<br />
Conclusion<br />
(l) At a frontal impact test, relatively higher vehicle<br />
deceleration in earlier period of collision generally gives<br />
reduction of occupant injury level.<br />
(2) Specific displacement, the value of R = S/Sc (here at<br />
40 msec) can be used as an index for estimating vehicle<br />
crashworthiness. Less R value could provide lower<br />
occupant injury level. R value of a certain vehicle body is<br />
hardly affected by impact speed and drive train<br />
configuration.<br />
(3) Smaller R value generally means bigger ride-down<br />
effect.<br />
(4) R value could be calculated by computer simulation<br />
and utilized as an indication of vehicle structural design.<br />
We introduced an idea to estimate the vehicle<br />
crashworthiness using the value of R (specific<br />
displacement). It is, however, only one of the possible<br />
approach. The authors wish to conduct further experimental<br />
and analytical studies and to establish more effectual means<br />
to evaluate total crash performance of a vehicle.<br />
References<br />
Safer Steering Wheels to Reduce Face Bone Fractures<br />
Keith C. Clemo,<br />
Motor Industry Research Association,<br />
Nuneaton, Warwickshire, England<br />
Slade Penoyre,<br />
Transport and Road Research Laboratory,<br />
Crowthorne, Berkshire, England<br />
Martin J. White,<br />
Motor Industry Research Association,<br />
Nuneaton, Warwickshire, England<br />
(l) G. Hataya, J. Takizawa, S. Kojima; Crash Analysis of<br />
Vehicle Structure Including Occupant. Bulletin of JSAE,<br />
No.8, 1975.<br />
(2) N. Aya, K. Takahashi, H. Nosho; A Method How to<br />
Estimate the Crashworthiness of Body Construction.<br />
Nissan Technical Review, No. I I, 1976.<br />
(3) M. Hashimoto, R. Nakahama; Influence of Crash<br />
Characteristics on Occupant Injuries. Journal of JSAE, No.<br />
4. Vol.4l. 1987.<br />
(4) M. Kondo, K. Takahashi; Relation between Vehicle<br />
Deceleration Curves and Occupant Responses in<br />
Collisions. Bulletin of JSAE. No. 35. 1987.<br />
(5) D.A. Vander Lugt, R.J. Chen, A.S. Deshpande;<br />
Passenger Car Frontal Barrier Simulation Using Nonlinear<br />
Finite Element Methods. SAE 871958.<br />
(6) J. Wismans, J.H.A. Hermans: MADYMO 3D<br />
Simulation of Hybrid-3 Dummy Sled Tests. SAE 880645.<br />
(7) R. Winter, J. Crouzet-Pascal, A.B. Pifko; Front Crash<br />
Analysis of Steel Frame Auto Using a Finite Element<br />
Computer Code. SAE 840728.<br />
(8) Grumman Corporation Research Center; DYCAST/<br />
GC Nonlinear Structural Dynamic Finite Element<br />
Computer Code User's Manual, Ver. 1.4.<br />
Abstract<br />
The paper starts by reviewing accident data from UK and<br />
other countries which shows that restrained drivers frequently<br />
receive brain injuries and face bone fractures from<br />
striking their steering wheels in frontal crashes. These fracture$<br />
are not usually fatal but are extremely unpleasant,<br />
requiring skilled surgery and long periods of immobilisation<br />
during recovery, and often resulting in permanent disfigurement.<br />
Possible counter-measures considered are seat<br />
275
elt pretensioners, air bags, and improved steering wheel<br />
designs, and the paper suggests that while pretensioners and<br />
air bags would be very effective their cost and complexity<br />
will prevent widespread use in high-volume cars for several<br />
years. In the meantime improved, less aggressive, steering<br />
wheel designs are seen as a good, cheap and quick way of<br />
reducing head and face injuries. A practicable safer wheel<br />
designed by TRRL and Sheller-Clifford was shown at the<br />
lOth <strong>ESV</strong> <strong>Conf</strong>erence at Oxford in 1985, together with a<br />
proposed impact test procedure using a flat disc of aluminum<br />
honeycomb. The honeycomb crush strength is chosen<br />
to be the same as the maximum pressure which the weakest<br />
important par"ts of the human face can withstand without<br />
bone fracture, so deformation of the honeycomb during<br />
impact indicates a wheel which is dangerously stiff' The<br />
present paper describes how this proposed test has since<br />
been developed, and gives test results for 15 designs of<br />
production wheels. It concludes that the test is easy to carry<br />
out and gives repeatable results, and suggests that use ofthis<br />
test in legislation would lead to steering wheel designs<br />
which would greatly reduce the risk of brain damage and<br />
face bone fracture.<br />
<strong>Int</strong>roduction<br />
Seat belts have been shown to be very effective in<br />
reducing deaths and serious injuries to car occupants, with<br />
most studies sugge$ting that when worn they approximately<br />
halve the risk of death (1,2,3).* However, normal lap/<br />
diagonal belts are not able to prevent a driver's face from<br />
hitting the steering wheel in a severe frontal crash, for<br />
reasons that are very obvious to anyone who tries a simple<br />
experiment-sit in the driver's seat with your belt fastened,<br />
jerk the belt to lock the inenia reel, then lean forward as far<br />
as the belt allows. Nearly all drivers find their faces or<br />
foreheads touch the wheel, even under the very low belt<br />
forces produced in the test. In a frontal crash, with the car<br />
decelerating at perhaps 30 g and a shoulder belt load of<br />
perhaps half a ton, the amounts of belt stretch and b-Jy<br />
movement are of course much greater, and the driver's head<br />
can meet the wheel at a high relative speed. Since most<br />
current production steering wheels are not designed with<br />
face impact or energy absorption in mind, it is hardly<br />
surprising that face injuries are both common and serious<br />
for restrained drivers.<br />
Accident Data on Face Injuries to<br />
Restrained Drivers<br />
The most comprehensive and recent source of accident<br />
data on restrained drivers appears to be the UK's continuing<br />
study organised by TRRL/DTp and being carried out by<br />
teams from the Institute for Consumer Ergonomics,<br />
Loughborough and the University of Birmingham, with<br />
financial suppoft from Rover, Jaguar, Ford, and Nissan (4).<br />
The most relevant data from this study on the driver face and<br />
head impact problem is contained in three recent<br />
publications by the TRRL and ICE teams (5,6,7). Taking<br />
+Numbers in parentheses designatc referencts at end of paper.<br />
276<br />
these in order of publication, the first (5) "examines the<br />
incidence, severity and causation of head injuries in car<br />
accidents in post seat belt legislation Britain". It uses data<br />
from 940 accidents and I 603 occupants, of whom 89 (6Vo)<br />
died, 401 (25o/o) werc seriously injured, 548 (347o) were<br />
slightly injured and 565 (357o) were uninjured. 936 (587a)<br />
were drivers, of whom 572 were restrained, 60 were<br />
unrestrained, and the restraint use of the remaining 304 was<br />
not known. 9 I of the drivers had head or face injuries from<br />
$triking their steering wheels, and nearly all of these were<br />
wearing seat belt$ (967o) and were in frontal impacts (95Vo).<br />
36 drivers received head (i.e. non-face) injuries from their<br />
wheels, 28 having AIS 2 brain damage (unconscious or<br />
amnesia) and ? having severe (AIS 3-6) brain damage. 84<br />
drivers had face injuries from steering wheel contact, 46<br />
being cut, bruises and abrasions (5 rated AIS 2),3l having<br />
single face bone fractures and 5 multiple fractures. The<br />
authors considered which parts of the steering wheels<br />
caused these injuries, and concluded that of I I AIS 3 or<br />
above injuries, 3 were caused by the hub and 8 by the rim or<br />
spokes. Taking all severities, the hub was repsonsible for<br />
34Vo and the rim or spokes for the rest. The author$<br />
concluded that "the steering wheel has been shown to be a<br />
major cause of facial bone fractures and AIS 2 brain injury<br />
to drivers."<br />
The second relevant paper by the TRRl/Loughborough<br />
teams (6) was presented at I lth <strong>ESV</strong> <strong>Conf</strong>erence in<br />
Washington, May 1987. It starts by quoting Rutherford's<br />
findings (2) that compulsory wearing of seat belts was<br />
effective in reducing most injuries to drivers and front seat<br />
passengers, but that drivers' skull and face bone fractures<br />
increased by 8 and l07o respectively while the<br />
corresponding figures for front seat passengers fell by 7l<br />
and 46Vo. Since the main difference in a frontal crash<br />
situation between the driver and the front passenger is the<br />
presence of the steering wheel ahead of the driver, it seems<br />
reasonable to conclude that steering wheel impacts account<br />
for this large difference between the figures. The paper uses<br />
a more recent and Iarger data base than (5) with information<br />
from l6l8 vehicles and2720 occupants collected between<br />
January 1984 and June 1986. 213 of the vehicles were<br />
impacted frontally, and in these impacts with restrained<br />
front occupants it was found that the legs were the body<br />
region most often injured (63Vo of all injured occupants),<br />
followed by the head/face (52Vo). Excluding AIS I injuries<br />
leaves l08l of AIS 2 or more, of which the head/face<br />
accounts for 314 = 29Va and the legs for 230 = ZlVo.<br />
Considering the mechanism of injuries of AIS 2 or more to<br />
"vulnerable<br />
body regions", the steering wheel is the most<br />
important object struck, accounting for 34Vo of all injuries'<br />
while the next most frequent source is seat belt webbing at<br />
32Vo, and no other contact location exceeds 57o. When<br />
studying frontal collisions with passenger compartment<br />
intrusion, the steering wheel was found to be an even more<br />
important cause of injuries, accounting for 5l7o of all<br />
contacts while the next most common sources were "other<br />
vehicle" at lTVo and the A Pillar at 107o.
The third and most recent relevant paper published using<br />
this UK data base is (7). This pap€r says that 484 out of 2650<br />
re$trained drivers in frontal impacts sustained steering<br />
wheef head or face injuries (lBok),compared with2?l/2650<br />
= 87o sustaining torso injuries from their wheels. It was also<br />
found that the face injuries occurred at much lower crash<br />
speeds than the torso ones. The author of(7) attributes this<br />
difference to the fact that the $eat belt restrains the torso<br />
directly, so preventing torso/wheel contact except in very<br />
severe accidents, while the restraining load on the head can<br />
only be applied via the neck. The head is therefore much<br />
freer than the tor$o to move forward, and will receive less<br />
benefit from restraint use. This paper also points out a<br />
difficulty with using AIS to classify rhe seriousness of face<br />
injuries, because it does not take account ofthe potential for<br />
permanent disfigurement and consequent emotional and<br />
other problems. The author concludes that "the steering<br />
wheel is a frequent source of head and face injuries (to<br />
restrained drivers); the mo$t common non-minor head<br />
injury caused by steering wheel contacts is AIS 2 brain<br />
damage (unconsciousness); facial bone fractures are also<br />
common and more severe brain injuries do occur".<br />
While these recent papers provide strong evidence of the<br />
frequency and severity of head and face injuries from<br />
current steering wheel designs, the problem is by no means a<br />
new one. It was clearly identified by Gloyns et al in l98l<br />
(8), who concluded that both brain damage (concussion)<br />
and face bone fracture are very common in frontal impacts<br />
with restrained drivers. For example,2/3 of the drivers in<br />
the sample were injured only by making head or face<br />
contacts with their wheels, and of these 3l7a suffered a face<br />
bone fracture and 22Vo were concussed. The authors<br />
recommended improving steering wheel designs to increase<br />
their energy absorption, and suggested changes to<br />
legislation covering steering wheel testing.<br />
The problem of injuries produced by steering wheels is<br />
not of course unique to UK; researchers elsewhere have<br />
found very similar results when considering restrained<br />
drivers, and as belt wearing rates improve in other countries<br />
these injuries will become more important there too. For<br />
example (9) shows that in Finland in 1987 with front seat<br />
belt wearing rates of 82Vo in built-up areas and 92o/o on<br />
highways (in 1983/84), --steering wheel caused injuries<br />
have not shown a decreasing tendency during recent years<br />
",<br />
although injuries from other parts ofthe car had decreased.<br />
French workers had also identified the problem as long ago<br />
as l98l; (10) shows that 74 out of 405 belted drivers in<br />
frontal impacts had head to wheel impacts. To sum up,<br />
therefore, everyone who has studied this subject has found<br />
that head and face injuries from steering wheels are a<br />
serious problem for restrained drivers, and it is clear that a<br />
solution would be extremely worthwhile.<br />
Possible Solutions to Reduce Steering<br />
Wheel Injuries<br />
Since face bone fractures and brain injuries are being<br />
produced by head to wheel impacts, it is necessary either to<br />
prevent these contacts altogether, or to reduce their speed,<br />
or to design the wheel so it can absorb the head's kinetic<br />
energy without exceeding allowable human tolerance<br />
figures. Two ways of preventing head to wheel contacts, or<br />
ofreducing their speed, are to use seat belt pretensioners<br />
or<br />
steering wheel air bags. Either of these methods (or of<br />
course both together) should be very effective, panicularly<br />
if the pretensioner<br />
system not only tightens the belt but also<br />
moves the wheel forward as in the VW Audi Procon-ten<br />
design ( I I ). But pretensioners<br />
and air bags are complex and<br />
expensive, and it is not realistic to expect them to be used in<br />
popular cars soon, although they are gradually being<br />
introduced in quality cars and it is possible that when they<br />
prove to be effective there, public opinion will encourage<br />
wider use. However for high-volume cars the only<br />
financially viable approach to reducing drivers' head and<br />
face injuries seems to be the use of less aggressive steering<br />
wheels which are designed with energy absorption in mind.<br />
One such design was shown by TRRL and Sheller Clifford<br />
at the 1985 <strong>ESV</strong> <strong>Conf</strong>erence, figure I. This would be only<br />
very slightly more expensive than a standard hard wheel,<br />
and has been found to be highly acceptable to drivers in road<br />
trials. At least two car manufacturers (Volvo and GM)<br />
already make steering wheels using some of the same<br />
principles, and so the cost penalty is clearly not prohibitive.<br />
But other manufacturers have shown little enthusiasm for<br />
improving their wheels, and so it appears that it would be<br />
necessary to legislate for a test procedure to achieve wider<br />
use of safer designs. The aim of such a test procedure must<br />
be to limit the loads and decelerations of the driver's head<br />
from wheel impact to levels which will not cause injuries,<br />
and so a knowledge of human tolerance figures is an<br />
essential first step in designing the test procedure.<br />
,{4frrdr#v_ttrrrl<br />
2. fdr l|ltrl rpE*B. rdt rdl Fdrlid fid drhn d to buhlr *lfil<br />
3. I tilck mlt rim with itr -xlttrltr rfit|l rolntuEsttdlt pshlomd t lrr d<br />
r po&ibkeryfffi th.&lfittH.<br />
Flgure 1. TRFL/Sh€ll€r-Cllfford safety wheel
Human Tolerances For Head and Face<br />
Loadings<br />
Work on human tolerance to face loads goes back at least<br />
to the cadaver experiments of Rene Le Fort in Paris in 190 I ,<br />
and his system ofclassifying the unpleasant fractures ofthe<br />
middle third of the face which occur when the tolerable<br />
loads are exceeded is still used today. Anyone who feels<br />
face bone fractures are not serious injuries (and who has a<br />
strong stomach) is advised to read some of the numerous<br />
medical papers on the problems of treating these fractures,<br />
eg. (12, 13). When trying to protect car occupants, two<br />
different kinds of possible injury must be considered; brain<br />
injury, caused by excessive deceleration, and face bone<br />
fractures, caused by excessive local loads. As with all<br />
questions of human tolerance, the available data is very<br />
limited for both these kinds of injury, but for brain damage<br />
the figure of 80 g for 3 ms has been accepted in legislation<br />
for many years (eg ECE Reg 21, FMVSS 201) and appears<br />
to be a reasonable criterion. For face bone fracture the<br />
problem is more difficult, as the skull is a very complex<br />
structure whose $trength varies over its different parts, and<br />
the risk offracture will depend on the applied force, the area<br />
over which this is applied, and the stiffness of the object<br />
which is loading the face. The best practical approach seems<br />
to be that taken by Nahum, (14, l5), who argued that<br />
pres$ure is the important criterion. His cadaver tests<br />
suggesred rhat a load of 200.-225 lb (0.9-l kN) when<br />
applied with an impactor of 1 sq. in. (645 sq mm) was<br />
unlikely to cause fracture of the zygomatic (cheek bone) or<br />
maxillary (top jaw) areas, Nahum also found that a much<br />
Iower load (50 lb, 0.22 kN) could break the nose, but the area<br />
of bone being loaded there is much less than I sq in; if this<br />
area is in fact about l" X l/4" then the allowable pressure is<br />
again 200 psi.<br />
Other workers, eg (16) have found similar levels of<br />
tolerable pressures for the zygomatic and maxillary regions,<br />
and although the subject does not appear to be well<br />
understood this pressure of approximately 200 psi seems a<br />
reasonable maximum to be allowed for steering wheel<br />
impacts. Cadaver testing cannot be carried out in UK, but<br />
we hope that countries where it can be done will in fact do it;<br />
such testing seems the only way of testing our hypothesis<br />
that an impacting device which crushes at 200 psi (1.4<br />
N/mmz) will not produce face bone fractures.<br />
Proposed Steering Wheel Test<br />
Procedure-1985<br />
At the 1985 <strong>ESV</strong> <strong>Conf</strong>erence in Oxford, TRRL presented<br />
a paper ( l7) proposing a steering wheel impact test based on<br />
existing "<strong>Int</strong>erior Fittings" legislation, ECE Reg 2l or<br />
FMVSS 201. The test would use the same mass and speed<br />
( 15 lb, 6.8 kg and 15 mph, 24.1 kph) as those regulations but<br />
would replace their rigid metal spherical impactor with a<br />
disc of aluminium honeycomb whose crush strength<br />
corresponds to the human face tolerance, about 20O psi. Ttvo<br />
278<br />
pass/fail criteria were suggested, (l) that the impactor<br />
deceleration does not exceed 80 g for 3 ms (cumulative, so<br />
that a "ringing" accelerometer does not give a false pass),<br />
(2) that the permanent dent in the honeycomb is not deeper<br />
than 2 mm (measured only over the central 100 mm<br />
diameter area of the disc, so as to avoid edge effects-the<br />
disc's diameter is I 50 mm). In the I 985 work the aluminium<br />
honeycomb was used in its "as manufactured" condition,<br />
without pre-crushing, and a specification was chosen with<br />
the required initial crush strength in this condition.<br />
The 1985 paper Eave results for 7 standard production<br />
wheels and the TRRL/Sheller Clifford safety wheel. Only<br />
this safety wheel met the proposed deceleration and<br />
indentation depth criteria at all the points te$ted (hub, spoke/<br />
rim junction, longest part of rim without a spoke, shortest<br />
part of rim without a spoke). The production wheels all<br />
passed on deceleration levels in the rim impacts but failed<br />
on indentation depth in those impacts, while in the hub<br />
impacts all failed on deceleration levels and only the Volvo<br />
passed on indentation depth.<br />
Development of Proposed Test Since<br />
1985<br />
Initial proposals for legislative test<br />
Following the publication of a proposed legislative test<br />
for steering wheels in the 1985 <strong>ESV</strong> Paper, a document was<br />
prepared for the European Community Group on Passive<br />
Safety (ERGA) for consideration for use in an EEC<br />
Directive to Member States.<br />
The document incorporated the test details proposed in<br />
the <strong>ESV</strong> Paper, with the addition of two tests to be<br />
performed on samples of the honeycomb material to verify<br />
its crush load performance.<br />
The document stipulated that each steering wheel should<br />
be impact tested at the four points chosen for the tests<br />
reported in the <strong>ESV</strong> paper, namely the hub, the join of the<br />
spoke and rim, the centre of the longest unsupported arc of<br />
rim, and also the shortest unsupported arc of rim. lt also<br />
allowed for a further impact point to be selected by the<br />
technical service responsible forthe tests where such apoint<br />
might be judged to offer a significantly greaterrisk of injury.<br />
Revised proposals incorporating pre-crushed<br />
honeycomb material<br />
In the discussion of this document by ERGA, it was<br />
suggested that there were two features of the honeycomb<br />
crush performance which made it unsuitable for the measurement<br />
of peak pressures. The first of these is the high<br />
initial peak which occurs at the beginning of crush on the<br />
honeycomb. A typical honeycomb crush load/deflection<br />
curve, as shown in figure 2, illustrates this. The initial peak<br />
is due to the buckling of the foil surface$ which make up the<br />
cells; once folding is established, the crush load falls and<br />
continues at an approximately constant level. It is clear that,<br />
if we choose our honeycomb material so that the height of
our initial peak matches our threshold pressure value, then<br />
continuing crush will occur at a significantly lower load,<br />
and therefore, penetration of the honeycomb represents a<br />
non-linear measure of severity. Also, and this was the second<br />
criticism of this material, the buckling behaviour of the<br />
foil, ie, its initial peak load, is significantly altered by imperfections<br />
in its shape, making a given sample very variable in<br />
this respect. The later working paper produced by TRRL to<br />
report initial trials of the honeycomb ( l8) confirms this. The<br />
paper reports initial peak values for a group of6 discs which<br />
vary between l. l8 N/mmzand 2. I I N/mmz, a spread of 56%<br />
of the mean.<br />
Wo(k doil to Inltirts<br />
hilur ol th6 horuybmb<br />
Flgure 2. Grush charactsrlstlcs of alumlnlum honeycomb<br />
As a result of these criticisms, a new approach to the<br />
preparation of the honeycomb material was adopted. Instead<br />
of using the honeycomb as it is normally supplied, it<br />
was decided to prepare each disc by pre-crushing it over the<br />
whole of its surface before test. The crush is continued up to<br />
a point where the crush load has passed the initial peak and<br />
fallen to the flat ponion of the curve beyond; this ensures<br />
that the buckling of the foil which causes rhe inirial peak is<br />
completed and the material is collapsing in a series of regular<br />
folds. Ifthe deflection is stopped at this point, the pattern<br />
of folding in the foil is preserved, and further crushing of the<br />
honeycomb will proceed as a continuation of the load/deflection<br />
curve already established. Thus, it is possible to<br />
predict the crushing load of each specimen by its performance<br />
in the pre-crush without the need for the tests mentioned<br />
in the previous section. Tests with pre-crushed honeycomb<br />
specimens proved that the behaviour of the<br />
honeycomb after interruption of the crush was exactly as<br />
predicted, the original curve being resumed as the crush is<br />
continued. The level ofthe flat part ofthe curve also proved<br />
to be much more repeatable than the initial peak for a given<br />
specimen. A sample of 6 pre-crushed discs gave crush loads<br />
varying between l.0l N/6rnz and 1.08 N/mm2, a spread of<br />
jVo compiled to 567o in initial peak loads of the previous<br />
group.<br />
In addition to the improved consistency of the precrushed<br />
specimen, the technique brings two practical advantages<br />
to benefit the test. The crushing gives the honeycomb<br />
disc a robust surface of folded foil which is much less<br />
susceptible to accidental damage than the exposed foil<br />
edges of the uncrushed material. The folded foil also lends<br />
itself to accurate measurement of the surface profile before<br />
and after impact, the tester being able to traverse the probe<br />
over the smooth surface, whereas measurements of the uncrushed<br />
foil edges required great care to avoid damage.<br />
One precaution which must be taken in pre-crushing is to<br />
lightly deform the upper surface foil edges before the crush<br />
load is applied. This ensures that the folding commences at<br />
the upper surface; without this, the honeycomb may fold at<br />
the lower surface or even at some point within the disc. The<br />
deformation may be achieved by a series of light hammer<br />
blows.<br />
Naturally, by pre-crushing the disc, the crushing load<br />
achieved in the impact test is considerably reduced. For the<br />
original material the mean steady crush load is 1.04 N/mmz<br />
which is considerably less than the previously quoted criteria<br />
of 1.4 N/mmz, representing the strength of the facial<br />
bone structure. A new material watr therefore selected for<br />
the tests, having the following specification:<br />
Manufacturer-{iba-Geigy (Aeroweb)<br />
Cell Size-{.25 in (6.35 mm)<br />
Foil Thickness--4.fi)Z in (0.051 mm)<br />
Material-Aluminium Alloy 5052 T (non<br />
perforated)<br />
Density-4.3 lb/frr (68.9 Kc/M3)<br />
Crush tests of 6 specimens of this material gave a mean<br />
crushing pressure of L7 I N/mmz with a spread from 1.70<br />
N/mmz to 1.72 N/mmz (l% spread). This is approximately<br />
20olo above the suggested human tolerance figure, but it was<br />
neces$ary to select a material which is a standard product to<br />
ensure availability, and it was felt that wheel manufacturers<br />
could reasonably object to a test material which is weaker<br />
than the tolerance figure.<br />
At the same time as changing the method of preparing the<br />
honeycomb discs, the opportunity was taken to give some<br />
attention to the way the profile of the disc surface and the<br />
subsequent penetration was measured. The TRRL working<br />
paper describes a technique for carrying out these mea$urements<br />
and a suitable apparatus. The honeycomb disc<br />
after impact is placed between two flat plates, the upper one<br />
having a circular hole 100 mm diameter, corresponding to<br />
the central zone over which measurements are made. A 3 kg<br />
weight is placed on the top plate, and 4 screws joining the<br />
plates tightened finger tight. Once clamped in this manner,<br />
the profile of the disc surface within the 100 mm diameter<br />
window is measured by taking readings from a dial test<br />
indicator mounted on a beam across the surface ofthe upper<br />
plate. The dial gauge has a 6 mm diameter probe with a flat<br />
end. To determine the penetration depth, five readings are<br />
taken of the highest point (undeformed surface) and five of<br />
the lowest point (bottom of dent). The difference between<br />
the mean values of these two quantities gives a measure of<br />
the penetration.<br />
A series of trials conducted by TRRL to investigate the<br />
repeatability of penetration depth measurements showed<br />
2t9
that estimates of depth by a single experimenter measuring a<br />
single disc (mean estimate of depth of crush 1.39 mm) gave<br />
a standard deviation of 0.016 mm, and that estimates by five<br />
different experimenters of the same disc gave a standard<br />
deviation of 0.034 mm. It seems clear that maximum penetration<br />
can be measured to sufficient accuracy to justify<br />
setting the permitted maximum at I mm, thus approaching<br />
the ideal criterion of zero penetration (since any permanent<br />
deformation of the disc shows that its yield strength was<br />
exceeded in the impact).<br />
U. K. test series to evaluate revised proposed<br />
legislative test<br />
In order to gain experience of the use of the revised<br />
proposed legislative test procedure under realistic conditions,<br />
TRRL awarded a contract to MIRA in March 1988 to<br />
carry out a series of tests on the steering wheels from eleven<br />
recent popular saloon cars, plus the TRRL/Sheller Clifford<br />
Safety Wheel.<br />
The tests were conducted to the procedure set out in the<br />
document ERGA S33 Rev I and incorporating all of the<br />
changes mentioned in the previous section. Two samples of<br />
each steering wheel were tested at each of the five impact<br />
positions, (that is, the four specified positions plus a further<br />
point chosen by MIRA to repre$ent the point judged to offer<br />
the worst hazard, not covered by the other four).<br />
The tests were conducted on the MIRA Head Impact<br />
Pendulum Rig, using a specially constructed pendulum having<br />
an effective mass of 6.8 kg and a centre of percussion<br />
coincident with the centre of the disc mounting face' This<br />
was achieved by designing the beam to extend below the<br />
centre of the impact face and above the pivot point by the<br />
correct amount. The pendulum incorporates two accelerometers,<br />
measuring the acceleration of the impact mass<br />
centre along a tangent to its arc of movement. The speed of<br />
the pendulum just before impact was measured optically.<br />
The impact velocity of the pendulum was determined by its<br />
position when released.<br />
The steering wheel was mounted on a rigid anvil for the<br />
test, using a steel stem to simulate the column inner shaft.<br />
The wheel's mounting on the anvil allowed a minimum of<br />
150 mm clear space behind the wheel. Care was taken to<br />
ensure that the profile ofthe end ofthe shaft and the securing<br />
nut matched that of the original components.<br />
The signals from the accelerometers and the photoelectric<br />
speed measuring device were amplified and passed<br />
to a digital data acquisition system, with a U.V. recorder<br />
providing a back up. The signals also passed through a low<br />
pass filter unit, having a re$ponse to SAE J 2l I Class 10fi)'<br />
The honeycomb material used for the discs was equivalent<br />
material to that specified in the TRRL Working Paper,<br />
but was obtained from a different manufacturer, namely<br />
Hexcel (UK) Ltd. The difference allowed a comparison of<br />
materials of nominally similar specification from different<br />
manufacturers.<br />
The honeycomb material was supplied in a continuous<br />
sheet 50 mm thick. Discs were cut from the sheet using a<br />
280<br />
circular cutter in the form of a cylinder of 150 mm inside<br />
diameter and 2 mm thickness, chamfered at one end to form<br />
a sharp edge at the inside. After cutting, the discs were<br />
inspected for irregularities in their cell structure and surface<br />
blemishes.<br />
The discs were then prepared for pre-crushing by lightly<br />
deforming the foil edges all over one surface using light<br />
hammer blows. and were then crushed to a thickness of 40<br />
mm,<br />
The crushing was conducted in a compression test machine,<br />
set to a crush speed of l2 mm/min. A loadcell was<br />
fitted between the fixture and the test machine crosshead to<br />
record the crush load and a potentiometer to record the<br />
deflection. The signals from these were amplified, passed<br />
through a low pass filter set to SAE J2l I Channel Class 60,<br />
and recorded on a digital recording apparatus. After crushing,<br />
the disc was again inspected and was then identified<br />
with a code number in marker ink on its crushed surface.<br />
The crush load and deflection of the specimen were plotted<br />
on a graph which was kept with the specimen for further<br />
examination.<br />
Results of U. K. test series-honeycomb<br />
performance<br />
A total of l4l discs were cut from the Hexcel mflterial.<br />
Three of these were rejected due to irregularities in theircell<br />
structure and the remainder were subjected to pre-crushing.<br />
The mean crush load of each of these in the last 2 mm of<br />
crush (8 to l0 mm deflection range) was noted. The mean of<br />
this value for all of the specimen$ was 30. 13 kN with a<br />
standard deviation of I.59 kN; this conesponds to pressure<br />
values of I.705 N/mm2 and 0.09 N/mm2 respectively. lt can<br />
be seen that this mean value is very close to the mean of 1.7 I<br />
N/mmz measured by TRRL in the Aeroweb sample, although<br />
it is again rather higher than the pre$$ure required to<br />
match the facial bone performance. This difference strongly<br />
favours the manufacturer, since a wheel which is upto24Eo<br />
higher in crush pressure than the original quoted threshold<br />
will still pass the test when using this material.<br />
In order to improve repeatability it was suggested by<br />
TRRL that all discs having a mean crush load outside the<br />
range 28 kN to 32 kN should be rejected. This led to I 2 discs<br />
being rejected which represents 8.57a ofour original stock.<br />
Results of U. K. test series*steering wheel<br />
performance<br />
The results obtained from the series oftests are given in<br />
table I . The pass/fail criteria proposed for the legislative test<br />
requires a penetration of the honeycomb not exceeding I<br />
mm and an impactor acceleration not exceeding 80 g for<br />
more than a 3 ms cumulative period.<br />
Reference to the table shows that, of the twelve types of<br />
wheel tested only one, the TRRl/Sheller-Clifford wheel,<br />
satisfied both requirements at all five positions. Of the other<br />
wheels, five failed at two positions, two at three positions,<br />
two at four positions and two at all five positions. It should<br />
be pointed out that, in several instances where failure oc-
Table 1. Results of UK Teat Serlea (11 PopulEr European Saloon Cars)<br />
Ychlcls Ht$ Spokr<br />
/Rrl<br />
Lrnctlon<br />
A<br />
B<br />
c<br />
D<br />
E<br />
F<br />
G<br />
H<br />
I<br />
J<br />
K<br />
ftIEEL T 2<br />
XIIEEL I<br />
z<br />
TTIEEL I<br />
2<br />
XI{EEL I<br />
2<br />
XTIEEL I<br />
2<br />
THEEL I<br />
2<br />
XI{EEL I<br />
z<br />
ITIEEL I 2<br />
T}IEEL I 2<br />
TI{EEL I 2<br />
XTIEEL I<br />
2<br />
TRRL SAFETY XTIEEL I<br />
rRRL SAFETY iHEEL Z<br />
L'4.J<br />
148.9<br />
lzt.5<br />
tz7.j<br />
Itt.8<br />
ut.r<br />
lzu.0<br />
125.8<br />
82.8<br />
84.0<br />
78. r<br />
78,7<br />
100.5<br />
l0?. r<br />
1t4.5<br />
lto. '<br />
I20.9<br />
120.6<br />
126.6<br />
115.6<br />
t4t. t<br />
l?8.0<br />
7r.0<br />
72.9<br />
I rr CuilIstlvc Exccrdcncr (g) Hrxlrrr Honoycol$ Ptnrtrrtlon (m)<br />
4r,1<br />
tl.8<br />
40.5<br />
TB.'<br />
]6.8<br />
t5.0<br />
4{t,0<br />
19.0<br />
rt.8<br />
4t.8<br />
t1.5<br />
44,5<br />
48.5<br />
48.0<br />
4t. t<br />
49.I<br />
47.8<br />
47,2<br />
49.7<br />
49.5<br />
49.'<br />
tI.8<br />
28.0<br />
27.r<br />
Short<br />
Rfn<br />
tr.5<br />
4r.6<br />
t0.0<br />
t0. t<br />
22.O<br />
22.7<br />
?8.8<br />
29.8<br />
41.7<br />
t7.t<br />
40.t<br />
,7.7<br />
t4.5<br />
16.t<br />
2r.,<br />
?4.0<br />
,7.6<br />
t9.r<br />
21.o<br />
28.0<br />
29.0<br />
t].0<br />
tt?.2<br />
hI.J<br />
Long<br />
Rtr<br />
22.'<br />
2r.6<br />
24.0<br />
zJ.5<br />
?4.6<br />
24.1<br />
10. t<br />
18.9<br />
2J,7<br />
2t.8<br />
2I.6<br />
t0.5<br />
50.0<br />
67.2<br />
69.8<br />
20.7<br />
20.8<br />
22.j<br />
?J.O<br />
2r.0<br />
2r.8<br />
2,.6<br />
ltt.2<br />
curred at more than one point, one of these points was a<br />
"worst<br />
case" position which may have been closely related<br />
to one of the other positions and not a distinct part of the<br />
wheel in its own right. Of the 34 instances of failure<br />
amongst the whole group, 8 were due to acceleration alone,<br />
l5 due to penetration alone and I I due to both acceleration<br />
and penetration.<br />
It can be seen that, although none of the commercially<br />
available wheels selected fully met the requirements, a large<br />
group were only marginally outside the test requirements<br />
and possibly require only minorchanges to be able to satisfy<br />
the propo$ed legislation.<br />
Considering the repeatability of the results, the mean<br />
difference between the cumulative 3 ms exceedence (acceleration<br />
level exceeded for a total of 3 ms) values for equivalent<br />
positions on two similar wheels is 3.1 g. The mean<br />
difference between maximum penetration values between<br />
equivalent positions on similar wheels is 0.32 mm.<br />
IorBt<br />
Ciaa<br />
t6.9<br />
It,9<br />
1r2.0<br />
rll.0<br />
rto.6<br />
r08.0<br />
Itr.8<br />
1t7.0<br />
85.1<br />
86. r<br />
78.0<br />
76.9<br />
94.8<br />
8r. t<br />
152.9<br />
Itl.5<br />
84.2<br />
81. r<br />
rlt.6<br />
It?.?<br />
88.5<br />
90,0<br />
25.2<br />
29.5<br />
HLb Spokc<br />
/Rlr<br />
Junctlor<br />
7.2<br />
7.0<br />
2.2<br />
1.05<br />
0<br />
0.1<br />
r,6<br />
2.t<br />
0<br />
0.1<br />
0<br />
0<br />
0.0t<br />
0.1<br />
2.5<br />
2.2<br />
0.t<br />
0.1<br />
2.0<br />
1.9<br />
2.6<br />
2.9<br />
0<br />
0<br />
0,6<br />
0.r<br />
1.8<br />
t.4<br />
r.tt<br />
2.7<br />
0.6<br />
0.7<br />
0<br />
0.4<br />
2.7<br />
2.'<br />
z,e<br />
2,5J<br />
2.6<br />
2.6<br />
0,65<br />
0.25<br />
0.8<br />
0.65<br />
2.77<br />
t.r5<br />
0.1<br />
0<br />
Short<br />
Rin<br />
0<br />
0,t<br />
0.15<br />
0.2<br />
0,2<br />
0.5t<br />
t,0<br />
0.6<br />
0.45<br />
0,9<br />
0.7t<br />
0.I5<br />
2.7,<br />
2.9'<br />
l.t<br />
2.0<br />
0.75<br />
1.00<br />
z.r,<br />
2.60<br />
2,r5<br />
r.8<br />
0<br />
0.2<br />
Long<br />
Rir<br />
0<br />
0.t<br />
2.7<br />
1.75<br />
0.t<br />
0.2<br />
o.7,<br />
0.4<br />
0.6<br />
0.4<br />
1.7<br />
0.8<br />
l.d<br />
l. tt<br />
2.,<br />
l.t<br />
0.4<br />
0.4<br />
0.85<br />
0,80<br />
l.l5<br />
0.85<br />
o.z,<br />
0<br />
Further developments of legislative test<br />
llorrt<br />
Cuc<br />
0.4<br />
I.7<br />
2.6<br />
2.0<br />
0.4<br />
0<br />
2.6<br />
,.2<br />
0,2<br />
0,15<br />
0<br />
0<br />
0<br />
0<br />
l.r<br />
l.6t<br />
0.7t<br />
0.9t<br />
l.tt<br />
r.50<br />
,,2<br />
5.t5<br />
After the previously described series of tests had been<br />
conducted, increasing interest in the possibility ofnew legislation<br />
led to agreement within the ERGA Group that a<br />
programme of comparative trials should be carried out by<br />
several test houses throughout Europe. The participating<br />
bodies are: Netherlands (TNO), West Germany (BASI),<br />
United Kingdom (MIRA), France (UTAC) and Italy (FIAT).<br />
The proposed series of tests involves impacts using a<br />
modified form of the legislative test on three production<br />
steering wheels. These were selected for their general avail-<br />
ability, and were from the 1980 Ford Cortina Mk 4, 1984<br />
Ford Escort, and the 1987 GM/Vauxhall Cavalier. While all<br />
ofthese designs have since been superseded, they are typical<br />
examples of high-volume steering wheels of their re-<br />
spective dates.<br />
Each wheel is required to be tested at the stipulated im-<br />
0<br />
0
pact positions on the centre of the hub and the spoke/rim<br />
junction. Each facility will test each of the wheels 5 times at<br />
each of the positions. The test results are then to be compared<br />
to establish the repeatability ofresults between different<br />
test rigs at different facilities. In addition, the results are<br />
to be compared with results of tests involving the use of a<br />
rigid head form similar to that used in existing <strong>Int</strong>erior<br />
Fittings legislation. The revised technique adopted for these<br />
tests incorporates four main changes designed to improve<br />
the repeatability and resolution of the results obtained.<br />
The first change is in the pre-crushing procedure for the<br />
honeycomb. One feature of the crush characteristics of the<br />
honeycomb material is the fluctuation in load which occurs<br />
over the nominally flat portion of the load deflection curve.<br />
This occurs as a consequence of the folding which takes<br />
place in the foil. It was felt that the variation in crush load<br />
between different discs could be considerably reduced ifthe<br />
crushing procedure were changed to allow the crush to be<br />
terminated at a given level of load in its fluctuation' rather<br />
than a fixed deflection as before.<br />
To achieve this, it wa$ proposed that the disc should be<br />
crushed to an appropriate thickness and then, without stopping<br />
the crush, the operator should wait until the risirrg load<br />
curve achieved the chosen threshold level. The crush would<br />
then be stopped immediately. Subsequent crushing of the<br />
disc during the wheel impact test would then continue at the<br />
threshold value. Trials of the new method proved that the<br />
technique was feasible, provided the crushing deformation<br />
rate could be reduced to approximately 4 mm/min.<br />
Tests conducted at the same time using round-edged<br />
probes penetrating limited areas of the disc surface led to the<br />
discovery that the "skin" formed on the surface of the disc<br />
by the folded Iayers of foil had a significant effect in the way<br />
the disc responded to limited areas of high pressure. In other<br />
words, the reinforced surface layer of deeply crushed discs<br />
tended to spread the effect ofa local high pressure area over<br />
a greater number of cells, reducing the disc's ability to<br />
detect such features. For this reason, it was decided that the<br />
honeycomb crush deflection should be reduced to a minimum.<br />
and therefore crush deflection limits of 2.5 mm to 3'5<br />
mm were adopted. This appears to be the minimum practical<br />
level of crush, considering the thickness lost in folding over<br />
the foil edges and the need to achieve a full peak to ensure<br />
crushing is occurring all over the top surface.<br />
The second change put forward was in the direction of the<br />
impact device in striking the wheel. It had long been recogni$ed<br />
that the previous stipulation (that the impact is directed<br />
perpendicular to the plane of the wheel) could lead to<br />
discs being deformed to a wedge shape when striking a hub<br />
surface which slopes in relation to the plane of the rim- The<br />
result of such a test would be a deformation occurring mainly<br />
outside the central 100 mm diameter zone (and also very<br />
difficult to measure). The procedure was therefore revised<br />
to allow for the impact to be re-aligned at up to 30 degrees<br />
from the original direction so that the face of the disc was<br />
parallel to the wheel sutface, or at a tangent to some "high<br />
spots" on the wheel.<br />
282<br />
The third change was in the technique of measuring the<br />
penetration. A new apparatus was designed by BASI in<br />
Germany similar to the measurement clamp described<br />
above but with a mask recessed into the top surface. This<br />
mask incorporates an array of holes which covets the central<br />
100 mm diameter measurement area. The mask may be<br />
aligned with the honeycomb to place the holes in line with<br />
the flat sides of the honeycomb cells. A probe is then lowered<br />
into the holes to measure the depth below the datum<br />
surface of the plate. The apparatus incorporates a base plate,<br />
onto which the disc is fastened by three serrated pins engaging<br />
in the cells of the honeycomb. The undeformed disc's<br />
surface is first measured, then the base plate and disc are<br />
transferred to the impact rig as a unit, then they are retumed<br />
to the measurement apparatu$ in the same alignment to be<br />
re-measured.<br />
<strong>Int</strong>ernational test series{hanges to impact<br />
rig requirements<br />
As well as the changes to the honeycomb preparation<br />
procedures described above, it was agreed to standardise the<br />
type of impact rig used for those tests, to remove one source<br />
ofvariability between countries. The test chosen is a vertical<br />
drop rig with the 6.8 kg impactor being guided in a<br />
straight line during the 24.1 km/h impact. This was preferred<br />
to a pendulum rig because pendulum design is complicated<br />
by the need to achieve the correct effective mass of 6.8<br />
kg while making the centre of percussion coincide with the<br />
impactor. Also the required mass distribution of the pendulum<br />
and its stiffness both in torsion and in bending should<br />
be specified to ensure that the honeycomb faceform cannot<br />
rotate significantly during impact and that nearly all the<br />
pendulum's kinetic energy is delivered rapidly to the wheel'<br />
Otherwise, as an extreme example, a pendulum consisting<br />
of a heavy chain carrying a light plate behind the honeycomb<br />
could be used to meet the energy/speedlmass requirements<br />
while allowing any wheel to pass! It would clearly<br />
have taken too long for all the test houses involved in this<br />
programme to agree on a pendulum design and to build new<br />
rigs, so a vertical drop rig was chosen.<br />
A free drop (unguided during impact) rig was considered<br />
but was rejected because slight errors in impact point on the<br />
wheel rim produce large differences in the free headform's<br />
motion as it rotates round the rim and spins off; if this<br />
happens the required energy of 152 J (from 6'8 kg moving<br />
atZ4.l fm/h) is not of course being absorbed by the wheel'<br />
A fully guided vertical drop rig therefore appears to be the<br />
best choice for this wheel impact test.<br />
Results of international test series-disc<br />
performance<br />
In addition to its role as one ofthe test houses participating<br />
in this study, MIRA was also called upon to prepare all<br />
of the honeycomb discs used in the te$ts. A further batch of<br />
Hexcel honeycomb material was ordered and a total of 210<br />
discs prepared.<br />
The new technique involving the crushing being abruptly
stopped at the threshold load proved relatively easy to carry<br />
out at the 4 mm/min crushing rate. However, variations<br />
between discs in the way the crush load fluctuated meant<br />
that in many cases it was not possible to achieve the threshold<br />
load of 3 I t 0.5 kN on a rising curve within the specified<br />
crush limits and 50 discs (247o of the total) were rejected<br />
because of this. Of the remaining specimens, however, the<br />
crush terminal load proved to be very consistent, with a<br />
standard deviarion of 0. l3 kN.<br />
Results of international test series-steering<br />
wheel performances<br />
Only the UK results are available at the time of writing,<br />
and these are summarised in tables 2 and3.In addition to the<br />
three production wheels, designated L, M and N in the<br />
tables, the UK programme also tested the TRRL/Sheller<br />
Clifford Safety Wheel.<br />
In these table$ the honeycomb indentation depths given<br />
are those measured using the TRRL method described on p7<br />
above, rather than using the German apparatus described on<br />
pl l. Trials with the Cerman apparatus on typical test discs<br />
showed that the mask with its array of holes was very timeconsuming<br />
to use, and in most cases no hole coincided with<br />
the lowest part of the dent. Measurements through the holes<br />
were therefore being taken from the sloping sides of the dent<br />
rather than from its flat bottom, and were neither as repeatable<br />
nor as accurate as those made by the much simpler and<br />
quicker TRRL method.<br />
Considering the honeycomb faceform tests first, the tables<br />
show good repeatability borh for indenrarion depth and<br />
for deceleration. On spoke/rim impacts, table 3, all four<br />
wheels passed on decelerarion (80 g/3ms; but only rhe<br />
TRRL/Sheller Clifford wheel passed on indentation ( I mm<br />
maximum allowable). Wheel L, with a mean dent depth of<br />
1.60 mm, was fairly close to passing, but the other two<br />
designs had dents of over twice the allowable depth. On the<br />
hub impacts, table 2, rhe TRRL/Sheller Clifford wheel<br />
passed easily on both dent depth and deceleration, and<br />
wheel L passed easily on dent depth and passed marginally<br />
on deceleration. The other two wheels failed very definitely<br />
on indentation depth ( I 9.6 and 5.6 mm) and wheel M clearly<br />
failed on 3ms deceleration. Wheel N showed extremely<br />
high peak deceleration levels but 3 out of the 5 samples<br />
passed on their 3 ms levels. This illustrates a well-known<br />
problem with using the 3 ms criterion-if the impactor hits a<br />
rigid non-yielding structure, a huge force will be developed<br />
on it but the whole speed change may be over in less than 3<br />
ms. This can give'a spurious pass result for a design which<br />
would be highly dangerous in a real head impact. To avoid<br />
the problem it has been suggested previously (19) that the<br />
principle of using a low-pass filter with a high cut-off frequency<br />
(eg CFC lfi)O) and a 3 ms window should be replaced<br />
by using a much lower cut-off frequency (eg CFC<br />
60) and a simple measure of peak deceleration. But this<br />
change has not been accepted for legislative use, and in<br />
practice the matter has not been important in Reg 2l testing<br />
because real car structures yield far enough to spread the<br />
deceleration pulse over longer than 3 ms. However, this is<br />
not true in the proposed steering wheel test, when the wheel<br />
alone is being tested on a rigid mounting, and a further<br />
criterion may be necessary to prevent manufacturers from<br />
arguing that a very hard wheel actually passed the letter of<br />
the test. Possibilities would be to use a lower CFC or to<br />
specify a maximum allowable peak figure of say 200 g as<br />
well as the 80 g/3 ms limit.<br />
The very deep dent in the honeycomb made by wheel M<br />
was cau$ed by the $teering column end, which projects<br />
about 20 mm from the wheel centre in this design and is<br />
covered only by a thin plastic trim which was punched<br />
through by the column end in each test. A major attraction of<br />
the proposed honeycomb test is that it would prevent this<br />
type of wheel mounting, which is now used by many manufacturers,<br />
from being fitted in future car designs.<br />
Tuming now to the suggested altemative of using a rigid<br />
spherical headform test, in spoke/rim impacts table 3 shows<br />
that all the 3 ms deceleration figures are well below 80 g.<br />
Since deceleration is the only measurement which can be<br />
made in this test, all the wheels would pass. This test clearly<br />
cannot detect the fact that the thin hard rims of wheels M and<br />
N would produce high local pressures which could break<br />
face bones, as shown by the honeycomb results in table 3.<br />
As mentioned above, (5) shows that spoke and rim impacts<br />
account for about 2/3 of all drivers' face injuries from their<br />
wheels, so the inability of a rigid headform test to detect<br />
dangerous spoke and rim designs makes it unsuitable for use<br />
in legislation.<br />
On the rigid headform hub impacts, table 2 shows rhat all<br />
four wheel designs greatly exceed the allowable 80 g. This<br />
was of course to be expected for designs M and N, as the<br />
headform simply hits the rigid end of the steering wheel<br />
mounting shaft, with no yielding structure. Testing of wheel<br />
N was stopped after two such impacts as the 500 g limit of<br />
the instrumentation was being exceeded. Wheel M was tested<br />
once at l/3 the standard speed (8.1 km/h instead of 24.1<br />
km/h), when it produced over 260 g. When used in cars<br />
these wheels would be mounted on steering columns designed<br />
to pass the Reg l2 ("Black Tufy") resr by yielding at<br />
below I l.l kN, which corresponds ro I I 100/6.8 X 9.81 :<br />
166 g, and so headform decelerations above this figure are<br />
not realistic.<br />
The TRRL/Sheller Clifford design and wheel L have rhe<br />
steering column end set well below the surface of the wheel,<br />
which is designed to yield to absorb energy. This feature<br />
worked well to produce low deceleration figures in the<br />
honeycomb tests, but in the rigid headform tests the spherical<br />
shape of the impactor allowed it to sink so far into the<br />
wheel padding that it hit the steering column end before it<br />
had stopped, whereas the flat honeycomb faceform had<br />
been decelerated more quickly immediately atter touching<br />
the wheel padding and so had stopped before reaching the<br />
column end. Since the flat disc is a more accurate representation<br />
of the shape of the human face than is the spherical<br />
headform (which was chosen to represent the round parts of<br />
the skull not the face), we feel that the high deceleration<br />
283
Table 2. Wheel Test Results. Flub Impacts Gulded Drop Flg Tests<br />
284<br />
l{heel<br />
TypeL<br />
I<br />
2<br />
1<br />
4<br />
5<br />
Hean<br />
Stsndard<br />
Deviation<br />
TyFeM<br />
I<br />
2<br />
1<br />
4<br />
5<br />
Mean<br />
Sbendard<br />
Devlation<br />
TypeN<br />
I<br />
z<br />
1<br />
4<br />
5<br />
Mean<br />
Standard<br />
Deviation<br />
TRRL/SheIler<br />
Clifford<br />
Safety Wheel I<br />
2<br />
,<br />
4<br />
,<br />
Mean<br />
Standerd<br />
Deviation<br />
DeFormable Honeycomb<br />
FeeeForm Tests<br />
Peek Decel ]ms DEcEI Max Dent<br />
I tl DePth'<br />
mm<br />
88.4 79.1 0.06<br />
87.4 78.0 0.05<br />
98.9 82.2 g.5Z<br />
99.7 77.5 0.06<br />
82.9 72.6 0,0J<br />
Bg.7 77.9 0.r4<br />
5.89 '.47 0,21<br />
241 ll9 L9.2<br />
2t8 rr} 2].0<br />
alt 99.7 r8,8<br />
22J Il4 18.2<br />
217 lZ2 18.7<br />
227 rI].5 19.6<br />
L2.6 8.56 1.94<br />
4rl 99.2 4.84<br />
68.4 6.04<br />
4lI 68.6 5.8]<br />
464 6]. r 5.91<br />
84.0 5.40<br />
429 76.7 5.61<br />
I0.0 r4.8 0.49<br />
74.J 70.4 0.0'<br />
7r.o 70.5 0.05<br />
7L.7 67.8 0.0I<br />
90.5 72,1 0.06<br />
76.8 7I.5 0.0]<br />
75.1 70.5 0.04<br />
1.47 1.65 0.014<br />
Rigid Spherical<br />
Impactor TEets<br />
PEak Jms<br />
Decel Decel<br />
s 9<br />
221 lr4<br />
254 rl0<br />
2r4 r04<br />
165 98.?<br />
L5? 92,6<br />
292 I0'.8<br />
42.' 8.7<br />
267 48.5<br />
( et 8.I<br />
kn/h)<br />
Not tesbedl<br />
See tExt<br />
511+ Il0<br />
526+ L57<br />
Not testedr<br />
Ses text<br />
I44<br />
19.l<br />
t88 102.6<br />
I87 98.6<br />
I79<br />
r99<br />
?L'<br />
96.9<br />
102.1<br />
106.'<br />
19' l0I.'<br />
r}.l ,.67
Table 3. Wheel Test Fesults. Spoke/Rlm Impactt Gulded Drop Flg Teats<br />
Wheel<br />
TypeL<br />
I<br />
2<br />
1<br />
4<br />
5<br />
Mean<br />
SbEndard<br />
Deviation<br />
Type<br />
H I 2<br />
1<br />
4<br />
5<br />
l'lean<br />
Standard<br />
Deviation<br />
TyPeN<br />
I<br />
z<br />
,<br />
4<br />
5<br />
Heen<br />
Sbanderd<br />
Devistion<br />
TRRL/Sheller<br />
Cll Fford<br />
Safety l{heel<br />
Mean<br />
StandErd<br />
Deviation<br />
I<br />
2<br />
j<br />
4<br />
5<br />
Deformable Honeycomb<br />
Faeeforn Tests<br />
Peak Decel ]ms Decel l,lex Dent<br />
I I Deptht<br />
mm<br />
106 6r.2 2.04<br />
I07 67.4 L77<br />
104 60,0 l.lg<br />
106 61.] L,52<br />
I09 65,0 I.50<br />
106.4 63.4 1,60<br />
l.B2 2.94 0. f 2<br />
101 70.0 2,9?<br />
I0l 66.7 ,.67<br />
106 6].0 2,5L<br />
104 60.0 2,27<br />
r05 51.7 2,4L<br />
lo].g 64.' ?.74<br />
L,gz 4,94 0.56<br />
lll 66.4 2,50<br />
105 58.7 2.88<br />
107 58.?. 1.6]<br />
108 J6.' 2.27<br />
r04 56.2 2.72<br />
1.07.4 59.2 2.40<br />
],5I 4.16 0.49<br />
52.2 Jt.g 0.0t<br />
4J. r t4.? 0,06<br />
52.J ,4,' 0.09<br />
44.1 t4.0 0.10<br />
48.5 11 .7 0.10<br />
48.0 ,4.4 0.07<br />
4.11 0.7J 0.0]<br />
Rigid Spherical<br />
Impector Tests<br />
PEek Jms<br />
Decel DecEl<br />
g 9<br />
97.1 52.7<br />
95.7 5r.5<br />
89.J 5t.0<br />
88.5 48.0<br />
94.2 45.6<br />
9t,0 50.?<br />
t,9l i,?l<br />
tt6 J6.5<br />
llg 5l.g<br />
II7 65.I<br />
120 65.1<br />
Il' 60.4<br />
117.0 61.8<br />
2.74 J.60<br />
r00 51.0<br />
lot 4J,2<br />
104 46.7<br />
107 '9.7<br />
r04 45.5<br />
roi,z 49,2<br />
2,77 6.51<br />
29,9 26.7<br />
,r,4 28.4<br />
t4.8 27.9<br />
t0.l 28,7<br />
29.9 26.'<br />
]1.6 ?1.6<br />
2.r2 1.05
levels found with the TRRL/Sheller Clifford design and<br />
wheel L indicate that the test method rather than the wheel<br />
designs is wrong. However if a manufacturer wishes to<br />
make wheels which pass this impact test with either a rigid<br />
spherical impactor or a flat honeycomb disc this could easily<br />
be done by using a greater depth of soft hub padding.<br />
To sum up these test results given in tables 2 and 3, it is<br />
clear that the rigid headform test would not be satisfactory<br />
because it cannot detect dangerous wheel designs which<br />
could produce face bone fractures. The honeycomb faceform<br />
test has been shown to have good repeatability and to<br />
be able to discriminate clearlv between different wheel<br />
designs.<br />
Steering Wheel Design Requirements<br />
to Pass the Faceform Test<br />
For the deceleration criterion part of this test and<br />
considering the wheel hub impact, the first e$sential is of<br />
course to use padding which provides a long enough<br />
distance for the impactor to stop before it hits the end of the<br />
steering column, without exceeding 80 g. Assuming the<br />
ideal case of constant deceleration at 80 g, the stopping<br />
distance required from velocity Y = 24.1km/h is given by<br />
5 = yz/2a = 28 mm, but in practice at least twice this figure<br />
should be used to allow for a more realistic deceleration<br />
curve. This necessary deceleration distance could of course<br />
be achieved by the wheel designer either by crushing foam<br />
plastic or by deforming metal, but the chosen method must<br />
not cause a local pres$ure which is high e;rough to deform<br />
the aluminium faceform in the test, ie. about 1.7 N/mm. The<br />
wheel designer must also make sure that if a large area of<br />
padding is used this padding is soft enough not to produce a<br />
total force on the whole faceform which gives a deceleration<br />
above 80 g, ie 80 X 6.8 X 9.81 = 5340 N. The faceform has a<br />
diameter of 150 mm and an area of 177fi) mm2, so if the<br />
padding covers the whole disc area then its crush strength<br />
must not exceed 534Oll77OO = 0.30 N/mmz.<br />
Considering rim impact, table 3 shows that deceleration<br />
is not critical for any of the wheels te$ted, because they all<br />
yield well below the force of5340 N needed to produce 80 g<br />
with 6.8 kg. But the problem now is to limit the pressure on<br />
the honeycomb to I .7 N/mmz. If a rim yield strength of 3330<br />
N is assumed (which would produce 50 g on the faceform)<br />
then this load must be distributed over at least an area of<br />
3330/l .7 : 1960 mmz. If the length of the "contact patch"<br />
between the rim and the faceform is approximately 150 mm<br />
(the faceform diameter) then the average width of this patch<br />
must be at least 1960/150 = l3 mm. Since many high quality<br />
steering wheels use rim section diameters of 25 or 30 mm<br />
this contact patch width requirement is quite reasonable, but<br />
it may require the designer to u$e a "chunky, soft feel" rim<br />
and to locate any reinforcing metal in this rim as far as<br />
possible away from the driver's face. On initial impact this<br />
will allow the wheel rim rather than the honeycomb to<br />
deform and spread the load over a large enough area to limit<br />
the contact pressure to 1.7 N/mmz. Similarly the wheel<br />
286<br />
spokes must be well padded and must be designed to yield at<br />
a suitable load when impacted. This will be easier to achieve<br />
with 3 or 4 spoke wheels but careful design should allow I<br />
or 2 spokes to be used if necessary for styling reasons; table<br />
3 shows that production wheel L, a 2 spoke design, came<br />
fairly close to passing the rim impact honeycomb test.<br />
This test may eliminate thin hard steering wheel rims, but<br />
may also make it difficult to provide a rim which is strong<br />
enough to be used by a large man to push his car out of a<br />
snowdrift, for example. However, this seems a small price<br />
to pay in return for a large reduction in face bone fractures.<br />
The design features described above (deep soft padding<br />
over the hub, thick soft rim with the reinforcing metal<br />
Iocated away from the driver, 3 or 4 spokes well padded and<br />
designed to yield when hit) have all been used in the TRRL/<br />
Sheller Clifford safety wheel, figure l. Fifty of these wheels<br />
have been in road service since 1986 in Police, Army, and<br />
private Metros, with no reported problems and with users<br />
expressing a strong preference for these wheels over the<br />
standard ones. GM and Volvo wheels using the same design<br />
principles are already in widespread use, and while not quite<br />
meeting the proposed test requirements they would only<br />
need minor changes to do so. It is therefore clear that the<br />
honeycomb te$t can be passed by wheels of acceptable<br />
appearance and cost, and that provided the results from the<br />
other European countries confirm our findings on the<br />
repeatability and practicality ofthe test, there are no sound<br />
reasons to delay its introduction into legislation.<br />
Conclusions<br />
l. Recent accident data from UK and other countries have<br />
confirmed the results of earlier studies showing that in<br />
frontal crashes drivers wearing lap/diagonal seat belts often<br />
suffer brain damage and face bone fractures from hitting<br />
their steering wheels.<br />
2. Possible ways of reducing these injuries include the use<br />
of seat belt pretensioners and/or air bags, but these may be<br />
too expensive for widespread use in popular cars soon. A<br />
good cheap and quick way forward is therefore to improve<br />
the design of steering wheels to rnake them less likely to<br />
cause injuries when struck.<br />
3. Biomechanical data suggest that brain and face injuries<br />
are unlikely if the head deceleration during impact is kept<br />
below 80 g and the local pressure on the face is kept below<br />
1.4 N/mmz (200 psi).<br />
4. An energy absorbing steering wheel has been<br />
developed by TRRL and Sheller Clifford which can meet<br />
these requirement$ in an ECE Reg 2I|FMVSS 201 impact<br />
test (6.8 kg at 24.1 km/h, 15 lb at 15 mph). Road use has<br />
shown that this wheel is attractive to drivers and it would<br />
cost little, if any, more than standard non-energy-absorbing<br />
wheels. The paper has described the design requirements<br />
for this safety wheel.<br />
5. At the lOth <strong>ESV</strong> <strong>Conf</strong>erence in 1985 TRRLproposed a<br />
modification to the Reg 2I/FMVSS 201 <strong>Int</strong>erior Fittings<br />
impact test by which an aluminium honeycomb faceform of
specified crush strength would be used instead of the<br />
standard rigid headform. This would en$ure that the<br />
allowable level of pressure on the driver's face is not<br />
exceeded in a steering wheel impact. The present paper has<br />
described subsequent development of this test to improve its<br />
repeatability. Results of tests on production steering wheels<br />
have been given which show that the current version of the<br />
test is highly repeatable, can discriminate between different<br />
designs of wheels, and is easily carried out by a competent<br />
test establishment.<br />
6. Results of similar tests on three designs of production<br />
wheels are now awaited from test houses in France.<br />
Holland, Germany and Italy for presentation to the EEC<br />
ERGA Working Group on Passive Safety. If these confirm<br />
the UK results given in this paper it is hoped that legislation<br />
can be agreed very $oon to require all steering wheels sold in<br />
Europe to meet this honeycomb faceform test.<br />
Acknowledgements<br />
The work described in this paper forms part of the<br />
programme of the Transport and Road Research Laboratory<br />
and the paper is published by permission of the Director.<br />
Crown Copyright. The views expressed in this paper are not<br />
necessarily those of the Department of Transport. Extracts<br />
from the text may be reproduced, except for commercial<br />
purposes, provided the source is acknowledged.<br />
References<br />
(l) Department of Transport, Compulsory Seat Belt<br />
Wearing, HMSO, London. October 1985.<br />
(2) Rutherford W.H. et al, The Medical Effects of Seat<br />
Belt Legislation in the United Kingdom, DHSS Research<br />
Report No. 13, HMSO, London, 1985.<br />
(3) Evans L. Occupant Protection Device Effectiveness in<br />
Preventing Fatalities, Proceedings of llth <strong>Int</strong>emational<br />
<strong>Conf</strong>erence on Experimental Safety Vehicles, Washington,<br />
USA, May 1987.<br />
(4) Mackay G.M. et al, The Methodology of In-Depth<br />
Studies of Car Crashes in Great Britain, SAE Paper<br />
850556. Detroit 1985.<br />
(5) Bradford M.A. et al, Head and Face Injuries to Car<br />
O c c upant s I n Ac c ide nt s-F i e I d D ata 1 98JJ6, Proceedings<br />
of IRCOBI <strong>Conf</strong>erence, September 1986.<br />
(6) Harms P.L. et al, Injuries to Restrained Car<br />
Occupants-What Are The Outstanding Prablems?<br />
Proceedings of I lth <strong>Int</strong>ernational <strong>Conf</strong>erence on<br />
Experimental Safety Vehicles, Washington, USA, May<br />
1987.<br />
(7) Thomas P.D. Head and Torso Injuries to Restrained<br />
Drivers From the Steering System, Proceedings of IRCOBI<br />
<strong>Conf</strong>erence, September 1987, Birmingham, UK.<br />
(8) Cloyns P.F. et al, Steering Wheel Induced Head and<br />
Faciul Injuries Amongst Drivers Restrained By Seat Belts,<br />
Proceedings of 6th IRCOBI <strong>Conf</strong>erence, September 1981.<br />
(9) Arajarvi E. A Retrospective Analysis of Chest Injuries<br />
in 280 Seat Beh Wearers, Accid. Anal. & Prev. Vol 20 No 4<br />
pp25l-9,1988.<br />
(10) Taniere C. et al, Field Facial Injuries and Study of<br />
Their Simulatian with Dummy, Proceedings of 25th Stapp<br />
Car Crash <strong>Conf</strong>erence. l98l.<br />
(l l) Sieffert U. Occupant Protection in Motor Vehicle<br />
Accidents, SAE Paper 870490.<br />
(12) Manson P.N. Structural Pillars of the Facial<br />
Skeleton: an Approach to the Management of Le Fort<br />
Fractures, Plast. Reconstr. Surgery, 1980 July 66(l) pp54-<br />
62.<br />
(13) Manson P.N. et al,Mrdlsce Fractures: Advantages of<br />
Immediate Extended Open Reduction and Bone Grafting,<br />
Plast. Reconstr. Surgery, 1985 76 ppl-10.<br />
(14) Nahum A.M. et al, Impact Tolerance of Skull and<br />
Face, Proceedings of the I 2th Stapp Car Crash <strong>Conf</strong>erence,<br />
Detroit, 1968, SAE Paper 680785.<br />
(15) Nahum A.M. The Prediction of Maxillofacial<br />
Trauma, Trans. Am. Acad. Ophth. Otol. 1977 54 pp932-3.<br />
(16) Hodgson V.R. Tolerance of the Facial Bones to<br />
Impact, Am. J. Anat. 1967 120 ppl 13-22.<br />
(17) Petty S.P.F. and M.A. Fenn, A Modified Steering<br />
Wheel to Reduce Facial Injuries and Associated Test<br />
Procedure, Proceedings of lOth <strong>Int</strong>emational <strong>Conf</strong>erence<br />
on Experimental Safety Vehicles, Oxford, UK, July 1985.<br />
(18) Robinson B.J. and S. Penoyre, Progress Towards a<br />
European Legislative Test for Steering Wheels, TRRL<br />
Working Paper WPIr'SD 90, Nov 1987. Issued as EEC<br />
Document ERGA Sll33.<br />
(19) Penoyre S. An Impact Test Programme Using Six<br />
Models of Lower-Medium-Sized Cars, Proceedings o{ lOth<br />
<strong>Int</strong>ernational <strong>Conf</strong>erence on Experimental Safety Vehicles,<br />
Oxford, UK, July 1985.<br />
The Inertial Flow Crash Sensor and its Application to Air Bag Deployment E<br />
Vittorio Castelli and David S. Breed<br />
Abstract<br />
The results of a theoretical investigation of a crush zone<br />
sensor based on the motion of a translating mass damped by<br />
inertial fluid flow through an orifice are reported. The<br />
characteristics of such a sensor are shown to be well suited<br />
to both frontal and side impacts.<br />
<strong>Int</strong>roduction<br />
As a result of recent theoretical studies and field<br />
experience automotive engineers are directing increasing<br />
287
attention to the importance of crush zone sensing for triggering<br />
passive restraints such as air bags or seat belt tighteners<br />
(l), (?), (3), (4).*<br />
It now appears that side impact protection by means of<br />
inflatable restraints is also feasible. In this case, appropriate<br />
crash sensing must be in the crush zone although the desirable<br />
sensor characteristics may be somewhat different from<br />
the case of frontal impacts.<br />
Not much choice exists in the selection of crush zone<br />
$ensors. Ball-in-tube sensors. where the motion of a ball is<br />
damped by viscous gas flow through a small clearance, are<br />
the present industry standards. Crush detectors, which sense<br />
the progress of the crush zone in the vehicle body, are still<br />
under development.<br />
A new crash sensing device has been introduced which<br />
may possess characteristics more suitable and more easily<br />
tailored to all types of crush zone applications. It consists of<br />
an inertial mass, the travel of which is resisted by a damping<br />
force generated by inertial gas flow and thus quadratically<br />
related to the velocity. A spring provides the necessary bias<br />
force.<br />
This sensor has several favorable properties; it can be<br />
designed rather flat in the sensing direction and, thus, easier<br />
to mount; it can be designed to be much less sensitive to very<br />
short duration pulses, essential in sensing side impacts for<br />
some types of cars and an excellent property to provide<br />
immunity to hammer blows and other sharp impulses; it can<br />
be designed less sensitive to lateral vibrations than the ballin-tube<br />
sensor.<br />
Encouraged by such promise, an analytical and experimental<br />
study was undertaken to construct and validate a<br />
mathematical model for this device. The theoretical results<br />
are reported herein.<br />
Common strategies for crush zone crash<br />
sensing<br />
For orthogonal and angular frontal impacts, these authors<br />
have identified the existence of a crushing front which progresses<br />
through the vehicle in a manner characteristic of the<br />
vehicle itself, the type of crash, and the speed. Scaling<br />
techniques were introduced which help analyze the performance<br />
of a sensor in many different crashes based on data<br />
obtained in only a few tests.<br />
Proper frontal crash sensing has been performed by either<br />
crush zone sensing or pa$senger compartment (single point)<br />
sensing. These authors have recently concluded ( I ), (3) that<br />
the former strategy produces better results and has more<br />
general applicability. It requires the presence of at least one<br />
sensor within the crush zone for all crashes requiring restraint<br />
deployment. Crush sensing switches must signal the<br />
arrival of the crushing front. Other sensors must measure as<br />
closely as possible velocity change and trigger when its<br />
value equals or exceeds the injuring level (typically l0-12<br />
MPH).<br />
The sensing problem for side impacts can be stated in<br />
terms of the following principles (2):<br />
*Numbcrs in parenthcses designate rcferences at end of papcr.<br />
288<br />
(a) the time budget is very short since injuries to the occupant<br />
are the result of intrusion of the door structure.<br />
(b) the rapidity of the door structure intrusion causes passenger<br />
compartment sensing to trigger air bag deployment<br />
much too late to be effective. Crush zone sensing is necessary.<br />
The $ensors must be mounted on the door reinforcement.<br />
not on the skin.<br />
(c) at least one sensor must be in the early crush zone which<br />
means that, in many cases, up to three sensors per side may<br />
be necessary: just before the A-pillar, just after the B-pillar<br />
and at the door center.<br />
(d) in vehicles with stiff door structures, the sensors should<br />
measure velocity change threshold for short pulses (on the<br />
order of l0 milliseconds); the threshold speed should be<br />
equal to the injuring velocity change, i.e., l0-l? MPH.In<br />
cases of weaker side structures, the threshold velocity<br />
change for short pulses should be higher than injuring velocity<br />
change; possibly up to a factor of two.<br />
(e) marginal crarthes have a much increased time budget.<br />
(f1 sensing "L-crashes", where the door structure does not<br />
intrude toward the occupant, may not be as important due to<br />
the usually low level of the velocity changes involved.<br />
However, it could be accomplished by means of passenger<br />
compartment sensing.<br />
(g) the distance traveled by the occupant relative to his own<br />
vehicle before striking an injuring part of the interior is<br />
shorter than in frontal crashes. Therefore, the 5 inches minus<br />
30 millisecond criterion will have to be modified for<br />
these crashes (a further reason for its modification will be<br />
the requirement of much faster inflator action).<br />
Safing (arming) sensors for these applications could be<br />
crush sensing switches.<br />
In both frontal and side collisions, lateness in triggering is<br />
a very negative characteristic ofany sensor system because<br />
the out ofposition occupant can be injured by the deploying<br />
air bag.<br />
The inertial flow damped sensor<br />
The requirements outlined above suggest a sensor which<br />
responds to velocity change, with a response curve to acceleration<br />
pulses which can be tailored to several applications.<br />
For crush zone sensors, the response would be divided into<br />
three regions: the very short time duration, in which the<br />
threshold may be higher than the injuring velocity change;<br />
the intermediate pulse durations, in which the threshold is<br />
equal to the injuring velocity change; and the long pulses<br />
where the sensitivity decreases again. This response curve<br />
may look like the ones represented on figure l. The solid<br />
curve has the shape required for a side impact crash sensor<br />
for vehicles with weak door structures. This behavior may<br />
be deemed quite desirable for frontal crash sensing in order<br />
to provide immunity to sharp blows. The dotted curve is for<br />
side impact crash sensing in cars with very stiff side structure<br />
and displays the maximum sensitivity required of a<br />
frontal crush sensor. The ball-in-tube sensor also displays a<br />
slight decrease in sensitivity for short pulse duration.<br />
The fact that it may be desirable for the sensitivity to
20<br />
15<br />
10<br />
5<br />
0<br />
0 20 40 60<br />
Pulse Duration, msec<br />
80<br />
Side lmpact w.Soft Target<br />
Frontal lmpacts<br />
Side lmpact w.Hard Target<br />
Flgure 1. Crush Srnsor Charactsristic$<br />
decrease for acceleration pulses of short duration suggests<br />
employing a physical effect which generates force at a higher<br />
rate than linearly with increasing velocity. Hence the idea<br />
of using a damping mechanism proponional to the square of<br />
the velocity. Fluid flow through an orifice has just such a<br />
behavior.<br />
A possible implementation of such a device is depicted in<br />
figure 2. An elastic diaphragm suppon$ a sensing mass and<br />
keeps it pressed against a top stop with an appropriate bias<br />
force. An acceleration pulse in the sensing direction causes<br />
the mass to move through the deflection of the diaphragm.<br />
This motion displaces the fluid filling the cavity (probably<br />
air) and forces it to flow through the orifice. The resistance<br />
to this flow causes a pressure difference between the two<br />
sides of the diaphragm which resists the motion of the<br />
sensing mass. As long as Mach number effects on the velocity<br />
can be neglected, this pressure difference is proportional<br />
to the area of the orifice and the second power of the fluid<br />
velocity.<br />
The orifice in the figure is shown of a circular shape.<br />
Other geometries are also usable, as they might facilitate the<br />
design of the diaphragm.<br />
Mathematical sensor model<br />
A very useful tool in adapting a sensor to a variety of real<br />
crash applications is a realistic mathematical model. Under<br />
Flgura 2. InFrtial Flou, Damped Sensor<br />
the stimulus of axial acceleration only, the behavior of this<br />
sensor is simulated by the following analysis.<br />
The nomenclature is<br />
A = sensed acceleration<br />
A = effective area on which pressure acts<br />
B = bias force<br />
C = discharge coefficient<br />
e = volume displaced by motion x<br />
f = force on the sensing mass<br />
G = sensor mass<br />
k = diaphragm spring constant<br />
m = gas maSS<br />
M = Mach number<br />
I = mass flow rate<br />
r = orifice radius<br />
R = gas constant<br />
t = time<br />
T = temperature<br />
y = gits velocity in the orifice
v = gas volume<br />
x = forward travel of the sensing mass<br />
7 = ratio of specific heats for the gas<br />
p = ga$ density<br />
Subscripts:<br />
d = downstream<br />
f = fill<br />
g=gas<br />
i = initial<br />
s = diaphragm spring<br />
u = upstream<br />
+ = forward<br />
*=aft<br />
For the sake of simplicity, the analysis is going to be<br />
presented for the case in which the ga$ velocity in the orifice<br />
does not achieve a Mach number of unity. Therefore, its<br />
accuracy range is limited to pressure ratios below the critical<br />
value (approximately 2: I for air). Furthermore, the analysis<br />
is going to consider perfect gases with constant specific<br />
heats.<br />
For a circular sharp edged orifice the discharge coefficient<br />
C is typically taken to be equal to 0.6. Its value may be<br />
quite different for other geometries. Thc gas constant for air<br />
ts<br />
^ 497?0 ft tb<br />
'( = t0 sfu;F-<br />
Thc rqurtion of motion of thr nnring mmr ir<br />
i.<br />
o T; = -fr- fr+ Go<br />
dt'<br />
and<br />
whcrt<br />
fr=B+Lx<br />
fr--(P* - P-l,t<br />
P+=I+RT, P* tP-trf<br />
F+=m+lV+, 9-=n*lV-<br />
V*t{*-r*, V_=l|r-+cr.<br />
Thc mrrt flow xrom thr orificr obryr thr<br />
follwingrquotiom<br />
d^,<br />
dr<br />
= +{l<br />
Pt Pit<br />
-i* = vi* Ei- = vlfr<br />
frr'<br />
?hr mmr flow rrtr through tht orificc<br />
givrnby<br />
,' - lzuP(P-llti<br />
9-nr'Crr(ffif<br />
rnd<br />
I'.<br />
"=f3)'<br />
'Pdl<br />
ar<br />
The mass flow rate through the orifice is<br />
given by<br />
and<br />
Q = n ,z c na(<br />
, = ( \ \ Y<br />
' Pt /<br />
2yP(P* l)<br />
RTu(y-l)<br />
y- I<br />
Starting from appropriate initial conditions, integration<br />
of the above equations in time with the time varying input of<br />
the body acceleration a, yields the motion of the sensing<br />
mass. When the travel reaches the contact spring, the spring<br />
force may change (note that the contact spring would typically<br />
start in contact with the sensing mass). When further<br />
travel causes the contact to be clo$ed. the sensor circuit is<br />
activated. The integration can continue and follow the motion<br />
further and through possible reversal, Particularly in<br />
cases where hard contact with the anvil is not achieved. an<br />
flccurate evaluation of the contact dwell can be made.<br />
For the sake of producing a useful model, integration of<br />
the above equation is best performed numerically using one<br />
of many available algorithms. The speed of integration<br />
using modern computers is so high that, for most applications,<br />
even the simple Euler method is adequate since the<br />
required rccuracy can be achieved by decreasing the time<br />
step siae.<br />
Refinements of the above-described sensor model can be<br />
achieved by including choking (mach number equal to unity)<br />
effects on the gas velocity in the orifice and by including<br />
the energy equation. The latter correction would account for<br />
the fact that the energy dissipation in the orifice flow cause$<br />
an increase of the temperature (hence the pressure in the<br />
cavity).<br />
Simulation re$ults<br />
I<br />
)u<br />
A computer program representing the above equations<br />
was con$tructed and exercised under a variety of conditions.<br />
In order to exemplify the ability to tailor the properties of<br />
this sensor, this section displays families of responses to<br />
haversine acceleration pulses.<br />
Figure 3 shows the fire-no fire threshold for a sensor with<br />
the following dimensions:<br />
Sensingma$$EBgrams<br />
Bias force = 4.25 g's<br />
Bias stiffness = 3.64 lh/in<br />
Diameter = 2 inches<br />
Orifice radius = 0.045 inches<br />
Aft volume = 0.107 cu. in.<br />
Filling condition = I atmosphere 70 deg. F.<br />
The three curvcs indicate the effect of varying the distance<br />
which the sensing mass must travel before closing the
25<br />
20<br />
15<br />
t0<br />
5<br />
0<br />
------<br />
AV, MPH<br />
0 20 40 60 80<br />
Pulse Duration, msec<br />
0.050"<br />
o,067<br />
"<br />
0.075"<br />
Flgure 3. Sensor Gherictsrl$tlcs. Effect of Travel<br />
contact. Longer travel desensitizes the sensor in a rather<br />
uniform manner at all pulse durations.<br />
The rather high slope of the curves with increasing pulse<br />
duration is due to the high spring rate used for the<br />
diaphragm.<br />
Figure 4 represents the effect on the response characteristics<br />
of the same sensor of variations in the aft volume.<br />
Smaller aft volumes cause a vacuum to be readily formed<br />
behind the diaphragm when its speed is high. Therefore,<br />
small aft volumes desensitize the sensor for short duration<br />
pulses. The effect is limited to short duration pulses; therefore,<br />
the abscissa axis has been expanded.<br />
Figure 5 indicates the effect on the sensor response of<br />
varying the orifice diameter. Smaller orifice diameters increase<br />
the flow impedance thus desensitizing the sensor.<br />
This effect is less pronounced for pulses of longer duration<br />
since, in this case, the sensor response is dominated by the<br />
bias.<br />
Figure 6 points out the effect on the sensor response of<br />
varying the bias force. A higher bias force increases the<br />
slope of the response curve for pulses of long duration.<br />
Therefore, the sensor becomes desensitized to gentle crash<br />
signals.<br />
The general behavior of the response curves carl be divided<br />
into major regions. The first region is characterized by an<br />
increased sensitivity to extremely short pulse$ (below 5<br />
AV, MPH<br />
0 10 20 30 40<br />
Pulse Duration, msec<br />
----** 0.471 cu.in.<br />
0.107 cu. in.<br />
0.050 cu. in.<br />
Flgure 4. $ensor Character|stlcs. Efioct of Aft <strong>Volume</strong><br />
milliseconds) due to gas compressibility. This part of the Flgurr 5. Senror Characlerlrtlcr. Effect of Orlllce Dlsm€t€l<br />
25<br />
20<br />
r5<br />
10<br />
5<br />
0<br />
I<br />
r l<br />
AV, MPH<br />
\ ' t r r r . . . . " " : ;<br />
\- -::F<br />
0 20 40 60 80<br />
Pulse<br />
Duration, msec<br />
0.045"<br />
0.040"<br />
0.035"<br />
291
25<br />
20<br />
15<br />
10<br />
5<br />
0<br />
- * - * F -<br />
AV, MPH<br />
..,<br />
* t t<br />
a'*?<br />
20 40 60 80<br />
Pulse Duration, msec<br />
4.25 g's<br />
6.00 g's<br />
8.00 g's<br />
FIgure 6. Sensor Charsctsrl8tlcs. Efl€ci of Blss Force<br />
curves may not be realistic because the intervening structure<br />
would act as a mechanical filter and would prevent such a<br />
pulse to reach the sensor. The second region, from 5 to 15<br />
milliseconds displays the effect of the nonlinear character of<br />
the inertial flow damping: shorter pulses create a higher<br />
damping force. For pulses longer than l5 milliseconds the<br />
effect of the nonlinearity is mild and the sensor behaves as<br />
an acceleration integrator until the uniform positive slope<br />
characteristic of bias force and mass response takes over.<br />
The properties ofball-in-tube sensors are sensitive to the<br />
value of the gas viscosity which varies with temperature.<br />
Elaborate compensation $chemes must be employed in the<br />
design. The functioning of inertial flow damped sensors<br />
does not rely on viscosity. Thus the effect of temperature<br />
should be felt only when compressibility effects are present<br />
(pulses of very short duration). Figure 7 presents simulation<br />
results on the effect of ambient temperature on a sensor<br />
which had been filled with ambient air at 70 degrees Fahren*<br />
heit and sealed. Note that the exaggerated situations of an<br />
operating temperature 200 degrees F above and 104 degrees<br />
F below ambient was picked. As expected, the effect of<br />
ambient temperature in the range of pulse durations of interest<br />
is minimal.<br />
Conclusions<br />
The above-presented data give an idea ofwhat effect each<br />
of the essential design parameters have on the performance<br />
292<br />
25 r{<br />
20<br />
15<br />
10<br />
I<br />
II<br />
I<br />
f<br />
I t<br />
JV, MPH<br />
20<br />
40<br />
PulseDuration,<br />
msec<br />
70 deg F<br />
270 deg F<br />
-34 deg F<br />
60 80<br />
Flgure 7. Ssneor Gharacterlstlcs. Effect of Operatlng<br />
Temperature<br />
of this type of sensor. The decreased sensitivity to short<br />
duration pulses makes it a particularly good candidate for<br />
mounting in lateral crush zonetr where the structural rigidity<br />
is low and in frontal crush zones where the danger of hammer<br />
blows exists. A flatter response curye can be obtained<br />
by proper choice of parameters.<br />
It can be shown that this sensor can also be used as a<br />
distance measuring device for families of similar acceleration<br />
pulses. However, this property is not applicable because<br />
this type of functioning requires rather large displacements<br />
of the sensor bodv.<br />
References<br />
(l) "Problems in Design and Engineering of Air Bag<br />
Systems", by David S. Breed & Vittorio Castelli, SAE<br />
Technical Paper 880724, March 1988.<br />
(2) "Trends in Sensing Side Impacts", by David S. Breed<br />
& Vittorio Castelli, SAE Technical Paper 890603, March<br />
89.<br />
(3) "Trends in Sensing Frontal Impacts", by David S.<br />
Breed & Vittorio Castelli. SAE Technical Paper 890750.<br />
March 89.<br />
(4) "New Sensor Developments Leading to Sensor System<br />
Simplication", by Roben W. Diller, SAE Technical<br />
Paper<br />
841218, May 1984.
Vehicle Tests Required For Air Bag System Design<br />
David J, Romeo,<br />
Autoliv North America, Inc.<br />
John B. Morris,<br />
National Highway Traffic Safety Administration<br />
Abstract<br />
At this time, a consen$us does not exist regarding the<br />
number and types of crash tests which need to be conducted<br />
to establish a basis for crash sensor threshold behavior.<br />
Experience obtained from the 1973-1976 General Motors<br />
air bag equipped cars ( l-3),* the Police Fleet Retrofit Driver<br />
Air Bag Program (4), and the Ford Tempo GSA Project<br />
(5), are reviewed and results from these projects, and from<br />
tests conducted by and for the automotive industry, are<br />
discussed. Such sensor threshold tests could be conducted<br />
as par"t of the design of an air bag system.<br />
<strong>Int</strong>roduction and Summary<br />
Over the past twenty years, numerou$ methods have been<br />
used to design, develop, and evaluate air bag restraint<br />
$ystems. These methods have been reviewed, and this paper<br />
identifies five distinct categories or types of vehicle tests<br />
which should be performed. The tests are, in part,<br />
categorized by practical factors such as whether test<br />
dummies, test drivers or neither are required; whether a<br />
complete test facility is required, i.e., crash barrier, test<br />
dummies, high speed cameras, etc., and finally whether the<br />
entire system or only component$ are actually needed.<br />
The five types of vehicle tests are:<br />
l. High Speed Impact Te$t$ (test dummies,<br />
complete test facility, total destruction of vehicle).<br />
2. Low Speed Threshold Barrier Tests (no driver or<br />
dummy, moderate damage to vehicle).<br />
3. Fleet Testing (general popularion drivers, no<br />
damage to vehicle intended).<br />
4. Test Track Tests-Normal including rough road<br />
(test driver, little or no damage to vehicle).<br />
5. Severe Rough Road Exposures (with or without<br />
test driver, moderate damage to vehicle).<br />
In the following section, a general discussion of each of<br />
these categories is given. Specifics of proposed Severe<br />
Rough Road Tests are given. An attempt to evaluate the tests<br />
proposed in terms of real world air bag deployment<br />
experiences are presented. Finally, conclusions and<br />
recommendations are presented.<br />
Definition of Vehicle Test Types<br />
High speed impact tests<br />
These, of course, are where air bag deployment occurs.<br />
Although full systems tests are preferred, these tests can be<br />
+Numbers in parentheses designate refercnces at end of paper.<br />
conducted with or without a complete working sensordiagnostic<br />
assembly (time delayed barrier contact switches<br />
can be used to simulate sensor closure). Tests without cra$h<br />
sensors are sometimes conducted early in a development<br />
program to determine dummy performance given a<br />
specified sensing time, prior to the availability of<br />
production crash sensors. Equally clear, these are the<br />
expensive tests since a complete facility is required and the<br />
vehicle is destroyed. The baseline test here is the Federal<br />
Motor Vehicle Safety Standard (FMVSS) No. 208 test<br />
condition at 30 mph (48.3 kph) full frontal.<br />
The FMVSS No. 208 test, although obviously the most<br />
important with regard to safety standard compliance,<br />
appears to be less critical with regard to design ofthe air bag<br />
system, particularly the crash sensor. This is illustrated in<br />
table I which summarizes results for the 30 mph barrier<br />
crash for eight different vehicles, all with the same retrofit<br />
air bag system that was used in the Police Fleet<br />
Demonstration Program, reference 4. In general, excellent<br />
results were obtained in all of these vehicles despite the fact<br />
that they differ in size, weight, and engine drive train<br />
configuration.<br />
Table 1. Hesults ot pollce tleet drlver alr bag retrollt syslems ln<br />
varloue aulomoblles-3O mph, FiIVSS 208 craah teat.<br />
Ford LID<br />
Yeh lc l.<br />
D'odga Dlplmat<br />
Dodg€ Arl6s<br />
Chevrol6f Caprlc€<br />
0pal Kadrtf<br />
Stcrl Ing 800<br />
YUgp GY<br />
Ford llustlng<br />
Dafe<br />
9/9/8i<br />
t2^t/6,<br />
5lt186<br />
1l?E/86<br />
4/ZlE7<br />
9/2tlS7<br />
tlilaE<br />
?lt6lE9<br />
_HIC-<br />
176<br />
9t9<br />
t76<br />
572<br />
d66<br />
505<br />
21'<br />
772<br />
Chgst ors<br />
S€n6'0r<br />
Cfosurs<br />
?0 msm<br />
This basic compliance test can be extended through the<br />
t30 degree barrier face, 35 mph vehicle assessment<br />
condition, and various dummy size, seat position, manual<br />
belt usage conditions as program budgets allow. The<br />
following table lists these in order of importance.<br />
The first three tests are Federal Motor Vehicle Safety<br />
Standard (FMVSS) No. 208 tests. The first test is the<br />
predominate test. It determines air bag performance when<br />
the safety belts are not used. The second test evaluates<br />
system performance in oblique crashes, a common<br />
occurence in real world accidents. The third test provides<br />
data on air bag performance when used with safety belts.<br />
The fourth te$t, the New Car Assessment Program (NCAP)<br />
test, provides performance data when the system is<br />
subjected to a more severe crash speed. The fifth test<br />
evaluates the adequacy of the crash sensor threshold setting<br />
/tE<br />
61<br />
,7<br />
57<br />
48<br />
5l<br />
5t<br />
48<br />
t6<br />
t6<br />
24<br />
t,f<br />
IE<br />
rt<br />
t4<br />
293
to react to this type of impact in time for the air bag to<br />
provide the protection desired.<br />
Speed<br />
30 mph<br />
30 mph<br />
30 mph<br />
35 mph<br />
30 mph<br />
Gondltlon<br />
full frontal<br />
+ 30 dBgree$<br />
wmanual belts<br />
full trontal (NCAP)<br />
centered pole<br />
Bslt Use ln T6st<br />
No<br />
No<br />
Yes<br />
Yes<br />
No<br />
Additional high speed impact tests, which have been<br />
conducted (6), include:<br />
Speed<br />
30 mph<br />
E0 mph (closing)<br />
20 mph<br />
15 mph<br />
Condltlon<br />
30 deg, A-pillar<br />
car to car, half car offset<br />
underride<br />
frontal imDact<br />
The 60 mph closing speed offset car to car test is quite<br />
representative of many real world accidents. However, it is<br />
expensive and can be simulated with a single vehicle into a<br />
half barrier or pole offset to the driver side. This would be a<br />
worthwhile addition to a complete test matrix.<br />
Less can be said for the side impact, underride, and lower<br />
speed tests which all represent longitudinal velocity<br />
changes of a lower magnitude which in turn produce<br />
ambiguous results regarding sensor closure and dummy<br />
performance requirements. The results are considered<br />
ambiguous because at the relatively low longitudinal<br />
"delta-V's"<br />
experienced in these crashes the dummy injury<br />
indices are always low, regardless of whether or not the air<br />
bag deploys. Because of this the outcome always tends to be<br />
considered acceptable. ln other words, from the dummy<br />
results it is not possible to determine clearly a need for<br />
deployment and until a larger data base of real world<br />
accidents has been analyzed the need will continue to<br />
remain unclear.<br />
It is believed that the dummy results for tests which<br />
produce "barrierequivalent" velocity changes of l5 mph or<br />
less are oflittle value because ofthe lack ofbiofidelity at the<br />
deceleration levels experienced. Seat friction and, more<br />
importantly, muscular restraint of arms and legs are known<br />
to dominate occupant kinematics at these low speeds (7).<br />
The same reservations must be made with regard to<br />
computer simulation models which treat the occupant as a<br />
"free<br />
body." These results tend to generate sensor closure<br />
requirements inconsistent with real world experience.<br />
Reference 8, for example using the 5 mph, free body criteria<br />
concludes that air bag deployment is needed in situations<br />
such as running a car into deep water, a snow bank, or into a<br />
crash attenuation barrier. All of these events (crashes)<br />
produce vehicle decelerations in the range ofup to 6 or 8 g's<br />
and the model allows the dummy to strike the interior at a<br />
large "delta-V,o' indicating air bag deployment is<br />
warranted. Real world experience, on the other hand,<br />
294<br />
indicates that the air bag in fact is not needed in these<br />
situations.<br />
Consequently, if analysis of air bag component<br />
performance is to be conducted at these low speeds, it is<br />
suggested that incorporation of a preload into the dummy or<br />
computer model of the dummy be used. A preload of the<br />
order of4 g's is suggested as a starting point.<br />
Low speed threshold barrier tests<br />
These crash te$ts are conducted to determine the threshold<br />
of sensor closure in a frontal barrier crash. Based upon<br />
many factors, but primarily human injury tolerance, the<br />
threshold speed is normally chosen to be 1ill9 kph (9.9-<br />
I I.8 mph). By definition of threshold, 50 percent of the tests<br />
conducted at this condition will result in sensor closure (air<br />
bag deployment) and 50 percent will not. Therefore, it is of<br />
little value to conduct tests at this speed (unless an unreasonably<br />
large number of them are to be done). Rather, we<br />
mu$t test at speeds below and above where non-closure or<br />
closure must occur. Thus we define the terms;<br />
"Must<br />
not close with reasonable certainty" and<br />
"Must<br />
close with reasonable certainty."<br />
These conditions, based again on tolerance to injury, but<br />
also somewhat on system capability, are 4 kph (2.5 mph)<br />
above and below threshold velocity.<br />
Therefore, the following te{it protocol is established-<br />
For threshold of 16 kph, test at;<br />
t 12 kph with result that sensors must not close, and<br />
at<br />
r 20 kph with result that sensors must close.<br />
For threshold of 19 kph, test at;<br />
r l5 kph with result that sensors must not close, and<br />
at<br />
. 23 kph with result that $ensor must close.<br />
The exact threshold, i.e., between 16 and 19 kph, is selected<br />
based upon the particular project's analysis of human<br />
tolerance, car interior friendliness, system capability, indication<br />
of safety belt u$e, etc.<br />
Fleet tests<br />
These so called "fleet tests" should use as many vehicles<br />
(from one or two, up to several hundred) as possible. The<br />
complete air bag system is installed in the vehicle and the<br />
vehicle is driven oyer a wide range of normal conditions<br />
with mileage accumulation. The purpose of these test$ are<br />
many. Examples of design problems which have been experienced<br />
in the Police Fleet are listed below as illustrations.<br />
l. Appearance, aesthetics, consumer and service acceptance.<br />
The vehicles are made available to a wide range of<br />
people who look at, feel and experience the system. This is a<br />
"Show<br />
and Tell" exposure. Examples of concems to be<br />
evaluated are:<br />
r knee bar intrudes, is difficult to get in and out of<br />
car (was not a problem).
electrical connector coil broken due to improper<br />
steering wheel removal (was a big problem).<br />
r readiness indicator light stays on for sufficient<br />
duration to be seen and is located so that it provides<br />
the proper incentive when it stays lit (fault<br />
indicated) that service is sought. In the Police<br />
Fleet, the indicator light was, in some cases, ignored,<br />
and in some cases, rendered inoperative<br />
(broken).<br />
r appearance feedback-is air bag module attractive<br />
and does it obstruct view of in$truments.<br />
Steering wheel leather wrap was a big "plus"<br />
toward offsetting large air bag module<br />
appearance.<br />
2. Normal function of diagnostic and its exposure to<br />
normal vehicle electrical variants such as, low battery, electrical<br />
voltage surges, and/or interruptions during starting.<br />
Problems experienced<br />
include:<br />
. improper indication of fault due to electrical system<br />
transients.<br />
r diagnostic memory drained battery after several<br />
weeks of parking.<br />
. unnecessary fault readout information was given<br />
to the service mechanic.<br />
3. Mechanical response of components such as steering<br />
wheel, clock spring electrical connector, knee bar:<br />
. steering re$ponse affected by added mass ofsteering<br />
wheel air bag module.<br />
clock spring electrical connector drag and noise<br />
can be felt and heard<br />
interference with directional signals, horn.<br />
4. Environmental exposure to rain, cold, salt, etc. Problems<br />
have included:<br />
r moisture in diagnostic.<br />
r corrosion of sensors, wiring harness, connectors.<br />
5. Normal rough road, rough use exposure, parking lot<br />
speed bumps at low speed, i.e., less than 5 mph, impacts,<br />
door slams, hood slams, etc. No problems have been experienced<br />
to date from these exposures.<br />
Test track tests<br />
Test track tests are conducted for purposes similar to<br />
Fleet Tests except that the road (test track), driver (professional),<br />
and vehicle performance (speeds, cornering g's,<br />
etc.), are defined a priori. A second distinction is that expo-<br />
$ures more severe than normally encountered in the real<br />
world are studied.<br />
In some cases, many of the potential problems which<br />
eventually show up in the Fleet Tests are seen early enough<br />
to permit resolution before full scale production, as might<br />
be the case with Fleet Tests.<br />
Normally included in these evaluations, are a series of<br />
tests which include driving the vehicle over man made<br />
"Belgian<br />
Blocks", steps, bumps, pot holes and ramps.<br />
These are the so called "shake. rattle and roll" tests commonly<br />
used for durability testing. These tests have been<br />
used in earlier programs and found to be of little value in<br />
evaluating sensor closure. Put simply, they lack severity. In<br />
fact, it has been found that the inadequacy of these tests to<br />
produce potential crash sen$or closure situations has led to<br />
and forced the development of the "Severe Rough Road<br />
Exposures.<br />
"<br />
Severe rough road exposures<br />
These tests simulate vehicle exposure outside of the normal<br />
rough road durability type envelope often run on new<br />
vehicles. These tests all involve impacts which will damage<br />
the vehicle to some extent (scrapes, dents, tire and wheel<br />
failure) and cause deceleration pulses which may be sufficient<br />
for sensor closure. The extent of damage and severity<br />
of exposure to an occupant as a function of these impact<br />
parameters is not known at the beginning of the test. One<br />
can only state that the condition of sensor closure should be<br />
warranted. This can be thought of as shown in the following<br />
table.<br />
Vehicle<br />
damage<br />
None or slighl<br />
Minor<br />
Moderate<br />
Severe<br />
Inlury<br />
potcntial<br />
None<br />
None<br />
Minor<br />
Mod€rate<br />
Sensor<br />
closure<br />
No<br />
No<br />
Borderline<br />
Yes<br />
Equlval€nt<br />
barrler<br />
speed<br />
"delta-V"<br />
5 mph<br />
7 mph<br />
10 mph<br />
15 mph<br />
Four types of severe exposures have been proposed and<br />
will be discussed<br />
in the next section:<br />
2. Railroad Track<br />
3. Ditch<br />
4. Deer<br />
Specifics of Severe Rough Road<br />
Exposures and Deer Impacts<br />
Curb tests<br />
These tests involve driving the vehicle over a step or curb<br />
at increasing rates of speed and for increasing curb height to<br />
a point where sensor closure occurs. Its occurrence is<br />
compared to severity of exposure both with respect to the<br />
vehicle and the driver. The literature recommends curbs<br />
ranging from 100 mm to 200 mm in height and speeds from<br />
l0 to 50 kph.<br />
Some indication of the relationship of the recommended<br />
test curb height to wheel hub height is shown on the<br />
following table. Forreference, curb height can be expressed<br />
as a ratio ofvehicle ground to centerline ofhub distance. For<br />
13 inch to 15 inch wheels, this distance is approximately<br />
280 mm plus or minus l0 percent, and gives ratios of;<br />
295
Curb Height<br />
100 mm<br />
150 mm<br />
200 mm<br />
% Curb Height<br />
Axle Helght<br />
The following test protocol is recommended:<br />
h = 100 mm, v = 20,30,40,50 kph with driver<br />
h = 150 rlrl, v: 10, 20, 30, kph and up until tests are<br />
terminated due to sensor closure or severe vehicle<br />
damage<br />
h * 200 mm, may approach low speed barrier<br />
conditions<br />
Railroad track<br />
In this test, the vehicle is driven such that the undercarriage<br />
is snagged or impacted by a segment of railroad track'<br />
This simulates the single most common cause of unwanted<br />
airbag deployment in the early General Motors airbag fleet.<br />
Ceneral Motors recommends meeting a condition of a l'2<br />
inch (30 mm) interference at 20 mph without sensor closure.<br />
This recommendation may need further definition as to<br />
what part of the undercarriage to strike. The rail segment is<br />
approximately 300 mm in width. This can also be run at<br />
increasing speeds of 20, 30, 40 kph etc. until termination<br />
due to severity.<br />
Ditch<br />
Note that in the curb tests, vehicle loading occurs due to<br />
impact to the tires, wheels and front axle. In the railroad<br />
track test, which can also simulate a boulder contact, impact<br />
occurs to the vehicle undercarriage and in the low speed<br />
barrier tests, loading obviously occurs through the bumper.<br />
The ditch tests decelerate the vehicle through all three load<br />
paths, bumper, undercarriage and tires and, consequently<br />
are less quantifiable than the others. It is essentially an<br />
extension of a dirt road testing campaign and has its origin<br />
in the police fleet retrofit program where it was found to be<br />
ofconsiderable value.<br />
Showing Direction of Travel<br />
h . dround to center lind of axle WB . Wheel base<br />
Flgure 1. Concrete dltch.<br />
296<br />
.35<br />
.53<br />
.71<br />
The dimensions of the ditch are presented in figure I and<br />
may be modified to suit the particular vehicle. Tests can be<br />
initiated at 20 kph with a driver and continued as severity of<br />
results warrants,<br />
Deer impacts<br />
The Insurance Institute for Highway Safety, Reference 9,<br />
announced that in Pennsylvania the game commission reported<br />
that close to 40,000 deer were killed in 1988 in<br />
collisions with vehicles. Injuries were relatively rare, although<br />
considerable property damage frequently occurred.<br />
Reference 9 also reports that there are 20,000 such accidents<br />
per year in Michigan and when a car impacts a deer at high<br />
speeds, the car can crush locally and impart a l0 mph velocity<br />
change to the air bag crash $en$or while causing a relatively<br />
minor velocity change to the vehicle, resulting in an<br />
unwanted air bag deployment. On the other hand, the air bag<br />
may help prevent occupant injury in the event the deer<br />
carcass penetrates the windshield after the air bag deployed'<br />
General Motors, Reference 10, in recommending tests for<br />
evaluating air bag sensor performance in circumstances<br />
where deployment is not desired, proposes the following car<br />
to deer impact:<br />
"Tow<br />
the car at 50 mph into a horizontally oriented<br />
water-soaked boxer training bag simulating a deer. The<br />
bag is suspended at a height which aligns its center<br />
with the sensor. The water-soaked Everlast Model<br />
4543 training bag weighs 50 kg."<br />
Real world accident experience<br />
In this section real world air bag deployment experience<br />
is examined in an effort to establish the merit of the aforementioned<br />
vehicle tests. In general, the deployments should<br />
fall into the first, second or fifth categories listed under<br />
<strong>Int</strong>roduction and Summary. That is "High Speed," "Low<br />
Speed," or Severe "Rough Road." ln a few case$, however,<br />
they fall under "Fleet" or "Test Track" tests.<br />
General Motors 1973-1976 ACRS vehicles<br />
References 4,5, and 6 provide data on General Motors air<br />
bag equipped vehicles produced from 1973 through 1976.<br />
Over I 1,000 air bag equipped vehicles were produced during<br />
this period. These data contain over 200 deployment<br />
accidents. As seen in the following table, accidents involving<br />
another car produced the most deployments in frontal<br />
impacts. Deployments produced by undercarriage contact<br />
are not included but are reported later.<br />
General Motols Flset Frontal lmpact Demonstration<br />
Object struck<br />
Car<br />
Pole<br />
Tree<br />
Truck and Van<br />
Other<br />
% of deploymenta N = 152<br />
64<br />
I<br />
I -l<br />
11
A distribution of all deployment accidents is shown on<br />
the following table. Undercarriage contact produced a significant<br />
number of the deployments.<br />
Crash mode<br />
Frontal<br />
Undercarriage<br />
$ide<br />
General llotor$ Flest<br />
The severity of the accidents resulting in the deployment<br />
of the air bag is shown in the following table. The velociry<br />
change, in most cases, was computed using the CRASH<br />
computerprogram. Reference I I reports that CRASH tends<br />
to underestimate velocity change at speeds under 30 mph,<br />
the speeds at which most crashes occur. The velocity<br />
changes shown in the following table were therefore corrected<br />
using an equation similar to that recommended in<br />
Reference ll. The velocity changes obtained from crash<br />
recorders installed in some of the vehicles were used as<br />
reported.<br />
Crash<br />
$EYerity<br />
Minor<br />
Moderate<br />
Severe<br />
Gcneral MotorE Fle€l<br />
Veloclty<br />
change<br />
Lessthan 13<br />
mph<br />
13-20 mph<br />
2G-50 mph<br />
Police fleet 198L1988<br />
% of deploymenls N = lg4<br />
79<br />
13<br />
I<br />
% of deploym8nt$<br />
1.1=<br />
98<br />
26<br />
40<br />
34<br />
The following observations are made from accident repons<br />
of police vehicles in which retrofit driver air bag<br />
system$ were installed. Approximately 5fi) kirs were installed<br />
in the Ford LTD Crown Victoria, the Dodge Diplomat/Plymouth<br />
Gran Fury, and the Chevrolet Caprice. The<br />
number of deployment$ are quite small, 29 resulting from<br />
frontal impacts, neglecting undercarriage, for which we<br />
have data. As seen from the following table, a significant<br />
number of deer impacm resulted in air bag deployment.<br />
Obfoct struck<br />
Car<br />
Deer<br />
Pole<br />
Tree<br />
Other<br />
Pollce Fleat Frontal lmpact Dcploymsnts<br />
% of deployments N = 29<br />
55<br />
21<br />
10<br />
7<br />
7<br />
As with the C€neral Motors fleet, a significant number of<br />
deployments as a result ofundercaniage contact occurred in<br />
the police fleet. The impacts are summarized on the following<br />
table.<br />
|mpact<br />
Frontal<br />
Undercarriage<br />
Polics Fl€€t<br />
% ol deployments N = 34<br />
85<br />
15<br />
The severity ofthe accidents resulring in air bag deployment<br />
is shown in the following table. The number of velocity<br />
changes calculated is very small (N = 20). As with the<br />
General Motors data, the CRASH computed delta-V's have<br />
been corrected.<br />
Pollce Fleet<br />
Craeh severlty Voloclty change % ol deployments<br />
H=20<br />
Minor<br />
Moderate<br />
Severe<br />
Ford Tempo f985-1988<br />
Less than 13 mph 1 5<br />
13-20 mph 65<br />
More than 20 mph 13<br />
The Ceneral Services Administration purchased 5,O00<br />
1985 Ford Tempos equipped with driver side air bags. The<br />
following observations can be made from the experience<br />
with this fleet. As with other fleets, accidents involving<br />
another car produced the most deployments. The objects<br />
struck are summarized<br />
in the following table.<br />
Ford Tempo Fleet Frontal lmpsct Deployment8<br />
Oblect atruck<br />
Car<br />
Truck and Van<br />
Deer<br />
Tree<br />
Pole<br />
Other<br />
As with the other fleets, frontal impacts were the predominant<br />
crash mode. Undercarriage deployments were not as<br />
predominant in the Ford Tempo fleet. The types of impacts<br />
producing deployments are summarized in the following<br />
table.<br />
fmpsct<br />
Frontal<br />
Side<br />
Rollover<br />
Undercarriage<br />
Ford Tempo Fleet<br />
% of deployments N = 153<br />
63<br />
19<br />
5<br />
4<br />
3<br />
6<br />
% of deploymentc N = 165<br />
The crash severity of the deployment accidents are shown<br />
in the following table. The number of known delta-V's is<br />
rather small. As in the other cases. the CRASH calculation<br />
has been corrected.<br />
92<br />
5<br />
2<br />
1<br />
?97
Ford T6mpo Fleet<br />
Craeh eeverlty Veloclly change % ol deplolments<br />
Minor<br />
Moderate<br />
Severe<br />
Less lhan 13 mph<br />
13-20 mph<br />
More than 20 mph<br />
Air bag deployment situations versus<br />
proposed test matrix<br />
In previous sections of the paper tests were proposed to<br />
establish a basis for crash sensor threshold behavior. The<br />
accident data files were $earched to determine how frequently<br />
these tests simulated situations in which the air bag<br />
was deployed in on-the-road accidents. The following table<br />
summarizes air bag deployments in the three air bag fleets<br />
that relate to the various test conditions proposed. Although<br />
in the above examination of fleet deployment crash severity<br />
was classified as "minor." "moderate," or "severe," the<br />
following table divides these crash deployments into two<br />
categories,<br />
"High Speed" and<br />
"Low<br />
Speed," in keeping<br />
with the proposed test categories outlined in previous sections<br />
of the paper. The "Low Speed" category was arbitrarily<br />
set as those deployments below 15 mph and "High<br />
Speed" as those above l5 mph. Since the velocity change<br />
was not known in every case, the percentage obtained from<br />
those known was distributed over the entire file to determine<br />
the number of occurrences.<br />
Test<br />
High Speed<br />
Low Speed<br />
Severe Rough Rd<br />
Fleet<br />
No. of Occurrencee<br />
Follce TemPo<br />
The Fleet test numbers reflect non-crash deployments'<br />
Fleet tests provide invaluable information on the air bag<br />
system other than causes for undesired deployments. Information<br />
gained on maintenance problems and procedures,<br />
system durability and reliability, design problems, and sys*<br />
tem acceptability are not reflected in the table above.<br />
The section on Severe Rough Road Exposures outlined<br />
four tests to simulate exposures outside normal rough road<br />
driving. The following table summarizes the fleet experience<br />
relating to deployment accidents resulting from these<br />
types of exposures.<br />
T6st<br />
Ditch<br />
Curb<br />
Rail<br />
Deer<br />
Gl,l<br />
6<br />
7<br />
11<br />
3<br />
GM<br />
g9<br />
56<br />
27<br />
14<br />
No, of Occurrence$<br />
Pollce Tempo<br />
3<br />
2<br />
6<br />
12<br />
17<br />
11<br />
e<br />
10<br />
76<br />
14<br />
108<br />
99<br />
I<br />
1<br />
i<br />
7<br />
The real world accidents that these tests simulate, in<br />
addition to railroad crossings, include impact with boulders,<br />
culverts, buried objects, irregular terrain, embankments,<br />
and rocks. as well as ditches and curbs. The deer test simulates<br />
accidents involving related low mass animals as well<br />
as deer.<br />
Conclusions<br />
I. At this time, there appears to be a lack of consensus as<br />
to definition of the vehicle tests required for air bag system<br />
development.<br />
2. A review oftests that are presently being used has led to<br />
a definition of five distinct categories of vehicle tests which<br />
could be conducted. Specifics ofthe te$ts in these categories<br />
are given.<br />
3. A category defined as "Severe Rough Road<br />
Exposures" includes tests of fundamental importance with<br />
regard to crash sensor requirements.<br />
4. A review of procedures in present use indicates that<br />
results of dummy data and simple computer modeling may<br />
be inappropriate for analysis of crash sensor requirements in<br />
the regime of relatively small "delta v" crash occurTences.<br />
5. Real world air bag deployment experiences with three<br />
groups or "fleets" of cars was analyzed and the relative<br />
merit or value of the te$t was established.<br />
6. Additional definition and supplementation of these<br />
tests are required. However, a move to establish a protocol<br />
in the vehicle test community may be warranted.<br />
This paper pre$ents the views of the authors, and not<br />
necessarily those of the National Highway Traffic Safety<br />
Administration.<br />
References<br />
( I ) DOT HS-802 30 I Executive and Tabular Summary of<br />
Air Bag Field Experience, <strong>Volume</strong> l, No. 1, April 1977<br />
(2) DOT HS-803 416 Executive and Tabular Summary of<br />
Air Bag Field Experience, <strong>Volume</strong> 2, No. I, May 1978<br />
(3) DOT HS*805 062 Executive and Tabular Summary of<br />
Air Bag Field Experience, <strong>Volume</strong> 3, No. l, August 1979<br />
(4) Romeo, D. J., and Morris, J. B., Driver Air Bag Fleet<br />
Demonstration Program, A 24 Month Progress Report,<br />
Tenth <strong>Int</strong>emational <strong>ESV</strong> <strong>Conf</strong>erence, DOT HS-806 916,<br />
Oxford, England July 1985<br />
(5) Backaitis, S, H., and Roberts, J. V., Occupant lnjury<br />
Pattern$ in Crashes With Air Bag Equipped Government<br />
Sponsored Cars, SAE 812216<br />
(6) Wilson, R. A., General Motors Corporation, Crash<br />
Testing The General Motors Air Cushion, Fifth<br />
<strong>Int</strong>ernational <strong>ESV</strong> <strong>Conf</strong>erence, London, England, June<br />
1974<br />
(7) Wagner, R., Audi A.G., A 30 MPH Front/Rear Crash<br />
With Human Test Persons, SAE 791030 October 1979,<br />
Ttventy Third Stapp Car Crash <strong>Conf</strong>erence<br />
(8) Breed, D., and Costelli, V., Problems in Design and<br />
Engineering of Air Bag Systems, SAE 880724 February<br />
1989<br />
(9) Insurance Institute For Highway Safety Status Report
Vol.24, No.2, Februarv 25, 1989<br />
(10) Letter, dated June 18, 1984, Ceneral Motors to Michael<br />
M. Finkelstein, NHTSA, forwarding a Description of<br />
General Motors Tests for Evaluating Air Bag<br />
The Development of an Advanced Airbag Concept<br />
Lennart Johansson, Jan Billig,<br />
Hugo Mellander,<br />
Volvo Car Corporation<br />
Bernd Werner, Peter Hora,<br />
Bayern Chemie GmbH<br />
Abstract<br />
<strong>Int</strong>eraction between the head of the driver and the steering<br />
wheel may cause facial injuries, especially in high speed<br />
accidents.<br />
Air cushion technology provides the means of distributing<br />
and reducing the inertia forces acting on the head and the<br />
face.<br />
This paper describes the development of an airbag system,<br />
including the electrical sensor which is integrated in<br />
the steering wheel, and it focuses on the problems of positioning<br />
the sensor in the steering wheel.<br />
Information from necessary sensor testing, both on rough<br />
roads and in crash conditions, is presented.<br />
The improvements which are achieved, in terms of reduced<br />
violence to the face, have also been assessed experimentally<br />
by using a test dummy with a load sensing face.<br />
<strong>Int</strong>roduction<br />
ln connection with the increased usage of seat belts in<br />
Europe, the number of serious injuries in collisions has<br />
decreased.<br />
%<br />
.lO<br />
so<br />
20<br />
10<br />
Uilattsd<br />
Flgure 1. Inlury rates for belted and unbelted front $eat<br />
occupant$ at dlflcrent statod sccldent Bp€eds.<br />
(Ref. 1)<br />
However, despite the belt, there is still the problem of<br />
skull and facial injuries sustained by the driver when his<br />
head hits the steering wheel in high speed accidents. Volvo's<br />
accident statistics show that lOVo of drivers in head-on<br />
collisions receive skull and facial injuries. See figure 2.<br />
Performance in Circumstances Where Deployment is not<br />
Desired<br />
(l l) Accuracy and Sensitivity of CRASH, DOT HS-806<br />
152, March 1982<br />
,-. Forehead<br />
Nos€<br />
- Mouth/Teeth<br />
- Jew<br />
FIgurc 2. Faclal Inlurl€s ars mostly to the forehead, no$e,<br />
mouth/teeth snd lsw'<br />
Since the total pattern of injuries decreases with the usage<br />
of belts, the remaining facial injuries constitute a greater<br />
proportion of the injuries suffered than previously.<br />
Normally, the injuries are relatively slight, but this type of<br />
co$metic injury often creates psychological problems for<br />
the victims, and rehabilitation can, in some cases, take<br />
years.<br />
Our goal was to optimise an airbag system for the belted<br />
driver and, by using a high level ofintegration, to produce a<br />
cost-effective and compact system. A bag in the steering<br />
wheel would protect against skull and facial injuries in<br />
head-on collisions and increase the chances of survival in<br />
high speed collisions. Trimming a bag for a restrained<br />
occupant meant that the bag could be made smaller than the<br />
US-system (for unrestrained occupants).<br />
Eurobag U$.bag<br />
Flgure 3. Ths plctur€E show ths dlfference In sizB b€tw€€n a<br />
Egg lo*r a belted drlver (Eurobag) and a bag complylng wlth<br />
FMVSS zOE.<br />
The results after computer simulation and sled tests<br />
showed that a bag with a volume of approximately 35 litres<br />
(diameter 550 mm) without internal straps gave the best<br />
results.<br />
299
A small bag has advantages with regard to out-ofposition-exposure.<br />
omission of the strap$ meant that the<br />
bag could be made relatively simple in design. If a bag<br />
material with a coating which can be welded is used, a cheap<br />
method of manufacture can be developed whereby two discs<br />
(one of which has a pre-welded disc with the necessary<br />
attachment holes for the inflator) are welded together. (See<br />
figure 4).<br />
The advantages of this are, among other things, that the<br />
sensor can be fitted directly onto the inflator and, because of<br />
the fact that all system components are in the steering wheel,<br />
the system could be installed as an aftermarket item.<br />
Sensor development<br />
The Eurobag sensor, fitted in the steering wheel, is basically<br />
an electronic software controlled microprocessor<br />
system. The trigger algorithm follows<br />
ilffi<br />
"standard" accelera-<br />
Figure 4. Three parts welded together to a bsg.<br />
Since the inflator only needed to generate gas for a 35 litre<br />
bag, its dimensions could be reduced as shown in figure 5.<br />
Standrrd<br />
lnflator<br />
Ncw Inllator<br />
Fioure 5. A Eurobao Inflator (-157o smaller In dlamster and<br />
-2b* lower ln helght) compare'd with the conventlonal inflator.<br />
This gives not only a reduction in weight, but the new<br />
inflator also occupies less space in the steering wheel.<br />
System layout<br />
The whole system is located in the steering wheel, i.e. the<br />
cover, the bag, the inflator, the sensor, including diagnostic<br />
and reverse energy units, the connector coil and the warning<br />
lamp. (Figure 6)<br />
Figure 6. Eurobag concept.<br />
@F<br />
ffi<br />
WF*lg lrrltF<br />
tion signals within electronic airbag systems, i.e. above a<br />
certain acceleration threshold and when a certain velocity<br />
change has occurred, the power switch is triggered to ignite<br />
the squib. The threshold depends on the crash behaviour of<br />
the actual car.<br />
The development of the sensor was directed towards Volvo740[60.<br />
The 760 model also contains a tiltable steering<br />
wheel (tiltable +7'), and this must be considered in the<br />
development of the rlensor. (figure 7)<br />
Figure 7. The 760 steerlng wheelcan b€ tlltsd to thres posltione<br />
(+7o<br />
from the normal positlon).<br />
Flgure 8. Steering wheel wlth 5 accelerometers In th€ dlflsrent<br />
dlrectlons.<br />
Development of software<br />
The sensor development began with the accumulation of<br />
measuring data. With the aid of a measuring unit with five<br />
accelerometers fitted in the steering wheel, signals from a
number of different collisions were registered, to be analysed<br />
later.<br />
The accelerometers were placed in the X, Y and Z axes<br />
and f45o from X. (figure 8)<br />
Tests were carried out at different speeds from 4 mph to<br />
35 mph and were of types 0",30",90", 180o, pole and<br />
underride. (figure 9)<br />
oo ior lo. ttoo<br />
r t<br />
HHE\r<br />
r|1l<br />
HEEEE<br />
F'. uirf--'-- Ii<br />
ftT. _h E<br />
Flgure 9. Dlfferent types of colllalon Bltuallons, where measurements<br />
ol acceleratlon In the steerlng wheel were reglstered.<br />
Since the sensor should not trigger during different types<br />
of rough-road driving, measurements were carried out on<br />
that type of surface as a reference. Examples of "nontriggering<br />
situations" are curbs, road depressions and different<br />
types of bumps. (figure l0)<br />
Ost r|'m rrff, dffistr.r<br />
Gcdqrbad<br />
Flgure 10. Examples of rough-road sltuatlons.<br />
r Curb-stone testing was performed against a 100<br />
mm high curb at 35 mph and a 150 mm high curb<br />
at 30 mph. After such curb-stone driving, the car<br />
is damaged, but the driver unharmed.<br />
r Road depressions at speeds up to 55 mph and with<br />
maximum load in the car.<br />
r Driving on pot-holes and Belgian pavd with<br />
wheels both locked and rolling.<br />
r Test driving was also performed with unbalanced<br />
wheels at different speeds.<br />
The accumulation of signals was also supplemented by<br />
measurements made when hitting the steering wheel with<br />
different objects, e.g. a hammer and a fist. All tests were<br />
done with the steering wheel tilted at the three different<br />
angles. The measured acceleration levels from the different<br />
tests wsre used as input data to a computer simulation program,<br />
which simulates the sensor's signal processing. The<br />
calculated times were compared with the requirement according<br />
to the 125 mm criteria.<br />
The trigger time that the total $y$tem must meet wa$<br />
determined by the conventional 125 mm requirement, i.e.<br />
the time required for an unbraked mass to move 125 mm in a<br />
crash. (figurE ll). This is to avoid interaction between a<br />
deploying bag and the occupant.<br />
Flgure 11. Unbraked msBB (the "worst case"" of an unrastralnad<br />
drlver) msy move, due lo Inertla, a marlmum of 125 mm<br />
before the bag le fully lnflated.<br />
Further analysis work has shown that when belts are used,<br />
a longer time delay can be accepted. But for the development<br />
of this sensor, the 125 mm requirement was adhered<br />
to,<br />
After a number of development stages, a signal processing<br />
algorithm was obtained which fulfilled the set triggering<br />
criteria, without inadvenent triggering during rough-road<br />
simulation.<br />
The algorithm is subdivided into four path$. Path I integrates<br />
the acceleration signal once to a delta velocity proportional<br />
voltage. Path 2 integrates the acceleration signal<br />
twice to a voltage that is proportional to the displacement of<br />
a free mass. Path 3 integrates the negative acceleration once<br />
to a velocity proportional signal and is used to recognize the<br />
direction of the crash. Path 4 compares the acceleration with<br />
a certain threshold and controls the connection ofthe signals<br />
evaluated in Path I to Path 3. In the logic block, the signals<br />
are connected together depending on certain thresholds and<br />
timing functions.<br />
In general it can be said that in a normal crash, the trigger<br />
signal for the squib is generated by Path l, if a certain<br />
threshold is exceeded. Path 2 to Path 4 are used to distinguish<br />
between a crash situation when a trigger signal should<br />
be generated and, for example, an acceleration signal generated<br />
in rough road conditions where no triggering is<br />
required.<br />
This algorithm was implemented in the hardware solution<br />
which was developed simultaneously. (figure l2)<br />
The programme also includes a diagnostic section which<br />
continuously controls the main component$ of the $y$tem.<br />
Also included is a pan of the progrflmme which calibrates<br />
the acceleration Fansducer during the final test in the fac-<br />
301
Figure 12. Schematlc blockdlagram showing the slgnsl conditloning<br />
parts of the sensor.<br />
tory via software and compensates the acceleration transducer<br />
sensitivity over variou$ temperatures. If a failure is<br />
detected a failure lamp lights up.<br />
Development of hardware<br />
With the help of simulation and practical tests it was<br />
found that an accelerometer in the direction of the steering<br />
shaft was sufficient to give acceleration signals which could<br />
be used. The hardware was built up around a microprocessor<br />
with the necesssary protective circuits and watchdog.<br />
The unit was fitted with a capacitor for a reserve energy<br />
supply in case the ordinary voltage feed is cut off in a<br />
collision. The voltage supply to the sen$or is fed through a<br />
contact reel of clockspring type since the slip rings for the<br />
horn were found unreliable. The tests performed with slip<br />
rings showed that in cold conditions condensation could<br />
freeze on the tracks and cause a voltage cut for up to l0<br />
minutes. Consequently the voltage feed via the slip rings is<br />
used for redundancy.<br />
The hardware concept, shown in the attached block diagram,<br />
is structured in three major parts: acceleration sensor<br />
with amplifier; microcontroller and memory; power switch<br />
and power supply.<br />
Acceleration sensor with amplifier<br />
Piezoelectric acceleration sensor with high shock resis*<br />
tance; amplifier as impedance converter and filter; diagnostic<br />
unit for acceleration sensor.<br />
Microcontroller and memory<br />
Triggering of power switch for squib ignition depending<br />
on implemented software controlled trigger algorithm; controlling<br />
of all diagnostic functions; software stored in the<br />
memory.<br />
Power switch and power supply unit<br />
Low impedance power switch for squib ignition and failure<br />
lamp control with integrated diagnostic functions; voltage<br />
regulator for conditioning of the car supply voltage;<br />
overvoltage protection and switch for reserve energy supply<br />
302<br />
on board. If faults occur in any of the components, the<br />
diagnostic unit gives a signal to a lamp located in the steering<br />
wheel cover.<br />
i<br />
ir'; r<br />
; l E f<br />
l L - t<br />
I<br />
Flgure 13. Elock dlagram showlng the hardware concept.<br />
The final prototypes were verified in a large number of<br />
sled tests and full-scale collision tests. The system fulfilled<br />
all criteria. Furthermore, a number of different rough-road<br />
tests were performed, and these proved positive, i.e. the<br />
sensor did not trigger.<br />
Crash test results<br />
Full-scale collisions have been performed from 0" and<br />
30", pole and under-ride at speeds of 30, 35 and 40 mph. The<br />
Eurobag system was found to function well as a complement<br />
to the seat belt in all the above situations. The sensor<br />
located in the steering wheel fulfils the specified requirements<br />
and functions with the steering wheel tilted in different<br />
positions.<br />
The tests showed that the Eurobag concept reduced Hic<br />
by approximately 25*30qo, see figure 14.<br />
Hlc<br />
800<br />
40 mph 3s mph 30 mph<br />
Sled t€st Barrler tsst Barrlor tcat<br />
Figure 14. Typlcal valuee from the evaluation tests.<br />
Another advantage with the Eurobag was that it reduced<br />
the forward movement of the head by approximately 20o/o.<br />
The forces on the torso belt were reduced by approximately<br />
l0o/o, see figure 15.<br />
Without a Eurobag there is a variation in measured Hic<br />
values due to different head impact location in the tests with<br />
I<br />
Sertb.tt ontY<br />
H zg% @ tu'o"t
KN<br />
I<br />
6<br />
I a.rbilt only<br />
$ euroleg<br />
Flgure 15. 1096 raductlon of torao belt forces wlth Eurobag.<br />
the steering wheel tilted at different angles. However, with<br />
the Eurobag concept, a much more consistent behaviour<br />
was observed. with lower Hic values.<br />
fiplcal readlngr from *led tetilng<br />
I Whh Eurohg<br />
tr w|thourEurob|g<br />
Flgure 16. Gomparison of faclal pr€saure wlth and wlthout Eurobag.<br />
The bar dlagram $howt the hlghoet achleved preesure ln<br />
any of the meaeurlng plEles wlth the samo designatlon.<br />
The Passive Restraint Approach<br />
Robert H. Munson,<br />
Automotive Safety Office, Ford Motor<br />
Company, United States<br />
Abstract<br />
This paper presents an overview of Ford's experience<br />
with "passive restraint" systems. It seeks to update the<br />
conference as to the available field experience with passive<br />
restraint systems being installed in Ford Motor Company<br />
vehicles. The present United States occupant crash<br />
protection standard requires a phase-in ofpassive restraints.<br />
Passive restraints can be automatic belts or air bags. An<br />
overview will be presented of Ford's passive belt and<br />
supplemental driver and passenger air bag experience,<br />
including:<br />
In order to confirm the reduction offacial injuries, a loadsensitive<br />
face dummy was used in the different collision<br />
situations. With the Eurobag concept, the facial pressure is<br />
reduced by an average of80Vo, (figure 16).<br />
Conclusions<br />
This project has shown that a small bag, optimized for<br />
belted drivers is an excellent complement to the seat belt. It<br />
protects the head against impact against the steering wheel<br />
and thereby reduces the risk of head and facial injuries in<br />
head-on collisions.<br />
The possibility to position the sensor in the steering<br />
wheel was successfully demonstrated. By using an<br />
electronic sensor, a sufficiently complex conditioning of the<br />
signal could be made to meet the non-triggering and<br />
triggering requirements and also to diagnose and indicate<br />
faults in the system. There is now the possibility to choose<br />
between a body-mounted crash sensor or a sensor located<br />
directly on the safety system.<br />
The advantages and disadvantages of these two<br />
approaches have to be further investigated and they will<br />
probably vary for different categories of cars.<br />
References<br />
(l) H Norin, G Karlsson, J Komer; "Seat Belt Usage in<br />
Sweden and its Injury Reducing Effect". SAE 840194.<br />
(2) S Koyabashi, K Honda, K Shitanoki: "R.eliability<br />
Considerations in the Design of an Airbag System". <strong>ESV</strong><br />
1987.<br />
(3) C F Kirchoff et al; "Advanced Concepts for Driver<br />
Air Cushion Systems". <strong>ESV</strong> 1985.<br />
(4) D S Breed, V Castellir "Problems<br />
in Design and<br />
Engineering of Airbag Systems". SAE 880724.<br />
r The Decision Making Process-Supplemental<br />
Air Bag vs. Motorized Automatic Belts vs.<br />
Manual Automatic Belts<br />
r Air Bag and Passive Belt System Overview<br />
r The Effects of Mandatory Use Laws on Passive<br />
Restraint Decisions<br />
r Passive Restraint System Field Experience<br />
r The Continental Passenger Side Supplemental<br />
Air Bag<br />
<strong>Int</strong>roduction<br />
This paper will focus on Ford's passive restraint<br />
experience since the lOth <strong>ESV</strong> conference, where another<br />
paper entitled "Supplemental Driver Airbag System-Ford<br />
Motor Company Tempo and Topaz Vehicles" was<br />
presented.<br />
303
Ford's passive restraint program consists of the air bag<br />
supplemental restraint system in combination with an active<br />
3-point safety belt on certain vehicles and motorized<br />
automatic shoulder belts with active lap belts for driver and<br />
right front passenger on other vehicles. It is estimated that<br />
through late April 1989, over 40,000 Model Year 1985<br />
through 1989 Ford Tempo and Mercury Topaz vehicles with<br />
the Supplemental Driver Air Bag Restraint system have<br />
been built and sold (see figure l). These vehicles have<br />
experienced more than three-quarters of a billion miles of<br />
travel. with an estimated 620 accidents that were severe<br />
enough to cau$e the air bag to deploy. Ford and NHTSA's<br />
monitoring programs have reports of 233 of these<br />
deployments. The results are summarized in figure 2.<br />
FLEETS<br />
a<br />
a<br />
FEOERAL<br />
OTHER<br />
HETAIL<br />
TOTAL<br />
r (As oF 4t20l8s)<br />
TEMPO I TOPPZ, SALES *<br />
l$85 t9E8 1987 1S88 1989<br />
s{xto<br />
2400 3700<br />
100<br />
1500<br />
4800<br />
5400<br />
3100<br />
8000<br />
2600<br />
3500<br />
TOTAL<br />
6500<br />
16,5{t0<br />
17,000<br />
40,000<br />
Figure 1. Sales of Tempo and Topaz equipped with the drlver<br />
air bag supplemental r€stlsint $y$tem.<br />
TEMPO / TOPAZ AIR BAG<br />
FLEET EXPERIENCE (AS OF 4-20-8e)<br />
ESTIMATED<br />
MILES DRIVEN (lulLLlONS)<br />
ACCIDENTS<br />
DEPLOYMENTS<br />
REPORTED<br />
DEPLOYMENTS<br />
BELT USE<br />
INJURIES: MODERATE<br />
sERrous<br />
FATALTTTES (DRTVER)<br />
Flgure 2. Tempoffopaz supplemental all bag fleet experlence.<br />
The 1989 model year Lincoln Continental is equipped<br />
with a standard driver and right front passenger Air Bag<br />
Supplemental Restraint System. For the 1990 Model Year,<br />
Ford plans to equip nine car lines with a driver-side Air Bag<br />
Supplemental Restraint System.<br />
The Decisionmaking Process<br />
800<br />
5200<br />
620<br />
23tt<br />
87%<br />
16<br />
3<br />
In July 1984, NHTSA amended FMVSS 208 to require<br />
restraints for both the driver and right front<br />
3<br />
passenger on U.S. pa$senger cars beginning, on a phasein<br />
basis, in 1987. Further, NHTSA required installation<br />
of passive restraints on a// U.S. passenger cars manufactured<br />
on or after September I, 1989 (i.e., the 1990 model<br />
year). The following summarizes a few of the many factors<br />
that Ford considered regarding passive restraint<br />
implementation.<br />
Ford began its evaluation program by prioritizing the<br />
anticipated practical safety benefits of various passive<br />
restraint alternatives on the basis of overall eff'ectiveness,<br />
anticipated usage and customer acceptance. The two-point<br />
motorized passive shoulder belt system was viewed very<br />
favorably, although more costly than non*motorized belt<br />
systems, based on anticipated usage and resultant<br />
effectiveness. Market research confirmed customer<br />
preference for motorized belts, but they were not considered<br />
practicable fbr larger cars with three front $eat positions.<br />
NHTSA, after extensive investigation, had concluded<br />
that air bags in combination with three-point active belts<br />
offered the highest effectiveness in terms of reducing both<br />
fatalities and injuries (see figure 3). However, this<br />
conclusion assumed that three-point active belt use was 100<br />
percent. Before an air bag supplemental restraint systembased<br />
program could be pursued feasibility and<br />
practicability had to be established and there had to be<br />
assurance of greatly increased three-point safety belt usage.<br />
Ford believed then as now that air bag practicability u,ould<br />
be established and the vast majority of the U.S. population<br />
would be covered by effective mandatory seat belt use laws.<br />
On that basis, Ford continued pursuit of an aggressive air<br />
bag implementation program that continues to the present<br />
time.<br />
IIS'URY LEVEL<br />
NHTSA ESTIMATED<br />
RESTRAIHT EFFECTIVENESS RANGES<br />
I/<br />
E$TIIIATED RE$TRAINT EFFECTIVET{ES$ RAI{GES<br />
I-AP AI{D<br />
SHOULDER BELT<br />
AUTOilANC<br />
EELT<br />
AIR BAO<br />
(oNLn<br />
AIB BAS<br />
AI{D I-AP/<br />
SIIOULOEf,<br />
EFLT<br />
FATAL 40-50* 35 - 5{lt6 e0-ttot 'ff - SSti<br />
ats 2-6 45- 55% 40 "55t6 It -t5tg 60-00t9<br />
-!Jf I{HIEA DOCI(ET 74-l4i NOTICE 80, *t'OCUFAHT CF EH FROTECTnili Fll{ L BULP.<br />
Flgure 3. NHTSA efiectiveness estimates.<br />
After thorough review ofthe technical issues and supply<br />
base requirements necessary for supplemental air bag<br />
programs, it was determined that programs calling for<br />
supplemental air bags on some vehicle lines and motorized<br />
belts on other vehicles would be the only practicable means<br />
of meeting the 1990 effective date. To allow for increased<br />
driver-side supplemental air bag availability, Ford<br />
petitioned NHTSA for extension of the 1.0 credit to allow<br />
for driver-side air bag and 3-point active belts after the I 989<br />
model year.<br />
In its petition to NHTSA, Ford stated that if the petition<br />
were granted, it would, in all likelihood;
lnstall supplemental driver air bags on a majority<br />
of its NAAO-designed cars.<br />
Install passenger-side air bags in some 1990<br />
model year cars as resolution of technical issues<br />
and supply base constraints allowed.<br />
These product plans have produced real and tangible<br />
effects. In the 1987 model year, Ford offered its first<br />
motorized two-point passive belt system as standard<br />
equipment on the Ford Escort and Mercury Lynx. In 1988,<br />
use of this system was extended to the Ford Tempo and<br />
Mercury Topaz, while continuing to offer a driver side<br />
supplemental air bag as an option. The all new 1989 Ford<br />
Thunderbird and Mercury Cougar models are equipped<br />
with the motorized belt system while the 1989 Continental<br />
is the first domestic U.S. car to offer both driver and right<br />
front passenger side supplemental air bags as standard<br />
equipment.<br />
For the 1990 model year, Ford will provide supplemental<br />
driver-side air bags on nine of its car lines; some of which,<br />
like Continental, will also offer standard supplemental<br />
passenger side air bags. We anticipate approximately one<br />
million 1990 Ford passenger cars will be sold with<br />
supplemental driver or driver/right front passenger air bags<br />
as standard equipment; we believe in the 1990 model year,<br />
Ford will produce and sell more cars equipped with standard<br />
supplemental air bags than any other manufacturer in the<br />
world (see figure 4).<br />
FORD f,OIOH COTPAI{Y<br />
FASSIVE FESTRAINT AVAILABILITY<br />
;gSry _4!!!L Afm|ltE Hwffi<br />
lttt ffi ruoEil wEr<br />
ilEffi ilrs-Halilolol r-ff<br />
r[r ffi ffiE[ wEr<br />
ltsffi ffiE[ WBI<br />
ffi MflSEIO' r-|w<br />
laaa ffi IffiE[ wat<br />
ffi IffiEN WEI<br />
r-tffi ffiE[ wET<br />
EFffi ffrH-Hllrulol r-ffi<br />
ffiEflil oi|Y[ffiAnrm l-ff<br />
itm il[i-filf|'l.fliilxrlmlllFmff tHtlf,l<br />
(EffiffiffiIfrtM<br />
-DEOI$EY*I41ffffi<br />
ffiilrus|.5rEsEreImrffi<br />
Fffiffi&1ffi<br />
Flgure 4. Ford passlve restralnt avallablllty.<br />
Air Bag and Passive Belt System<br />
Overview<br />
As shown in figure 5, the supplemental air bag system has<br />
four basic subsystems, the sensors, the diagnostic module,<br />
the electrical system and the air bag module or modules. A<br />
detailed description of these subsystems is included in<br />
attachment l. The Ford passive belt system, consisting of a<br />
motorized automatic shoulder belt, active lap belt and knee<br />
bolsters also is described in detail in attachment l.<br />
Mandatory Use Laws<br />
Unlike many other countries, the United States does not<br />
have a national law or regulation governing safety belt<br />
usage by the occupants of motor vehicles. It has been left to<br />
1 989 LINCOLN CONTINENTAL<br />
SUPPLEMENTAL AIR BAG RESTRAINT SYSTEM (SRS)<br />
Flgure 5. Supplemental alr bag $ystem.<br />
each of the fifty states to enact legislation on requiring<br />
safety belt u$age. Currently, thirty-three states plus the<br />
District of Columbia (see figure 6) have laws requiring<br />
safety belt usage at least for front seflt occupants. In<br />
addition, all fifty slates have enacted laws requiring the use<br />
ofchild restraints for infants and young children. Ford has<br />
been actively involved in supporting the passage of these<br />
laws and has encouraged safety belt usage through public<br />
support of safety belt education for our employees, our<br />
customers and the public at large.<br />
MANDATORY<br />
SEAT BELT USE LAWS<br />
Flgure 6. Mandatory use laws.<br />
Increased safety belt usage remains key to passive<br />
restraint system overall effectiveness. Prior to the<br />
enactment of the first state safety belt use laws in the mideighties,<br />
safety belt usage in the U.S. was only about 12<br />
percent. Today, it has reached 46 percent nationally and<br />
over 5l percent in $tates with mandatory use laws. Passive<br />
belts, either motorized or non-motorized, result in<br />
substantially higher usage rates than active belts, leading to<br />
greater net effectiveness in helping reduce fatalities and<br />
injuries on American highways. As active safety belt usage<br />
rates continue to increase, the combination of an active<br />
three point safety belt and supplemental air bags for the<br />
305
driver and right front passenger has the potential to provide<br />
eYen greater net effectiveness.<br />
Thus, it is very important that we in the safety community<br />
continue to strive for increased safety belt usage so the<br />
maximum benefit from the "passive" restraint systems now<br />
being installed in cars may be obtained. We have known for<br />
many years that getting vehicle occupants to buckle up is the<br />
single most important action for improving highway safety.<br />
It is clear that buckling up is still the most important action<br />
even in vehicles with supplemerrtal air bags or a 2-point<br />
motorized shoulder belt system.<br />
Air Bag and Passive Belt System Field<br />
Experience<br />
Ford vehicles with supplemental air bags have now<br />
experienced over three-quarters of a billion miles of travel.<br />
To date, I am pleased to report, the system has functioned as<br />
designed in every collision that has been reported to us. In<br />
addition, we are unaware of any air bag equipped car in<br />
service experiencing an inadvertent inflation of the air bag<br />
or bags. The vast majority of the mileage and reported<br />
collisions which caused the air bag to inflate have occurred<br />
in the Ford Tempo and Mercury Topaz vehicles, which have<br />
been in production since the 1985 Model Year.<br />
There are now also a small number of collisions which<br />
have resulted in the inflation of the driver and passenger<br />
supplemental air bag system in 1989 model year Lincoln<br />
Continentals. These data are summarized in figure 7. I<br />
would also like to emphasize two other points about the<br />
data. Active safety belt usage in the Ford Tempo and<br />
Mercury Topaz vehicles was reported as over 85 percent.<br />
This undoubtedly played a significant role in the<br />
effectiveness of the supplemental air bag. Many of the<br />
vehicles are owned by government and private fleets, which<br />
require or strongly encourage safety belt usage. Moreover,<br />
it is interesting to note that belted drivers have yet to suffer a<br />
non-fatal serious injury. All serious injuries reported were<br />
suffered by unbelted vehicle drivers.<br />
There have been two driver fatalities in these vehicles<br />
that resulted from head-on crashes with trucks (one belted).<br />
As can be seen from figures 8 and 9, neither vehicle had an<br />
intact passenger compartment following the crash and<br />
LINCOLN CONTINENTAL AIR BAG<br />
SALES (AS OF +20)<br />
DEPLOYMENTS (A$ OF 4.20)<br />
PASSENGERS<br />
INJURIES<br />
I'TODERATE<br />
SEHIOUS<br />
FATALITIES<br />
27,300<br />
37<br />
4<br />
DEPLOYMENT NONCE INFORMATION I9 SKETCTIY<br />
Flgure 7. Llncoln Contlnental alr bag supPlementsl restraint<br />
exp€rience,<br />
306<br />
neither incident was judged to be survivable by experts at<br />
the scene, regardless ofrestraint system design. In addition,<br />
our search of the FARS, orFatal Accident Repofiing Sy$tem<br />
data for the supplemental air bag- equipped vehicles has<br />
provided information on two additional fatalities in these<br />
vehicles. The other two fatal accidents were side impact<br />
collisions, for which air bags are not designed to activate.<br />
Figure E. Tsmpa air bag fatal accldent No. 1.<br />
One resulted in a driver fatality and one resulted in a<br />
passenger fatality. Although the numbers are quite small,<br />
we currently have equal numbers of fatalities from frontal<br />
accidents and from non-frontal accidents.<br />
Flgure 9. Tempo air bag latal accident No.2.<br />
The data available from our passive restraint-equipped<br />
vehicles is too limited to allow us to evaluate system<br />
effectiveness quantitatively. However, detailed studies of<br />
both supplemental air bag and passive belt vehicles are<br />
ongoing. One key area of research underway is to compare<br />
safety belt usage rates in 1988 and 1989 model year<br />
Continentals. We are concerned that safety belt usage rates<br />
be maintained at their current high levels, or increased. Our<br />
studies of front seat occupants of new Ford and LincoltV<br />
Mercury vehicles including non-air bag 1988 Lincoln<br />
Continentals show safety belts usage of approximately sixty<br />
percent. We will be measuring usage rates in the air bagequipped<br />
1989 Continentals later this year in the same
locations to evaluate if supplemental air bags affect safety<br />
belt use (see figure l0). We are continuing to study usage<br />
rates and will study crash statistics to develop objective<br />
measures of our passive restraint system field performance.<br />
We look forward to reporting the results of these studies at a<br />
future date.<br />
BELT USAGE SURVEY PLANS<br />
. CONTINENTAL - wlTH / WITHOUT AIR BAGS,<br />
MODEL YEAR 1988 veruur 19Bg<br />
r BELT USE lH CURRENT CARS AND LIGHT TRUCK$<br />
OUARTER<br />
I<br />
il<br />
ill<br />
IV<br />
TENTATIVE SCHEDULE<br />
vEHtcLE UI{ES<br />
TEMPO / TOPAZ, F-SERIES, BRONCO<br />
MUSTANG, PROBE, AEROSTAR<br />
CONTINEI{TAL, TAURUS / SABLE,<br />
ECONOLINE<br />
CROWN VIC / GRAND MARqU|s, TBIRD,<br />
RANGER / BROI{CO<br />
Flgure 10. Ford bslt uaage aurvey plana.<br />
Continental Passenger Side<br />
Supplemental Air Bag<br />
The 1989 Lincoln Continental has the first driver and<br />
right front passenger air bag supplemental restaint system<br />
introduced as standard equipment in the 1980's by a United<br />
States automaker. These vehicles have now been available<br />
to the public since last fall. Over 27,300 have been sold as of<br />
late April 1989. There have been 37 reported accidents of<br />
sufficient severity to have deployed the air bags. We are<br />
unaware ofany fatalities or serious injuries ofeither drivers<br />
or passengers in these vehicles.<br />
Summary<br />
We are clearly on the threshold of a new era in restraint<br />
systems. Ford will go from producing 70,000 driver or<br />
driver/right front passenger air bag-equipped vehicles in the<br />
I 989 model year to one million in the 1990 model year. The<br />
remainder of our passenger cars will have automatic<br />
shoulder belt restraint systems. The magnitude of these<br />
changes is likely to make the next few months a very<br />
challenging time for our assembly operations, and for the<br />
many involved supplier$. Our initial assessment of<br />
customer acceptance and observed usage rates in vehicles<br />
equipped with these systems are encouraging. Detailed<br />
studies are underway, and we look forward to seeing and<br />
reporting the results of passive restraint technology on the<br />
safety of automotive travel.<br />
Attachment L-Air Bag and Passive<br />
Belt System 0verview<br />
Sensors (Figure ll)<br />
The sensors are used to determine the onset of a crash<br />
severe enough to require the inflation of the air bag<br />
Flgure 1 1. Alr bag aensor.<br />
supplemental restraints and are of ball and tube design.<br />
They utilize a biasing magnet to hold the ball firmly at the<br />
aft end of the tube. The activation of the $ensor requires a<br />
deceleration of sufficient magnitude and duration to<br />
overcome the bias of the magnet and sustain the travel of the<br />
ball down the tube for several milliseconds, damped by the<br />
column of air in the tube. to close the contacts at the forward<br />
end ofthe tube. The ball and the contacts are gold plated for<br />
reliability. The sensor is designed to respond to impacts up<br />
to 30" left and right ofthe longitudinal axis ofthe vehicle. A<br />
typical system will have five sensors in the front of the<br />
vehicle. Three are "crash sensors" and two are "safing<br />
sensors". At least one crash $ensor and one safing sensor<br />
must close simultaneously to activate the air bag system and<br />
inflate the air bags.<br />
Diagnostic Module<br />
The air bag system diagnostic module continuously monitors<br />
the system readiness and verifies for the vehicle operator<br />
that it is ready to function whenever the vehicle is started.<br />
This is done through the readiness indicator lamp on the<br />
instrument panel, which illuminates for about six seconds<br />
each time the vehicle is started. Each inflator and sensor<br />
circuit is checked and, should a fault be found, the lamp will<br />
flash to alert the vehicle operator that service is required.<br />
The flashes are coded to indicate the location and nature of<br />
the service required, and the "fault codes" are provided in<br />
the service manual so the service technician knows which<br />
area of the system requires service.<br />
Electrical System (Figure 12)<br />
The electrical system con$i$t$ of a power circuit directly<br />
from the battery, and wiring to each crash sensor, to the<br />
diagnostic module, to the readiness indicator lamp, from the<br />
stan circuit, and to each air bag module. The driver side<br />
circuitry includes a "clock spring" mechanism to transmit<br />
the electrical signal to the $teering wheel-mounted driver<br />
module with a high degree of reliability. Current systems<br />
307
wtRtl{G<br />
HAEHESS<br />
BELT WAFI{ING LIGHT<br />
AHD CHII{E<br />
TEMPO/TOPAZ AIFBAG<br />
ELECTRICAL SYSTEM<br />
cFASH 8EI{$QXS<br />
"'lEBtil'"<br />
Flgure 12. Alr bag electrlcal system.<br />
also include wiring to a tone generator to provide indication<br />
of malfunction of the readiness indicator lamp circuit.<br />
Air Bag Modules (Figure 13)<br />
Flgure 13. Air bag moduleE.<br />
The air bag modules, either driver-side or passenger-side<br />
consist of the same basic components, although they are of<br />
different size and shape, and operate in slightly different<br />
manners. Each has a nylon "bag" although they are different<br />
in shape, size and venting. The driver-side is smaller,<br />
approximately two cubic feet. The nylon is neoprene coated<br />
and venting is by way of two or more vents on the steering<br />
wheel side of the bag. The bag also has internal $traps to<br />
help shape it into a flat cushion shape rather than a sphere.<br />
The passenger side "bag" is uncoated nylon, somewhat<br />
larger, without straps, and vented through the fabric porosity<br />
and through the aspiration ports between the inflator<br />
and the bag. Its shape is more spherical, but flattened somewhat<br />
against the windshield.<br />
Each module also has an inflator assembly, consisting of<br />
a steel canister containing the gas generant, a sodium azide<br />
compound which combusts and releases nitrogen ga$ to<br />
inflate the bag. The inflator is activated by an electrical<br />
signal which causes an igniter to initiate combustion of the<br />
gas generant. Filtering media is used to cool the gases and<br />
contain the combustion process within the inflator canister.<br />
308<br />
Finally, each module has a cover which protects the bag,<br />
but is designed to open when inflation is required. The<br />
driver modulelt use a molded design which tears at molded<br />
in seams as inflation commences. The passenger side may<br />
use a similar design, or a series of small interlocking plastic<br />
tabs to $ecure the two halves ofthe cover together, depending<br />
on the geometry of the cover.<br />
Other System Components (Figure 14)<br />
WAHNING<br />
This restraint module cannot be<br />
repalred. Use Ford publirhed diagnostic<br />
lnetructlons to determine if the unit is<br />
delective. lf defective, replace and dispoee<br />
of the entire unit ae directed in inetructionr.<br />
Und€r no circum$tancee Ehould diagnosis be \<br />
performed using electrically powered test equipment<br />
or problng devlces. Tamperlng or mlshandling<br />
can reeult in personal injury. For spsciel<br />
handllnE handllng lnetructlons, refer to the Ford AlrbaE Alrbag<br />
Shop Manual. eogB.o4ogoso-AA<br />
CONTAIN$ $ODIUM AZIDE<br />
AND POTASSIUM NITRATE CON.<br />
TENTS ARE POISONOUS AND EX.<br />
TFIEMELY FLAMMABLE CONTACT WITH<br />
ACID. WATEH, OB HEAVY METALS MAY PRQ.<br />
DUCE HAHMFUL AND IRRITATING GASES OR<br />
EXPLOSIVE COM.<br />
POUNDS DO NOT<br />
DAI{GEF<br />
DISMANTLE. IN.<br />
CINEHATE, OR<br />
BRING INTO<br />
CONTACT WITH<br />
ETECTFICITY OR<br />
STOFE AT ]EM.<br />
PERATUHES<br />
EXCEEOI{G 2co"F.<br />
FIRST AID: lF<br />
CONTFNTS AHE<br />
OF CHILDREH<br />
SWALLOWED, IN.<br />
OUCE VOMITING - FOR EYE CQNTACT, FLUSH<br />
EYES WITH WATER FOR 15 MINUTES - IF<br />
GASES FROM ACID OR WATER CONTACT<br />
ARE INHALED, SEEK FFIESH AIFI*IN<br />
EVERY CASE GET PROMPT<br />
MEOICAL ATTENTIOT.<br />
THIS VEHICLE IS EOUIPPED WITH A SUPPLE-<br />
MENTAL DRIVER AIRBAG SYSTEM. TAMPER.<br />
ING WITH OR DISCONNECTING THE AIRBAG<br />
SYSTEM WIRING COULD DEPLOY THE BAG<br />
OR RENDER THE SYSTEM INOPERATIVE.<br />
WHICH MAY RESULT IN HUMAN INJURY.<br />
Flgure 14. Air bag system labellng.<br />
The supplemental air bag restraint system is designed to<br />
supplement the conventional lap/shoulder safety belt by<br />
providing additional protection for the face, chest and head<br />
in a frontal crash that is equal to or more severe than an<br />
impact at ?8 mph into a parked car of similar size, or a fixed<br />
object at l4 mph. Thus, there are many types of collisions<br />
where it is not designed to activate, and probably will not.<br />
Examples are side, rear and rollover types of accidents. The
Flgure 15. Automatlc shoulder belt passlve restralnt system.<br />
safety belt must be wom to help protect in these other types<br />
of accidents. We also believe that the safety belt works with<br />
the air bag in frontal collisions to help position and restrain<br />
the occupant for maximum benefit from the combination of<br />
belt and bag. However, in the event someone does not buckle<br />
up, knee bolster surfaces are provided to help control<br />
submarining and provide maximum benefit from the supplemental<br />
air bag.<br />
An additional area that should be rnentioned is labeling.<br />
Each vehicle equipped with the air bag supplemenral restraint<br />
system is labeled, from the vin plate "air bag" nomenclature,<br />
to the individual warning labels on the modules<br />
themselves. These labels are designed to aid the people who<br />
will use, service and, eventually, recycle the vehicle in<br />
accomplishing their contact with the vehicle without unreasonable<br />
risk ofinjury or accident.<br />
Passive Belt System (Figure 15)<br />
The Ford motorized automatic belt system consists of a<br />
motorized automatic shoulder belt with an inboard mounted<br />
Crash Simulation Methods for Vehicle Development at Nissan<br />
Tatsuya Futamata, Hiroyuki Okuyama,<br />
Nobuhiko Takahashi,<br />
Nissan Motor Co., Ltd.<br />
Abstract<br />
For vehicle frontal crash simulation, Nissan has been<br />
using a relatively simple lumped mass-spring simulation<br />
combined with an in-house frame crash program CRAFT.<br />
However, it has been recognized that this procedure does<br />
emergency locking retractor. The motors which position the<br />
belt are activated by the position of the door switch and the<br />
ignition switch. The belt will move forward to allow ingress<br />
and egress whenever the adjacent door is opened. The belt<br />
will move back to the rear, or restrained, position whenever<br />
the adjacent door is closed and the ignition is on. However,<br />
in the event of a moderate to severe accident, the inertia<br />
safety shutoff switch which disables the electric fuel injection<br />
system pump also shuts off the power to the safety belt<br />
system motors. The shoulder belts are designed to work<br />
with the active lap belt to provide maximum protection. In<br />
the event the lap belt is not fa$tened, a knee bolster surface is<br />
provided to help control submarining. Two approaches have<br />
been used to provide for emergency release of the automatic<br />
shoulder belt. Some vehicles have an emergency release<br />
lever mounted on the console adjacent to the retractor. This<br />
lever allows the belt to spool out eyen if the retractor remains<br />
locked after an accident. Other vehicles have a buckle<br />
for emergency release located at the outboard end on the<br />
moving carriage.<br />
not always have capability to simulate frontal crash responses<br />
for vehicle structural design changes directly. Thus,<br />
as an alternative to this conventional method, a commercial<br />
nonlinear dynamic finite element program PAM-CRASH<br />
have introduced and researched to simulate vehicle crash<br />
characteristics using that program run on a super computer.<br />
A step-by-step approach was taken to simulate a test<br />
vehicle crash response staning with its front side rail crash<br />
simulation, and finally, the simulated deceleration of the<br />
309
test vehicle was successfully conelated with its actual crash<br />
test result.<br />
The major issues to be solved in our further study will be<br />
model simplification and application of this simulation<br />
method to various types of test vehicles.<br />
<strong>Int</strong>roduction<br />
The techniques used in carrying out large deformation<br />
vehicle crash analysis have recently been improved by the<br />
use of super*computers and commercial nonlinear finite<br />
element analysis programs which have been suitably<br />
developed specifically for these computers.<br />
In parallel with these improvements, a number of papers<br />
have appeared mainly conceming the modeling methods<br />
and the crash characteristics obtained in vehicle high-speed<br />
frontal crash simulations.<br />
There has been no report of good vehicle deceleration<br />
correlation between crash tests and finite element<br />
simulations by which the dummy injury criteria can be<br />
accurately determined. The principal reasons for this seem<br />
to be (l) computational cost (10 hours'to 20 hours'CPU<br />
time even with a super-computer), (2) software problems,<br />
and (3) the lack of a reasonable modeling technique.<br />
Computational cost may be significantly reduced in the<br />
near future by improving hardware capabilities in<br />
conjunction with optimizing software algorithms. Software<br />
problems include the lack of appropriate finite element<br />
types for modeling some vehicle components, as some<br />
papers mentioned.<br />
Modeling techniques become an issue when viewed from<br />
the fact that some paPers show that the simulated vehicle<br />
deceleration curves do not simulate the tendencies seen in<br />
test results especially with regard to the latter part of the<br />
deceleration's time history.<br />
To overcome these deficiencies, we have introduced a<br />
commercial nonlinear dynamic finite element analysis<br />
program called PAM-CRASH. The program simulates<br />
vehicle crash analysis and has been successful in<br />
reproducing the results of the test vehicles' deceleration<br />
characteristics.<br />
This paper, accordingly, discusses the modeling<br />
techniques acquired in our research which is necessary for<br />
simulating vehicle frontal crash characteristics.<br />
Conventional Method<br />
Nissan has thus far been usiltg "spring-mass simulation"<br />
combined with an in-house program we call CRAFT as the<br />
method for simulating vehicle component crash<br />
characteristics. Figure I shows its simulation concept.<br />
In CRAFT, a frame like a front side rail is modeled as a<br />
structure consisting of rigid beams and plastic hinges for<br />
connecting those beams. The program simulates its<br />
deformation pattern and force-deformation characteristics.<br />
The force deceleration characteristic$ are used for the<br />
corresponding spring element in the spring-mass model and<br />
the vehicle characteristics are determined by spring-mass<br />
310<br />
*<br />
tln<br />
,H<br />
Y\<br />
HSa. I<br />
_ff<br />
Flgure 1. Sprlng-mass mBthod in conlunctlon wlth craft.<br />
simulation. This method has been recognized as being very<br />
useful because it requires a very little time to prepare the<br />
models and run the simulation calculations.<br />
Several issues have remained unresolved, however. One<br />
of them is that CRAFT does not have the capability to<br />
simulate the crash characteristics of frames having<br />
longitudinal shapes which are too straight, that is, no plastic<br />
hinges can be predetermined. This is especially true for<br />
those frames which tend to fold like an accordion. Another<br />
problem is that spring-mass simulation cannot deal directly<br />
with the structural design changes intended.<br />
Against this background, we introduced the commercial<br />
nonlinear dynamic finite element program PAM-CRASH<br />
for three purposes: to simulate every type of frame crash<br />
deformation pattem, to deal with partial or slight structural<br />
design changes, and to simulate vehicle deceleration<br />
characteristics with sufficient accuracy.<br />
Simulation of Vehicle Frontal Crash<br />
Deceleration Characteristics<br />
As noted above, PAM-CRASH is being employed to<br />
simulate the deceleration characteristics of vehicle<br />
passenger car components during crash tests. We take a<br />
step-by-step approach using partial models to finally<br />
correlate all vehicle model characteristics with the test<br />
results. Each step or phase is outlined below.<br />
Phase l. Frame model<br />
Figure 2 shows a typical vehicle deceleration curve at a<br />
crash speed of around 50 km/h (Prototype A). Figure 3<br />
presents typical characteristics during the first half of the<br />
crash. The dotted curve indicates the result of the simulation<br />
with a spring-mass model consisting of a lumped mass and<br />
nonlinear springs, as shown in figure l. This simulated<br />
result correlates fairly well with the crash test data result<br />
which, in turn, implies that the spring-mass model can effectively<br />
reproduce the crash phenomena as far as the first<br />
half of the crash is concemed.<br />
Figure 4 shows a time history of the energy absorbed by<br />
each spring element in this model. From figures 3 and 4, it<br />
can be recognized that the first peak in figure I is derived
g<br />
z<br />
v ECE<br />
5<br />
U<br />
t<br />
Flgure 2. Tlplcal dec€taraflon curve.<br />
0 z<br />
q<br />
E(E<br />
H<br />
LIJ<br />
O<br />
uJ<br />
o<br />
TIME (ms)<br />
_<br />
.--..TEST<br />
MASS SPRING<br />
SIMUI.ATION<br />
Flgure 3. Comparlson of deceleratlon curv€ between mass<br />
Epr|ng slmulatlon<br />
snd crash test.<br />
mostly from the deformation force of the front portion of the<br />
front side rails. This means that the first step in simulating<br />
vehicle deceleration is to obtain correlation for the front<br />
side rail characteristics.<br />
The front portion of the front side rail was then modeled<br />
by thin plate (shell) finite elements, and a dynamic crash<br />
simulation was carried out using PAM-CRASH. In this<br />
case, modeling of the panel assembly was abbreviated as a<br />
thickness increase although the test piece was spotwelded.<br />
This modeling concept is based on the fact that our fundamental<br />
study indicated that the simulation results were not<br />
appreciably affected by different approaches to modeling<br />
panel assemblies (figure 5),<br />
Figures 6, 7, and 8 compare the results of the simulation<br />
L€g€nd<br />
E oTHEFS<br />
N RAD|AToR<br />
m HoooLEoGE<br />
E<br />
CTR MBH<br />
W re stDE RA|L<br />
Flgure 4. Engrgy absorbed by vehlcle components (springmaas<br />
slmulatlon).<br />
o<br />
I<br />
nME (MSECI<br />
Flgure 5. Effect of spot wsld modo|tng.<br />
rEST .f r-|l<br />
tL<br />
EMut.^Ttor [)<br />
C0iarr|ol{ ISO€ fr.<br />
srMutlTKil{ filt<br />
M.€tE Dfi|fiEss<br />
lfll<br />
M<br />
and the crash test ofthe front side rail. These figures clearly<br />
indicate that both the deformed shape and the force-defor,<br />
mation characteristics derived during finite element simulation<br />
correlate well with the test results.<br />
Phase 2. Engine compartment panel model<br />
The result of the spring-mass simulation (figure 4r time<br />
history of energy absorbed by each spring element) also<br />
indicates that the passenger compartment absorbs only<br />
small amounts of energy during phases I and II of the whole<br />
collision process. This implies that the passenger compartment<br />
moves almost as a rigid body with only a very small<br />
plastic deformation. Accordingly, we attempted to reproduce<br />
the results ofportions I and II ofthe deceleration curve<br />
3ll
Flgure 6. Sllnulatlon deformed shape of front slde rEll.<br />
Flgure 7. Teet deformed shape ol llont slde rall'<br />
UJ<br />
o cc<br />
o<br />
L<br />
Flgure 8. Force-tlms characterl8tlcs of lront alde rail.<br />
of the test results using finite element modeling of the engine<br />
compartment (the front portion of the body) and the<br />
simulation.<br />
As a preparatory stage, only the body panels ofthe engine<br />
compartment were modeled. The simulation result was<br />
312<br />
t<br />
tl<br />
ll<br />
tl<br />
1l<br />
li<br />
-T--<br />
,'r\<br />
'w^. F- \<br />
*,._t't-.-.<br />
I l l l<br />
10<br />
- stMutr\TtoN<br />
.---TEST<br />
2b so 40 50<br />
TIME (msec)<br />
compared with the test result obtained under the same condition<br />
to confirm the appropriateness of the body panel<br />
modeling.<br />
The engine compaftment body panels of the te$t vehicle<br />
were assembled for use as the test piece. All panels of the<br />
test structure were spot-welded to each other. On the other<br />
hand, the panel connections made by panel flanges in the<br />
finite element analysis model were modeled as a thickness<br />
increase as in the case of the frame model (figure 9)'<br />
Flgure 9. Engine comPailment panel model'<br />
Figure 10. Slmulation delormed shape of €nglne compartment<br />
pa-nel etructure at 30 ms.<br />
Flgure 11. Delormedshape<br />
of engine comPailment Pan€l<br />
$tructure at 30 m3,
Figures 10, ll and 12 compare the simulation and test<br />
results in this case. These figures indicate that the finite<br />
element analysis model conelate$ well with the panel crash<br />
characteristics, and confirms the appropriateness of the<br />
body panel modeling. The calculation took I.5 hours of<br />
CPU time when PAM-CRASH Ver. 10.0 was run on the<br />
CRAY-XMP/I2.<br />
0<br />
z<br />
I {CE<br />
5IIJ<br />
o<br />
UJ<br />
o<br />
I<br />
I<br />
20<br />
TIME (ms)<br />
SIMUI-ATION<br />
.--.-* TEST<br />
i..i<br />
i i:.i<br />
Flgurc 12. _Dsceleratlon-tlme chsrscterlstlc of englne compart.<br />
m6nt panel.<br />
Phase 3. Addition of power train components<br />
For the final $tep, the large components inside the engine<br />
compafiment, such as the engine and the transmission, were<br />
modeled by shell elements to simulate the first half of the<br />
test vehicle crash deceleration characteristics. Those component<br />
models were connected with the engine compartment<br />
model as mentioned above.<br />
Lumped masses were attached to some of the component<br />
model nodes so that the total mass, the center of gravity, and<br />
the inertia moment of each component could be adjusted to<br />
the same values as those of the test vehicle. The engine<br />
mounting brackets were also modeled by thin shell elements<br />
and the rubber bushes were neglected. The suspension components<br />
were represented as lumped masses and added to<br />
the corresponding nodal points which support them.<br />
The crash characteristics of all components except for the<br />
body panels between the barrier and the front wall of the<br />
engine were represented by shell modeling of some of the<br />
major components and by the stiffness of the front portion of<br />
the engine model (figure l3).<br />
Although the body panel structure model was reformed to<br />
extend backward slightly, the floor panels of the passenger<br />
compartment were modeled only at the front portion for the<br />
following reason. On test vehicle A during the frontal crash,<br />
L'<br />
30<br />
Flgure 13. Englne compartmant slmulation model.<br />
the force from the power train components to the body<br />
panels is transmitted mainly through the closed sectional<br />
beams around the lower area of the dash panel. Therefore,<br />
it<br />
Flgure 1tl. Slmulatlon deformed shape.<br />
g<br />
z<br />
at-<br />
{<br />
E<br />
IJJ<br />
tu<br />
(J<br />
uJ<br />
o<br />
Flgure 15, Comparlson of slmulailon and crash te$t dec€leratlon<br />
curves.<br />
3r3
can be assumed that the dependence of force transmission<br />
on the shear stress field of the floor panel is small enough to<br />
neglect the effect of modeling the rear portion of the floor<br />
panel.<br />
The rear half of the vehicle body was represented as a<br />
moving barrier attached to the front body, with the motion<br />
ofthe rear end nodes on the front body all being constrained<br />
except for the vehicle longitudinal direction.<br />
Figures l4 and l5 show the result of the simulation using<br />
this model in comparison with the vehicle test results. The<br />
figures clearly indicate that the simulation correlates closely<br />
with the first half of the test deceleration time history<br />
except for the shape of the second peak curve as shown in<br />
figure 15. This calculation took 5 hours of CPU time using<br />
PAM-CRASH Ver. 10.0 run on a CRAY-XMP/I2.<br />
Full Vehicle Simulation<br />
As outlined previously, considerable testing was<br />
involved to confirm the applicability of the finite element<br />
modeling method for simulating the crash characteristics of<br />
a vehicle front end.<br />
Here, the entire vehicle was modeled mainly by shell<br />
elements to simulate the vehicle frontal crash<br />
characteristics until crash deformation process was<br />
complete. The reason for this is that the pitching of the<br />
vehicle at the last half of the deceleration time history<br />
cannot be simulated by a model which has the rear half of<br />
the body acting as a rigid moving barrier to which a lumped<br />
mass is attached. On the other hand, some studies have been<br />
employed to determine the reason the Phase 3 model cannot<br />
simulate the second peak of the deceleration curve.<br />
Actual vehicle tests were carried out to analyze the<br />
phenomenon responsible for making this peak' It was found<br />
that the time of contact between the power train and body<br />
panels was distributed around the peak of the deceleration<br />
curve as shown in figure 16.<br />
Thus, the meshing and the material characteristics of the<br />
model around these contact area$ were reviewed, and the<br />
Figure 16. Test vshlcl€ dccelsration.<br />
314<br />
z<br />
Fd<br />
TE<br />
u<br />
t!<br />
r<br />
TIME (ms)<br />
shell modeling procedure was partially modified and<br />
lumped masses were added.<br />
The actual vehicle crash test around on initial velocity of<br />
50 km/h also demonstrated that the tires did not affect the<br />
deceleration characteristics significantly as far as this test<br />
vehicle and conditions were concemed. The doors were<br />
modeled by beam elements which have the correlated<br />
Y-direction crash characteristics of the door panels. The<br />
hood and the fender panels were excluded in both the<br />
simulation and test. Figure l7 shows the whole vehicle<br />
model that was finally devised.<br />
FIGUHE 17. FUII VEHICI"E $IMULATION MQDEL<br />
Figures l8 and l9 indicate the simulated results obtained<br />
using this whole vehicle model. These figures clearly show<br />
that both the deformed shape and the deceleration<br />
'-r- .-- - r- I<br />
*_.:1 ,,'-<br />
--..-..'.,'..1<br />
Figure 18. Compsrlson of simulation and crash test<br />
d€lormatlons.
g<br />
z<br />
I {<br />
EE<br />
3<br />
u,<br />
(J<br />
u<br />
o<br />
TIME (m$l<br />
Flgure 19. Comparlson of slmulstlon and crash test<br />
decelerstlon curves.<br />
characteristics of the passenger compartment from the<br />
simulation result correlate well with the test result.<br />
This calculation took 20 hours of CPU time using PAM-<br />
CRASH Ver. 10.2 run on a CRAY-XMP/I2.<br />
Conclusion<br />
This paper has presented a study in which frontal crash<br />
characteristics, especially the deceleration of the passenger<br />
compartment, were simulated using an explicit dynamic<br />
finite element code. Furthermore, the vehicle<br />
characteristics obtained with the finite element model were<br />
successfully correlated with actual test results using a stepby*step<br />
procedure, beginning with only a small portion of<br />
the whole vehicle body.<br />
Our future studies will focus on four principal objectives.<br />
One will be to reduce the 20 hours of CPU time needed for<br />
whole vehicle simulation. Simplification of the modeling<br />
involved will be a factor in this improvement.<br />
A second objective will be to find a way to make use of<br />
paftial vehicle models introduced as a means of developing<br />
the final whole vehicle mode. It will be possible in this sense<br />
to use the engine compartment model to simulate and<br />
reform the early portion of the deceleration curve. This will<br />
thus be a very useful first step in studying ways to improve<br />
Simulation of Vehicle Crashworthiness and lts Application<br />
Koji Kurimoto, Koji Taga,<br />
Hiroyuki Matsumoto, Yutaka Tsukiji,<br />
Mazda Motor Corporation<br />
Abstract<br />
Vehicle crashworthiness simulation has become increasingly<br />
important in recent years from the standpoint of determining<br />
feasible $tructure within a limited period. This paper<br />
describes simulation of a full scale passenger car with an<br />
ride-down efficiency by reforming the deceleration<br />
characteristics of passenger compartments.<br />
Another aim will be to use component models to ascertain<br />
force-deformation characteristics. Spring-mass simulation<br />
can be carried out using these force-deformation curyes as<br />
input data. This hybrid method will be most effective when<br />
used at the early conceptual design stage.<br />
Finally, the development of an efficient modeling<br />
methodology for vehicles having various types of power<br />
train layouts and body structure$ will be a key objective.<br />
References<br />
( I ) H.G. Hock, A. Poth and W Schrespfer,<br />
"lnfluence of<br />
Modeling Undercarriage and Power Train Componentrr on<br />
the Quality of Numerical Crash Simulation", The Second<br />
<strong>Int</strong>ernational <strong>Conf</strong>erence on Supercomputing Applications<br />
in the Automotive Industry, October 1988.<br />
(2) B. Hazet and M. Guiraud, "Some Applications of<br />
Crash Simulation in Car Manufacturing Industry", The<br />
Second <strong>Int</strong>ernational <strong>Conf</strong>erence on Supercomputing<br />
Applications in the Automotive Industry, October 1988.<br />
(3) J. Hillmann and W. Rabethge, "Computer Aided<br />
Development of a Vehicle Front-end Structure to Improve<br />
Safety for Car Occupants in Frontal Collision", ATZ,<br />
November 1988.<br />
(4) D.A. Vanderlugt, R.J. Chen, and A.S. Deshpande,<br />
"Passenger<br />
Car Frontal Barrier Simulation Using<br />
Nonlinear Finite Element Methode", SAE paper No.<br />
87 I 958.<br />
(5) P.D. Bis and J.F. Chedmail, "Automotive<br />
Crashworthiness Performance on a Supercomputer", SAE<br />
paper No. 870565.<br />
(6) T. Sakurai et al., "Crash Analyses on Passenger<br />
Cars", Journal of the Society of Automotive Engineers of<br />
Japan, Vol.42, No. 10, October 1988.<br />
(7) K. Ishii and I. Yamanaka, "Influence of Vehicle<br />
Deceleration Curve on Dummy Injury Criteria", SAE paper<br />
No. 880612.<br />
(8) K. Matsushita and S. Morita, "Relationship Between<br />
Vehicle Front-end Stiffness and Dummy lnjury During<br />
Collisions", The Eleventh <strong>Int</strong>ernational <strong>ESV</strong> <strong>Conf</strong>erence.<br />
May 1987.<br />
explicit finite element method in case of a frontal crash.<br />
Discussions on how to validate a full vehicle simulation<br />
model with respect to vehicle deformation and rotation of<br />
passenger compartment in a vertical plane are presented.<br />
For the former, it is shown that deliberated component models<br />
such as crossmember, engine supports, and sliding interfaces<br />
between suspension towers and dash upper, etc., result<br />
in a good correlation between experiment and simulation.<br />
For the latter, main components such as hinge pillars, doors,<br />
3t5
tires are characterized in such a way that good correlations<br />
between dynamic component tests and simulation are<br />
achieved. As a result, it is found that a simulation by a full<br />
vehicle model agrees quite well with the experimental results<br />
in relation to the rotational behavior of vehicle.<br />
Analytical results to represent the crash characteristics by<br />
rneans of intemal energies and transmitted forces among<br />
various components are also presented. This approach will<br />
be useful to examine and to improve the crashworthiness.<br />
Preface<br />
At high speed frontal collisions, a rotation of passenger<br />
compartment in a vertical plane, commonly referred to as<br />
"nose<br />
dive", as well as the longitudinal vehicle<br />
deformation often play important roles.(l) This rotation<br />
may give rise to substantial increase of crash space, or it<br />
may degrade restraint capability of a seatbelt system, due to<br />
an additional forward movement of the seatbelt anchorage<br />
points. This paper describes the application of a large scale<br />
computer model to simulate the vehicle dynamics in the<br />
frontal barrier crash. The vehicle is assumed to be a typical<br />
passenger car repre$ented by about 18,000 thin rthell<br />
elements governed by a three dimensional Lagrangian<br />
explicit finite element code, called PAM-CRASH.(2X3)<br />
The object of this study is to validate a full vehicle<br />
simulation model with respect to vehicle deformation and<br />
rotation. In addition, some discussions on the feasibility of<br />
treating crash process in relation to intemal energies and<br />
transmitted forces are presented.<br />
Mathematical Modeling<br />
Mathematical representation of an ordinary passengercar<br />
of front engine and front wheel drive is formed on a threedimensional<br />
space, assuming it crashes into rigid banier'<br />
A total of 18,000 thin shell elements are used for the<br />
bodywork and engine, to allow an accurate representation<br />
of their external geometries and of the internal impacts that<br />
occur during a crash. In addition, bar elements are used to<br />
approximate the suspension unit by providing equivalent<br />
horizontal and vertical stiffnesses to these components. Bar<br />
elements are also used to represent longitudinal door<br />
stiffness. Nodal constraint is used to approximate the engine<br />
supports. Bumper is excluded to reduce cpu-time. Instead,<br />
equivalent dimension of rigid body to residual of deformation<br />
of bumper is added as a substitute of the residual and<br />
longitudinal deformation of vehicle is expressed in such a<br />
way that difference of length between the bumper and its<br />
residual is added to calculated deformation of the<br />
bodywork.<br />
A mesh of approximately l0 X l5 mm elements are used<br />
at the front half of the engine compartment to capture the<br />
impact buckling modes. This then is made progressively<br />
coarse toward the rear ofthe car. Static strain-stress curves<br />
of steel, linearly interpolated by 8 points, are used to<br />
characterize the steel. The windshield is included in the<br />
model because of its structural impoftance, and represented<br />
316<br />
by a mesh of 100 X 100 mm elements with the material<br />
characteristics which is assumed to be equivalent to thin<br />
steel plate of I mm thickness.<br />
Time integration by finite differences yields the solution<br />
of the problem consisting out of acceleration, velocity and<br />
displacement time histories at each material particle or node<br />
of the struature. This time integration is performed using<br />
explicit method.<br />
Simulation Fidelities<br />
A full scale frontal barrier crash test at 35 mph was<br />
performed, obtaining both barrier force, which is defined as<br />
force measured from load cells set on the banier, versus<br />
vehicle deformation, and rotation and vertical movement of<br />
passenger companment versus time.<br />
Taking the observation from test results and the outcome<br />
of several componentwise simulation into account, a<br />
computer simulation is executed on the full scale vehicle<br />
simulation model, shown in figure l.<br />
Figure 1. Full scale model.<br />
The comparison of tested and calculated results with<br />
respect to the barrier force and the rotation and vertical<br />
movement of passenger compartment is shown in figures 2,<br />
3. and 4. At this moment, the results of simulation do not<br />
compare to the test results.<br />
li fr[1a1, orr<br />
lrsl,<br />
Flgure 2. Comparlson ol deformatlon charscterlstlce (orlglnal<br />
condition).<br />
Vehicle deformation<br />
Firstly, it is observed,<br />
in figure 2, a shift of 120 mm from<br />
the origin on the lateral axes is made for the calculation,<br />
because of the reason stated before. Secondly, three phe-
(ilsrrLr)<br />
ilend<br />
Flgure 3. Comparison of passenger compartment rotatlon<br />
(original condltlon).<br />
__11:l__!J:ht rr"ltl-l_lj. j<br />
Flgure 4, Compariron of pa88enger compartment yertical<br />
movement (at slde rail lront, orlglnsl condltlon).<br />
Large neeh SD4l I ncEh<br />
Flgure 5. Eft6cr by modlflcetlon ol crossmember.<br />
nomena which differ between test and simulation are observed<br />
as follows.<br />
(i) For phenomenon l, firsr peak force by simulation is<br />
recognized a$ a consequence ofan impact of the equivalent<br />
dimension of rigid body to residual of bumper deformation,<br />
to the rigid banier, which is neglected. Next, the value of the<br />
second peak force by simulation is higher than that by test.<br />
Judging from the difference of the deformation of crossmember<br />
between test and simulation as shown in figure 5,<br />
the cause is considered that mesh used to represent crossmember<br />
is too coarse for that to buckle at the point between<br />
its front-end and the engine support. Consequently, changing<br />
the mesh size for crossmember from 100 X l0O mm to<br />
30 X 30 mm, difference between test and simulation with<br />
respect to the deformation of the crossmember and barrier<br />
force are improved.<br />
(ii) For phenomenon 2, the deformation of the vehicle by<br />
simulation is smaller than that by test in figure 2, when the<br />
peak force is produced at the time when the engine contacts<br />
to the rigid barrier. Judging from the difference of the behavior<br />
of the engine between test and simulation as shown in<br />
Sol id nount Sol t nount<br />
Flgure 6. Effect by modificatlon of englne mounl.<br />
figure 6, the cause is considered that the engine supports<br />
modeled by using nodal constraint are too $tiff for the engine<br />
to move parallel to the ground a$ test. Consequently,<br />
changing the model for the engine supports to bar elements,<br />
which are characterized by using static stress-strain curves<br />
of the engine supports by test, good agreementri between test<br />
and simulation with re$pect to the behavior of the engine<br />
and the barrier force are achieved.<br />
; t , ; l<br />
- - i<br />
- l<br />
; i<br />
t' ,|'.1<br />
' f i<br />
!. L\'<br />
1 !<br />
i ,., 1<br />
l<br />
I<br />
I '\\ ii<br />
Flgure 7. Comparlson ol deformed characterlstlc (modlfled<br />
condltion).<br />
(iii) For phenomenon 3, at this region, the barrier force by<br />
simulation, which is attained after the engine impacts barrier,<br />
is lower than that by test. Deliberately adding sliding<br />
interfaces behind the engine between suspension tower and<br />
dash upper, etc., good agreements between test and simulation<br />
with respect to the barrier force are achieved.<br />
Figure 7 shows the result of comparison of test with<br />
simulation with all of the above-mentioned measures at a<br />
crossmember, engine supports, and sliding interfaces. It is<br />
shown on this figure that these considerations result in good<br />
correlation between test and simulation with respect to barrier<br />
force.<br />
Vehicle rotation<br />
llnflj<br />
inr<br />
\<br />
In figure 3 and 4, it is observed that the rotation and<br />
venical movement of passenger compartment differ between<br />
test and simulation. Comparing deformation process<br />
of each component during the crash between test and simulation,<br />
observing high speed movie films of the test and<br />
animated pictures of the simulation, it is recognized that<br />
deformation of the tires, of the doors and of the hinge pillar<br />
of passenger compartment are much different between test<br />
and simulation. Accordingly, validity of material characteristics<br />
or method of modeling for each of those components<br />
are examined further as follows.<br />
(i) The tire, so far, has been represented by thin steel<br />
317
I<br />
I i<br />
l^l-<br />
l;f<br />
1,,)f,<br />
I<br />
itrl<br />
lct<br />
lc)<br />
lIa-<br />
f,...<br />
q)<br />
L.<br />
(s<br />
dla<br />
00<br />
80<br />
[]i 0<br />
40<br />
40 B0 120 l[i0 200<br />
Dr:1'orrrra,Iion(mm) i<br />
Flgure 8. Deformatlon charsctsristic ol tlre<br />
plates of 2 mm thickness. A crash test of the tire into the<br />
rigid barrier is performed at 4.7 mph, which is selected as<br />
the speed for the tire to deform on the full scale vehicle crash<br />
test, obtaining barrier force versus tire deformation. By<br />
executing the simulation of the tire about deformation characteristics<br />
with various thickness of thin steel plates, it is<br />
found that using thin steel plates of 0.1 mm thickness results<br />
in good agreement between test and simulation with respect<br />
to barrier force as shown in figure 8.<br />
t--<br />
I<br />
II<br />
I<br />
l^<br />
lEa<br />
i-x<br />
lv<br />
I<br />
ior<br />
l(J<br />
i L<br />
l o<br />
it*<br />
| ,"<br />
l*,<br />
t -<br />
I t"..,<br />
I r..,<br />
I rtt<br />
lca<br />
I I<br />
II<br />
I<br />
40<br />
2,0<br />
ltl<br />
I<br />
?0 40<br />
Dr:lora,1,ion(mn)<br />
Figure 9. Deformatlon characterlstlcs of dool<br />
!i imrrla,Li<br />
'l'Er<br />
s 1,<br />
(ii) The door, hitherto, has been represented by three bar<br />
elements. Here again a crash test of the door into the rigid<br />
barrier is performed at 8.9 mph which is selected to obtain<br />
comparable deformation to compare the results with those<br />
by the full scale crash test. It is found that deliberated model<br />
of the door using shell elements results in good agreement<br />
between test and simulation with respect to barrier force as<br />
shown in figure 9.<br />
(iii) The hinge pillar, so far, has been represented by a<br />
mesh of 100 X 100 mm. A crash test of the hinge pillar into<br />
the rigid barrier is performed at 13.8 mph, which is selected<br />
by the same reaEon stated just above. It is found that using a<br />
mesh size of 30 X 30 mm results in good agreement between<br />
test and simulation with respect to barrier force as shown in<br />
figure 10.<br />
;{t<br />
*}(<br />
"tJ<br />
(t{<br />
Ct<br />
J<br />
t-<br />
.9<br />
Btj<br />
[:i 0<br />
/t n<br />
'l<br />
\/<br />
r-. ') fl<br />
at{<br />
4t5<br />
Sirirrla,l;ion<br />
'l'c:<br />
sl t<br />
l) cr l' o r rna, L i o n ( rnni)<br />
Figure 10. Deformstlon characterlstlce of hlnge pillar'<br />
l0<br />
2<br />
0 50 100<br />
T iilc( ilsec)<br />
(4) l,cft llund slde<br />
T i ile( ilsec)<br />
(b) Rirht Haild Side<br />
Flgure 11. Comparlaon of passenger compartm€nt lotation<br />
(modified condltlon).<br />
Tine (rscc)<br />
0 E0 100 0<br />
(a) Left llrhd Sidtt<br />
g<br />
+ t00<br />
f, 200<br />
Tile (rsec)<br />
(b) Risht Hand Side<br />
Fioure 12. Compsrison of pas3enggr compartment vertlcsl<br />
mdvement (at slile rail front,'modlflet condiiion)'
Figure I I and 12 show the results of comparison of test<br />
with simulation with all the above-mentioned measures at<br />
tires, doors and hinge pillars. It is shown on these figures<br />
that these considerations results in good agreement between<br />
test and simulation with respect to the rotation and the<br />
vertical movement of passenger compartment.<br />
Decomposition of Transmitted Force<br />
and <strong>Int</strong>ernal Energy<br />
In order to understand well of crash phenomena in the<br />
process ofvehicle crash, it is necessary to obtain data such<br />
as force, deformation, etc., at various components of<br />
vehicle, as well as at vehicle as a whole. However, generally<br />
these data obtained from the direct measurement are limited<br />
because of large deformation, interference between each<br />
component, high deceleration during the impact, etc.<br />
Therefore, it is thought quite useful and also necessary to<br />
obtain the supplemental information by taking advantage of<br />
the simulation of mathematical model as described in this<br />
pflper.<br />
As typical examples, figure 14 and figure 15 show the<br />
transmitted force and internal energy among various<br />
components obtained from the simulation described above.<br />
These figures show thflt the force inflicted on the front end<br />
of the front rail is conveyed to respective components<br />
toward the passenger compaftment and that the energy is<br />
absorbed at these points. The location of these points are<br />
shown in figure 13.<br />
Flgure 13. Sch€matlcs of anglne cornpartment.<br />
Figure 14 indicates that, in this case, the engine seems to<br />
have a small effect on the transmitted force on the front rail<br />
at the rear part of engine support, because the value of<br />
transmitted force at front end of front rail nearly correspond<br />
to that at rear part of engine support. In addition, transmitted<br />
force of front rail seems to be divided equally at rear part of<br />
suspension tower into the rear end offront rail and the upper<br />
part of the engine compartment, namely, wheel apron.<br />
Figure 15 indicates that the percentage ofthe absorption<br />
of the initial kinematic energy possessed by the vehicle is<br />
about 307o for the front rails and about 25Vo for the<br />
cro$smember. Thus, the paths or amount of, transmitted<br />
-<br />
(u<br />
L<br />
o<br />
t!<br />
800<br />
600<br />
400<br />
200<br />
-f1snl end of f ront rail<br />
"-" Rear side of<br />
eng i ne support<br />
---.- Rear end of f ront rail<br />
..*.--Rear end of uheel apron<br />
0l<br />
0 l0 20 30 40 50 60<br />
T i me( msec )<br />
Flgure 14. Decomporltlon of tren$mltted force.<br />
l5<br />
Eto<br />
>r<br />
bo<br />
L<br />
o)<br />
u D<br />
Flgurc 15. tl,ecomposlllon ol <strong>Int</strong>ernal energy.<br />
force and internal energy are easily obtained, which<br />
generally difficult to measure.<br />
Summary and Discussions<br />
ln it ia I K inemat ic<br />
Energy<br />
0 20 40 60 B0 100<br />
Time(ers)<br />
Front rail<br />
Crossnenbe<br />
Eng i ne<br />
t/hee I apro<br />
It is demonstrated that the vehicle model by finite<br />
element method is effectively and conveniently used.<br />
In order to achieve good correlation between the mathematical<br />
model and actual full scale frontal barrier crash test.<br />
it is found necessary to deliberately make model of<br />
components such as a crossmember, engine supports, etc.,<br />
and to carefully characterize main components in such a<br />
way that good correlation between dynamic component test<br />
and simulation are achieved.<br />
Among this area to be examined further is a curtailment<br />
of the number of shell elements for reducing cpu-time. An<br />
approach to this area may lie in a simplification of the model<br />
based on closer examination of actual phenomena, by<br />
eliminating ineffective components.<br />
Although there is room for improvement, the computer<br />
simulation method presented here is considered acceptable<br />
for practical applications, for example, to various parameter<br />
studies.<br />
319
Acknowledgment<br />
The authors would like to thank the related people of<br />
Mazda Motor Corporation, who gave kind suggestion in<br />
preparing this paper.<br />
References<br />
(l) K. Kurimoto, et al., "An Analytical Management of<br />
Frontal Crash Impact Response", Proc. of lOth <strong>ESV</strong> conf.,<br />
pp.452{459, 1985.<br />
(2) Paul Du Bois, et al., "Automotive Crashworthiness<br />
Performance on a Supercomputer", SAE paper 870565,<br />
1987.<br />
(3) Donald A. Valder Lugt, et al., "Passenger<br />
Car Frontal<br />
Barrier Simulation Using Nonlinear Finite Element<br />
Methods", SAE paper 87195t1, 1987.<br />
Occupant Simulator Preprocessors: Parameter Studies Made Easy<br />
Edwin M. Sieveka and Walter D. Pikey,<br />
University of Virginia Department of<br />
Mechanical and Aerospace Engineering,<br />
William T. Hollowell,<br />
U.S. Dept. of Transportation National Highway<br />
Traffic Safety Administration<br />
Abstract<br />
The use of computer simulated parameter studies<br />
provides a cost-effective means for examining a wide range<br />
ofaccident scenarios and vehicle designs. To facilitate these<br />
studies the National Highway Traffic Safety Administration<br />
is developing preprocessor programs for several occupantenvironment<br />
crash simulators. Given an existing input file,<br />
these preprocessors automate the task of generating the<br />
many, perhaps thousands, of additional files that are used in<br />
large parameter studies. This paper describes two such<br />
programs, PADPREP and MVMAPREP. PADPREP creates<br />
new input files for the PADS simulator which is used to<br />
study driver/steering-assembly interactions. MVMAPREP<br />
supports the MVMA-ZD program, which is used for<br />
passenger and pedestrian simulations. In addition to<br />
describing program use, demonstration parameter studies<br />
generated by each preprocessor are included as examples.<br />
<strong>Int</strong>roduction<br />
A high priority in automotive safety research has always<br />
been to optimize occupant compartment design so that the<br />
largest margin of safety is provided over the widest possible<br />
range of accident conditions. The variables which need to be<br />
considered include seat design, restraint design, dashboard<br />
design, steering assembly design, collision speed, and<br />
compartment integdty (resistance to intrusion). Adequately<br />
assessing the effects of these many parameters can require<br />
thousands of test "crashes." Performing such a parameter<br />
study with actual vehicles is prohibitively expensive and<br />
time consuming; only a few subsystem and full scale crash<br />
te$ts can reasonably be performed on each production<br />
vehicle, and these are usually done at the impact speed<br />
required by government te$t specifications. Thus, the goal<br />
of optimizing vehicles for occupant safety, or of evaluating<br />
320<br />
the full performance range of existing vehicles, cannot<br />
begin to be realized without the aid of computer simulated<br />
crashes.<br />
In its frontal protection research program, the National<br />
Highway Traffic Safety Administration (NHTSA) has<br />
chosen to focus on the MVMA-ZD and PADS occupant<br />
simulators (1, 2, 3).+ MVMA-ZD is used for passenger<br />
simulations; PADS was designed to simulate primarily the<br />
driver and steering assembly interaction. Using only the<br />
simulators, parameter studies are difficult because they<br />
require manually editing hundreds of input files, which is<br />
tedious and time consuming. To expedite creating the<br />
numerous input files required in parameter studies, the<br />
NHTSA has sponsored projects at the University of Virginia<br />
to write preprocessor programs for both PADS and<br />
MVMA-2D. They are referred to as PADPREP and<br />
MVMAPREP. Starting from a single input file, these<br />
programs can generate sets of up to 1000 new input files for<br />
their respective simulator programs.<br />
This paper present$ sample parameter studies which<br />
demonstrate the use of the PADS and MVMA-ZD<br />
simulators in conjunction with their newly created<br />
preprocessors, PADPREP and MVMAPREP.<br />
Overview of the PADS Software<br />
System<br />
Pads<br />
The PADS occupant simulator was developed for the<br />
NHTSA by MGA Research Corp. and has been updated by<br />
the University of Virginia (4, 5). It can model both drivers<br />
and passengers but it is designed primarily to model<br />
driver/steering-assembly interactions. Six modes of<br />
steering assembly deformation are provided, including<br />
radial and tangential wheel-rim bending, whole-wheel<br />
crushing, wheel rotation, column rotation, and column<br />
stroke. Inertial resistance of the wheel/column mass is<br />
included, as well as frictional resistance at the $hear capsule<br />
and the column bushings. The capability of restraining the<br />
occupant with a 3-point belt system is also included.<br />
*Numbers in puentheses designate references at end of papcr.
The occupant's body is modeled with four jointed<br />
segments representing the head, torso, thigh, and lower leg.<br />
Five contact sensing circles, shown by dashed circles in<br />
figure l, detect impacts with vehicle surfaces other than the<br />
steering assembly. The surfaces recognized are the roof<br />
header, windshield, upper dash, middle dash, lower dash,<br />
seat cushion, and seat back. In driver simulations, torsocircle<br />
impact with the dashboards is assumed not to occur<br />
due to the presence of the steering wheel, but the head circle<br />
is used for roof and windshield contact and the knee circle<br />
for lower dashboard contact.<br />
Wheel contacts with the occupant are presently<br />
determined from the Beometry represented by the heavy<br />
lines in figure l. The torso region is translated forward,<br />
relative to the torso line-segment, by the radius of the upper<br />
torso circle; its thickness remains constant as the occupant<br />
rotates. It is divided into shoulder and abdomen regions.<br />
The head region is also rectangular but is based on the radius<br />
of the head circle. It, too is unaffected by rotation of the<br />
body or head. Future plans call for the head circle to be used<br />
for head/wheel contact, but this requires additional<br />
revisions to the contact algorithm.<br />
Flgure 1. PADS contsct zonee.<br />
Kinplot<br />
The PADS KINPLOT program produces plots of occupant,<br />
steering assembly, and contact surface position at<br />
specified time intervals; figure 2 shows an example of such<br />
a plot. Occupant position plots are essential when working<br />
with simulator programs as a qualitative check on the fidelity<br />
of the calculations. If one ignores position plots and<br />
concentrates too much on numerical results such as the<br />
Head Injury Criteria (HIC), the Chest Severity Index (CSI),<br />
or the peak head and chest accelerations, it is possible to<br />
obtain plausible quantitative answers which actually come<br />
from qualitatively unrealistic occupant kinematics.<br />
PADPREP<br />
The PADPREP preprocessor program accepts as input a<br />
standard PADS input file as well as another file called the<br />
experiment design file (EDF). The EDF file contains<br />
information for the PADS program and also a list of up to<br />
eight variables which are to be modified by PADPREP. The<br />
file is in template form with u$er prompts built in. This<br />
approach reduces the amount of interactive input required<br />
by PADPREP while still giving the user clear input<br />
directions; it also provides a useful reminder of the<br />
parameter study's contents. A sample EDF template is<br />
shown in figure 3. The fitrst five entries tell PADPREP about<br />
the type of input file being used and the type of output<br />
ffi tut af,tnl$ ffiffi flPtr<br />
I-EffiIft z-Tfl-AffiIE<br />
I<br />
--- ffirM Drarg ttd<br />
---- lM3 ru-lM'il<br />
(MIIEHnIBIfCfi|EII<br />
ArrCE Td ffDI O' lEHilD ffiPU? DISTEDI<br />
IrDlttrru z-MilfiD 3-lllUlffi VEGA ffiI a.xffi<br />
I<br />
arc ffi ffi tr!ftffi rcl DlDt ffir Ot ffi MIEI<br />
r) fftffi yw xril lldtt tmY<br />
b) IX?E-ilil LI'TIrc IT E IIT<br />
ot f,ItrFH Dlil-rrut<br />
d) fiEIff DEF'ITS<br />
.) cuffitlE rul-PHElaor tM<br />
tt CUMTIE S4il rr& ffiFr<br />
o.H.r mrs l|IEil<br />
(F f,fi aEPrsI rdat f ,g ttTt cffi il ap&!a]<br />
t0t0r0<br />
ffif, Til ffDI OI trCUPffiI<br />
l-DRrWf, Z-FEAEHI<br />
I<br />
aEH rd ff?l Ot tEI EAmIFT<br />
0<br />
o-ffiilgmlED l-N ffit :.tfllo fitt<br />
ErE rE xlmEt or vffiilg s Sctu (H. il 8)r<br />
j.N r ffiO<br />
ETE VNINC DIfA II IE 'IE4 IH trI N& LIEI<br />
VNl:IIr<br />
{vr!'rr[ xrEr Eaf il rE sgtttrtot<br />
Til{<br />
cdfrect<br />
COHIE<br />
ATMIft IIffiM ruI COIxlnIIfi<br />
VEM VEE OF trEA trc<br />
0,5<br />
0.d3<br />
0.5<br />
0.03<br />
Flgure 3. PADPFEP erporlment deslgn flle.<br />
0 0<br />
0 t<br />
ad<br />
ibor<br />
32,1
desired. The next entry is the number of variables in the<br />
parameter study. At the end of the file is a table containing a<br />
list of variable names, with starling values, increment<br />
values, and the number of cases (increments) to be<br />
computed for each variable. Two additional entries are also<br />
included. The correlation flag permits a variable to be<br />
correlated with the one immediately preceding it if this flag<br />
is non-zero; a chain ofcorrelated variables can be built up in<br />
this manner. Finally, the .rcale mode field determines<br />
whether scaling (scale mode = 0) or direct input (scale mode<br />
= I ) is used. Either is permitted except for vector quantities;<br />
in which case, the new value is treated as a scale factor only.<br />
PCFG<br />
The PADS Control File Generator (PCFG), which was<br />
written at the DOT Transportation Systems Center (TSC),<br />
expedites the creation of PADS input data sets. It is designed<br />
to operate on a special PADS database that is maintained by<br />
the NHTSA. The user specifies the type of vehicle, the type<br />
of steering wheel, the collision acceleration pulse, occupant<br />
size and age, and other data, such as whether the occupant is<br />
belted or not. The PCFG can also be used to alter most of the<br />
PADS input variables and can do parameter ranging to create<br />
multi-file "run sets" for use in parameter studies. It<br />
differs from PADPREP in that new input files are always<br />
created by accessing original information from the PCFG<br />
database. PADPRER on the other hand, operates directly on<br />
an existing PADS data file. The two programs can operate<br />
effectively in tandem, with the PCFG used to create a baseline<br />
file which can then be modified easily with PADPREP.<br />
This combination is especially useful if the baseline file is to<br />
contain numerous changes to the database values since the<br />
PCFG can be used to "edit" the database information before<br />
creating an input file. Once this baseline file has been<br />
created, however, it is more efficient to perform parameter<br />
scaling with PADPREP since no further reference to the<br />
database is necessary.<br />
PADS Simulator Demonstration<br />
The examples which follow are a qualitative<br />
demonstration of the capabilities of PADS and PADPREP<br />
and their potential usefulness in occupant compartment<br />
parameter studies.<br />
Basic capabilities<br />
The set of plots in figure 4 demonstrates the various<br />
modes of steering assembly motion. The interior dimensions<br />
approximate those of a subcompact passenger car and<br />
the collision speed is 20 mph. In figures 4a4c the steering<br />
column position is such that the contact forces generated by<br />
the occupant are primarily parallel to the axis of the column<br />
and hence there is little column rotation but considerable<br />
column stroke and wheel crush. Head injury in this case<br />
would be due only to windshield contact. In figures 4d-4f,<br />
the column has been raised higher relative to the occupant.<br />
The first position is closer to the actual wheel position, but<br />
322<br />
the second situation could occur during an accident ifdistortion<br />
of the car's front end displaces the steering assembly<br />
from its normal location. In this case. the forces perpendicular<br />
to the column axis are much larger and significant column<br />
rotation occurs. More important, the column strokes<br />
much less, Because of the design of collapsible steering<br />
columns, if the perpendicular force is too large it creates<br />
excessive friction between the column's moving parts and<br />
the stroking motion is inhibited. Thus, a column which<br />
strokes properly and mitigates injury in its normal design<br />
configuration may perform poorly if its alignment relative<br />
to the occupant is altered during a crash. This is a good<br />
example of a case in which a simulator program can prove<br />
very useful. Since it is not practical to build actual cars with<br />
steering assemblies in different locations, the simulatorprogram<br />
can be used to estimate the range of displacements<br />
relative to the occupant over which the column's crush<br />
characteristics can provide significant injury reduction.<br />
Standerd C-olufll Rafued C;olumn<br />
time = .080 sec<br />
timc =.120ecc<br />
timc = .180 sec<br />
Flgure 4. Subcompact-20 MPH colllelon.<br />
Parameter study<br />
As a simple demonstration of a parameter study, PAD-<br />
PREP was used to generate nine PADS input files from the<br />
subcompact file that was used for figures 4a4c. The variable<br />
studied was the steering column stroke resistance and it<br />
was allowed to vary from 0.5 to 2.5 times its baseline value<br />
in increments of 0.25. Figure 5 shows the entries in the EDF<br />
template needed to generate this study. All of the PADS
simulations produced plausible occupant behavior. The injury<br />
measure numbers are of the appropriate magnitude but<br />
for now should be considered relative to each other only.<br />
The HIC and CSI results are plotted in figure 6. In general,<br />
the curves display the anticipated trend of increasing injury<br />
level as column stiffness increases. Note that both curves<br />
show a decrease in injury for columns softer than the baseline<br />
value. This could indicate that a softer column would<br />
provide for greater occupant safetyn but other factors such as<br />
injury levels at higher collision speeds would have to be<br />
considered as well.<br />
lEl rfl ffilt 6t vNlMt S ru (ll.t. Ot t)t<br />
t<br />
ffi vW ilTl Itr Tf,E tIru M Wg NBES LIXIr<br />
(V[M TIEA roAf IT TE ilAIIFIEDI<br />
V|W ATNTIfr IXffiT roEI' CffiIIfr 'ffi<br />
w vEu vE4 0t illt w Ht<br />
ffiE 0.5 0.I5 I 0<br />
Flgure 5. EDF rntrleE for column stlftnoss study.<br />
C.olumt Stilfnct<br />
Flgure 6. HIC and CSI reaponae surfacee.<br />
The peak acceleration levels for the herd and chest are<br />
plotted in figure 7. The chest results show only moderate<br />
sensitivity to column stiffness for values below 2 times the<br />
baseline, however, at higher stiffnesses the curve rises<br />
sharply before leveling off again. In the case of head acceleration.<br />
the results are even more dramatic. with the curve<br />
being completely flat through 2 times the baseline and then<br />
jumping suddenly by about 30 G's for the last two points.<br />
Other than to say that a softer column seems slightly bener,<br />
there is no clear indication from these results of what the<br />
optimum design should be. They do, however, illustrate<br />
another important piece of information that can come out of<br />
a parameter study.<br />
While one generally approaches a parameter study with<br />
the intention of finding an optimum design, it can also be<br />
important to identify design regions that are particularly<br />
bad. In this case, based on peak head and chest acceleration,<br />
the conclusion would be that column stiffness should be<br />
restricted to values less than about 1.75 times the baseline<br />
value. These results also illustrate how a study ofdifferent<br />
injury measures can be useful. The values of HIC and CSI<br />
Grlumn Stlffncq<br />
Flgurc 7. Peak acceleratlon r€sponse surfaces.<br />
rise steadily with column stiffness over most of the design<br />
space, but there is nothing dramatic or unexpected about the<br />
curves. The sudden jumps in the acceleration curves, however,<br />
clearly alert the investigator that a transition to a different<br />
column-performance regime has occurred.<br />
MVMA-2D Software Overview<br />
MVMA-zD<br />
The MVMA-2D occupant simulator has been developed<br />
at the University of Michigan Transportation Research<br />
Institute with support from the Motor Vehicle Manufacturers<br />
Association (6). The occupant's body is modeled by<br />
eight lumped masses with fourteen degrees of freedom. The<br />
body's "surface" can be represented by user defined<br />
ellipses. As in PADS, the vehicle's interior is represented by<br />
a series of line segments, but in MVMA-2D the number of<br />
segments can be chosen by the user. Contacts can occur<br />
Flgure 8. MViIA-2D/TRIX output.<br />
323
etween body ellipses and the vehicle line segments, and<br />
between the body ellipses themselves. The program also<br />
contains an airbag model, simple and complex belt models,<br />
and a steering assembly model. The latest documentation<br />
states, however, that the steering assembly model is not<br />
fully operational. An example of MVMA*ZD passenger<br />
and vehicle geometry is shown in figure L<br />
TRIX<br />
The TRIX program (shon for Tektronix Stick figure plotting<br />
program) is the MVMA-2D equivalent of the PADS<br />
KINPLOT program. It produces occupant position plots<br />
such as the one in figure L As with KINPLOT, examination<br />
of TRIX output is essential in order to verify that the occupant's<br />
motion is realistic and that occupant/vehicle contacts<br />
are properly accounted for.<br />
MVMAPREP<br />
The MVMAPREP program is a preprocessor designed to<br />
create multiple MVMA-ZD data files for a parameter study<br />
which uses an existing MVMA-2D data file as a starting<br />
point. As with the PADPREP program, the modifications to<br />
be made to the baseline file are specified in a template-style<br />
EDF file. An example template is shown in figure 9. Each<br />
line of user input must begin with a ">" marker in column<br />
one and all entries must be placed within the fields delimited<br />
by the dashed lines below each entry header. All numerical<br />
data items can be scaled or directly replaced by a user<br />
defined quantity. Character data items can be modified in<br />
the sense that ellipse contacts can be changed, added, or<br />
deleted, as well as material propefties associated with ellipses<br />
and vehicle surfaces. Justification of numerical data<br />
CN@ ETIPEE CffircT8I<br />
----- lHHffi DIAIOX tIU<br />
------ M-lD ffi-ffilgaoR<br />
ffil lxBM ffi IHI rxDlilsD rrff6 ----------------<br />
-- oH lrf,lE Eclfrlffi srTf, t<br />
"<br />
><br />
ITIPAE ES M c@rtr til cilT&t<br />
ttcf,<br />
sDorutr<br />
ssD<br />
aEN<br />
ffi<br />
ffit r?<br />
ffitD<br />
CErre! ETIPEE OR ffiIil ATERIE FNOruf,TY E'IGXI|EMI<br />
> @ F<br />
lttrtBt oE<br />
nlclof, xrE<br />
SIIRIE<br />
CErrcE trlERICd FMEB IY ffiIfd dR DIruCT ItrFM:<br />
Ill xox-PNtEtr 4sDl v&l$lEar<br />
tlltl<br />
ID*<br />
&IPAE OR<br />
ruolox trrE<br />
ffi<br />
ftc, trltD<br />
t f<br />
f , m E<br />
VEE<br />
t07 xrDaftT 2 3 r.1 0<br />
1 0 I I 6 1 0 0 . 1<br />
l2I euErnr I t 40,0 I<br />
(21 PIIIETER alml v*ISl88 (N. oF 8)t<br />
LItrE<br />
rDf<br />
ETI'8E ff<br />
MIil<br />
tIFEr r<br />
LIFSTAT<br />
f,rE<br />
- { i<br />
- 4 3<br />
Flgure L Experlment deslgn fil6.<br />
324<br />
0,5<br />
X<br />
('cC. Frrd ATffitlrc IfCUEm I Or C a vlslM<br />
| | vsur v&E lflcR. r f, NrE<br />
0,5 a 0 0 EtoftE<br />
a r 0 twtdcr<br />
within associated fields is not necessary. However, since<br />
MVMA-2D treats blanks within character data fields as<br />
significant, the user must insure that ellipse, region, and<br />
material names in the EDF file occupy the same position<br />
within the field that they occupy in the baseline file.<br />
The first two categories in the EDF file, ellipse contacts<br />
and material property assignment, represent one-time<br />
changes. MVMAPREP reads the baseline file into an internal<br />
workfile and makes all the above changes before generating<br />
the parameter study files.<br />
The first sub-category under numerical parameter<br />
changes is also used for one-time changes, in this case for<br />
numerical data which is not part of a parameter study. A line<br />
ID number is required for all enfries. The ellipse or region<br />
name is needed for those cartes for which there are multiple<br />
lines with the same line ID number. The occurrence number<br />
entry (OCC.#) allows a specific data point within a force/<br />
deformation table to be altered or allows the entire table to<br />
be scaled. Once a match is found for the line ID number and<br />
the name field, MVMAPREP moves down (OCC.#-1) additional<br />
lines, if the occurrence number is positive, before<br />
making a change. If it is negative, MVMAPREP changes<br />
ABS(OCC.#) lines including the original match. The new<br />
value field contains scale factors or new values for direct<br />
input. Finally, the scale mode field (SM) determines whether<br />
scaling (SM = 0) or direct input (SM = I ) is used. Either is<br />
permitted except when the occulrence number is negative,<br />
in which case the new value is treated as a scale factor only.<br />
The last entry category in the EDF file is for numerical<br />
parameter study variables. Up to eight variables, producing<br />
up to lff)O different case combinations, can be processed in<br />
a single study. Most of the entry fields are the same as for the<br />
non-parameter study category, but a few have been added.<br />
The new value field has been replaced by a starting value<br />
field plus an increment field. The increment number field<br />
specifies how many levels of each variable are to be calculated.<br />
The correlation factor field (CF) permits variables to<br />
be correlated with one another in the same manner as described<br />
for the correlation flag in PADPREP. Finally, the<br />
last addition is the variable name field which allows the user<br />
to give name$ to the variables in the parameter study.<br />
MVMAPREP/MVMA-ZD Parameter<br />
Studies<br />
Following sections describe two related parameter<br />
studies performed with MVMA-2D with the aid of the<br />
MVMAPREP preprocessor. The variable chosen for these<br />
studies was the stiffness of the torso belt portion of a threepoint<br />
belt restraint system. The baseline data set was<br />
derived from a NHTSA simulation of a mid-sized passenger<br />
car sled test at 30 mph.<br />
The motivation for studying the torso belt stiffness came<br />
from the observation that the restraint belts permitted very<br />
little forward motion of the occupant's torso despite the<br />
relative severity ofthe crash (see figure l0). This suggested<br />
the possibility that belts with greater stretch (or spoolout)
would reduce injury measures, such as HIC and peak<br />
acceleration, by providing the occupant with a longer "ridedown"<br />
time.<br />
Flgure 10. Msxlmum forward occupant posltion wlth origlnal<br />
belt stlffnssE.<br />
Case one<br />
The force/strain data in the original data file was linear<br />
beyond a strain of 6Vo and reached a value of 9450 lbs. at a<br />
strain of lfi)7o. For the purpose of the parameter study, the<br />
following baseline data was chosen:<br />
Strain -0.00 0.25 0.50 0.75 1.00<br />
Force -0.00 2500 5m0 7500 l0(n0<br />
To create the study, the entries shown in figure I I were<br />
entered into a blank EDF template. The changes in the nonparameter<br />
study category ensure that the instrument panel<br />
area is sufficiently stiff for contact with the head to be<br />
obvious. Any change in belt design which permits head/<br />
dash contact is considered unacceptable in this study and<br />
such contact should not be masked by an overly soft dashboard.<br />
The parameter study itself is described by the last<br />
line in the EDF file which specifies that the force/strain data<br />
table for the torso belt is to be scaled in ten l07o increments,<br />
beginning at l07o of the baseline value. The resulting family<br />
of force/strain curves. one curve for each of ten new<br />
MVMA-2D input files, is shown in figure 12.<br />
CBrEr ffid Tffi IT ffiIffi il DIffi Iffit<br />
III H-tM ml vull$rul<br />
LIil ETffi * trC. 'IE H<br />
rDI HIf,rM I . YM<br />
> 407 TItGlt -a I I0.0 0<br />
I ao7 EEI! -a r 3.0 b<br />
tzl rM tmt vw (ru. or lrr<br />
ttn Erflt il ffi, trH EErc rrffi | d t I<br />
IDI rEIilff T I vEil vEE IfcI. Ix IrE<br />
> tol affiT -3 t o.LI 10 0 0 tEffi<br />
Flgure 1 1 . EDF entrles lor belt stlfine$$ *tudy-Case 1.<br />
I<br />
I<br />
F<br />
o<br />
R<br />
c<br />
E<br />
Flgure 12. Bell stlflneas.4sse 1.<br />
l.f 6.4 a.a<br />
STRAIN<br />
The parameter study response surface$ for the HIC, peak<br />
head acceleration, and peak chest acceleration injury measures<br />
are plotted in figure 13. The most dramatic feature<br />
occur$ at the belt stiffness scale factor of l0vo. At this<br />
stiffness the occupant makes hard contact with the dashboard<br />
as shown in figure 14. For all other stiffnesses, even<br />
down to 20Vo of maximum. no dashboard contact occurs.<br />
however, there is also no dramatic improvement in the injury<br />
measures. The best case is for a scale factor of 0.4, for<br />
which the improvements in HIC, head g's, and chest g's are<br />
9Va, llo/a, and lTVa, respectively. Still, one would probably<br />
TBE. E<br />
I .r"."<br />
N<br />
J<br />
U<br />
R<br />
rla..<br />
Y<br />
M<br />
E<br />
A<br />
s<br />
U<br />
R<br />
E<br />
rfttt. I<br />
tQl6. a<br />
AEEE. E<br />
768E. E<br />
65Ca,5<br />
t€ea,a<br />
{EEE. E<br />
tE6€,6<br />
eE6C. a<br />
1464. €<br />
6,6<br />
tf .5<br />
lo.c<br />
3E.E<br />
s.6<br />
t.l<br />
E.e<br />
c. a E.a<br />
Flgure 13. Inlury reeulta-Caee 1.<br />
5,1<br />
a,t<br />
BELT STIFFNESS SCALE FACIUR<br />
t.t<br />
32s
conclude that for belts with linearly increasing stiffness,<br />
there is little to be gained by simply reducing the stiffness of<br />
the original design.<br />
Flgure 14. Occupant-dashboard contact tor belt stlffness factor<br />
ot 0.1.<br />
Case two<br />
There are, however, other ways in which the belt performance<br />
can be changed. It is well known from shock isolation<br />
theory that having an energy absorber with piecewise<br />
constant force/deformation properties is the best way to<br />
minimize peak accelerations. Furthermore, the first constant-force<br />
plateau should be reached as quickly as possible.<br />
In the case of seat belts, some approximation of this effect<br />
might be achieved via the spoolout mechanism.<br />
To test a simplified version of such a force/strain curve<br />
for seat belts, the parameter study EDF template was modified<br />
as shown in figure 15. Before scaling, the force and<br />
strain data table was changed so that a constant force plateau<br />
extends from a strain of l2.5%a to 62.5Vo. Since it was<br />
observed in Case I that the maximum force stayed below<br />
25fi) lbs, this value was used for the plateau level of the<br />
stiffest curve (scale factor of l). The resulting family of new<br />
belt stiffness curves is shown in figure 16.<br />
The injury measure curves for this parameter study,<br />
shown in figure 17, are indeed much more interesting. Solid<br />
contact with the dashboard again occurs for a scale factor of<br />
cwd Iruw tM tt ruIU6 fi DIIH llml<br />
(llH-Pffirffiffir<br />
Ltn<br />
rDl<br />
tEDttrt 0t<br />
ffiIf, ffi<br />
ocd, tttD id t<br />
f f f f i r<br />
> aor rrrrsT -a 3 10,0 0<br />
> tot Effitt -a I t.0 0<br />
' ,01 rffi 2 2 0.lll I<br />
' 706 8ffi! I 5 2100. r<br />
> 70r rM a I 0,625 I<br />
> 70t dffiE! a I 2f,O0. I<br />
IzlDr$GHffiffi(H.qr't<br />
im &IrEil ffi.tttrttMIBffiad cavM<br />
rDl wrilIE | | vEE vEE lf,f,.tx IM<br />
- --*;---<br />
0,I 0 0 tl[$ff<br />
Flgure 15. EDF entde$ for b€lt $tlffness study4ase 2.<br />
326<br />
F'<br />
U<br />
t9666 , E<br />
96eE ' a<br />
EE6€'6<br />
?666.e<br />
6CaO.e<br />
R<br />
t668.€<br />
c<br />
E<br />
+EEE. E<br />
3EEE. E<br />
8685.6<br />
1666.6<br />
6.8<br />
6,6 6,a e.{ 6,3 E,a 1.S<br />
STRAIN<br />
Figure 16. Belt stillness.4aae 2.<br />
0.1 and a grazing contact also occurs for the 0.2 case. Injury<br />
measures for the three stiffest belts are similar to those<br />
obtained in Case I. This time, however, the curves show<br />
clear minima in the HIC and head acceleration values at a<br />
scale factor of 0.4. The corresponding chest acceleration<br />
value is also the next to lowest. The improvements in the<br />
three injury measures relative to the original linear baseline<br />
curve are 54Vo, 4OVa, and22Vo, respectively, a very substantial<br />
change. The occupant's maximum forward position<br />
when using this belt stiffness is shown in figure 18.<br />
While the results of this study have not determined the<br />
optimum design characteristics for torso belts, they have<br />
I<br />
N<br />
J<br />
U<br />
R<br />
Y<br />
M<br />
E<br />
A<br />
s<br />
U<br />
R<br />
E<br />
6.t 8.3<br />
BELT STIFFNESS SCAI.E FACTOR<br />
Flgure 17. lnlury results-Gase 2.<br />
E.J s.?
Tirnc(mmc): 120.fi<br />
Flgure 18. Maxlmum forward occupsnt po8ltlon wlth belt stlffness<br />
factor of 0.4.<br />
demonstrated the power of even a simple, qualitative occupant<br />
simulator parameter study to shed new light on safety<br />
system design. The simulation study has shown that occupant<br />
injury levels show remarkably little variation over a<br />
wide range of belt stiffnesses when using belts with linear<br />
stiffness characteristics, and that significant improvements<br />
may be possible through proper tailoring of the belt's force<br />
versus strain behavior.<br />
Simulator validation<br />
An often overlooked application of preprocessor generated<br />
parameter studies is in the area of simulator program<br />
and model validation. The usual approach to occupant simulator<br />
validation is to compare simulated occupant responses<br />
to measurements taken from a sled test or a fullvehicle<br />
crash test, of which only a limited number are available.<br />
Due to this small sample space, initial validation efforts<br />
do not always uncover program limitations that can<br />
cause problems when other designs and crash environments<br />
are simulated. Sometimes input data can be chosen during<br />
the initial validation effort that gives agreement with test<br />
results while masking a flaw in the program. Since extensive<br />
parameter studies place special demands on simulation<br />
programs by requiring them to run reliably over a wide<br />
range of input data, such flaws will often surface during a<br />
study which pushes the limit$ of the original model.<br />
Even when a program has been properly validated, it is<br />
still possible to construct a model with data that irr too tightly<br />
bound to a particular test. For example, a table of force<br />
deformation data which gives good agreement in a 25 mph<br />
simulation may be too limited in range for an impact at 35<br />
mph; leading to incorrect results. For such reasons, it is a<br />
good idea to subject a baseline model to some preliminary<br />
"test"<br />
parameter studies in order to make refinements be-<br />
fore using the model extensively.<br />
References<br />
( l) Cohen, D., L. Stucki, C. Ragland,<br />
"Development of<br />
Analytical Procedures to Characterize the Vehicle<br />
Environment in Frontal Impact Accidents", SAE paper no.<br />
850251,1985.<br />
(2) Stucki, L., D. Cohen, and C. Ragland,<br />
"Evaluation of<br />
Frontal Occupant Protection Using the Passenger/Driver<br />
Simulation Model", Proceedings of the Tenth<br />
<strong>Int</strong>ernational Technical <strong>Conf</strong>erence on Experimental<br />
Safety Vehicles, Oxford, England, pp.459-4?9, May 1985.<br />
(3) Cohen, D., and L. Simeone, "The Safety Problem for<br />
Passengers in Frontal Impacts-Analysis of Accident,<br />
Laboratory, and Model Simulation Data", Proceedings of<br />
the Eleventh <strong>Int</strong>ernational Technical <strong>Conf</strong>erence on<br />
Experimental Safety Vehicles, Washingron, D.C., lgB7, to<br />
be published.<br />
(4) McGrath, M. and D. Segal, "The Developmenr and<br />
Use of the PADS (Passenger/Driver Simulation) Computer<br />
Program", Final Report, National Highway Traffic Safety<br />
Administration (NHTSA), Conrract No. DTNH2Z-EZ-R-<br />
07017, March 1984.<br />
(5) Sieveka, E.M. and W.D. Pilkey, "Implemenration<br />
of<br />
the PADS Program in the Safety Systems Optimization<br />
Model", Final Report, National Highway Traffic Safety<br />
Administrarion (NHTSA) Conrracr No. DTRS-s7-95-<br />
00103, 1988.<br />
(6) Bowman, 8., R. Bennett, and D. Robbins, MVMA<br />
Ttvo-Dimensional Crash Victim Simulation, Version 4,<br />
Vols. l-3, University of Michigan Highway Safety Research<br />
Institute, Final Repofi No. UM-HSRI-79-5*1,2,3,<br />
June 1979.<br />
on the Safety Body Structure of Finite Element Method Analysis<br />
Toshiaki Sakuria, Toshihiro Aoki,<br />
Passenger Car Engineering Center<br />
Mitsubishi Motors Corporation<br />
Abstract<br />
In developing the safety body structure of a small vehicle,<br />
it is necessary to consider both the body structure system<br />
and restraint system. In this paper, body structure system is<br />
discussed without changing the current characteristics of<br />
restraint system. In order to determine the crashworthiness<br />
requirements of body structure, the body is divided into two<br />
subsystems viz. engine compartment and passenger<br />
compartment. Deceleration Ge and Gc are introduced for<br />
subsystems, while for total body structure, transfer function<br />
Dc is introduced.<br />
Thus, there exists the optimal crashworthiness balance<br />
between the engine compartment and passenger<br />
compaflment.
On the other hand, it is necessary to devise an analytical<br />
method to verify the requirements. Various analyses are<br />
studied. As a result, it is seen that FEM (Finite Element<br />
Method) is useful to predict the crashworthiness. It is also<br />
$een thflt the passenger comPartment protection predicted<br />
from FEM is verified by testing the prototype vehicle'<br />
<strong>Int</strong>roduction<br />
Computer simulation makes it possible to evaluate the<br />
safety related characteristics of a vehicle. ln previous<br />
studies of crash analysis of a vehicle mass-spring<br />
simulation, static buckling analysis and experimental<br />
formulas have been carried out (l)+. However these<br />
methods could not respond to design of engineer for safety<br />
vehicle in an intial design stage of development-<br />
The objective of this paper in noticing body structure<br />
system without changing the current restraint system<br />
discusses the following items:<br />
(l) To investigate the experimental data variance at<br />
the fixed barrier frontal impact test'<br />
(2) To compare data with finite element code which<br />
is capable of treating non-linear materials and<br />
experimental results.<br />
(3) To illustrate crashworthiness of body structure<br />
by defining factors Ce, Gc and Dc as dependent<br />
variance.<br />
(4) To confirm that there exists the optimal<br />
crashworthiness balance between the engine<br />
compartment and passenger compartment on the basis<br />
of from FEM and verify it by testing the prototype<br />
vehicle.<br />
Primary Experiment<br />
Experimental Dsta Variance<br />
It is necessary to confirm the reliability of experimental<br />
data by evaluating calculation results and experimental<br />
data. A few impact tests have been carried out' Table I<br />
shows the coefficient of variation with the test results of<br />
initial maximum deceleration of a vehicle to the fixed<br />
Table L Cosfilclent of varl8tlon.<br />
u--H*"<br />
i : Mcan Valuc 6 ; $t6ndrrd Deviation<br />
barrier in Iow and high velocity. Table 2 shows the<br />
coefficient of variation with the respect of static and<br />
dynamic compression test of straight and curved frame.<br />
Table 3 illustrates the results of tests executed to study the<br />
coefficient of variation of occupant injury from sixteen<br />
+ Numbers in parentheses designdtc rcferences at end of ptper.<br />
328<br />
Coefficicnt of Variation<br />
X,=oli<br />
5mph fixed vanier 0.05<br />
30mph fixed vanier 0.07<br />
Tsble 2. Coefficlent of varlstlon.<br />
Coefficient of Variation<br />
0 0.05 0.1<br />
Straight<br />
Frame<br />
Curved<br />
Frame<br />
i-iTFI<br />
tFl : Sratic l-l ; Dynamic<br />
Table 3. Coetflclent ot varlatlon of occupant inlury.<br />
Occupant Injury x o x<br />
HIC<br />
CHEST g<br />
FEMER LOAD<br />
lb<br />
D:Driver Seat P:Passenger Seat<br />
vehicles under the fixed banier frontal impact tests. As<br />
shown in table 3, the coefficient of variation is considered to<br />
be about 0.07. In general the coefficient of variation is<br />
relatively small in case of tests carried out with less<br />
uncertain factor such as compression test with simple<br />
figure; on the other hand, it is somewhat larger in the tests<br />
with some degree of uncertainty involved such as complex<br />
injury evaluation tests.<br />
Comparisons between FEM and test re$ults<br />
Test vehicle<br />
Using a production vehicle as a basis, it is possible to<br />
check the FEM analysis performance and compare test results<br />
against model results. Test vehicle is a body in white<br />
equipped with suspension to move on in testing' Table 4<br />
describes the test conditions.<br />
Table 4. Test condltlons.<br />
D 685 140 0.20<br />
P 70t 8l 0.12<br />
D 4l 3.2 0.08<br />
P 33 2.r 0.06<br />
D 440 218 0.50<br />
P 579 247 0.43<br />
Vehicle Type 4 doors small sedan<br />
Vchicle Weight 470 kg<br />
Impact Velocity 30 mph (48km/h)<br />
Impact Form Fixed Varrier
FEM analy$is and model<br />
It is necessary to include the following items for analyzing<br />
crashworthiness<br />
of vehicle:<br />
( l) geometric non-linearity,<br />
(2) material non-linearity,<br />
(3) elasto-plasric rhin plate/shell,<br />
(4) non-linear spring element,<br />
(5) progressive rivet failure with structural collapse,<br />
(6) a slide line algorithm which prevents penetration<br />
of internal structure surface.<br />
Irt case of transient response problems such as crash, it is<br />
al$o necessary to solve the motion equation with time int€gration.<br />
Explicit integration is preferable for solving crash<br />
simulation problems compared implicit integration, Furthermore<br />
the dependence of strain rate of material is to be<br />
considered.<br />
One program is selected of a few crash simulation program<br />
codes vectorized for supercomputer (2).<br />
Next, FEM model in question is explained as follows.<br />
The body panel such as frame, outer panel, floor and roof are<br />
modeled with thin shell element to capture the impact buckling<br />
modes. In addition, bar element are used to approximate<br />
the suspension unit and wheel by providing equivalent<br />
horizontal and vertical stiffness for these components. A<br />
part of flange of panel connected with spot welding is modeled<br />
with two plate thickness. The weight of tires is anributed<br />
to the suspension model with lumped mass. Rigid walls<br />
may be defined which provide extemal impact surfaces,<br />
while a slide line algorithm prevent$ penetration of internal<br />
$tructure surfaces that may collide during the crash simulation.<br />
Slide line interface conditions are available for frames.<br />
In deciding mesh element of FEM analysis, they must be<br />
decided according to purposes, time and accuracy of calculation,<br />
and restraint conditions in the program itself. Especially<br />
in the explicit method, the solution advances through<br />
the impact duration using a small time step ba$ed on the<br />
velocity of sound (or wave propagation time) across the<br />
smallest mesh element. Thi$ ensures that the physical phenomena<br />
including stress wave effects are completely followed<br />
qnd that solution is stable. The velocitv of sound of<br />
steel Co is Co = [f/p. es is Co = 5 X 106 mm/sec, rhere fore<br />
the size of timestep is less than I (F seconds. In view of the<br />
above the optimum size of mesh element is 20 mm X 20<br />
mm. The number of mesh elements is about 9000 because<br />
the finer mesh contributes to deformed area. while the<br />
coarser mesh does to the undeformed zone such as rear body<br />
structure. This is why mesh becomes more coarse toward<br />
the rear of the vehicle.<br />
Comparisons between calculation and test<br />
results<br />
The correlation of the simulation against experimental<br />
results is a key point of the calculation. Specific items under<br />
consideration include:<br />
FI<br />
vl<br />
q'<br />
tr<br />
tr<br />
fit<br />
q.)<br />
q,J<br />
(J<br />
0)<br />
;<br />
q<br />
^o<br />
z?,<br />
tr4.-<br />
q)<br />
(J<br />
o<br />
IJ.<br />
L}<br />
(q<br />
r<br />
tr<br />
q<br />
0.0<br />
0.0<br />
calculation<br />
time (second)<br />
calculation<br />
time (second)<br />
0.3t)<br />
o'30<br />
Flgure L l{odal decclsrstlon versus fimo curyo and lmpact<br />
Ioad Y€rEUS<br />
tlme.<br />
. to verify the accuracy of the simulation with regard<br />
to the impact force and deceleration pulse.<br />
. to study collision modes of each structural member,<br />
critical member being front side member and<br />
passenger floor.<br />
The numerical and experimental deceleration and impact<br />
force illustrated for a 30 mph impact into a fixed barrier in<br />
firgure [. The important first 0.30 seconds are calculated and<br />
are shown in the figure. The first peak is a little delayed in<br />
the analytical model, but as shown in the figure, the result of<br />
calculation shows reasonable correlation with the experimental<br />
ones. Figure 2 shows a FEM model and deformation<br />
mode of calculation. A good correlation between the calcu-<br />
3?9
lated and experimental results is shown as in figure 2.<br />
Thus the FEM has been proved to be one of the valuable<br />
tools in predicting the crashwot"thiness of body structure<br />
with the aid of high speed computer.<br />
Flgure 2. FEM model snd doformatlon mode.<br />
Evaluation of Crashworthiness and<br />
Verification by Testing the Prototype<br />
Vehicle<br />
Evaluation of crashworthiness<br />
It is imponant for a safety vehicle how crashworthiness<br />
and occupant protection characteristics are developed and<br />
incorporated in vehicle designs. There are targets for<br />
occupant protection for example HIC in FMVSS No. 208.<br />
However, targets for body structure to construct to a safety<br />
vehicle cannot be found in previous papers. In order to<br />
determine the crashworthiness requirements of a new car<br />
design, two dependent variations are offered: one is<br />
deceleration Gc and Ge observed on the side-sill around<br />
peripheral front seat, and other decelerance Dc.<br />
Body deceleration Ge and Gc<br />
Figure 3 shows a definition of deceleration Gc and Ge.<br />
Here Ge is defined as average crash pulse in initial deformation<br />
and Gc is defined as average one in laterdeformation of<br />
vehicle. If deformation is assumed that occurs progressively,<br />
it is found that Ge is a crash pulse of engine<br />
compartment of vehicle and Gc is a one of the rear frame<br />
around the peripheral dash board and passenger<br />
compartment.<br />
Furthermore, a merit of this figure in presenting a deceleration<br />
deformation curve as shown in figure 3 is to<br />
estimate the distribution of energy absorption.<br />
Total crash energy E is denoted as follows:<br />
E=GeXt+GcXr (l)<br />
330<br />
cl<br />
0)<br />
tu<br />
o<br />
{)<br />
A<br />
Flgure 3. Deflnltlon of Ge and Gc.<br />
Thus Ge and Gc is related to crashworthiness, progression<br />
ofcrash and occupant injury as mentioned later' In<br />
addition, the fact that body deformation occurs progressively<br />
can be proved by a simple mass-spring simulation.<br />
The simulation results are shown in figure 4. From<br />
figure, a condition is found as follows:<br />
Kr/K2
x<br />
o<br />
g<br />
A<br />
SOhDh<br />
l - t<br />
.jtttt -_xlJ.ph,-\<br />
\ \\<br />
\..-<br />
r_-r<br />
-- \q-a- I<br />
- 2.8nph<br />
-----<br />
o-<br />
Body Cofigunrim<br />
Flguro 5. ,Dsceleratlon at varlous Impact velocltles and body<br />
conllguratlon.<br />
Verification by testing the prototype vehicle<br />
Various analyses are studied by considering Gc, Ge and<br />
Dc from FEM in order to obtain a high quality of crashworthiness.<br />
Figure 6 shows the target verified by testing the<br />
prototype vehicle. In checking the occupant injury twodimensional<br />
simulation is carried out (4). Figure 7 shows<br />
the results of calculation. As the figure 7 shows, occupant<br />
injury is unchanged. Figure I illustrates the sketch of the<br />
prototype body structure. Countermeasured components<br />
are the strengthened side member, the additional perimeter<br />
frames around peripheral wheel housing, the strengthened<br />
floor and side-sill, and the formed double floors. Total<br />
weight of this vehicle is not increased by adjusting the<br />
stringer onto the floor panel.<br />
Test Results<br />
Static crash te$t<br />
In order to confirrm a deceleration Gc and Ce of the<br />
prototype vehicle a static cra$h test is carried out as shown<br />
in figure 9. Figure 9 (a) shows rhe outline of rhe test<br />
procedure for determining the frontal buckling load and<br />
figure 9 (b) shows the outline of the test procedure for rear<br />
Ll<br />
o t.0<br />
.E<br />
d<br />
E<br />
tr 0.9<br />
0.8<br />
currcnl model<br />
Flgure 7. CElculatlon resulta of occupant Inlury.<br />
I<br />
5<br />
E<br />
{)<br />
t)<br />
o<br />
d<br />
Body Dcformation<br />
Flgure 6. Target verllled by te3tlng the prototypg vehlcle.<br />
Double Floor,<br />
Strengthened Side Member<br />
.Perimcicr Frame<br />
, .Strengthened Side-sill<br />
Flgure 8. Sketch ofth€ prototype body structure.<br />
Ldad Ccll<br />
/<br />
t *,1--1<br />
AU -/ll)_ry/ I AV,<br />
U - U<br />
Flgure 9. Test method.<br />
- r-o<br />
Body Deformation Body Deformation<br />
0<br />
U<br />
0.9
part buckling load of body structure. In case of (b), the<br />
suspension part is incorporated so as to be similar to an<br />
actual vehicle. Figures l0 and I I show the test results. As<br />
shown in those figures, static buckling load has a tendency<br />
to increase.<br />
*<br />
b4<br />
G<br />
.g<br />
6<br />
I<br />
Flgurc 10.<br />
memDer.<br />
^f<br />
E{<br />
.g<br />
d<br />
6<br />
100 200<br />
Deformation of Side Member (mm)<br />
Statlc compregelon test r€sults of thc lront $ldE<br />
50 100 150<br />
Deformation of Rear Side Member (mm)<br />
(Passenger Compartment)<br />
Flgure 11. Statlc compresclon t6$t resultE of the rear slde<br />
member.<br />
35mph barrier impact test<br />
Figure 12 shows the relationship between deceleration<br />
and deformation of vehicle in the 35 mph barrier impact test'<br />
Figure 13 illustrates the experimental results of deceleration<br />
Dc. As the figure shows, Ge and Gc increase, and Dc also<br />
increases.<br />
J9<br />
E<br />
o<br />
E<br />
0<br />
0<br />
o<br />
d<br />
Body Deformation (mm)<br />
Flgure 12. Relationshlp b€twocn doceleratlon and deformatlon<br />
In 35mph.<br />
332<br />
Model<br />
Flgure 13. D€celeratlon of the experimentsl results.<br />
ln addition, vibration phenomenon considered as one of<br />
the vehicle functions is investigated before the crash test.<br />
Figure 14 shows the relationship between response and<br />
frequency. In comparison with current body structure, its<br />
frequency increases.<br />
bo<br />
!4<br />
g<br />
Flgure 14. Relatlon betwsen lcsponse and frequency.<br />
From the above mentioned results, it is found that factors<br />
Ge. Gc and Dc come to be variable to estimate crashworthiness<br />
of body structure. It is also found that FEM analysis is a<br />
very useful tool to predict the crashwofihiness of body<br />
$tructure in an early design stage.<br />
Conclusion<br />
Deceleration<br />
Dc<br />
Cunent Model I<br />
Prototype Vehicle l.l<br />
(J<br />
-<br />
,F 0'l<br />
,4)<br />
6<br />
F<br />
0.01<br />
By introducing Ge, Gc and Dc for estimating the<br />
crashworthiness of body structure, the optimal design rule<br />
for safety vehicle which has been ambiguous is discussed.<br />
By using the FEM program of vectorized supercomputers<br />
on a commercial scale, complex and varied impact<br />
phenomena are clarified.<br />
(1) Variation of estimating the crashworthiness exists.<br />
(2) FEM analysis is very useful to predict the crashworthiness<br />
of body structure in impact.<br />
(3) Safety body designed from FEM analysis and testing<br />
a prototype vehicle is confirmed.<br />
The authors intend to continue their research into safety<br />
vehicle in the future.
References<br />
(l) T. Sakurai, M. Takagi, Nonlinear Structure Analysis<br />
on Vehicle Development-Present Status and Future<br />
Trends, J. JSAE (in Japanese), Vol. 43, No. l, 1 989.<br />
Identification of Safety Problems for Restrained Passengers in Frontal Impacts<br />
Daniel S. Cohen,<br />
Office of Crashworthiness Research,<br />
National Highway Traffic Safety<br />
Administration,<br />
U.S. Department of Transportation<br />
Lawrence F. Simeone,<br />
Transportation Systems Center,<br />
Research and Special Programs Administration,<br />
U.S. Department of Transportation<br />
Donald J. Crane,<br />
MGA Research Corporation<br />
Abstract<br />
The objective ofthe frontal crashworthiness research and<br />
development effort at the National Highway Traffic Safery<br />
Administration (NHTSA) is to assess the safety problems<br />
associated with occupants of passenger cars involved in<br />
frontal impacts and to identify potential remedies for the<br />
problem. The focus of this paper is the identification of the<br />
safety problem for restrained right, front seat passengers.<br />
NHTSA's National Accident Sampling System files and<br />
individual state files contained in the Crashworthiness State<br />
Database were utilized to identify the crash environment,<br />
vehicle factors, and injury mechanisms associated with<br />
restrained pa$sengers. The New Car Assessment Program<br />
provided data on over 200 full scale crash tests containing a<br />
restrained right, front seat dummy. Analyses utilizing the<br />
accident and crash test data are presented in this paper.<br />
A laboratory test program has been conducted to<br />
characterize head to instrument panel contacts which<br />
appears to be a major injury mechanism. The material<br />
properties and geometric characteristics of the upper<br />
instrument panel have been collected and analyzed for<br />
several of the production vehicles tested as part of the New<br />
Car Assessment Program. Dynamic and static forcedeflection<br />
data was collected utilizing a head component<br />
impactor. Results of thi$ laboratory prografi are presented.<br />
The MVMA 2-D computer model is being utilized to<br />
simulate the associated New Car Assessment Program crash<br />
tests to assist in the identification of mitigation concepts.<br />
The paper discusses the input data requirements, the<br />
validation process, and results of initial simulations.<br />
(2) USER's Manual<br />
"PAM-CRASH". ESI.<br />
(3) T. Sakurai, Y. Kamada, Structural Joint Stiffness of<br />
Automotive Body, SAE paper 880550, 1988.<br />
(4) H. Katoh, R. Nakahama, A Study on the Ride-Down<br />
Evaluation. The Ninth <strong>ESV</strong>. 198?.<br />
<strong>Int</strong>roduction-Passenger Safety<br />
Assessment<br />
The objective ofthe frontal crashworthiness research and<br />
development effort at the National Highway Traffic Safety<br />
Administration (NHTSA) is to assess the safety problems<br />
associated with occupants of passenger cars involved in<br />
frontal impacts and to identify potential remedies for the<br />
problem. The focus of this paper is the identification of the<br />
safety problem for re$trained right, front seat passengers.<br />
Insight into the safety problem for the restrained right,<br />
front seat passenger can be gained by examining available<br />
field accident data and crash test data. TWo accident data<br />
files were utilized within this study-the National Accident<br />
Sampling System (NASS) and the Crashworthiness Srare<br />
Database (CWSD). NASS (l)* files contain a nationally<br />
representative sample of crashes occurring within the<br />
United States. The data contained in the files are collected<br />
by teams located throughout the country. Detailed<br />
information on the vehicle, occupant, and crash factors are<br />
obtained from on-site inspections, vehicle examination,<br />
occupant interviews, and police and medical records. The<br />
CWSD (2) has been developed by NHTSA to support<br />
research programs aimed at improving vehicle<br />
crashworthiness. The database contains information<br />
extracted from several State files and the data contained in<br />
the files is primarily obtained from police investigations. It<br />
is being used to supplement the information contained in<br />
NASS.<br />
In addition to field accident analyses, the crash tests<br />
performed as part of the New Car Assessment Program<br />
(NCAP) have been examined to help in the definition of the<br />
safety problem. NHTSA has conducted more than 250 crash<br />
tests under this program since 1979. Vehicles in this<br />
program are subjected to a full frontal impact against a flat,<br />
stationary barrier at 35 miles per hour. This is 5 mph faster<br />
than the prescribed speed for compliance with Federal<br />
motor vehicle safety standards. The crash tests are designed<br />
to indicate, for vehicles within the same size class. the<br />
relative levels of occupant protection and vehicle safety<br />
performance. Each vehicle contains a restrained driver and<br />
passenger side dummy. Data is collected on structural and<br />
dummy responses during the crash and stored at NHTSA in<br />
a computerized data base (3). The analyses related to the<br />
*Numbers in parenlhcses dcrignatc rrfercnce$ ar rnd of paprr.
field accident data and the crash tests are presented in the<br />
next section titled "Problem Determination".<br />
Based on these analyses, it was decided to focus<br />
particular attention on head injuries caused by contact with<br />
the instrument panel. The material proper"ties and geometric<br />
characteristics of the upper instrument panel have been<br />
collected and analyzed for several of the production<br />
vehicles tested as part of the New Car Assessment Program.<br />
Dynamic and static force-deflection data were collected<br />
utilizing a head component impactor. Injury criteria data<br />
obtained from these component tests were compared to the<br />
full scale NCAP crash tests. This work is discussed in the<br />
section titled "Laboratory Testing for Head to Instrument<br />
Panel Impacts".<br />
The MVMA ?D Crash Victim Simulator is being utilized in<br />
this effort to help characterize the baseline conditions of a<br />
restrained front seat passenger. In future work this model<br />
will be utilized to assist in postulating and analytically<br />
evaluating mitigation concepts as to their effect on harm<br />
reduction. Input data issues and requirements related to the<br />
occupant characterization, instrument panel material<br />
properties, restraint system, and geometry are discussed.<br />
lnitial validation efforts and sensitivity analyses are<br />
presented. This work is contained in the section titled<br />
"Analytical<br />
Characterization of Baseline Vehicles".<br />
Problem Determination<br />
The following sections present analyses conducted using<br />
accident data and crash test data to better define the safety<br />
problem for restrained right, front seat passengers in frontal<br />
impacts.<br />
Field accident dflta<br />
Both NASS and CWSD accident data were utilized in<br />
performing the analyses presented in this section. The<br />
NASS files utilized included the calendar year 1979 to 1987<br />
individual files. Comparisons are made by the distribution<br />
of both "harm" and injuries. NASS utilizes a national expansion<br />
factor to make the NASS files representative of the<br />
population of accidents which occur in the United States.<br />
These factors are available for the 1979-86 NASS files, but<br />
not for the 1987 NASS file. Because of this difference and<br />
the limited sample size available for restrained passengers----€specially<br />
at the higher injury severity levels,<br />
both weighted and unweighted data are presented. The<br />
counts ofinjuries that are used in the comparisons presented<br />
in this section are based on a count ofall injuries received by<br />
the passenger. ln the NASS file, up to six individual injuries<br />
for each injured occupant may be coded into the<br />
computerized file, and it is all these injuries that are included<br />
in these analyses.<br />
Additional comparisons are made utilizing the concept of<br />
"harm"<br />
as originally defined by Malliaris, et al. (4,5). To<br />
obtain "harm", a harm weighting factor that is associated<br />
with each of the AIS injury severity levels is utilized. The<br />
harm factors are applied to all the injuries received by the<br />
passenger. The harm weight factors that were utilized are<br />
334<br />
based on the information included in reference 5.<br />
INJURY AIS 6 HARM 265<br />
LEVEL AIS 5 WEIGHTING 228<br />
AIS 4 FACTORS 62.8<br />
Ars 3 12.6<br />
AIS 2 3.8<br />
AIS I ,45<br />
Other weighting concepts that attempt to account for the<br />
consequences ofdifferent types and severities of injuries are<br />
being evaluated by NHTSA (6).<br />
The CWSD files were also utilized. The analyses were<br />
limited to the use of the Pennsylvania 1983-86 state files.<br />
The distributions are based on the police recorded body<br />
region which received the most severe injury. Counts are<br />
based on injuries that were considered either incapacitating<br />
or fatal.<br />
Figure I presents the distribution of injuries and harm to<br />
restrained passengers by body region injuried based on the<br />
O<br />
z<br />
U a n<br />
-)<br />
Lv<br />
u<br />
L<br />
HEAD FACE<br />
1 979-86<br />
WEIGHIED<br />
1979-87<br />
UNWEIGHTED<br />
1 979-86<br />
HARM<br />
NECK CHES<br />
BODY REGIONS<br />
Flgure 1. Restralned passengers In frontal lmpacts. Dlstrlbutlon<br />
of body reglona lnlured. NAS$, AI$ 2+ Inlurles.<br />
HEAD<br />
CWSD*PA,<br />
FACE NECK TRUNK<br />
BODY REGIONS<br />
LOW EX<br />
Figure 2. Reetralned passengers in frontal impact$. Distribution<br />
of body regions iniured. Crashworthiness State<br />
databasFPennsylvsnls f lles. Incapacltatlng and fatal Inlurles.
NASS files. Three comparisons are presented including<br />
distributions based on 1979-86 AIS 2+ injury weighted<br />
counts, 1979-87 AtS 2+ unweighted counts, and 1979-86<br />
harm weighted data. Head injuries account for l5 to l9Vo of<br />
the AIS 2+ total injuries for both the weighted and unweighted<br />
injury counts. For the harm weighted distribution,<br />
the head accounts for 25Vo of the total harm. Figure ? presents<br />
body region distributions based on the CWSD files.<br />
The head body region accounts for 25Vo of the injuries<br />
classified as incapacitating or fatal.<br />
NASS contains information as to the injury source for the<br />
body regions injured. Figure 3 presents the distribution of<br />
injury sources for head injuries. Because of the small sample<br />
size, only the analysis using unweighted data for the<br />
1979*87 file is presented. There is information on injury<br />
source for 2l injuries at the AIS 2+ level. Nine of the head<br />
injuries were attributed to contacting the windshield, five to<br />
the instrument panel, and 3 to the roof rails/pillars.<br />
(J30<br />
z<br />
:)<br />
o<br />
H20<br />
LL<br />
WDSHLD INST PNL PILLARS NON CT<br />
INJURY<br />
SOURCE<br />
(SAMPLE SIZE:21 INJURIES)<br />
OTHER<br />
'1979-87 NASS<br />
UNWTIGHTED<br />
Flgure 3. Hsstralned pss8angsrs ln frontal lmpacte. Inlury<br />
aources for head lmpacls. 197F87 NASS. Unwelghted. AI$ ll<br />
rnlur|€s.<br />
Crash test data<br />
The following analyses are based on the NCAP crash<br />
tests that are contained in NHTSA's vehicle crash test<br />
database. Each of the vehicles tested in this program was<br />
crashed into a rigid barrierat a test speed of 35 mph. This is 5<br />
mph faster than the prescribed speed for compliance with<br />
Federal motor vehicle safety standards. The crash tests are<br />
designed to indicate, for vehicles within the same size class,<br />
the relative levels ofoccupant protection and vehicle safety<br />
performance.<br />
Specific attention was directed at the association of the<br />
HIC injury criteria values with contact source. The following<br />
figures and tables are based on the passenger car tests<br />
and the restrained passenger dummy head injury criteria<br />
(HIC) and chest injury criteria (chest acceleration). As can<br />
be noted in table l, the average HIC value is approximately<br />
double (l174 vs. 602) for those dummies that contact the<br />
instrument panel compared to those receiving no contact.<br />
The chest acceleration levels for contact cases are also higher.<br />
The "other" contact category primarily consist of head<br />
to knee contacts. It can also be noted that contact with the<br />
instrument panel occurs in almost one-half of the crash<br />
tests.<br />
Table 1. Comparison ol restrained pe$$6nger lnlury crlterla by<br />
head contact bources. NCAP teet rdsulte. Faseehg6r cara only.<br />
Contact Source Sample Size l{IC Chest<br />
Acce l eratlon<br />
Instrument Panel ll9 rtf4 46<br />
None 76 602 3g<br />
Other 22 ll25 43<br />
Tsble 2. ComDarlaon of rsrtrElnsd Daassnser lllC levels dlstrF<br />
butlon by hedd contact source. NCAP test-r€sulta. Pasaenger<br />
csrs onty.<br />
HIC Level s<br />
0 to 500<br />
501 to 1000<br />
l00l to 1500<br />
l50l +<br />
Total<br />
Contact Sources<br />
Inst Pnl l{one Other<br />
3r. (4) 3614 (27) 9r( (?)<br />
38% (45) 6l* (46) 45x (10)<br />
38% (45) 4% (3) tSx (3)<br />
2r% (zs't 0y, (0) 3lx (7)<br />
100% (lre) 100% (76) t00%.(e2)<br />
Table 2 presents the distribution of different levels of<br />
HIC. The table shows thtt 59?o of the dummies that contacted<br />
the instrument panel received HIC readings equal to<br />
or greater than a HIC value of lfi)O, whereas for those<br />
dummies that did not contact any interior surface that number<br />
is only 47o.<br />
Figure 4 presents another illustration ofthis contact problem.<br />
The figure presents the HIC and chest acceleration<br />
readings for each dummy by contact source. The symbol<br />
"1"<br />
indicates instrument panel contact,<br />
"N"<br />
indicates no<br />
contact, and "O" indicates other contact. As can be seen<br />
from the figure, almost all the crashes that contain no passenger<br />
contact with the interior surface result in HIC readings<br />
lower than l0(X).<br />
Tables 3 and 4 present similar information for the light<br />
trucks tested as part of the NCAP program. The HIC and<br />
contact source trends are the same as those for passenger<br />
cars.<br />
Laboratory Testing for Head to<br />
Instrument Panel Impacts<br />
Based on the results ofthe field accident and the crash test<br />
analyses, it was decided to focus specific attention on the<br />
safety problem of head to instrument panel impacts. Head to<br />
windshield contacts appeared as a problem in the accident<br />
data but not in the full scale crash tests. This discrepancy is<br />
continuing to be investigated as part of the problem<br />
identification effort. The analytical simulation work that is<br />
presented in a subsequent section presents initial results<br />
related to this question.<br />
335
t{l cF<br />
300u<br />
o + II<br />
PUIT at HICFTC6F SYrtEd. lS VALiE OF CuillAct<br />
o l II<br />
II I<br />
l l<br />
I I<br />
I<br />
I r l<br />
I T TII<br />
t o t l<br />
0r I I ll<br />
I O I<br />
o l<br />
I 0 t r<br />
It I I<br />
t oll t I<br />
I I NI II II I<br />
I l r l<br />
I tt I o I I<br />
t{ | I I I tt I I I<br />
ir o r r I I I It I l{<br />
III I IIII O<br />
I I IIIT II N I{<br />
II I t{ I<br />
t{ tfitt{It{ Nil{t H H N<br />
l{ ril r rJ$fio H<br />
}{I tf.ll O ttf{t I l{<br />
il t{ l{tl{l{ l{ t t{ rfiril o<br />
HH ]\t{ I{T ilI<br />
t { i l H<br />
- --+- --+-+*{+r*+-----------+- +--+r-----+-..--- ------+----r ------+- ------*-*_+*- --* -_+-+-++_++<br />
o lo eo go /to 5(' a{} To Ht ett too<br />
Flgure 4. Plot of HIC v$. chGst acceleratlon for head contacl8 wlth the lnstrument psnel (l), no contact (N), and other contact (O).<br />
Table 3. Comparlaon of reatralned psssengsr Iniury critcria by<br />
head contact sourcec. NCAP t€st results. Llght trucks and vans<br />
only.<br />
Contact Source Sample Size HIC Chest<br />
Accel eratl on<br />
None 9 671 44<br />
0ther ll lt89 50<br />
Table 4. Comparlson of reetrained pageenger HIC levels<br />
dbtrlbutlon by hesd contsct tourc€. NCAP tcst results. Light<br />
trucks and vais only.<br />
HIC Level s<br />
Contact Source$<br />
0 to 500<br />
501 to 1000<br />
l00l to 1500<br />
l50l +<br />
Tota l<br />
Instrument Panel e0<br />
l25r 48<br />
Inst Pnl None Other<br />
104 (a) 22s (?') 0* (0)<br />
20* (4) 67* (61 ?7% (3)<br />
45% (e) ll% (r) 45% (5)<br />
?5% (5) o% (0)<br />
loo# (20) 100% (e)<br />
38ff (3)<br />
r00* (lr)<br />
A laboratory testing program was initiated, which had as<br />
its primary objective the simulation of passenger head<br />
injury as a result of impacts with the upper dash panel of<br />
several NCAP passenger cars and light trucks. The<br />
336<br />
simulation was accomplished by the use of static and<br />
dynamic component level head te$ts. The data collected<br />
serves as first, a baseline data base for characterizing the<br />
material properties/geometry of instrument panels, and<br />
second, input data sets for analytical simulation models.<br />
Summary of laboratory tasks<br />
MGA Research Corporation, under contract with the<br />
Transportation Systems Center (TSC), United States Department<br />
of Transportation, performed the laboratory testing<br />
program involving the component level head tests of the<br />
passenger side upper instrument panel (7). MCA has developed<br />
both the equipment and procedures to conduct static or<br />
dynamic component level tests of a vehicle interior (8). The<br />
investigation included three groups of vehicles as listed in<br />
Table 5. The damaged NCAP vehicles were the vehicles<br />
used to perform the actual NCAP tests and were acquired<br />
under the contract with TSC. The group I vehicles matched<br />
the damaged vehicles but contained undamaged interior<br />
components. The group 2 vehicles were other undamaged<br />
vehicles that matched other vehicles tested within the<br />
NCAP program. They were purchased as vehicle front ends<br />
or cowl sections and contained the same options as the<br />
original NCAP vehicle. The light trucks were vehicles used<br />
by MGA to perform other interior component level tests for<br />
TSC.
The initial task in the project wa$ to perform analysis on<br />
the NCAP crash films to determine the passenger head<br />
impact velocity, impact angle and contact point. This was<br />
then followed by a test matrix that included three dynamic<br />
test types and one static test type. The test types were designated<br />
as dynamic generic, NCAP simulation, FMVSS 201<br />
and a static generic. The dynamic generic was a 25 mph<br />
impact at a fixed 50 degree impact angle measured from<br />
horizontal, using a 6 inch diameter l5 pound hemisphere<br />
shaped headform. This impact angle was determined from<br />
the average of the nine impact angles found in the film<br />
analysis. The analog to the dynamic generic was the static<br />
generic, performed at a quasi-static rate of 2 inches/minute.<br />
Both test types were performed on the group l, group 2, and<br />
light trucks.<br />
The NCAP simulation, performed on the damaged<br />
NCAP, group I and group 2 vehicles, made use of a Parr 572<br />
anthropomorphic head ballasted to l5 pounds. The impact<br />
velocity and angle were determined by the film analysis<br />
results. The FMVSS 201 test, a l5 mph impact using a 6 inch<br />
diameter hemisphere shaped headform ballasted to l5<br />
pounds, was performed on the 1985 Dodge Colt, 1985 Ford<br />
Tempo, 1986 Hyundai Excel and the five light trucks.<br />
Test procedures<br />
and data acquisition<br />
This section will review the test procedures used to perform<br />
the film analysis and component level head tests along<br />
with the data acquisition. The purpose of the film analysis<br />
was to determine the passenger head impact velocity, impact<br />
angle and contact location, and was performed on each<br />
of the nine group I and group 2 vehicles listed in table 5.<br />
Using a film digitizer and computer, the passenger head<br />
target motion was digitized, based on time, with respect to<br />
the vehicle. By knowing the film speed, the head target x<br />
Table 5. Vehlcles tested.<br />
hged<br />
lmP<br />
t/ehlclee<br />
gtup I<br />
ard<br />
ef,p-2<br />
Vdrlclg<br />
r.t#t<br />
ItrrclrE<br />
1986 tddc ErbJElf<br />
1986 ltyrdai EGI<br />
1986 lgrzu l{.tar|q<br />
1986 l{emrry Sable<br />
1986 Saab 90OO<br />
1986 tulck e*ry<br />
1985 Cbevmlert, ftrfrit<br />
1985 Dodgr SIt<br />
1985 rud Teq'o<br />
1986 Hytndat bdl<br />
1986 Isrzu l{taik<br />
1986 ilnz(b B-2(X)O Ptclop<br />
1986 letury Sable<br />
1986 Saab 90OO<br />
1985 CtEvrrl€t G-10 Van<br />
f986 Dodge Caratrarl<br />
1985 IbLd F-150<br />
1986 IloLd RanEer<br />
1985 NLssan Ptdq'p<br />
and z motion (where x is positive forward and z is positive<br />
upward on the vehicle) versus time was recorded.<br />
The head displacement was determined from the time of<br />
vehicle contact with the barrier up to the time of head<br />
contact with the upper dash. The head x motion versus time<br />
and head z motion versus time were then manipulated to<br />
determine the head impact angle and velocity. The velocity<br />
was determined by ploning the resultant motion versus time<br />
and finding the slope of that line in a region 20 msec prior to<br />
head contact. The impact angle was determined by crossplotting<br />
the head x motion with the z motion and calculating<br />
the downward angle with respect to the horizontal in a<br />
region just prior to contact. A summary of the film analysis<br />
results are listed in table 6 and a sketch of the impact velocity<br />
and location are shown in figure 5.<br />
Table 6. Summary of the fllm analysle r€Bults.<br />
Vehicte r'T]m+ Vcfefty (rFh) q)art Atqf€ (.leg)<br />
1986 tulc* €firy 17<br />
1985 CtffiIet SFrjrt 23<br />
1985 hdge SIt t5<br />
rgSE lbtd Tryo ZF.1<br />
1986 n$rdat EeI 28<br />
1986 IsrElr IJ.hrlr 22<br />
1986 rhrda Picld+] 26<br />
1986 l{emry Sablc L7.4<br />
1986 S|rb 9000 23<br />
IMPACT \ELOCITY<br />
IMPACT ANGLE<br />
INSTRUMENT<br />
PANEL<br />
Flgure 5. Pareenger head lmpact angle and veloclty deflnltlon.<br />
Dynamic and static interior components tests were performed<br />
using MGA's dynamic/static load frame on which a<br />
vehicle cowl section is fixtured as shown in figure 6. The<br />
vehicle cowl section is that portion of the vehicle cut forward<br />
of the shock towers and through the front seat floorpan,<br />
and fixtured using a combination of welding and bolting.<br />
This methodology has been found to be a very rigid<br />
system simulating the conditions found in the full vehicle.<br />
Each vehicle cowl section was purchased with the same<br />
options as the NCAP vehicle and included all components<br />
behind the instrument panel. An undamaged instrumenl<br />
panel was replaced after each test and installed identical to<br />
the original condition. The A-frame supports either a hydraulic<br />
cylinder for static testing or an impactor for dynamic<br />
testing. The cylinder or impactor can be oriented in any<br />
direction, through lateral motion, vertical motion and rotation<br />
in two directions.<br />
The static testing was performed using a hydraulic cylinder<br />
mounted to the A-frame as shown in figure 7. Attached<br />
36<br />
49<br />
44<br />
49<br />
49<br />
70<br />
66<br />
4E<br />
54<br />
337
Flgure 6. MGA statlc/dynamlc load frame.<br />
Flgure 7. Slatlc gsnerlc test Bet-up.<br />
to the end of the cylinder was a 6 inch diameter hemisphere<br />
shaped 201 headform with a load cell mounted behind it to<br />
record the force. A displacement potentiometer attached to<br />
the cylinder was used to measure the instrument panel deflection.<br />
The cylinder operation and data acquisition was<br />
fully computercontrolled using the method of displacement<br />
feedback. Force/deflection pairs were recorded every 0.040<br />
inches as the cylinder was extended and retracted at a rate of<br />
2 inches/minute. An example static generic force/deflection<br />
result is shown figure 8. The contact point for the test was<br />
338<br />
F<br />
o<br />
R<br />
c<br />
B<br />
(<br />
P<br />
o<br />
u<br />
ll<br />
D<br />
s )<br />
ETATIC O8I{BRIC PAEEE}IGIBR EIDB UPPER Iil8TRU}IENT PAIIBL<br />
O fORCB/DEFI,ECTIOII<br />
o.oo l.oo 8.oo g.oo 4,oo E,o0 €.o0 ?.oo<br />
DEFIECTION (TNCHE$)<br />
Flgure 8. Statlc generlc force/deflectlon plot.<br />
determined by the film analysis or in the case of the light<br />
trucks was at the junction point of the upper and middle<br />
instrument panel. After the test was completed, the data was<br />
saved on a diskette, loaded to MGA's Micro VAX and converted<br />
to the NHTSA component data base format. All the<br />
data was then sent to NHTSA and is available on their VAX.<br />
As mentioned earlier, three types of dynamic te$t$ were<br />
performed, the dynamic generic, NCAP simulation, and<br />
FMVSS 201. A similar test procedure was used for each test<br />
type and only differed by the impact velocity, impact angle,<br />
contact location, and impact form. Figure 9 shows the dynamic<br />
test set-up. Strain gage type accelerometers were<br />
mounted in each headform to record the acceleration in the<br />
impacting direction. A displacement potentiometer attached<br />
to the back of the headform was used to measure the<br />
instrument panel deflection. A contact switch placed on the<br />
instrument panel recorded the time of impact.<br />
Flgure 9. Passenger slde dynamic head tBet set.up.<br />
The impactor is essentially a guided piston, with both the<br />
impacting sequence and data recording controlled through a<br />
computer. Figure l0 shows the back of the impactor and the<br />
computer, system controller, pneumatics cart and signal
Flgure 10. Dynamlc ta$tlng data acqulsltlon.<br />
conditioning used to execute the test. The impactor is fired<br />
by pressurizing nitrogen in an accumulator to a pressure<br />
corresponding to the desired velocity based on the impacting<br />
mass. Once pressurized, a safety pin is released and a<br />
fire button is pressed, discharging the nitrogen to the back of<br />
the piston.<br />
A<br />
c<br />
E<br />
L<br />
E<br />
R<br />
A<br />
I<br />
o<br />
N<br />
(<br />
o<br />
s )<br />
F<br />
o<br />
R<br />
c<br />
E<br />
(<br />
F<br />
o<br />
u<br />
N<br />
D<br />
I<br />
)<br />
ro, o<br />
o.<br />
-lo. o<br />
-ao. o<br />
-s0.0<br />
-+0. o<br />
-80. o<br />
r<br />
I<br />
"tt-<br />
VERSUS TIHE<br />
-00. o<br />
o,0000 0.o8oo 0, rooo Q, r800 0.aooo o.86(10<br />
rIMB (FEGSHDS)<br />
Flgure 11. Dynamlc lert Ecceleratlon versus tlms.<br />
rooo<br />
800<br />
soo<br />
400<br />
soo<br />
o<br />
o,ooo o.Boo r,ooo I,Eoo s.o00 s,€oo 8.ooo<br />
DI8PI.ACBHEflT ( IilCEE8 )<br />
Flgure 12. Dynsmlc force/deflectlon curya.<br />
Once the piston has stopped accelerating, the nitrogen is<br />
vented to the atmosphere, allowing the piston to travel ar a<br />
constant velocity. Immediately after venting, the data recording<br />
was triggered and velocity measured by a wand<br />
attached to the piston, passing through a light trap, The<br />
acceleration, displacement and contact were all recorded on<br />
a time basis according to the SAE J2l I standards. An example<br />
of an acceleration time curve is shown in figure I l, and<br />
through file manipulations can be reduced to the dynamic<br />
force/deflection curve as shown in figure 12. As with the<br />
static data, all the dynamic data was converted to the<br />
NHTSA component data base format and installed on the<br />
NHTSA data base.<br />
Results<br />
This section will discuss the results from the film analysis,<br />
dynamic tests, static tests and their relationship to the<br />
NCAP results. Table 7 provides a summary of the passenger<br />
side HIC based on the head resultant acceleration for each of<br />
the nine NCAP vehicles as determined by a 36 msec HIC<br />
program. These are the results used to correlate with the<br />
component level test results.<br />
Tsble 7. Summary ol NGAP passenger HtC.<br />
Tested Vehicle<br />
L985 Ford Telrpo<br />
1-986 llyundai B{ceI<br />
1986 Isuzu l+Iark<br />
l-985 l{azda Pidfl,p<br />
L986 l,Ienerry Sable<br />
1986 Saab 9OO0<br />
Hrc (t2-il)<br />
L449<br />
2662<br />
999<br />
1647<br />
597<br />
L443<br />
(24)<br />
(13)<br />
(36)<br />
(35)<br />
(35)<br />
(5)<br />
A comparison was made between the head impact velocity<br />
as determined through the film analysis and the NCAP<br />
resultant passenger HIC. A correlation plot comparing the<br />
two is shown in figure 13. The correlation coefficient, r,<br />
I<br />
o_<br />
(J<br />
O<br />
L,J<br />
F<br />
{<br />
L<br />
E<br />
O<br />
UJ<br />
r<br />
JO<br />
20<br />
10<br />
1000 2000 3000<br />
NCAP RESULTANT HIC<br />
Fasultint Hlc veraua<br />
fub""ii"]:. head lmpacl veloclty corrsla'<br />
339
determined for this plot was 0.86. These results indicate that<br />
as the passenger head velocity increases, the likelihood of<br />
an increase in head injury will result. Therefore, one approach<br />
to reducing the occupant head injury is to reduce the<br />
head velocity. This can be accomplished by modification of<br />
structural characteristics (crash pulse and intrusion), interior<br />
geometry, and restraint effectiveness. However, as discussed<br />
in the problem determination section to this paper,<br />
prevention of all contacts is not feasible and countermeasures<br />
must also focus on the properties of the instrument<br />
panel itself in mitigating contact forces.<br />
Two types of loading responses resulted from the static<br />
generic test type as shown by the overplot in figure 14. In<br />
one case, the trend shows a gradual rise in force to a peak<br />
load, which is characteristic of the softer instrument panels.<br />
This type of response was found in instrument panels that<br />
had approximately 0.54.75 inches of cushion covered by a<br />
vinyl type of material. The other trend shows a response that<br />
is much more steep and is characteristic of the stiffer instrument<br />
panels, constructed of hard plastic with little or no<br />
cushion material. The advantage of a softer instrument panel<br />
was reflected in the results obtained from the Mercury<br />
Sable. The combination of a soft, thick cushioned instrument<br />
panel and an impact velocity of l7 .4 mph resulted in<br />
the lowest NCAP HIC of the group at 597 over 36 msec.<br />
F<br />
0<br />
F<br />
E<br />
STATIC GENERIC FORCE/DEFLECTION COMPARISON<br />
O 86 ISUZU I-MABK<br />
x 8€ lilERCttRY SABLE<br />
0.00 l.oo a.o0 9.00 4.oo 5.oo<br />
DEFI,BTION<br />
(INCHES)<br />
Flgure 14. $tatlc generlc force/deflectlon reapons€a.<br />
Although the static tests can discriminate among the vari*<br />
ous types of instrument panel stiffnesses, it lacks the dynamic<br />
response, which is critical in defining the instrument<br />
panel impact properties and as input into the occupant sim*<br />
ulation models. An overplot comparison of a static generic<br />
and dynamic generic force/deflection from the same vehicle<br />
is shown in figure 15. The dynamic generic test show$ a<br />
large inertial spike occurring within the first two inches of<br />
deflection, and has a steeper initial slope as compared to the<br />
static test.<br />
Two types of responses from the dynamic tests are shown<br />
in the overplot of figure 16. In one case, the trend was a<br />
gradual rise to a peak force while the other shows an inertial<br />
340<br />
?00<br />
eo0<br />
I Eoo<br />
[<br />
fl<br />
D<br />
s<br />
)<br />
+oo<br />
soo<br />
eoo<br />
roo<br />
t.]<br />
{\, d<br />
j<br />
-# fi<br />
f<br />
F<br />
0<br />
n<br />
c E<br />
(<br />
o<br />
U N<br />
D<br />
s )<br />
Flgure<br />
F<br />
o<br />
c<br />
E<br />
(<br />
p<br />
o<br />
U<br />
N<br />
s )<br />
o<br />
IS86 SAAB 9OOO _ FORCE/DEFLECTION COHPARISON<br />
DYNAI.TIC GENERIC<br />
STATIC CENEBIC<br />
I 600<br />
leoo<br />
soo<br />
600<br />
soo<br />
o<br />
o.00 r.oo e.oo 3.oo 4.o0 6.00 6.00 7.00<br />
DEFLECTION (INCHES)<br />
15. $tatic and dynamlc force/deflectlon comperlson.<br />
DYNAMIC GENERIC FORCE/DEFLECTION<br />
1986 $AAB 9000<br />
1S85 FORD TEMPO<br />
8000<br />
4600<br />
4000<br />
I EOO<br />
I OOO<br />
600<br />
0<br />
o. oo I .00 a.00 3. oo 4. oo 3. oo 6. oo<br />
Frgure 18. Dynamic ;;"#;-l<br />
I<br />
l \ ,nhn *- \r-<br />
N {'\/ {*<br />
spike within the first few inches of deflection. The trend<br />
most often seen was that with the inertial spike.<br />
Three methods were used to correlate the dynamic generic<br />
test results to the NCAP passenger HIC results. These<br />
included comparing the peak force/deflection, loading<br />
slope, and HIC to the NCAP resultant HIC. In no case did<br />
the component level HIC's match the NCAP HIC's. This is<br />
because a complex three dimensional event was being modeled<br />
using a one dimensional test device. Also, there is some<br />
level ofacceleration on the head due to the vehicle deceleration,<br />
which is not accounted for in the component test.<br />
The force/deflection peak is the peak load that occurs<br />
within the first two inches of instrument panel deflection,<br />
also called the inenial spike. This peak load and the initial<br />
loading slope or stiffness were determined from the dynamic<br />
generic force/deflection plot. If there was no distinguishable<br />
peak load, as in the case of a gradual rising load, the<br />
force was taken at one inch of deflection. The correlation<br />
coefficient for comparison of the peak force and the NCAP<br />
resultant HIC was found to be 0.58 and the plot is shown in<br />
figure 17. The loading slope was calculated from the initial<br />
rise of the force/deflection plot and was found to have a<br />
L+d{<br />
(tfl-.- {<br />
{ *tr<br />
/<br />
t l /-w<br />
--j{<br />
HJffi<br />
5hJ<br />
n<br />
f t
a<br />
m I<br />
LI<br />
tr<br />
LL<br />
}{<br />
Ld<br />
o-<br />
2000<br />
1 000<br />
r:0.58<br />
0 1000 2000 3000<br />
NCAP RESULTANT<br />
HIC<br />
Flgure 17. Dynsmlc gcnerlc peak force yorsus NGAP HIC correlatlon<br />
plot.<br />
Z.<br />
\ (n<br />
(D<br />
J<br />
t!<br />
o_<br />
oJ<br />
n<br />
(J<br />
1<br />
O<br />
o J<br />
4000<br />
J000<br />
2000<br />
1 000<br />
0 1000 2000 J000 4000<br />
NCAP RESULTANT HIC<br />
Flgure 18. Pynanlc Aenerlc loadlng slope verua NCAP HIC correlatlon<br />
plot.<br />
O<br />
I<br />
o<br />
LL<br />
0{<br />
L.J<br />
Z<br />
|Jl<br />
=<br />
7<br />
O<br />
750<br />
500<br />
-tr.n<br />
LJ\J<br />
Fbure r9.<br />
pfol.<br />
r:o.57<br />
r=0.60<br />
0 1 000 2000 3000<br />
NCAP RESULTANT HIC<br />
Dynamlc generlc HIG varsus NCAP HIC corrolatlon<br />
correlation coefficient of 0.60 and is shown in figure 18. The<br />
correlation based on the component level HIC was found to<br />
be 0.57 and is shown in the plot in figure 19. As seen from<br />
these plots, all of the methods for correlating the component<br />
level impact results with the NCAP passenger resultant HIC<br />
are quite similar.<br />
Comparison of the NCAP simulation tests performed on<br />
the damaged NCAP vehicles showed a much bettercorrelation<br />
with the NCAP resultant HIC. A correlation coefficient<br />
of 0.96 resulted from these tests and is shown in the plot in<br />
figure ?0. Although the results correlate well, information<br />
about the crashed vehicle must be known, such as the passenger<br />
head impact angle and velocity determined from the<br />
film analysis. This presents a problem when trying to predict<br />
the passenger injury criteria for a vehicle that has not<br />
been crashed.<br />
q I<br />
z {<br />
F J<br />
f<br />
a<br />
LrJ<br />
tr<br />
o_<br />
{<br />
O<br />
z<br />
3000<br />
2000<br />
1 000<br />
o 5oo 1 ooo 1 soo<br />
NCAP SIMULATION<br />
DAMAGTD VEHICLE HIC<br />
Flgure 20. Demegod ilCAP HIG versua NCAP raaultant HIC corrslEtlon<br />
plot.<br />
=<br />
z<br />
tr<br />
{ J<br />
l<br />
=<br />
a<br />
o-<br />
O<br />
z<br />
750<br />
500<br />
250<br />
r- 0.6 0<br />
0 1000 2000 3000<br />
NCAP RESULTANT HIC<br />
Flgurr 21. NCAP slmulatlon HIC verrur ilCAP resultant HIC<br />
correlatlon plot.<br />
341
The other NCAP simulation testing was performed on the<br />
group I and group 2 vehicles. Again, there was no exact<br />
match of the component level HIC's compared to the full<br />
scale NCAP crash passenger HIC's. The correlation coefficient<br />
between these two $ets of data was 0.60 and has a<br />
correlation plot as shown in figure 21 .<br />
As for the FMVSS 201 results, each of the vehicles tested<br />
passed the criteria. The FMVSS 201 simulates a head impact<br />
utilizing a 15 pound head form and impact velocity of<br />
15 mph. The criteria $tate$ that the maximum acceleration<br />
level, for a 3 msec period, must not exceed 80 g's.<br />
As mentioned before, an exact simulation of the injury<br />
sustained by a passenger in a full scale crash was not possible<br />
in the laboratory testing program. This is because of the<br />
constraints placed upon a laboratory test procedure on a<br />
component level. These constraints include limiting the<br />
head motion to one direction, neglecting the affect of the<br />
vehicle deceleration on the HIC and not accounting for the<br />
belt loading affect on the passenger kinematics. Possible<br />
areas of an improved test procedure would be to incorporate<br />
the dummy neck response in a linear impact device. This<br />
could also be accomplished using a pendulum type device,<br />
along with simulating the belt loading. However, as will be<br />
discussed in the next section, component level test results<br />
are a very useful input to the occupant simulation models,<br />
which are used to model and predict full scale crash tests.<br />
Analytical Characterization of Baseline<br />
Vehicles<br />
The purpose of this aspect of the Restrained Passenger in<br />
Frontal Impact$ study was to develop computer simulations<br />
of selected frontal impact events. The cases are used as a<br />
tool to study the analytical aspects ofthe events in order to<br />
identify injury mechanisms and to develop mitigation<br />
concepts for passenger injury. The MVMA 2D Crash<br />
Victim Simulation model was selected for this study.<br />
The MVMA 2D model is a complex nine-mass, tensegment,<br />
spring-mass system which models total body<br />
occupant response in two-dimensions (9). It computes step<br />
by step occupant kinematic details, body part external<br />
forces and absorbed energies, injury criteria, and vehicle<br />
response. Frontal events from the National Highway Traffic<br />
Safety's (NHTSA) New Car Assessment Program (NCAP)<br />
were chosen a$ cases to be simulated. The two initial cases<br />
discussed here involve events in which the passenger's head<br />
struck the instrument panel. Both vehicles employed<br />
3-point belt restraint systems.<br />
Modeling approach<br />
Accelerometer and load cell data from the individual<br />
NCAP tests and laboratory component data were combined<br />
to con$truct each of the NCAP cases studied. Accelerometer<br />
data obtained from the passenger compartment strucrure<br />
was used to provide the deceleration time-history for the<br />
simulated passenger compartment and dimensional data<br />
from undamaged vehicles provided the initial passenger<br />
342<br />
clearances and angular orientation of the vehicle interior<br />
impact surfaces. Laboratory component data, discussed<br />
above, provided a source for specifying the force-deflection<br />
properties of the impacted surfaces. Restraint system geometric<br />
data was also obtained from the laboratory effort.<br />
Occupant response during the NCAP frontal event was<br />
obtained from accelerometer and load cell test data and<br />
from an analysis of the NCAP te$t film. Electronic test data<br />
provided head and chest deceleration and femur load profiles<br />
and the film data provided head trajectory and head<br />
velocity information- The case models were constructed<br />
and the occupant response output was compared to the corresponding<br />
NCAP occupant response data.<br />
The MVMA ?D 3-point "advanced belt system" module<br />
requires a considerable amount of detailed restraint system<br />
data not normally reported in NCAP tests. These include<br />
belt system geometry-the location of anchor points and<br />
"D"<br />
rings, occupant attachment points, and the effective<br />
belt lengths for each segment of the 3-point belt system. In<br />
additon, belt spool-out and inertia reel characteristics as<br />
well as the friction characteristics of belt slippage through<br />
the D-rings and belt slippage over the occupant's torso is<br />
required. In cases where data was unavailable, nominal<br />
values were inserted and adjustment was made to belt elongation<br />
characteristics to obtain the required occupant-restraint<br />
system response.<br />
Baseline case deYelopment<br />
Two cases initially developed for this study were a 1985<br />
Dodge Colt (10) and a 1985 Ford Tempo (11). Both cases<br />
were similar in that both vehicles employed 3-point "activen'<br />
belt systems and involved right front $eat passenger<br />
head contact with the upper portion of the instrument panel,<br />
The Colt NCAP test resulted in a passenger Head Injury<br />
Criteria (HIC) of 738 and the Tempo test resulted in a HIC of<br />
t436.<br />
It was noted in the Colt NCAP test that the occupant's<br />
head and upper torso twisted somewhat when contacting the<br />
upper instrument panel. This was probably due to early right<br />
knee contact which occurred about 25 milliseconds before<br />
the left knee contact. The result was a significant head<br />
acceleration component in the lateral direction (y-direction)<br />
when the head hit the panel. The MVMA model is a two'<br />
dimensional model (x-y) and the panel stiffness input data<br />
obtained in the laboratory effort was also coplanar (x-z).<br />
Thus for the Colt case, model occupant head response was<br />
compared to the resultant of the x and z NCAP accelerometer<br />
traces rather than the triaxial resultant. The Tempo<br />
NCAP test on the other hand, had a more coplanar occupant<br />
head impact. (The x-z resultant HIC of the Tempo NCAP<br />
test was 997o of the triaxial resultant HIC, while the Colt x-z<br />
resultant HIC was only about EOVI of the triaxial.) Chest<br />
response for both vehicle tests was mainly coplanar (x-z).<br />
Both NCAP test reports indicated knee contact with the<br />
lower portion of the instrument panel by the right front seat<br />
pa$senger followed by head contact with the upper portion<br />
of the in$trument panel. In both cases, film analysis indi-
cated intrusion of the instrument panel into the passenger<br />
compartment. Since head contact in both cases was partial<br />
(i.e. only the "forehead" of the passenger dummy made<br />
contact), it is reasonable to assume that without intrusion<br />
contact may have been avoided. Results of the comparison<br />
between the MVMA 2D simulations and the NCAP crash<br />
tests are shown in tables I and 9 and in figures 22 thru 27.<br />
The two MVMA 2D simulations match the NCAP resulrs<br />
fairly well. Femur results forthe Colt simulation show some<br />
disparity due to the uneven contact times of the knees during<br />
thE NCAP tCSt.<br />
I<br />
Tabre E. MVMA 2D slmulsrlon of NCAP tesr #791, (1985 Cotr).<br />
Hrq .,,,<br />
rl-t2 ..<br />
3[r hird 9.r ......,,,,<br />
3!E chcat g'r ,........<br />
frnur fprco (lb.).....<br />
hrrd v.loclty (rph) ...<br />
601.1 (r-r)<br />
s?-ll0<br />
11. r<br />
tr .9<br />
l{60 ( rur)<br />
25 (fIlrl<br />
525.5<br />
70-1 35<br />
7l .0<br />
3l .5<br />
leSl<br />
Table 9. MVMA 2D eimulatlon of NCAP t6$t #E42, (1985 Tempo).<br />
a<br />
tnjury clltrrlon I|CAF ?91 t$il tD Colt<br />
tnjury crttirlon NcA?_tat tlvt|A_2D trrpd<br />
r.l<br />
I.r<br />
tl.l<br />
t.l<br />
Erc ..,, ....... l{!5.7! lt13.3r<br />
tl-t? ,,...,.,. 7{-98 75-16<br />
3rr hrrd 9'r . . .... . , ,, 110.7 115.3<br />
t[ chirt 9" ......... 15.6 5t.l<br />
frlur lorci (lbrl ,,,.. ll27 (rurl l00l<br />
h.rd vrloctty (rph) ,.. 26 lftlr) t8<br />
r.t<br />
||.r<br />
r.t<br />
r.t<br />
il.1<br />
t.l<br />
l.l<br />
Crlt itt ll ltrrl*tfi r Grlt rct trt l?Dl<br />
H h.,lt.* *..lH,tD tFp X.itt<br />
t.r<br />
.t'l<br />
t.r<br />
r'ltr.lil'ltt.a-'trr.l<br />
rlllrnr$<br />
Flgure 22. The lollowlno I$ a comparlaon ol MVMA 2D stmutatlons<br />
wlth NCAP test #791, 1985 Dbdge Colt.<br />
e3<br />
I<br />
t<br />
tl<br />
?<br />
tl<br />
f.t<br />
r.l<br />
Lr<br />
E.f<br />
r.l<br />
t;.1<br />
ta.l<br />
t.l<br />
t.l<br />
I.r<br />
fI.r<br />
I.r<br />
il,t<br />
-fI.l<br />
il.r<br />
t.r<br />
tf .t<br />
tt.i<br />
r5.l<br />
tt,t<br />
5.1<br />
l.l<br />
l.l t.l r.l<br />
r.l rD.l<br />
dlll*rrl<br />
t.l<br />
l.r<br />
;tt<br />
't/<br />
r !<br />
.t<br />
Orr+ h.rllrrt t.trr.fl6<br />
Colt llt$ E0 Srftlotro.r t| Colt mP ltl, l?ll<br />
l|ed ttt*lt1 fril Fllt tr.ttflr<br />
tt.t r.l lt.t rt.l ll.l<br />
rlllrr*r*<br />
Flgure 23. Comparlson of NGAP test lllm analyala wlth MVMA<br />
2D almulatlon-head veloclty.<br />
.E<br />
lrr htr trrrl rt Er.r<br />
t'i<br />
'l<br />
u<br />
+<br />
?<br />
ii<br />
i\<br />
I<br />
I<br />
i<br />
. a<br />
r -ra {<br />
U i '.<br />
tt<br />
343
||.r<br />
lr.r I.r<br />
t.l<br />
r.l<br />
Fl#<br />
Figure 24. Comparlson of NCAP te8t tllm analysls and MVMA<br />
2D almulation-head trslectory.<br />
I<br />
a<br />
ft.l<br />
t t.l<br />
ttt.l<br />
fr,l<br />
r.t<br />
r.l<br />
{|.r<br />
|r.l<br />
l,f<br />
t-l<br />
.|.l<br />
I.r<br />
cctt illn lD llrrldlm rlr Cclt lFll Trt l'lDl<br />
fH tr.JtcttA<br />
l.r<br />
t't<br />
t.r<br />
trF tn D lllldlrr rr TQf Fl trrt Flt<br />
lB hrltrt tt.lrrtril<br />
t.r -'- ||.r t.l - ill.r - . nl-l --<br />
l.l l-l I.l r'E.r rl.l<br />
rrllrrr*<br />
Flgure 25. The followlng le a comparison of MVMA 2D slmuletlons<br />
wlth NCAP test # 842, 1985 Ford Tempol<br />
I<br />
I<br />
ll.r<br />
344<br />
ff.1<br />
{r.l<br />
r,r<br />
I.r<br />
E.r<br />
||.r<br />
t.a<br />
tFp<br />
G|nf, hrrltfrf F..lrr3lfr<br />
t't<br />
tfi lD<br />
. t<br />
F'<br />
*.,<br />
r l l<br />
ilrt tD<br />
r'r<br />
rr,ll'.'l*.a-'t-.a<br />
illllr-rs<br />
L<br />
I<br />
I<br />
I.r<br />
tllql<br />
I.r<br />
r.f<br />
t.t<br />
-il.1<br />
il..<br />
tl.r<br />
t{.t<br />
lr,l<br />
rt.l<br />
It.l<br />
t,l<br />
a.t<br />
l.l<br />
Lr l|.l I.r rt.l rt.l<br />
l.l t.l il.1 fr.l rt.l<br />
r|lll*-f<br />
tqo fffi tD llrhtlrr rt tr4o fEf Trrt lltE<br />
lld ttlcltg frn Fllr trl1lrr<br />
t.t --tt.t<br />
{l.t<br />
s.l<br />
r.t<br />
rr.l<br />
rlt.t<br />
l{l.l<br />
tll.l _<br />
fl.l<br />
arl llaacdraa<br />
Flgure 26. Comparlson ol NCAP test fllm analyais with MVMA<br />
2D slmulatlon-head veloclty.<br />
r.l<br />
t.l<br />
|rro fllil lD lrirl.tlf,r rr TF fGil Trrt [tl€<br />
lhd tr.Jfstfirl<br />
r.l<br />
?rr hcr lrtrl * hrr<br />
r'r<br />
t.r<br />
FltFls<br />
tsF ----<br />
Figure 27. Comparlson of NCAP test fllm analysis wlth MVMA<br />
2D slmulation-head trslectory.<br />
f.l<br />
I.r
Parametric study<br />
To identify the critical factors leading to passenger<br />
injury<br />
during the frontal event, a parametric study was developed.<br />
Both events were nominally similar. At the start of the<br />
frontal impact, both dummies slide forward from theiroriginal<br />
seating position. Evidence indicates initial contact with<br />
the knees into the lower portion of the instrument panel<br />
followed by a pitching forward of the occupant's upper<br />
torso and impact of the forehead into the upperportion of the<br />
instrument panel. Several critical parameters were<br />
identified:<br />
r Restraint System Dynamic Compliance<br />
. Upper Instrument Panel Stiffness<br />
. Pflssenger Seat Position<br />
r Torso Belt Slack<br />
Parametric test results are shown in figures 28 thru 31.<br />
Restraint system dynamic compliance was identified as<br />
compliance of the restraint system during the event which<br />
included a combination of belt stretch, belt spool-out, and<br />
belt hardware distortion. Results indicate that a stiff belt<br />
system which minimizes occupant forward movement improves<br />
the passenger's injury response. The more compliant<br />
a re$traint system is, the more likely the occupant will strike<br />
the instrument panel. The severity of the impact is also a<br />
consequence of restraint compliance as the belt system can<br />
slow the forward movement of the occupant and minimize<br />
the impact. A sufficiently stiff restraint system can prevent<br />
head impact totally. As restraint sy$tem stiffness was continually<br />
increased however, an increasing trend in occupant<br />
injury was observed as the stiffer belt system absorbed less<br />
energy, transferring more of the crash energy to the<br />
occupant.<br />
When head impact with the instrument panel does occur,<br />
the stiffness characteristics ofthe panel has a direct effect on<br />
resulting head injury. In both cases it appeared that the<br />
restraint system, although allowing head contact, did mitigate<br />
the impact by slowing the occupant's forward velocity.<br />
Thus head contact was generally partially mitigated and the<br />
stiffness of the first two to four inches of the upper panel<br />
played an important role in injury response. Response was<br />
almost linear, the stiffer the panel the harder the head impact.<br />
HIC and head angular accelerations responses followed<br />
suit. The softer panels mitigated head injury but<br />
allowed deeper penetration of the head into the panel which<br />
increased the likelihood of impacting a panel structural<br />
member of localized "hard spot."<br />
Moving the passenger to a more rearward seating position<br />
helps to mitigate injury by allowing the restraint system<br />
more room to prevent passenger head impact. As noted<br />
above, head impact in both cases was partial, usually only<br />
the forehead of the occupant strikes the instrument panel.<br />
Thus, any rearward seating position from 2 to 4 inches<br />
helped to minimize head impact. Conversely, preventing<br />
panel intrusion can also accomplish the same ends. Moving<br />
the occupant forward tended to increase injury criteria in the<br />
cases studied since the closer proximity of the instrument<br />
panel allowed for a fuller head to panel contact. The Colt<br />
case showed a decrease in passenger head injury however,<br />
when in the extreme forward seating position. Thorax contact<br />
was initiated in this case and helped to dissipate the<br />
occupant's forward momentum. The Tempo case on the<br />
other hand, saw a significant increase in head injury for the<br />
extreme forward seating position (4-inches forward of the<br />
mid position). In the Tempo case the occupant struck the<br />
windshield initially, rebounded and then hit the upper instrument<br />
panel.<br />
As part of the parametric study, torso belt slack was<br />
introduced into the baseline cases. Negative slack was also<br />
introduced which had the effect of simulating initial belr<br />
tension in the system. Generally, the introduction of belt<br />
slack increased restraint system compliance and increased<br />
passenger head injury response. Initial belt ten$ion tended<br />
to improve passenger injury response somewhat. It was<br />
noted in the case of the Tempo, that with greater than 1.5<br />
inches of slack, head impact was squarely on the top of the<br />
instrument panel rather than a combination of top and middle<br />
panel impact. This reduced the head angular acceleration<br />
and neck injury response since impact with the almost<br />
horizontal middle panel had tended to force the head sharply<br />
rearward. The magnitude of the resulting head impact with<br />
the top panel however, sharply increased.<br />
Discussion of results<br />
Head injury was the major response variable in this preliminary<br />
analysis of restrained front seat passengers in frontal<br />
crashes. Throughout the parametric study, chest and<br />
femur injury response remained moderate and except for<br />
some extreme parametric variations, varied littte. Neck injury<br />
generally showed only a moderate response to parametric<br />
variations. (Differences in neck response between the<br />
Colt and Tempo cases however, were significant.) Restraint<br />
system operation was a key variable in the passenger's<br />
injury response. A sufficiently stiff restraint system can<br />
prevent head contact during the event. However, too stiff a<br />
restraint system can increase chest injury and head and neck<br />
response as more of the crash energy is transfered to the<br />
occupant. When the restraint system was too compliant,<br />
head contact with the instrument panel occurred and in<br />
some extreme cases, the head contacted the windshield. The<br />
extent of the head injury incurred by instrument panel impact<br />
is dependent on head contact velocity and panel stiffness.<br />
Head contact velocity is a function of crash pulse<br />
severity, passenger clearance, and the extent to which the<br />
restraint system slows the occupant prior to contact. In the<br />
two cases studied here, the disparity in head injury criteria<br />
between the two vehicles was largely a result of restrain<br />
system dynamic performance and crash pulse severity.<br />
The restraint system in the Colt case slowed the passenger<br />
forward travel sufficiently to mitigate head contact injury,<br />
while in the Tempo case, torso belt compliance allowed the<br />
occupant to impact the instrument panel at a significantly<br />
highercontact velocity (28 mph for the Tempo head impact<br />
and 20 mph for the Colt).<br />
Preliminary results indicate that restraint system perfor-<br />
345
tl<br />
I<br />
C<br />
I<br />
I a<br />
t I<br />
?<br />
I a3<br />
I<br />
I ?<br />
a<br />
lS Or.|| Cclt rra tG lfrl tFo ilrt tD ll3|ltrflr ftr 0rtr Cclt rr.l lttr FFt T.+o ilrt ND Srrrhttn<br />
ITil.I<br />
IS r|hill.rrl|rt llrt r CAtlrE<br />
rtll.l<br />
fllC v ||t f l||t'|frit Fil.t 8l,tttf5.<br />
m.r<br />
il.1<br />
rfl.t<br />
H|r.I<br />
tn.l<br />
rtt.l<br />
tH.l<br />
llr.r<br />
ttr,l<br />
t.l<br />
il.r<br />
n.l<br />
r.r<br />
t.l<br />
ttt.l<br />
r||!.1<br />
l.n.l<br />
iltr.r<br />
tH.l<br />
n,l<br />
t.l<br />
rf,.l<br />
H.r<br />
f.r<br />
r.lr<br />
l5.firtr<br />
tn-l<br />
*..|r*rf,r r| lrttrl|* trt- Cflfr*f<br />
ilH.l<br />
t,l<br />
n.l<br />
H.l<br />
t,l<br />
il.1<br />
t.r<br />
.I.l<br />
t.l<br />
l.tt<br />
. Tqo.<br />
'crtt<br />
l.I r,I r.rl<br />
t.l| l.I r.ll r.t<br />
llrtls t t .ld ttfr Gtlr|r*.<br />
|ld |rr*f rr frltruld lflrit Ct+llrt<br />
t.fl<br />
l'.'<br />
l...<br />
l'r<br />
t.E<br />
hl*lrr lEt .l|rt l|rl^r C;r|rr.<br />
F.r<br />
Lf<br />
lJ<br />
rJ I't<br />
l.r l'r<br />
r.r r.t<br />
Il*|n hr.rrd l*rhllc.<br />
Flgure 28. The followlng are restralnt syst€m compllance<br />
teals, iIVMA 2D craah vlctlm almulatlone:<br />
346<br />
t't<br />
t.t<br />
tl<br />
I<br />
C<br />
I<br />
I<br />
I<br />
t I<br />
a<br />
t IF<br />
t<br />
I G<br />
I<br />
I ?<br />
a<br />
rtl.l<br />
tH.i<br />
H.r<br />
tr.t<br />
aI.a<br />
lr.r<br />
lll.t<br />
t.l<br />
rn.l<br />
il.1<br />
t.l<br />
l.{ l.l t.t t,f<br />
l.t 1.3 r.r r.r r.l<br />
b|rttr tlrrl l[lfftr.<br />
l.l --- l.r t.l - l.t r.l<br />
l.t l.l l.l l.{ l.l<br />
|rlr0lr| trrrt ttllllrr<br />
H ftrlr ttrh*t; r lfrfr tltr*r* frrl ltlllrnr<br />
tn.l<br />
rrn.l<br />
ffi-l<br />
n.r<br />
t,r<br />
frt,f<br />
t.l<br />
I.l<br />
rn,r<br />
il.t<br />
t,r<br />
Itd I+*'f rlr $pr lnlrr:il' hrl ltlffil$<br />
. t<br />
i - /<br />
.t<br />
hft<br />
,i<br />
JFr<br />
i. . . r{<br />
il.t<br />
IT l'{ r'r l'l r'l t'l<br />
l.r r.t r'l t.. t.t<br />
blArr hl |lraf|nr<br />
Flgure 29. The followlng are upp€r lnatrument panel atlffneet<br />
tE8ts, MVMA 2D craeh vlctlm simulatlone:<br />
blt
L<br />
I I<br />
IID Drt||r Colt fJ lE Fr{ tqlc lllt lD lllhltrr l* Dfrr Gllt rt lG lr.r l* llt !D lrrrl*,rn<br />
tI.l<br />
lllt |,. lbrqr *cttr1 lc.ttlf,r<br />
t.l<br />
lllt rr Trro frll 3l*]<br />
fr.l<br />
I.l<br />
n,l<br />
In.t<br />
rn.l<br />
trn,l<br />
tLl<br />
ln.t<br />
I.l<br />
I.l<br />
rI.l<br />
In.l<br />
tfl.l<br />
rn.l<br />
It.f<br />
ilI.l<br />
t.l<br />
rI.r<br />
H.r<br />
I.l<br />
rt.r<br />
I<br />
I n.r<br />
3 n.r<br />
f<br />
I<br />
a<br />
t.r<br />
3<br />
t<br />
t<br />
I<br />
tr.r<br />
I.r<br />
.Ll<br />
{.1<br />
{,r l,l<br />
-l.l l.l<br />
Ld bltlr| (trr.tal,<br />
t.l<br />
lt=ln<br />
lh- IfGt ||;rrrar t.ttrrf frtttolr<br />
.Crrtl.*f.<br />
. a<br />
I<br />
{,t<br />
-l.l t.l<br />
t.t<br />
t.l<br />
l* hltlr| (|}r dt, lr*ln<br />
lH t;rlr *..lrr*rrl n rhrrir fr*|if htttrr<br />
trfi,l<br />
r l<br />
. a<br />
r a<br />
'brrl<br />
lF<br />
r-r<br />
t.l<br />
{t r.r<br />
l'l<br />
rr<br />
'rl<br />
H hrltrr tftr r|at, l*<br />
Flg_urg qq. The followlng ano pqrsongor roatlng poslilon te$ts,<br />
iIVMA 2D crsah vlcllm almulatlone:<br />
I<br />
Y<br />
f.l<br />
tl<br />
I<br />
C<br />
L<br />
I<br />
I<br />
tI.l<br />
I.l<br />
rt.l<br />
rI.l<br />
trD.l<br />
rtl.r<br />
t.l<br />
I.t<br />
Ll<br />
il.1<br />
It.l<br />
rt.l<br />
It.l<br />
ril.l<br />
ft.l<br />
t<br />
r I.l<br />
a<br />
rrt.l<br />
fr.f<br />
t.t<br />
I D.l<br />
a<br />
t<br />
r.l<br />
I<br />
. t.l<br />
I r.t<br />
t ?<br />
a I.l<br />
In.l<br />
r.l<br />
Crlt,<br />
r.l<br />
l.i t.t<br />
l|lt ll-r, |'*lr.<br />
lH t|!ff rr trrc l|lt tl-*<br />
. t.<br />
rqo j<br />
' !<br />
t<br />
i<br />
-i<br />
Grlt<br />
r.a<br />
l.r t.t<br />
hll ll*lr, tr*ln<br />
hl l|rr; IGatH3th E rr* ErI ..m<br />
,ts'- t<br />
ih.<br />
r .i '.<br />
t<br />
. .1.<br />
t i r<br />
1 / r<br />
t. r-.1<br />
v ,y"<br />
-- r<br />
c.tL.f<br />
-l.l<br />
{.r<br />
l.l l.l<br />
l.r<br />
lrn lld,<br />
t.!<br />
frln<br />
t.l<br />
1.3<br />
Flgure 31. The followlng ar6 torso bett $teck tests, ilVilA 2d<br />
crash vlctlm slmulatlon$:
mance is a complex event: restraint system compliance,<br />
crash pulse severity, passenger clearances, instrument panel<br />
stiffness, and panel intrusion are all key elements affecting<br />
occupant injury. The two NCAP cases show that in addition<br />
to these apparent event variables, performance of key elements<br />
of the restraint system is also an important consideration<br />
in assessing the potential for mitigating passenger injury.<br />
Future work will focus on analyzing additional frontal<br />
crash events including light duty trucks, and on identifying<br />
and analyzing critical restraint system elements.<br />
Summary<br />
The objective of the frontal crashworthiness research<br />
program at the National Highway Traffic Safety Administration<br />
is to assess the safety problems associated with<br />
occupants of vehicles involved in frontal impacts and to<br />
identify potential remedies for the problem. The focus of the<br />
analyses presented in this paper is the identification of the<br />
safety problem for restrained, right, front, seat passengers.<br />
Analyses of accident data and crash test data indicate the<br />
pas$engers can still make contact with interior vehicle<br />
surfaces even why they are restrained. Head contact with the<br />
upper part of the instrument panel appears to be a serious<br />
safety problem, and research efforts were initiated through<br />
both laboratory and analytical studies to better characterize<br />
the injury mechanism. Initial results of the studies are<br />
presented in this paper.<br />
The laboratory effofis included the collection of both<br />
dynamic and static force-deflection characteristics of the<br />
upper instrument panels for a wide range of passenger cars<br />
and light trucks that had been tested as part of NHTSA's<br />
New Car Assessment Program. Test data was collected<br />
utilizing a component level head test which consists of a<br />
hemisphere shaped headform mounted on an impactor<br />
which is essentially a guided piston. The component level<br />
laboratory results were compared to the NCAP results and a<br />
fair degree of conelation was obtained. Exact simulation of<br />
the injury sustained by a passenger in a full scale crash test is<br />
not po$sible utilizing the present test devices and<br />
procedures. Constraints of the present system include<br />
limiting the head motion to one direction, neglecting the<br />
affect of the vehicle deceleration and belt loading on head<br />
accelerations, and a fixed effective mass. Future research<br />
will examine alternative component level test procedures to<br />
better simulate full scale crash tests.<br />
The analytical effort utilized the MVMA 2D occupant<br />
simulation model. Initial simulations focused on the<br />
validation of two NCAP tests, and the results of the<br />
validation and parametric studies are presented. The<br />
laboratory study ptovided input data on the material<br />
properties of the instrument panels and geometry of the<br />
vehicle interiors. The parametric study indicates the effect<br />
that crash pulse, intnrsion, seat position, restrain system<br />
compliance, and instrument panel stiffness have on head<br />
injury criteria. The extent ofthe head injury criteria incurred<br />
348<br />
by instrument panel contact is dependent on head contact<br />
velocity and instrument panel stiffness. Head contact<br />
velocity is a function of crash pulse severity, passenger<br />
clearance, and the extent to which the restraint sy$tem slows<br />
the occupant prior to contact. While the first priority in<br />
developing mitigation concepts should be aimed at<br />
eliminating or reducing head contact velocity, it will not be<br />
possible to eliminate all head contacts. For those situations,<br />
the instrument panel and other interior components need to<br />
be modified to mitigate head contact forces.<br />
References<br />
(1) National Accident Sampling System, 1986. A Repon<br />
on Traffic Crashes in the United States, National Highway<br />
Traffic Safety Administration, July, 1988.<br />
(2) Crashworthiness State Database, Reference Manual.<br />
To be published, National Highway Traffic Safety<br />
Administration.<br />
(3) NHTSA Data Tap Reference Guide, <strong>Volume</strong> I:<br />
Vehicle Crash Tests, National Highway Traffic Safety<br />
Administration, August 1985.<br />
(4) Malliari, Hitchcock, and Hedlund, "A Search for<br />
Priorities in Crash Protection," SAE <strong>Int</strong>ernational Congress<br />
& Exposition, SAE 820242, Detroit, Michigan, Feb. 1982.<br />
(5) Malliaris, Hitchcock, and Hansen,<br />
"Harm Causation<br />
and Ranking in Car Crashes," SAE lnternational Congress<br />
& Exposition, SAE 850090, Detroit, Michigan, Feb. 1985.<br />
(6) Luchter, Faigin, Cohen, and Lombardo, "Status of<br />
Costs of Injury Research in the United States," to be<br />
presented at the <strong>Twelfth</strong> <strong>Int</strong>ernational Technical <strong>Conf</strong>erence<br />
on Experimental Safety Vehicles, National Highway Traffic<br />
Safety Administration, June, 1989.<br />
(7) Crane, D., "Restrained Passenger Head Testing,"<br />
<strong>Volume</strong> l, MGA Research Corporation, under contract to<br />
the National Highway Traffic Safety Administration and the<br />
Transportation Systems Center DTRS-57-87-C-0046,<br />
MGA Draft Report No. G88R{2, February 1989.<br />
(8) Segal, D., Kamholz, L., and Griffith, D., "Vehicle<br />
Component Characterization" <strong>Volume</strong>s I and 2, MGA<br />
Research Corporation under contract to the National<br />
Highway Traffic Safety Administration and the<br />
Transportation Systems Center, DOT HS 807 054 and DOT<br />
HS 807 055, January 1987.<br />
(9) Bowman, 8.M., Bennett, R.O., Robbins, D.H.,<br />
MVMA Two-Dimensional Crash Victim. Simulation<br />
Version 5, Vols I, Il, lII. Transportation Research Institute,<br />
University of Michigan, Ann Arbor, MI 48109. Rpt. No.<br />
UMTRI-85-?4-?, October, 1986.<br />
(10) Carlson, L.E. and Leonard, P., New Car Assessment<br />
Program, Frontal Barrier Impact Test, 1985 Ford Tempo GL<br />
Z-Door. Mobility Systems and Equipment Company, Los<br />
Angeles, CA 90301 (Prepared for U.S. Dept. of<br />
Transportation, National Highway Traffic Safety<br />
Administration, Office of Market Incentives, Rpt. No.<br />
MSE-85-No. 4), July, 1985.<br />
(ll) Levan, W.E. and Alianello, D.A., New Car
Assessment Program, Frontal Barrier Impact Test, 1985<br />
Dodge Colt 4-Door Hatchback. Calspan Corporation,<br />
Buffalo, NY 14225 (Prepared for U.S. Dept. of<br />
Computational Crash Analysis at the Saah Car Division<br />
Larsgunnar Nilsson,<br />
Saab Car Division<br />
Saab Scania AB<br />
Abstract<br />
In the development of Saab cars, passenger safety is of<br />
the greatest concem. To verify the safety level achieved a<br />
large number of destructive crash tests are carried out. Each<br />
of the$e te$tri is time-consuming and costly. It is of interest to<br />
Saab, as well as the whole community of cflr manufacturers,<br />
to reduce the number of crash tests, and yet to achieve the<br />
target level of passenger safety. Computational mechanics<br />
has turned into a powerful tool which can complement crash<br />
tests and, furthermore, reduce the number of tests needed.<br />
Recently, Saab has developed a finite element model of<br />
the Saab 9000 T | 6 CS car. The calculated results show good<br />
agreement with available test data and also reveal crash<br />
phenomena which are hard to observe in the standard destructive<br />
physical tests.<br />
Computational analysis of crash problems is the new<br />
method of developing cars with higher passenger safety.<br />
Once developed and validated, the finite element crash<br />
model can be utilized for design studies or parametric studies<br />
and needs only a very short time to produce useful<br />
results. Thus, within a given time a larger number of design<br />
altematives can be evaluated and a final design with higher<br />
passenger safety can be obtained.<br />
<strong>Int</strong>roduction<br />
Safety has always been of great concern in the<br />
development of Saab cars. During the I 950s to I 970s safety<br />
developments mainly concerned active safety. The success<br />
of Saab in rally competitions during that time was partly a<br />
result of high active safety. Passive safety has since then<br />
been given lncreased attention to meet customers' needs<br />
and government regulations.<br />
The engineering considerations in regard to<br />
crashworthiness are extensive, Many experiments are<br />
carried out as design studies or verification tests on both<br />
prototypes and cars taken from the production line. Both<br />
complete car structures and components are tested.<br />
Although possible, development of structural<br />
crashworthiness by testing alone is a much too costly and<br />
time-consuming process.<br />
It is of great interest to Saab to shorten the development<br />
phase and yet achieve the target level of passenger safety.<br />
During recent years, computer analysis of nonlinear<br />
contact-impact problems has developed remarkably. Today,<br />
Transportation, National Highway Traffic Safety<br />
Administration, Office of Market lncentives, Rpt. No.<br />
CAL-8-5-No. ?), February, 1985.<br />
it is possible to preform analysis of complex structures,<br />
which just a couple of years ago was considered to be<br />
science fiction. The rapid evolution in this field is a<br />
consequence of developments of more theoretically sound<br />
and efficient algorithms for the numerical solution of<br />
nonlinear structural dynamics, as well as the rapid growth in<br />
speed and availability of supercomputers. Computer<br />
analysis of crashworthiness is on the threshold of emerging<br />
as a tool that can substantially reduce the cost and time<br />
required for the development and certification of a new car<br />
design.<br />
Numerical Analysis of Vehicle<br />
Crashworthiness<br />
Review<br />
Computers have been used in the analysis of<br />
crashworthiness since the 1960s. In the first generation of<br />
analysis the vehicle was modelled as a lumped system<br />
consisting of mass and spring elements. The main problem<br />
with these models was to assign appropriate stiffness to the<br />
spring elements. These data must be found from<br />
experiments on structural components similar to those<br />
which are to be analysed. The resulting system constitutes a<br />
set o[ coupled ordinary differential equations, which must<br />
be integrated in the time domain. Because of the difficulties<br />
mentioned and the limited capacity of the mainframe<br />
computers available at that time (comparable with that of<br />
personal computers today), the number of mass and spring<br />
elements wari very limited. In general, the results from<br />
physical tests on the same structure or its components must<br />
be available in order to calibrate the model. As a<br />
consequence, the applicability of the lumped system was<br />
limited to analysis of structure$ very similar to the one<br />
tested. Thus, the lumped models could not be used to make<br />
predictions regarding new car designs without the existence<br />
of a physical prototype. A typical lumped mass system used<br />
at Saab in the 1970s is shown in figure I.<br />
The finite element method<br />
The finite element method (FEM) was developed during<br />
the 1950s and the 1960s mainly for the analysis of static<br />
problems. The first attempts to use FEM in the analysis of<br />
crashworthiness were made at the beginning of the 1970s. In<br />
these analyses, beam and rod elements were used along with<br />
discrete mass and spring elements. Although reflecting the<br />
real structure to a larger extent than the lumped models, the<br />
properties of the structural elements were still mainly found<br />
349
Flgure 1 . Mass'sprlng model of s Ssab 9fi1 vehlcle (1979).<br />
from physical tests. Thus, the criticism of the lumped massspring<br />
models is also valid for the first generation of FEM<br />
crash analysis models. A widely used computer program of<br />
the first generation type is KRASH (Wittlin and Gamon<br />
( I )*).<br />
With FEM first-principle analysis became possible, i.e.<br />
the structural properties are derived from the basic continuum<br />
mechanical relations. Thus, it became possible to make<br />
crashworthiness predictions of a vehicle structure simply by<br />
knowing the relevant material properties, the geometry, and<br />
the boundary and initial conditions.<br />
The equations of motion resulting from the FE-discretised<br />
system must be integrated in time, starting from<br />
known initial conditions. This is carried out as a step-bystep<br />
integration, either with an implicit or an explicit<br />
method.<br />
When an implicit method is used, a non-linear equation<br />
system must be iteratively solved in each time-step, which<br />
makes it a very time-consuming step. In crash problems the<br />
loads vary extremely rapidly. In order not to truncate these<br />
loads, very short time-steps must be used. Thus, implicit<br />
methods demand very large computer resources to integrate<br />
the response time of interest. Also, due to the severe nonlinearities<br />
involved, the iterative equation solver often fails<br />
to converge. Consequently, implicit methods have not been<br />
successful in the analysis of crash problems, although many<br />
ofthe general purpose FE code developers still do not seem<br />
to have given up hope.<br />
The generally used explicit method is the central difference<br />
method. Unlike the implicit methods, it does not require<br />
the assembly of system matrices and the solution of<br />
each time-step is trivial. However, the central difference<br />
method is only conditionally stable, i.e. the time-step must<br />
be less than a critical value proportional to the shortest time<br />
it takes a sound wave to travel between two adjacent nodes.<br />
It follows from the previous discussion that the time-step<br />
limitation is not too severe in the analysis of crash problems.<br />
* Numbers in parentheses designate references at end of paper.<br />
350<br />
Today, all the popular codes in crash analysis u$e the central<br />
difference method.<br />
Car body structures mainly consist of connected sheet<br />
metal paft$. To make an accurate FE model of the car body,<br />
shell elements are essential. Also solid, beam and rod elements<br />
are required in a complete vehicle structural model.<br />
The first FE-analysis, which used shell elements and<br />
explicit time integration, of a vehicle collision was carried<br />
out in 1975 by Welch, Bruce and Belytschko (?). It was also<br />
the first attempt to use FEM as a first-principle analysis of<br />
vehicle crashworthiness. At that time, the computers were<br />
not powerful enough to perform the analysis successfully.<br />
During a crash, the vehicle structure is severely deformed<br />
and the structural parts may be exposed to multiple contactimpacts.<br />
The first FE program, with an explicit time integration,<br />
that seriously addressed the contact-impact problem<br />
and that took full advantage of the supercomputer (Cray)<br />
was DYNA3D, developed by Dr. John O. Hallquist (3), (4)<br />
The first version of DYNA3D became available in 1976.<br />
DYNA3D has since developed remarkably, and is today<br />
probably the most well-known and widely used FE code in<br />
crash analysis. Most of the other commercial crash analysis<br />
codes, e.g. MSC/DYNA, PAMCRASH, and RADIOSS,<br />
have their origin in DYNA3D.<br />
DYNA3D originally lacked shell and beam elements.<br />
During that time, vehicle components such as a front beam<br />
were modelled by the use of solid elements. To account for<br />
bending effects in the metal sheets, at least two elements<br />
were required across the thickness. As previously mentioned,<br />
this resulted in a very small time-step, due to the<br />
short distance between nodal points in the thickness<br />
direction.<br />
Shell elements became available in PAMCRASH 1984<br />
and in DYNA3D 1985, see hallquist et al (5). The first shell<br />
element implemented in DYNA3D was the Hughes-Liu<br />
element (Hughes and Liu (6)) which is derived from a continuum<br />
formulation and allows very large deformations.<br />
Later, also the Belytschko-Tsay element (Belytschko and<br />
Tsay (7)) was implemented in DYNA3D, see Hallquist and<br />
Benson (8). The Belytschko-Tsay element is based on the<br />
Mindlin plate theory and thus only allows moderate shell<br />
deformations. On the other hand, the Belytschko-Tsay element<br />
requires fewer operations and makes the analysis<br />
faster.<br />
The above-mentioned developments resulted in a tre*<br />
mendous increase in computer analysis of vehicle crashwofihiness:<br />
The first complete vehicle (Citroen BX) frontal<br />
30 mph crash analysis was carried out 1985/1986 at Peugot<br />
S.A., see Chedmail et al (9), and since then most car manu*<br />
facturers have performed similar analyses.<br />
Saab started to use DYNA3D in the analysis of front<br />
beams, and front frame structures in 1984. DYNA3D has<br />
since then been used extensively, see Nilsson and Larsson<br />
( l0). Saab has also actively supported new developments in<br />
DYNA3D through Dr. Hallquist and through research programmes<br />
carried out by the author at Linkdping Institute of<br />
Technology, e.g. Zhong (l l) and Oldenburg (12).
Examples<br />
At Saab, computational crash analysis is considered to be<br />
an engineering activity of high priority and its importance is<br />
rapidly increasing. Since 1985, Saab has continuously<br />
aimed at developing qualified in-house resources, i.e.<br />
personnel, methodology, software and hardware, for<br />
advanced crash simulations.<br />
The following crash simulations have been carried out at<br />
the Saab Car Division using DYNA3D. All simulations,<br />
except the full frontal car crash, have been run in-house<br />
using a Cray 1A supercomputer. The full frontal car crash<br />
simulation was run on a Cray X-MP/28 supercomputer at<br />
SINTEF, Trondheim. A new Cray X-MP/48 supercomputer<br />
has recently been installed at Saab, and all current crash<br />
simulations are run on that computer.<br />
The following examples have been chosen to give a brief<br />
overview ofthe crash analysis carried out at Saab during the<br />
last couple of years.<br />
Structural Parts and Components<br />
Front beam<br />
The boxed beam is often used as a front structure member.<br />
It has been analysed extensively at Saab as a standard test<br />
example to debug new methods or new computer code<br />
versions and facilities. The finite element model of one half<br />
of the beam is shown in figure 2. Only one quarter of the<br />
beam is analysed with symmetric boundary conditions<br />
taken into account. At the right end of the beam, a rigid mass<br />
is attached. A total of 1280 4-node shell elements are used.<br />
The beam and the rigid mass have an initial velocity of 35<br />
mph leftwards along the length axis of the beam. The<br />
motion of the beam is constrained by a rigid wall, which is<br />
hit bv the left end of the beam at time zero.<br />
Flgure 2. Inltlal conllguratlon of ths lront baam. Ons qusrter of<br />
the b€am la analyaad wlth symmstrlc boundary condltlons.<br />
Figure 3 illustrates the deformation of the beam at<br />
different time states. It is observed that the folding<br />
mechanism is described in details by the model. This has<br />
been made possible by the single-surface-contact<br />
algorithms in DYNA3D, i.e. all contacts are automatically<br />
notified and analysed. Obviously, this facility is of the<br />
outmo$t necessity when a full car structure is considered.<br />
Figure 4 illustrates the typical time graph of the normal<br />
force on the rigid wall. Each drop in acceleration is caused<br />
by the formation of a new fold.<br />
Flgure 3. Ilelormatlonr of the fronl beam after 0, 4, 8, 1 2, 1 6 snd<br />
20 m$.<br />
a<br />
J<br />
J<br />
(I<br />
=<br />
LJ<br />
z<br />
o<br />
F<br />
(n<br />
z<br />
o<br />
IJ<br />
U<br />
at<br />
o<br />
L<br />
J<br />
(I E<br />
tr<br />
o z<br />
6,<br />
3,8<br />
3,s<br />
t,(xE<br />
{.508<br />
4,ffi<br />
r,Sft<br />
3.TIE<br />
E, !fi<br />
t.ffi<br />
t.5{E<br />
i.fff<br />
o<br />
H H H E<br />
d i d d<br />
ilhlu . o. (xxt(E*{b<br />
Hrtffi ' o.ctt!E.o. TII'lE<br />
Flgure 4.<br />
wall.<br />
H I<br />
Normal torce bstween tho lront beem and the rlgld<br />
Typically, 2 hours of Cray lA CPU time is required to<br />
obtain 20 ms of response time.<br />
Front frame structure<br />
The finite element model of aconceptual frontal structure<br />
is shown in figure 5. A total of 3500 shell elements were<br />
used to model the symmetrical part of the structure. The<br />
inefiia proper"tie$ of the rear part of the car body are represented<br />
by a discrete mass attached with rigid links to the rear<br />
parts ofthe front. Initially all nodal points have a velocity of<br />
35 mph in the forward direction, and the bumper hits a rigid<br />
wall extending perpendicular to the direction of motion.<br />
Figure 6 shows the deformed structure at selected time<br />
states. From these figures, together with a video animation<br />
produced from the detailed solution sequence, it is possible<br />
to acquire an understanding of the mechanical behaviour of<br />
the structure during impact.<br />
351
FIoure 5. Inltlal conllourstlon of the front lrame struclurs. Ons<br />
ha-lf ol the lrsme 15 analy*d wlth symmelrlc boundary<br />
condltlons.<br />
A total of 7 hours CPU time on the Cray 1A was required<br />
to obtain 40 ms of response time.<br />
Steering column<br />
In figure 7 the geometry and various deformed configurations<br />
of a Saab 9fi) steering*column system are shown. The<br />
model consists of 2l00shell elements. A rigid wall (mass 30<br />
kg) hits the steering-wheel with an initial velocity of 9 mph<br />
in the direction of the steering-column.<br />
The FE-model of the steering-column irtcludes details of<br />
the energy-absorbing sliding mechanism between the column<br />
segments as well as contact interfaces between all<br />
parts.<br />
Flguls 7. Inltlal conflguratlon of th€ lt€€rlng whssl'column<br />
syst€m.<br />
Figure 8 shows the deformed geometry at various time<br />
states. Details of the deformation process can be revealed by<br />
making the exterior parts invisible, as shown in figure 9.<br />
The typical force-time relation of the rigid wall is shown in<br />
figure 10.<br />
The steering-column model has been used for the purpose<br />
of design studies.<br />
A 20 ms response analysis requires approximately l0<br />
CPU hours on the Cray lA.<br />
352<br />
Flgure 6. Deformatlons of the front lrame slructure sfter 0, 10,<br />
20 and 30 ms.
t=5ms<br />
t=10ms<br />
t=15ms<br />
Flgure L Deformatlona of the steerlng wheeFcolumn syslem<br />
after 5, l0 and 15 mg.<br />
Flgure 9. Datalls ol thr strsrlng column sy$tem. Erterlor vlew<br />
after 0 and 15 mr. Sllcad-up vlcw aftrr 0, 10 and 15 mr.<br />
353
t<br />
f<br />
tr<br />
3<br />
U<br />
z<br />
o<br />
F<br />
o<br />
7<br />
o<br />
U<br />
tr<br />
J<br />
c<br />
E<br />
tts<br />
z<br />
c i ^ i i { i d i , ; i i i r N N<br />
T IFIE<br />
Flsurt 10. Normal lorco on thc rlgld wall (dummy) |mplnglng<br />
the ateerlng wheel-column syttom.<br />
Complete Car Structure<br />
Model preparation<br />
In a frontal car crash, extensive folding (figure 3), and<br />
bending collapses take place in the front structure, contactimpacts<br />
occurbetween engine/gearbox and radiatorffan and<br />
between enginelgearbox and firewall etc, and many<br />
structural members are highly deformed and distorted. It is<br />
an advanced task to develop a FE-model which, within<br />
acceptable tolerances, gives the required results' The<br />
modelling of the frontal crash in the case of the Saab 9000<br />
T16 CS (figure I I ) was an extensive iob, taking almost one<br />
year. This complete vehicle model has, however, since then<br />
also been used for many other purposes' e.g. side impact<br />
analysis, load distribution analysis, idle shake vibration<br />
analysis etc.<br />
Owing to time considerations, it was decided to model<br />
only one half of the body, assuming symmetry along the<br />
body centre line (i.e. the x-axis, y = 0). The engine/gearbox,<br />
the AC and some other systems were, however, fully<br />
described. From similar crash test$, we know that the<br />
wheels/tyres take part only to a minor extent in the<br />
deformation process. Thus, they have been omitted from the<br />
analysis model. Because of these arrangements, the results<br />
obtained were valid for up to about 80 ms response time.<br />
The FE-model (figure 12) consists of 7500 shell<br />
elements. In addition, beam elements are used as door<br />
substitutes. The total weight and weight distribution of the<br />
FE-model were chosen to correspond to the real vehicle.<br />
Initially, the vehicle has 35 mph velocity forward (xdirection)<br />
and hits the rigid wall, which has its extension in<br />
the yz-plane, at time zero.<br />
354<br />
Fioure 11. lnltlal conflouration$ ol the SEEb 9000 vehlcle FE'<br />
m6dei snd detalled vle* of the engine/gearbox/Ac sy8tem.<br />
Analysis<br />
Because of the primary memory restrictions of the Cray<br />
1A (l MW), the fuII frontal car crash analysis was run on a<br />
Cray X-MP/28 at SINTEF, Trondheim. To make this possible.<br />
we first installed our versions of DYNA3D and TAU-<br />
RUS (postprocessor of DYNA3D, see Hallquist and Brown<br />
(13) there. In total, four days were needed to produce a tape<br />
with the results database. The total CPU time needed for one<br />
run covering up to 80 ms respon$e time was 22 hours.<br />
A video animation of the full set of deformed states, with<br />
or without overlaid stress, energy or strain functions, was<br />
also produced by using MOVIE.BYU (Christiansen (14)<br />
on-line on the Cray at SINTEF.<br />
Results<br />
From the analysis, a very large results database was obtained.<br />
The following selected results are mainly chosen to<br />
illustrate the versatility, validity and accuracy ofthis type of<br />
study.
t=60<br />
FIgure 11. Soqucnco ol tho dolormed Saab 90(Xl vehlcls FE-modcl Et O, 20, 40 snd 60 ms after lmpect.<br />
Figure 12 shows a set of deformed states. When compared<br />
with high-speed films captured in similar tests, a very<br />
close agreement in the global deformations is observed.<br />
Figure 13 gives a close-up view of the engine compartment<br />
before impact and at one deformed state. The deformations<br />
obtained in the analysis are very close to those found in<br />
a real crash.<br />
355
I 40fls<br />
E rp{trirn.4ntc<br />
Flours 13. Glo*e-up vlew ol thc Saab 9000 vehlcle front struc'<br />
tuie and the correbpondlng FE-model' Undcformsd and de'<br />
lormed (40 me) configuratlons.<br />
Figure 14 gives close-up views of the front beam structure<br />
before impact and at one deformed state. The close<br />
agreement of the analysis results to the test is again<br />
illustrated.<br />
Figure 15 shows the measured and calculated acceleration<br />
signal (x-direction) from an accelerometer mounted on<br />
top of the sill. The measured signal has been integrated<br />
twice to find the velocity and the displacement' Furthermore,<br />
it has been filtered (60 Hz) before it was plotted<br />
together with the velocity, the displacement and the corresponding<br />
data from the computer analysis. As noted, a very<br />
close agreement of the analysis results with the tests has<br />
been obtained.<br />
The video animation of the analysis results gives a very<br />
detailed understanding of the mechanics taking place during<br />
the deformation process. On the deformed geometries also<br />
fringes of stress, strain or intemal energy intensities are<br />
shown as further help in understanding the proces$.<br />
With some exceptions, very good agreement has been<br />
achieved between the analysis results and the tests. After<br />
$ome minor corrections. this full vehicle model can be used<br />
with confidence in future analysis. The possibilities of conducting<br />
parametric studies or design studies are extensive.<br />
356<br />
ll<br />
/l<br />
,'t<br />
Flgure 14. Slde vlew of the Saab 9000 vehlcle front structure<br />
snd ths correspondlng FE'model. Undeformed and delormed<br />
(70 me) conflgurstlon$.<br />
Finally, this study shows that prediction analysis is possible<br />
today. The input data for this analysis are simply material<br />
parameters, geometry data, and boundary and initial<br />
conditions. Thus, it is a true first-principle analysis.<br />
Conclusions<br />
Experience at Saab in using advanced computer analysis<br />
of crash problems has increased quickly since 1984. This<br />
has been made possible by the breakthrough in<br />
computational crash mechanics (new theories, algorithms<br />
and codings in DYNA3D), fast access to supercomputer$,<br />
and the continuous and consistent build-up of in-house<br />
personnel resources and know-how,<br />
Computational mechanics is the new methods of<br />
developing cars with higher passenger safety. Once<br />
developed and validated, the finite element crash model can<br />
be utilized for design studies or parametric studies, and<br />
needs only a very short time to produce useful results. Thus,<br />
within a given time a larger number of design alternatives<br />
can be evaluated and a final design with higher quality and<br />
passenger safety can be obtained.
flgqrg 15. Eottom vlew ol tlq $aeb 9fi10 vehlcte FE-modet.<br />
Undoformed and delormed (20 ms) conflguratlons.<br />
Acknowledgements<br />
The close cooperation of Dr John O. Hallquist in various<br />
aspects of DYNA3D is greatly appreciated.<br />
Mats Larsson and Roger Malkusson in the Stress<br />
Analysis Group at the Saab Car Division have assisted in<br />
most of the computer runs.<br />
References<br />
(l) Wittlin, G. and Gamon, M.A.: Experimental Program<br />
for the Development of Improved Helicopter Structural<br />
Crashworthiness Analytical and Design Techniques,<br />
USAAMRDL Technical Reporr, 72-72, 197 3.<br />
(2) Welch, R.E., Bruce, R.W. and Belytschko, T.: Finite<br />
Element Analysis of Automotive Structures under Crash<br />
Loadings, Report DOT-HS-105-3-697, IIT Research<br />
Institute, Chicago 1975.<br />
(3) Hallquist, J.O.: Preliminary User's Manuals for<br />
DYNA3D and DYNAP, University of California, Lawrence<br />
Livermore National Laboratory, Report UCID*17268,<br />
Livermore 1976.<br />
v<br />
(m,/=)<br />
16<br />
L?, .B<br />
I<br />
4<br />
0<br />
S<br />
(*)<br />
.4<br />
,2<br />
Experiment<br />
t (ms)<br />
100<br />
Flgure 16. Experlmenlsl snd cslculated accsl€ratlons,<br />
velocltles and dlrplaccments of the Saab 9000 sltl (clos6 t6<br />
B-po$t).<br />
(4) Hallquist, J.O.: DYNA3D, User's Manual, University<br />
of Califomia, Lawrence Livermore National Laboratory,<br />
Report UCID-19592, Rev 4, Livermore 1988.<br />
(5) Benson, D. Hallquist, J.O., Igarashi, M., Shimomaki,<br />
K., and Mizuno, M.: The Application of DYNA3D in Large<br />
Scale Crashworthiness Calculations, University of<br />
California, Lawrence Livermore National Laboratory,<br />
Report UCRI-94028, Livermore 1986.<br />
(6) Hughes, T.J.R. and Liu, W.K.: Nonlinear Finite<br />
Element Analysis of Shells: Part I. Three-Dimensional<br />
Shells, J. Comp. Meths. Appl" Mechs. Eng,, 27, 1981.<br />
(7) Belytschko, T. and Tsay, C.S.: Explicit Algorithms for<br />
Nonlinear Dynamics of Shells, in ASME AMD-48, 198I.<br />
(8) Hallquist, J.O. and Benson, D.: DYNASD, a<br />
Computer Code for Crashworthiness Engineering, ASKA<br />
user's conference, Baden-Baden 1986.<br />
(9) Chedmail, J.F., Du Bois, P., Pickett, A.K., Haug, E.,<br />
Dagba, B., and Winkelm-itler, G.: Numerical Techniques,<br />
Experimental Validation and Industrial Applications of<br />
Structural Impact and Crashworthiness Analysis with<br />
Supercomputers for the Automotive Industries, in<br />
Supercomputer Applications in Automotive Research and<br />
Engineering Development (Ed. Marino, C.), Computational<br />
Mechanics Publications, Southampton 1986.<br />
(10) Nilsson, L. and Larsson, M.: Saab Crash programe<br />
Route to Customer Safety, The Saab-Scania Griffin,<br />
Linkiiping 1987.<br />
(ll) Zhong, Z.: On Contact-lmpact Problems, Thesis<br />
178, Department of Mechanical Engineering, Linkiiping<br />
University, Linktiping I 988.<br />
(12) Oldenburg, M.: Finite Element Analysis of Thin-<br />
Walled Structures Subjected to lmpact Loadings,<br />
357
Thesis 1988:69D, Department of Mechanical Engineering,<br />
LuleA University of Technology, Lulefr 1989.<br />
(13) Brown, B.E. and Hallquist, J.O.: TAURUS-An<br />
<strong>Int</strong>eractive Post-Processor for the Analysis Codes NIKE3D,<br />
DYNA3D, TACO3D, and GEMINI, University of<br />
California, Lawrence Livermore National Laboratory,<br />
Report UCID-19392, Rev. l, Livermore 1984.<br />
(14) Christiansen, H.: MOVIE.BYU-a General Purpose<br />
Computer Graphics System, Civil Engineering Department,<br />
Brigham Young University, Salt Lake Cily 1984.<br />
<strong>Int</strong>rusion Effects on Steering Assembly Performance in Frontal Crash Testing<br />
Written Only Paper<br />
Carl Raglando<br />
National Highway Traffic Safety Administration,<br />
U.S. Department of Transportf,tion<br />
Gayle Klemer,<br />
Research and Special Programs Administration,<br />
U.S. Department of Transportation<br />
Abstract<br />
Dynamic intrusion of the steering assembly into the occupant<br />
compartment of a car has a significant effect on the<br />
injuries sustained by the driver. In an effort to quantify the<br />
injuries caused by this component, two subcompact vehicle<br />
models were tested at 25 and 35 miles per hour in full frontal<br />
and half offset barrier impacts. The two models were chosen<br />
from those tested under the New Car Assessment Program<br />
(35 mile per hour barrier tests) because they have very<br />
similar crash pulses but dissimilar steering assembly intrusion.<br />
This paper compares the differences between the two<br />
models in physical characteristics, $teering assembly design,<br />
occupant injury data and occupant kinematics in a<br />
program of eight tests using production vehicles and a 50th<br />
percentile unrestrained male Hybrid III driverdummy. Data<br />
from electronic tran$ducers and high speed film analyses<br />
are presented. Conclusions are drawn about the design of<br />
the steering assembly for mitigation of harm to the driver.<br />
<strong>Int</strong>roduction<br />
The objective of Steering Assembly/Frontal<br />
Structure test program wart to as$ess the crash<br />
characteristic$ of the steering assembly and its effect on<br />
unrestrained drivers in frontal impacts. New Car<br />
Assessment Program (NCAP) 35 mph frontal barrier test<br />
data were used to $elect two vehicles which have similar<br />
crash pulses, but dissimilar steering column performance in<br />
terms of dynamic intrusion. The '87 Hyundai Excel and the<br />
'87<br />
Toyota Celica were selected on this basis. The crash<br />
pulses of both cars were similar, but the horizontal<br />
component of steering column dynamic intrusion was<br />
greater in the Hyundai than in the Toyota.<br />
The purpose of these tests was to determine the steering<br />
column behavior within a range of crash conditions using an<br />
unre$trained Hybrid III driver dummy. Additionally,<br />
mechanisms of intrusion were investigated to gain insights<br />
358<br />
into means of lowering the potential for occupant injuries<br />
caused by intrusion of the steering assembly into the<br />
occupant compartment. A test program of eight standard<br />
production '87 Hyundai Excel and '87 Toyota Celica<br />
vehicles was conducted. The matrix consisted of 35 mph<br />
and 25 mph full barrier and half barrier tests, as outlined in<br />
table 1.<br />
Table 1. Summary of test condltlons.<br />
Tart , HoCal GFAth H6dt<br />
2<br />
3<br />
E<br />
;<br />
I<br />
a<br />
Hyunoar Excr r<br />
Toyot! cGlrca<br />
Toyotr Crllcr<br />
Hycfrddl<br />
Eic+l<br />
Tdyota CGI I cr<br />
Hyundrl Excrl<br />
Yotett Crltct<br />
hyundrl Excrl<br />
Vehicle Characteristics<br />
To completely understand the steering assembly behavior<br />
of the vehicles, their crash characteristics are examined and<br />
compared. The information given in table 2 describes the<br />
physical characteristics of the vehicle and the test<br />
conditions for each test. The first column gives the test<br />
number in chronological order. The second column<br />
describes the vehicle make tested and the crash mode: FF for<br />
full frontal and HO for half offset frontal. The wheelbase is<br />
in the third column, with the fourth column giving the<br />
distance between the centerline of the front axle and the<br />
front bumper which is intended to approximate the available<br />
crush of the front structure. These two characteristics are<br />
given only once for each make since all cars of the same<br />
make were identical. The test weight, given in column four,<br />
includes the vehicle. vehicle instrumentation and the<br />
Table 2. Vehlcle chsracterlgtlcs.<br />
e5 nph<br />
55 mph<br />
36 mph<br />
23 nph<br />
23 mph<br />
35 nFh<br />
35 nih<br />
Ful I fFontrr<br />
Ful I lFqnttl<br />
Ful I lFont.l<br />
Ful I fFontgl<br />
Hal a ollict<br />
HrI I ollret<br />
Hsrt offrrt<br />
Hal t dllset<br />
l|odel/ tfheel Fr,Axle- Tcst Test<br />
l{o, Crash }lode be3e BunDer It, SDeed<br />
I nchcs I nches I bs ftbh<br />
I<br />
z<br />
3<br />
4<br />
5<br />
6<br />
7<br />
I<br />
Hyundal /FF<br />
Toyota/ FF<br />
Toyotil/FF<br />
Hyundr'l /FF<br />
Toyotr/H0<br />
Hyundel /H0<br />
Toyota/H0<br />
Hyundel /H0<br />
93,7<br />
99. I<br />
33. 3<br />
38. r<br />
e,660<br />
2 ,700<br />
?,750<br />
?,650<br />
2,780<br />
2.650<br />
?,760<br />
2.6?0<br />
24,7<br />
25.0<br />
ss,4<br />
34.8<br />
24,6<br />
24.5<br />
34,7<br />
34,7
dummy and its instrumentation. The test speed was required<br />
to remain within i0.5 mph of the nominal 25 and 35 mph.<br />
Table 3 contains the data describing the performance of<br />
the frontal structure of the vehicle used in each tesf. This<br />
table is arranged so that one can readily compare Hyundai/<br />
Toyota pairs at each speed in each crash mode. The<br />
following abbreviations are used to identify the tests: 25 or<br />
35 for the nominal test speed in mph, FF for full frontal<br />
crash mode, HO for half offset frontal crash mode, H for<br />
Hyundai and T for Toyota. Maximum passenger<br />
compafiment acceleration in g's, maximum frontal dynamic<br />
crush, peak load cell barrier force, and the time (in<br />
milliseconds) at which each occurred are given. The<br />
passenger compartment acceleration was recorded by an<br />
accelerometer mounted On the rear seat $upport structure.<br />
The acceleration pulse was filtered through a Bufierworth<br />
double pass filter to -3db at 30 HZ curoff frequency, with a<br />
15 HZ corner and a 75 HZ stop frequency. The crush was<br />
then computed by double integration of the acceleration<br />
curve. The load cell barrier (LCB) force is the sum of the<br />
force histories of each of the 28 load cells used on the<br />
banier, 20 cells in the case of the half offset tests. The force<br />
summation was filtered through a Bufterworth double pass<br />
filter to -3db at 100 HZ cutoff frequency, with a 5O HZ<br />
corner and a 250 HZ stop frequency. This frequency wa$<br />
chosen for the load cells due to their inherently lower<br />
frequency content (as compared to accelerometers in the<br />
vehicle) and due to the filtering effect of summing the<br />
channels of data (tending to cancel out random noise).<br />
Given last is the crush at the time peak LCB force occurred.<br />
Table 4 shows variables calculated from the data in table 3.<br />
Crush and the peak force from table 3 were used to compute<br />
frontal stiffness, the first variable in table 4- Frontal<br />
Table 3. Msasured crash date.<br />
FF35 H<br />
It Fr<br />
EF33 f<br />
Dt ht<br />
EOti H<br />
O+ mr<br />
EO?s T<br />
It mt<br />
HO'3 H<br />
ot mi<br />
t|oSE T<br />
3! mr<br />
unr * i<br />
f+;EE,1n-+TTFEEllgr,<br />
Tabh 4. Calculsted crash datB.<br />
FFzf H<br />
FFE3 T<br />
FFf3 H<br />
FFI3 T<br />
of23 H<br />
OFZE T<br />
OFI: H<br />
6F3E T<br />
* Ati<br />
EllIEg'TI l+*tll'g-1s66'-.<br />
14. t{<br />
r6re6<br />
ae-1a<br />
zo-ro<br />
2o.27<br />
16.04<br />
2L-11<br />
stiffness, given in thousands of pounds per inch of crush, is<br />
followed by the maximum crush as a percentage of the total<br />
frontal distance available forcrush. The last column in table<br />
4 is the maximum energy absorbed by the frontal structure<br />
calculated by integrating the force displacement curae.<br />
In addition to the data presented in tables 3 and 4, plots of<br />
the passsenger compartment acceleration (crash pulse),<br />
velocity and displacement over time are helpful in<br />
comparing the two vehicles. Figure I compares the 25 and<br />
35 mph full frontal pulses of the Hyundai and Toyota, while<br />
figures 2 and 3 compare velocity and displacement,<br />
respectively, obtained by integrating the crash pulse.<br />
Figures 4, 5 and 6 make the same comparisons for the half<br />
offset crash mode. From these curves we can see that these<br />
two vehicles have reasonably similar crash pulses, with the<br />
largest variation occurring in the 35 mph tests. The effect of<br />
these variances will be further discussed<br />
in the section on<br />
Occupant Kinematics.<br />
It is important also to look at the vehicles' energy<br />
absorption capabilities. Figure 7 shows the comparison of<br />
Hyundai and Toyota force-deflection curves for 25 and 35<br />
mph full frontal tests. Figure 8 shows the integrals of these<br />
force-deflections. It is clear at 25 mph that the frontal<br />
structure of the Toyota absorbs more energy than does the<br />
Hyundai in this crash mode. These 25 mph curves also<br />
indicate that the Toyota has the potential to absorb more<br />
energy at higher crush. Energy absorption is the same up to<br />
approximately 3 inches of crush. After that point the Toyota<br />
absorbs more energy for every increment of increased<br />
crush.<br />
Figures 9 and l0 help to explain the above differences.<br />
Figure 9 is a pretest under,body view of the engine<br />
compartflent of a Celica; figure l0 is the same view of an<br />
Excel. Notice the T-shaped assembly (front suspension<br />
crossmember and center engine support member) in the<br />
Toyota. The Toyota lower control arms also provide added<br />
structural rigidity, at least from the wheels aft, due to their<br />
trailing longitudinal orientation and their attachment to the<br />
floorpan, This construction indicates that the Toyota may be<br />
structurally stronger in the latterpart of the crush. However,<br />
at 35 mph, the peak LCB force is essentially the same forthe<br />
two cars, but the peak force occurs slightly earlier in the<br />
Hyundai at approximately 16 inches of crush. This peak in<br />
the Hyundai did not occur at the lower speed, even though<br />
the crush exceeded 16 inches. This indicates that engine<br />
impulse or some other factor, rather than structural strength,<br />
influenced the Hyundai peak force. The reasons will be<br />
investigated in later discussions comparing crash speeds<br />
and crash modes.<br />
Comparison of structural performance in the half offset<br />
crash mode shows less difference tretween the two makes.<br />
Figure I I contains plots of the force-deflection curves<br />
resulting from the 25 and 35 mph half offset batrier tests.<br />
Figure 12 shows the corresponding energy absorption<br />
curve$. Again the Toyota frontal structure absorbs more<br />
energy at 25 mph than does the Hyundai, but the difference<br />
is less pronounced. In the 35 mph case the energy absorption<br />
359
tt rr* Ftll lm;nl H1r'ld,ti Ercel w. tqon C.UH lf rpt Frlll lrclittl Hyr'l,&ll E*d rlt. folo|r Ctl|r'r.<br />
0 25 SO t} 100<br />
Ilmr (mr)<br />
Figure 1. Crash pulse lor full lrontal tests.<br />
2t l;h PilI ltratd Hyr:drl Errrll ot Toyot: HE tt r;t Ftll ftot|rt Hystdtl Excrl pr. ttlotr Ctltcr'<br />
eg<br />
i<br />
t<br />
t'r (c)<br />
Flgure 2. Veloclty curves for full frontal tests'<br />
360<br />
- l{yurdd Ercd<br />
- lopto Cr$co<br />
- H|.Era<br />
||l rdCt<br />
+a-a.----l--tt'lr'<br />
r ro t t a t t rr i f'drsfrf.rrfrf,.f<br />
a<br />
it<br />
c<br />
o -<br />
oL<br />
! t( l -<br />
{t<br />
3 t<br />
I<br />
- llWndoi Excal<br />
- Toyuto Crrlico<br />
a<br />
a<br />
a/<br />
IT<br />
r.-r----g:<br />
o ro f t 4 tP f rt f +*d..t.f*f.f.frf,rf<br />
tr<br />
(m)
-n<br />
u<br />
rt rFt ?:ll l'|f,td ''lllr.&j tsd rr. Tq'li. c'Glfu tll| ft* Fsll lto:td llystt/,tl Err:ll rr. ?qo]. C.zillc.<br />
{<br />
-FFt hrr<br />
--<br />
-<br />
c&<br />
1r.r.._._.t<br />
.t<br />
T-<br />
I<br />
l5 ;pt Htll clftct Hyr,tthl Ercrl or. Tqctn Ctl/rct Jll npl Hdl cflfi HyarJnl Ercrtr ot. toyolt Crrlkr.<br />
6 -to<br />
o<br />
! a!f -20<br />
g<br />
{<br />
-J0<br />
r f t t a a a rr a ilt'rfrildrtrtfril | + + f a ] a r| t tf.|.rtdrl|rlrf1*<br />
rm (al<br />
- Hygn{oi Erccl<br />
r loyoto Crl'co<br />
_,10<br />
0 23 50 lJ r00<br />
Tlmr (nr)<br />
Figure 4. Crash pulsea lor hall off8et tests.<br />
- Xyg6Ooi Ercrl<br />
- tof.sto Cafco<br />
il<br />
I<br />
I<br />
I<br />
I t
2E rll I{r.V aUlE, IlytstuI E,rcel o* Toyrclt Cdlu tt r;r Hrll Oooootl.4 Hytr'sd.tl E-ctl sr' liottot. c.lle..<br />
ttrr (ml<br />
Flgure 5. Velocity surves lor half offsst te$ts.<br />
-<br />
* a rr a adr{rtrt$19afrf<br />
|tr. (+)<br />
ttl nplr I|l.If Ofilr Hyr*ttltt Ercrl lr, Ilqn|n Ccllgr l$ erpl llrlf Ofittl Hltathl Excel ot, fqol. e3rlfl<br />
lh. lrbl<br />
Flgure 6. Dlsplacement curvss for hall oflsst tssts.<br />
362<br />
r rl t t a I t rr a Jdrsrt+lrr.t.tri<br />
t rr + t e f t f f {rlr$rfri+l.tta*+<br />
o + il t {r |t, f f ft'rfrfrt+F1*rtrrn<br />
ttm (tl
t<br />
! ctocg<br />
J<br />
I<br />
o<br />
o<br />
l-<br />
E5 nph lull froatrl llyrndrl lrcrl rr. Toyotr Grllcr 3$ mgh full lrontel ltnlbdrt lrcrl rr. totot| crllcr<br />
rr0<br />
r00<br />
90<br />
80<br />
70<br />
60<br />
50<br />
4<br />
JO<br />
20<br />
t0<br />
o<br />
70000<br />
60m0<br />
30000<br />
$<br />
!<br />
I {0000<br />
}r<br />
PJm00<br />
o<br />
c<br />
lr,<br />
E Htu,illol ErCd<br />
r loyoto Cdlr6<br />
ii<br />
a,<br />
a-<br />
a I<br />
, I<br />
,tA<br />
. l<br />
\;<br />
tt<br />
I<br />
I<br />
I<br />
I<br />
t<br />
to to Jo<br />
Olrphcrrnrnl (ln)<br />
Flgure 7. Forco vs. cruth plotr for full lrontal tssts,<br />
- flgrl<br />
I crlco<br />
t<br />
0.<br />
o<br />
...../<br />
,'/<br />
t<br />
0<br />
l t<br />
,<br />
t<br />
a<br />
a<br />
rt<br />
a<br />
E ctoo.g<br />
J<br />
a<br />
u<br />
o<br />
il0<br />
t00<br />
90<br />
EO<br />
fo<br />
s<br />
50<br />
rO<br />
JO<br />
20<br />
to<br />
o<br />
:/<br />
I<br />
]<br />
ir)<br />
- f,1s61<br />
7 i<br />
t,<br />
l<br />
t l<br />
I<br />
]<br />
tr<br />
i'.<br />
l r , t<br />
t<br />
I<br />
I<br />
f0 20 JO<br />
Dlpbcrmrnt<br />
(ln)<br />
r Cetico t ttf<br />
0<br />
t0 15 20 25<br />
Displocrmrnf (in)<br />
- lltsndoi Erccl<br />
r Isyota Cclcc<br />
25 mph Full Ftontel Exccl oe, Cclica 35 mph Full Frontal ErceI oa, Ccllcs<br />
Olrplommrnl (in)<br />
Flgure 8. Energy ab8orptlon In full frontEl tests.<br />
..-P<br />
'rdf<br />
.,df<br />
fle<br />
;d<br />
g<br />
.i.dP<br />
-d<br />
c
Figure 9. Toyota lront underbody.<br />
Figure 1 0. Hyundal front undGrbody.<br />
is essentially equal for the two vehicles until about 23 inches<br />
ofcrush has occurred. From that point on the Toyota is again<br />
dissipating more energy than the Hyundai. Also note that<br />
the Hyundai uses 98.2% of its available frontal length at<br />
maximum crush at this speed. lt is no coincidence that the<br />
greatest intrusion is also observed during this test: 4.5<br />
inches rearward and 3.6 inches upward. (See table 7<br />
discussed in section IV).<br />
Figures l3 and 14 show the crash pulse comparison, by<br />
crash mode, for the Hyundai and Toyota, respectively. Both<br />
the low speed Hyundai test and the high speed Toyota tests<br />
had higher crash pulse peaks in the half offset tests. To<br />
explain this the corresponding set of force-deflection<br />
curves, figures I 5 and I 6, and energy/displacement curves,<br />
figures 17 and 18, are examined. The first conspicuous<br />
difference is that both vehicles are less stiff in the half offset<br />
crash, as might be expected, but this stiffness difference is<br />
364<br />
more pronounced at 25 mph than at 35, and more<br />
pronounced at 25 in the Toyota than in the Hyundai. The<br />
second salient feature of the curves is that the peak load cell<br />
force values generally correlate with peak acceleration (also<br />
see table 4). One can also see from figures I 5 and I 6 that the<br />
pairs of force-crush curves fbr the 35 mph Toyota and the 25<br />
mph Hyundai have very similar shapes as would be<br />
expected. However the 25 mph Toyota curves and the 35<br />
mph Hyundai curves do not show this similarity. This<br />
exception in both cases is that the peak force and<br />
acceleration in the offset tests were unexpectedly high<br />
values and occurred late in the event. This shows that<br />
"bottoming-out" or stiffening occurred when the crush<br />
exceeded a certain limit available in the front structure,<br />
causing a high but late crash pulse peak (consistent with the<br />
force peaks). Since the high speed Hyundai tests did not<br />
display this phenomenon, it is probable that the energy<br />
absorbed in both high speed tests as well as the offset 25<br />
mph test was of sufficient energy to bottom out the<br />
structure. Referring to table 4 shows that in the low speed<br />
tests this bottoming out phenomenon occurred somewhere<br />
between 55*68Va of the reported available crush. ln the high<br />
speed tests this occurred between 7V98Vo.In the low speed<br />
tests and the high speed full frontal test, the Toyota showed<br />
no signs of bottoming out. However in the high speed offset<br />
test, the structure apparently did bottom out. This indicates<br />
that the Toyota bottoms outatT0-80Vo of the available crush<br />
as repofted in table 4. This can perhaps be explained by two<br />
unique design features of the Toyota. One of these is the<br />
longitudinal engine support member which also serves to<br />
absorb frontal crush energy in a frontal impact. In the offset<br />
impact used in this testing this member was not fully<br />
engaged, thus softening the structure. The other difference<br />
is that the Toyota has trailing lower A-arms which add<br />
considerable stiffness to the structure at about 23 inches of<br />
collapse distance. Since the Toyota does not collapse this far<br />
in the half offset 25 mph test and the longitudinal member is<br />
not resisting collapse, stiffening is not seen at the lower<br />
speed. These diff'erences further indicate that the Toyota has<br />
a more effective collapsible structure.<br />
Comparisons similar to the ones made for crash mode are<br />
made by crash speed in figures 19 through 24. By<br />
comparison of force-crush curves at 25 and 35 mph the<br />
extent ofvelocity rate dependence can be examined. From<br />
the previous discussion it was discovered that the Hyundai<br />
structure bottomed-out in three of the four tests, yet the<br />
Toyota bottomed-out in only the 35 mph offset. Since<br />
structural forces are unpredictable when the structure is<br />
fully collapsed, the Toyota full-frontal tests more reliably<br />
explain the effect ofvelocity on crash pulse and force-crush.<br />
It can be seen from comparing the Toyota full frontal tests in<br />
figure 20, that the crash pulses are very similar in shape' the<br />
peak in the 35 mph test is higher, and the duration longer<br />
than in the 25 mph test. By looking at figure 22, it can be<br />
seen that the force-crush curves are also very similar, until<br />
the load drops off in the 25 mph test.
8i rlpb lhll olht Hyundri lrcel rr. Toyol.r Cdtcr lS nph llell olf*t Hyrodri Ercrl vr. Toyotr Ccller<br />
Ir0<br />
too<br />
90<br />
eo<br />
t<br />
Eto<br />
t<br />
o<br />
50<br />
:t<br />
Jto<br />
t<br />
g.o<br />
o<br />
t-<br />
J{r<br />
20<br />
l0<br />
0<br />
r llWlrdoi Ererl<br />
- tqsra Cdica<br />
,_rj<br />
,<br />
a,<br />
a<br />
t<br />
I<br />
I<br />
I<br />
I<br />
I<br />
I<br />
I<br />
0frphcrmrnl (ln)<br />
Flgure 11. Crash pulses lor Hyundal Excel full frontsl vs, hslf offact teete.<br />
10<br />
Dllplocrmrni (ln)<br />
25 mph HeA Offtct Exccl oe, C,clica 35 mph HaA Qffsct Ercel os. Celica<br />
50000<br />
t<br />
4 | 40ffi<br />
h<br />
gJ000o<br />
o<br />
g<br />
trJ<br />
?0000<br />
- f41l<br />
t C.Ico<br />
t<br />
,fr<br />
,<br />
ll<br />
0<br />
t,<br />
f t<br />
)<br />
o<br />
f7<br />
0 5 t 0 t 5 2 0<br />
Dhpfocrrrrnf (ln)<br />
Flgure 18. Energy abaorptlon In half off$Gt tc$ts.<br />
,<br />
2J<br />
|r<br />
il0<br />
t00<br />
90<br />
EO<br />
Erc<br />
t<br />
o<br />
o. 60<br />
o<br />
.=<br />
Sso<br />
E.o<br />
o<br />
lr<br />
'df<br />
Jo<br />
20<br />
t0<br />
0<br />
'dP<br />
.rdf<br />
fr-<br />
:'-e<br />
P<br />
,i -dFP<br />
d<br />
c 0<br />
- l+nrndoi frGd<br />
- IoFtq Cetico<br />
o<br />
a,<br />
r EICCI<br />
r Crlho<br />
to<br />
t<br />
, r<br />
f + t<br />
l r<br />
y r<br />
^A. I<br />
, I \ l<br />
l r<br />
,<br />
,,<br />
l r<br />
tr,<br />
\./i I<br />
I<br />
I<br />
I<br />
I<br />
I<br />
I ,<br />
t0 t5 20 ?s<br />
Displocrmrnt (in)<br />
o<br />
,?<br />
J5<br />
365
i<br />
o<br />
C<br />
o<br />
I<br />
t I<br />
tl<br />
(t<br />
{<br />
HFn&t Erorl l, *fh Fr/ll fmll.ttl ct' Hr,/f ofrrlt Hytntst Brrrll l8 lilh F:ll ftoilrd<br />
n Fsll lrutlol<br />
- lloll ollrrt<br />
r{ir.r-<br />
I.<br />
, ra<br />
fr.t^ -r<br />
\<br />
I ]<br />
tt<br />
\. r t'<br />
\ r I ;<br />
\L /;<br />
5rt<br />
- Fdl lrsrtC<br />
r lHf oltrt<br />
ir t's ro is lm | 25 ls, I ts 25 r5 t00<br />
Iimr (rnr)<br />
llmr (mr)<br />
,*ta<br />
Figurel3.Grashpu|sestorHyundalExcellu|||rontalvs.haliolfsettests.<br />
6<br />
i)<br />
c o<br />
o<br />
o<br />
o<br />
rt<br />
g<br />
t0<br />
-t0<br />
-J)<br />
Toyott Ccllcc 2tl ;lph Frll ftonttl w' HrJf offr,l To1ot. Ctllct 35 ;plr Ftlt ftonttl<br />
timr (mr)<br />
Flgure 14. Crash pulaes for TOyOta Gelica tull frontal v3. half offset te$ts.<br />
366<br />
- Full frontol<br />
r Hdf oflrrt<br />
It<br />
' l<br />
l<br />
t<br />
t:<br />
t<br />
(,<br />
E<br />
-9*<br />
E I<br />
t r +<br />
(,<br />
{<br />
I<br />
it<br />
C<br />
t t<br />
, l<br />
a u<br />
rit' Htf ollttl<br />
.ff.<br />
ot Htlf olltct<br />
ti 100<br />
i ts io 7s loo l?5 l5o l?5 25 rt0 r73<br />
l0<br />
0<br />
o -t0<br />
o<br />
L<br />
t<br />
t<br />
o -<br />
o<br />
{<br />
r Full lrontsl<br />
- Holf offt.t<br />
I<br />
Iimr (mr)<br />
t75
t<br />
! ctooo<br />
J<br />
t<br />
|,<br />
o<br />
lr<br />
Hyuodrl kcrl 2$ rnph Full lrontrl vr. llrll olhrt Hyundrl Ercrl 35 mph hrll frontrl rr. Hrll otfrct<br />
tt0<br />
t00<br />
90<br />
8{t<br />
70<br />
60<br />
50<br />
{O<br />
JO<br />
20<br />
I Fuill fruntol<br />
- tlcll oftrrt<br />
!t<br />
tr<br />
i<br />
t<br />
I<br />
I<br />
I<br />
a<br />
I<br />
a TI<br />
a<br />
I<br />
I<br />
I<br />
I<br />
a<br />
Ohplecrmrnl (ln)<br />
il0<br />
r00<br />
90<br />
^8o<br />
I<br />
E c 7 0<br />
I<br />
o<br />
s" 60<br />
350<br />
o<br />
g + 0<br />
o<br />
E J o<br />
Flgure 1 5. Force ve. crush plots for Hyundal Excel full frontrl vs. half ofl$et terts.<br />
t<br />
! EI0oo<br />
J<br />
I<br />
u<br />
o<br />
Toyolr Cellcr 86 mph lull frootd vr. Hrll olfrct<br />
il0<br />
90<br />
80<br />
to<br />
60<br />
20<br />
t0<br />
0<br />
- Full lrq.rtql<br />
r Holl ott3rt<br />
0lrphornrnf (ln)<br />
Figure 16. Forcc ys- crush plota for Toyota cellca full lrontal vs. h8lf ofl'tt tssts.<br />
t<br />
v Etotro<br />
I<br />
I<br />
u<br />
o<br />
20<br />
t0<br />
o<br />
ro Jo<br />
Dhplocrmrnt (ln)<br />
ToyotrCcllcr<br />
35 mph Full frontrl vr. Hdl offret<br />
it<br />
,tt<br />
o<br />
o<br />
a<br />
p frrll frcnlol<br />
r llolf offtcl<br />
[ ;<br />
o<br />
a<br />
I<br />
t l<br />
t l<br />
/ t<br />
,<br />
a<br />
I<br />
a<br />
tt<br />
t<br />
I<br />
m<br />
Obplocrmrnl (ln)<br />
t<br />
- Full t|Untdl<br />
- itoll ctttrt<br />
IL<br />
t I<br />
I<br />
I<br />
I<br />
a<br />
I<br />
a<br />
at t I<br />
I<br />
I<br />
I<br />
I<br />
I<br />
a<br />
.0<br />
\
7<br />
romo<br />
6mo<br />
?0000<br />
tmo<br />
0 0 5 t o t 5 2 0 2 5<br />
Olgbcrmrnf (in)<br />
Flgure 1 7. Energy absorptlon by craeh mode lor the Hyundal Excel.<br />
368<br />
25 mph FuIl Frcntil os. Half Off*t 35 mph F14II Frcntal ot. Half olfwt<br />
I<br />
a<br />
lmmo<br />
fo 15 20 25<br />
Dirplocrmrnl (ln)<br />
25 mph Full Frontal os, HaA Off*t 35 mph FUII Frontal oe. HtU Oflset<br />
70000<br />
60ffi<br />
i0000<br />
I<br />
e<br />
I 10000<br />
t<br />
9J0000<br />
t<br />
C<br />
lr,<br />
2m00<br />
s Full Froatol<br />
tr Holl Oflrt<br />
t'<br />
rrf<br />
t<br />
t<br />
a<br />
t<br />
,<br />
0<br />
0<br />
,<br />
t<br />
0<br />
,<br />
o<br />
,<br />
o<br />
r0000 /rr<br />
t<br />
,<br />
0<br />
0 i 1 0 1 5 2 0 2 5<br />
ltirpfommrnf (ln)<br />
Flgure 18. Energy absorptlon by craeh mode for thc Toyota Gellca.<br />
.d<br />
.df<br />
t'r-f<br />
Re<br />
:p tr<br />
;+e<br />
"dfP<br />
"dtr<br />
..*p<br />
'*d<br />
,r-P<br />
F.e<br />
:#r<br />
o<br />
ioP<br />
.sP<br />
,d<br />
- Futt Fronlol<br />
- ndl Offr.t<br />
{,"<br />
- Full Frontol<br />
r rhtl O{lut<br />
{,*<br />
,<br />
O<br />
f o<br />
T '<br />
7 a<br />
t<br />
o<br />
,<br />
,<br />
I<br />
t<br />
,<br />
I<br />
I<br />
,<br />
r0 15 20 z5<br />
Dirplommrnt (ln)<br />
i,<br />
o<br />
o<br />
,o<br />
rqt<br />
o<br />
o<br />
a<br />
';t<br />
J5
Hyrndrl Ercd Frll frortrl tS r7t ur. 15 ;pt Hyr;drl E.rcd ttr,$ olftril 25 sph ur. t.f rrplr<br />
- ZJ rriptr<br />
rt J5 ffiph<br />
0 25 50 73 r00 t25 t5o l7S<br />
Iimr (mr)<br />
Figure 1L Crarh pulaea lor Hyundal ExcBl 25 mph vs. gE mph t6st$.<br />
.r<br />
C|<br />
C o<br />
g<br />
.l<br />
It,<br />
o<br />
{<br />
t5 tm<br />
fimr (mr)<br />
Toyott Cclicr Fill ftoaul 28 lllph ot, 35 lllllh Tuyotn Ccllct Helf offtc| 28 nyh or. 35 ;p[<br />
r ?S r?rph<br />
r J$ mpn<br />
It<br />
lr a<br />
f<br />
li<br />
t;<br />
I<br />
l<br />
,<br />
TT<br />
I.<br />
E<br />
o -r0<br />
7t t00 r75 25 t5 t00<br />
finr (mr)<br />
Flgure 20. Crash pulses for Toyota Cellca 25 mph vs. 35 mph t$ts.<br />
tirnc (mr)<br />
t<br />
o<br />
o<br />
t<br />
I<br />
()<br />
u -<br />
{<br />
- 25 trph<br />
I JJ nptr<br />
i\<br />
I<br />
I<br />
I<br />
t t<br />
/l t<br />
/;<br />
I<br />
a<br />
I<br />
,<br />
I<br />
r25<br />
aallrt<br />
t25 t50 r15<br />
\
7<br />
llyundri frcrl lrll frenlrl Ei lpb rr, $S ntph Hyrndri Exccl llrll olfrct Ei rnph vr. 35 mph<br />
'ilo<br />
Dlrplocrmrnl (h)<br />
Flgurc 21. Forcc vc. crush plot$ lor Hyundal Excel 25 mph Yt. 35 mph le8t$.<br />
t0 J0<br />
Dlrplocrmrnl (ln)<br />
Toyotr Cclicr Full frontrl 25 mph w' S$ mph Toptr Cclicr Hrlf olbct ?5 mph vr. 35 mph<br />
Olrplocrmrnf (ln)<br />
Flgurc 22. Forcc vr. crush plots tor Toyot! Cellca 25 mPh vs. 35 mph tt8ts.<br />
370<br />
r00<br />
t0<br />
0<br />
r lt 6jrft<br />
r ,Lmdr<br />
I<br />
90<br />
a<br />
t<br />
t0<br />
f<br />
t<br />
l<br />
Ero<br />
I<br />
I<br />
o<br />
I<br />
s60<br />
350 o .'n<br />
,<br />
E.o<br />
o<br />
rr ir<br />
J{)<br />
it 20<br />
il0<br />
t00<br />
90<br />
t0<br />
a<br />
lro<br />
f<br />
o<br />
F60<br />
*io<br />
t<br />
g { 0<br />
o<br />
lr<br />
Jo<br />
20<br />
t0<br />
0<br />
- 25 flUh<br />
r Ji rilfh<br />
I<br />
I<br />
I<br />
I t<br />
rll<br />
a l<br />
I<br />
t ;<br />
t ;<br />
t :<br />
\ \ ;<br />
l1<br />
t l<br />
t l<br />
trt<br />
I<br />
I<br />
I<br />
I<br />
I<br />
I<br />
I<br />
f<br />
I<br />
I<br />
a<br />
I<br />
a<br />
I<br />
E CIoco<br />
= J<br />
a<br />
It<br />
o<br />
b<br />
t<br />
r0<br />
00<br />
90<br />
80<br />
r0<br />
€o<br />
ll0<br />
t00<br />
90<br />
80<br />
E n<br />
J<br />
o o 6 0<br />
g<br />
gio<br />
! o<br />
d<br />
l* Jo<br />
20<br />
* 25 mplr<br />
r Jg lrtph<br />
- !$ mph<br />
r J5 mptt<br />
t<br />
It<br />
l r<br />
1 1 -<br />
I t l r<br />
f t t<br />
! n<br />
,'Fl \<br />
20<br />
t<br />
I<br />
I I r<br />
'aatt<br />
a<br />
; r<br />
I t t<br />
t l<br />
t r<br />
: i<br />
c ; t<br />
l,^4<br />
0lrplomrnrnf (ln)<br />
i<br />
I<br />
I<br />
I<br />
I<br />
I<br />
a<br />
,<br />
l r<br />
l i<br />
t ; l_ _ __ _^.
.d<br />
{'"*<br />
.'Ff<br />
.-*f<br />
;--"<br />
I<br />
Jd<br />
E*cd FUII Frontd 15 lrph u.1, ZE nph Exccl Hr,$ Offtct 35 mph u,t. 25 mph<br />
"Sf<br />
-dtt<br />
0<br />
H tr$ rvrfh<br />
r 25 fieft<br />
r<br />
,rir,<br />
0 5 r 0 r $ 2 0 e 5 J 0 I J r0 t3 20 25<br />
Olrplommral (ln)<br />
Dlrplocrmrnt (ln)<br />
Flgure 23. Energy Abmrptlon by lmpact yrloclty for the Hyundal Ercel.<br />
rd<br />
rtdf<br />
Cclice Fu/l Erontd tE mph ot, 25 mph EcIIca Half Offrct 35 mph ot, 25 mph<br />
t-df<br />
He<br />
;"df<br />
e<br />
Jd<br />
.df<br />
-df<br />
- Jg 6pl<br />
- 23 ttplr<br />
tt<br />
0 5 t o r 5 ? o 2 t t J 0 J 5 r0 15 20 25<br />
Dlrplocrmrnl (la)<br />
Flgurc 84. Encrgy rbrorptlon by lmprct veloclty for thr Toyotr Gellcr.<br />
r--P<br />
.tof<br />
tt-f<br />
f,"-*<br />
:df<br />
g<br />
;d<br />
"dtr<br />
"df<br />
.df<br />
..dP<br />
'"-f<br />
f,,e<br />
:*P<br />
E<br />
;d<br />
.dtr<br />
"*F<br />
- JS mfrlr<br />
-t 2i nplr<br />
- J$ ;6p1<br />
r ?5 nrpfr<br />
7o<br />
a<br />
o<br />
rl<br />
I<br />
Olrplmrnrnt (ln)<br />
J5
Having discussed and compared the frontal structure, we<br />
will go on to explore the differences in occupant injury<br />
between the Hyundai Excel and the Toyota Celica in these<br />
eight tests.<br />
Occupant Injury Data<br />
An unrestrained 50th percentile male Hybrid III dummy<br />
was used in the driver position in all eight tests. To facilitate<br />
better camera coverage of the driver dummy's interaction<br />
with the steering assembly, no dummy was used in the right<br />
front seat position. Table 5 $ummarizes the occupant injury<br />
data recorded by electronic instrumentation and the<br />
laceration index (LI). Analysis of data from test films is<br />
presented in Section IV.<br />
Table 5. Occupant lnlury data.<br />
rest H,c EEll' i8?tl'li8f,i [FEl EEg: Lr<br />
FFES H<br />
ot-<br />
FFAS T<br />
ot<br />
FF35 H<br />
ot<br />
FF3 6oT<br />
HOES H<br />
9t<br />
HO25 T<br />
ot<br />
HO35 H<br />
ot<br />
HO35or<br />
r tl dnd te rFG dlven for I<br />
unltE: Loadr lF DouEdt<br />
DlcDIrccfrint ln lnchar<br />
Tlnb (t) ln nlltlrecgnds<br />
Lrccrdtlon IndGx (LI, lt unltliil<br />
The Head Injury Criterion (HIC) was calculated from the<br />
resultant of the three central accelerometers in a nineaccelerometer<br />
array. The maximum chest g's is the<br />
maximum acceleration of the torso which has duration<br />
greater than three milliseconds. Maximum femur load,<br />
shown in table 4, is the maximum axial compressive forcu in<br />
pounds measured by the femur load cell. The maximum<br />
abdominal displacement is calculated from data measured<br />
by a pressure transducer in the Hybrid III. The conversion<br />
formula between pressure in pounds per square inch (x) and<br />
displacement in inches (D) for the abdominal insert used in<br />
this dummy is:<br />
D = (0.00047288x5 - 0.02616x4 + 0.53471x3<br />
- 5.0362x2 + 26.981x + 5.31)125.4.<br />
Positive chest displacement is recorded by a<br />
potentiometer when a plate at the front of the chest is<br />
displaced toward the spine. The maximum displacement is<br />
shown in table 4 in inches.<br />
The laceration index is a comparative measure of<br />
laceration and abrasion of the face and scalp of the<br />
occupant. It is based on the number, length and depth ofcuts<br />
made, during the crash, in two layers of chamois fitted over<br />
the face and the top of the head of the dummy. An LI of I<br />
indicates that there were abra$ions to the outer chamois, but<br />
no penetrating lacerations.<br />
312<br />
1451<br />
BE: tE<br />
,111,<br />
66.25<br />
I 424<br />
74. r8<br />
a9-9?<br />
ll?2"'<br />
65 .47<br />
9lo<br />
?[i16"<br />
469<br />
t3.47<br />
toz, oo<br />
IB55<br />
t3:i6<br />
18llo<br />
92.77<br />
54.5<br />
49.1<br />
78.2<br />
lo5. a<br />
44. O<br />
45. O<br />
6+. O<br />
69. O<br />
r67 r<br />
r 039<br />
e5a3<br />
e3 t6<br />
l5l I<br />
103r<br />
2920<br />
1550<br />
l20a<br />
1463<br />
1676<br />
1409<br />
l20t<br />
I 65i<br />
I 796<br />
z.za<br />
90. o<br />
Eolt<br />
1 .69<br />
s3.77<br />
b16'<br />
1.93 Er?8. at.7e<br />
ioSlaz<br />
1.74<br />
97.72<br />
2.45<br />
79.27<br />
2.05<br />
95-25<br />
t.7l<br />
79 .95<br />
&r?tu<br />
ti?B'<br />
I .45<br />
99.07<br />
r.12<br />
65.97<br />
1 .17<br />
7J.tZ,<br />
1.00<br />
8, 29<br />
1. OO<br />
7.78<br />
r.oo<br />
4. 59<br />
l. oo<br />
3. 90<br />
The parts of the body most affected by the steering<br />
assembly are the head and chest. We begin the discussion of<br />
occupant data with those indicating head injury. From table<br />
5 one can see that, in general, the driver of the Toyota<br />
experiences a considerably lower HIC than the driver of the<br />
Hyundai. Also note that the laceration index for the Toyota<br />
driver is always quite high, while the LI for the Hyundai<br />
driver is never greater than I (abrasions only). This would<br />
seem to indicate that head injury to the Toyota driver results<br />
primarily from contact with the windshield while the<br />
Hyundai driver seldom hits the windshield; his injuries are<br />
caused by hitting something harder, the instrument panel, or<br />
steering wheel hub. The one exception to this is the HIC of<br />
1586 for the Toyota driver in the 35 mph full frontal test'<br />
This is borne out in the film analysis and the exception<br />
explained in the next section.<br />
Two observations predominate when looking at the<br />
maximum chest accelerations reported in table 5. With such<br />
similar crash pulses we could expect that since the Hyundai<br />
driver had a higher chest acceleration that the Toyota driver<br />
at 25 mph, the same would be true at 35 mph. However,<br />
quite the oppo$ite was recorded. In fact, the increase in three<br />
millisecond clip chest acceleration for the Toyota driver<br />
from the ?5 mph test to the 35 mph test is extremely out of<br />
line with the increase for the Hyundai driver. This points to a<br />
difference in the function of some part of the Toyota interior<br />
at the higher speed. The second oddity is that while the chest<br />
acceleration decreases in the half offset mode in both cars at<br />
25 mph, at 35 mph the chest g's for the Hyundai driver are<br />
greater than in the full frontal mode but the Toyota driver's<br />
chest acceleration is greatly reduced from the full frontal<br />
case. To adequately explain these seemingly incongruous<br />
data we must rely on analysis of high speed films of the tests<br />
to detail the kinematics of the dummy and vehicle interior<br />
surfaces and supplement what is known from electronic<br />
instrumentation.<br />
Occupant Kinematics<br />
Film motion analysis was conducted to determine<br />
kinematics of the dummy and its interaction with the<br />
steering assembly, instrument panel, windshield and other<br />
interior components. Figures 25 through 32 show the<br />
relative positions of the dummy and steering wheel/interior<br />
for the drivers at important times throughout the eYent. A<br />
summary of the dummy kinematics is presented in table 6.<br />
Relative velocities between the dummy and struck<br />
surface at contact time (known as "contact velocity") were<br />
evaluated as one of the parameters affecting occupant<br />
injury. Contact velocity was determined by adding the<br />
Table 6. Summary of drlver dummy klnematlcs.<br />
chcrt/iub<br />
H.rd/rln<br />
Hc.d/I. P.<br />
6'l<br />
8a<br />
Evint Tlffi - ill ll lracondr<br />
-H FFti-fl FF25-T FF35-T HO25-[ Ho3r-f, rcUr-T XOrt-T<br />
58<br />
50<br />
,1<br />
64<br />
69<br />
al<br />
at<br />
5l<br />
6l<br />
t1<br />
77<br />
73<br />
89<br />
67<br />
undctchlnad<br />
58<br />
57<br />
la<br />
f4<br />
73<br />
t3<br />
66<br />
55
ftdcrrn sontrott rlt 0 EBr? rr<br />
r l r e c S l<br />
Flgure 25. Dummy klnematlc plote of llyundal 2$ mph lull frontal.<br />
chln oantrotr rln rt t3.6 rr<br />
chmt cmtrctr hub rt E{.9 nr l,lorr controtr inrtrunrnt prrrl rt !t.G rr<br />
ec<br />
gl<br />
373
*aolrt cqrtrotr rir rt El.E n<br />
Elrtn ccrt*tr tcp of *rrl rt E8,t r<br />
I r r i l i l l { l<br />
Flgure 26. Dummy klnematlc plota ol Hyundal 35 mph full frontal.<br />
374<br />
Ehrrt cqrtrtr lrrb rt E.l.E rr<br />
Hrn ntrtr lrrtrurrrt prml rt ?4.1 rr
Sdorn contetr nln rt 68,e rl<br />
chln cont.rotr rh rt GrrB r.<br />
/q<br />
r r r t t S r a c<br />
FlgurcZ7. Dummy lrlnomstlc plots of Toyots ZS mph full frontal.<br />
cll|rt srtrctr lrJb rt f,l.E rr<br />
Ehir hltr upprr IPz h.rd cFrekd tt 6r.i
c<br />
RFdiln ca*,str rlr rt El.E m<br />
Figure 28. Dummy klnematic plots ot Toyota 35 mph full frontal'<br />
376<br />
Ohrrt/chln srrtrot rlr rt Gc.t rr<br />
ee !t<br />
H,rck controtr rln rt ??.a ilr
Hilr| srtrtr rl&fird art|ctr r/r rt n.l il. chln eentrotr rlr rt ?t.t rr<br />
Clrt cantmtr lrrE rt tt.l r mr contttr lnrtnnat Frtl rt Cg.O il<br />
r l r l l a r<br />
Flgure 29. Dummy klnematlc plot$ ot Hyundal 25 mph half offrst.
fSdoffi c*rtrcEr rir rt tlf.l rr<br />
Chrrt eoatrctr hub rt F?.t rr<br />
Flgure 30. Dummy klnematic plots of Hyundal 35 mPh half oflsot.<br />
378<br />
Chin oontrctr rir rt EG,E rr<br />
)hrd cmtrotr lnrtnrrnt prrrl rt ?4.1 rr
t<br />
filtln cflrtstr rir rt CC. l rr Ehin eontrstr rh rt ?t.i rr<br />
chrrt eqrtrtr lr.S rt ?tt.t rr l|rd srt*tr lnrtnnnt Frrrl, rt Bi!.9 rrr<br />
Flgure 31. Dummy klnematlc plots ot Toyote 25 mph hall oftsct.<br />
379
Sdsm lartrotr rh rt EB.? rr Hrrd Edrtrctr rln rt EE.l r.<br />
b)<br />
-{-d {<br />
jv<br />
*/,"<br />
0hrrt ccrtrctr hrb rt ll.t rr<br />
./,,<br />
Flgure 32. Dummy klnematlc plots of Toyota 3$ mph half otfeet.<br />
380<br />
lhrd rtrlku rlndrtrirld rt ll.3 rr
velocity, at the time of chest contact, of an unrestrained one<br />
mass object (relative to the compartment) to the film<br />
determined velocity of the column. Figures 33 through 36<br />
are the contact velocity curves derived from the crash pulses<br />
of the eight crash tests and table 7 summarizes the steering<br />
column film analysis results. The resulting total contact<br />
velocities are shown in table 8. This method of determining<br />
contact velocity wa$ chosen since film analysis distortion<br />
effor was unavoidable with a wide angle lens used on the onboard<br />
camera. Additionally, the dummy's shoulder or chest<br />
target was not always clearly visible in the views of the offboard<br />
camera$, precluding their use for all tests.<br />
Comparisons are also shown in table 8 between contact<br />
velocities obtained using this method and contact velocities<br />
from film analysis only for the full frontal tests. There is<br />
generally very good agreement. Another use of the contact<br />
velocity derived from the crash pulse is to quantify the crash<br />
pulse differences for the specific contact times observed for<br />
the drivers in this test series.<br />
The first set of tests analyzed are the full frontal te$ts at<br />
the 25 mph crash speed. Figures 25 and ?7 show the dummy<br />
kinematics in these tests. For the Hyundai full frontal test at<br />
25 mph, the che$t to hub contact velocity, from table 8, is<br />
24.5 mph (including 2.4 mph rearward velocity of the<br />
steering assembly) at 65 milliseconds. There was 2.0 inches<br />
of rearward dynamic intrusion before the dummy contacted<br />
the wheel and the column/wheel began absorbing energy by<br />
stroking. ln the Toyota, contact velocity was 25.8 mph at 64<br />
milliseconds. There was a very small horizontal velocity<br />
component of intrusion of 0.2 mph and a correspondingly<br />
small horizontal intrusion component of 0.2 inches. Contact<br />
velocity fpr the Toyota compares reasonably well, though<br />
slightly higher, with that calculated for the Hyundai, despite<br />
Hytrl.dtl Erccl 25 tsph Ftll ftanltl<br />
f EJO<br />
lr<br />
E<br />
!ro<br />
|t<br />
t Goro<br />
fl -.rlfl lilr iliH dr lhl h<br />
1$<br />
1$<br />
f rP + 0 ro f, frdrrorf<br />
Gantoc,t tlmr (rnrl<br />
? a<br />
g E<br />
s ;<br />
C E<br />
s 3<br />
€ E<br />
f t ,<br />
E €<br />
F O<br />
Flgure 33. Contact veloclty snd tr8vsl cuiyaa lor ?5 mph lull frontal teslE'<br />
t0<br />
the intrusion difference, since the intrusion in the Hyundai<br />
caused earlier contact than would have been expected<br />
otherwise.<br />
In the Toyota the three millisecond clipped chest<br />
acceleration was 49.1 g's, compared to 54.5 g's in the<br />
Hyundai at 25 mph. This shows that one should not<br />
conclude from the Hyundai and Toyota 25 mph tests that<br />
lower contact velocity caused by intrusion is desirable for<br />
improved occupant re$pon$e. Though the response<br />
difference is not large, it is especially significant in light of<br />
the fact that the Hyundai column stroked more than the<br />
Toyota's, see summary of post-test column measureflents<br />
in tabl€ 9. Therefore, steering assembly intrusion may<br />
adversely affect dummy response during dummy ride down<br />
and after the initial impulse is imparted to the dummy<br />
through the wheel.<br />
The next set oftests analyzed are the full frontal tests at 35<br />
mph. Figures 26 and 28 show the dummy kinematics in<br />
these tests. For the Hyundai test, the contact velocity is 30.7<br />
mph (including 3.6 mph horizontal velocity of the steering<br />
column and 3.0 inches dynamic intrusion). Chest contact<br />
occurred in the Hyundai crash test at 58 milliseconds.<br />
Contact velocity for the Toyota was 30.1 mph at 6l<br />
milliseconds. There was a very small horizontal velocity<br />
component of intrusion of 1.3 mph for the Toyota. These<br />
velocities, like the 25 mph test also compare reasonably<br />
well with one another. Part of the reason for the similarity in<br />
total contact velocity, from table 8, despite much higher<br />
intrusion velocity in the Hyundai is that contact occurred<br />
slightly earlier in the Hyundai due to the intrusion, as<br />
compared to the Toyota. Therefore, contact velocity was<br />
unchanged in this case by intrusion, but the column may<br />
have still been accelerating toward the dummy afterconlact.<br />
Toyota Cclica 25 mph Full fiontal<br />
rhd a|.iad llil ilr.lrt rl; lflrlE ltr<br />
o 1$ 1o f 1p + f to f, frfr.orf<br />
Gonloct ltmr (mr)<br />
c<br />
a0 ii<br />
I |,Eo<br />
E<br />
a<br />
2 0 i<br />
381
Hynndoi Exccl 35 mph FulI ftontnl Tulota Cclica 35 mph Full ftontal<br />
E oE,lo<br />
:=<br />
! !zo<br />
r,<br />
o<br />
C<br />
o<br />
oto<br />
acHl flril$f llftf miltfl rlllt 4fltd lia<br />
i /<br />
t /<br />
V I<br />
JO<br />
20<br />
? f<br />
g E<br />
a *<br />
9 F<br />
! 8<br />
# !<br />
EE<br />
(J<br />
s rs +o f P f p 0<br />
10 f f .d+c.+s<br />
I0<br />
10 1o f ls + S ro f frdrr0rf<br />
Gonlocl llmr (mr)<br />
Flgure 34. Contact veloclty and travel cury€a for 35 mph full frontal tests.<br />
Gonlocl ttmr (mr)<br />
Hyundel Excal 25 mph Helf offtcl Tuyote Cclicn 25 mph Half offrct<br />
E o'<br />
Ero<br />
tr<br />
ii<br />
g<br />
t20<br />
(r<br />
o<br />
C<br />
o(Jro<br />
0<br />
$ r$ r0 f P + S r0 f Srd.,r0.1s I0<br />
rs 10 f S f $'t0 f eplqp.rogo<br />
Contoct tlmr (mr)<br />
Flgure 35. Contact velocity f,nd travol curve$ lor 25 mph half offset teste.<br />
382<br />
ro<br />
s3<br />
! r<br />
! E<br />
f;E<br />
f o<br />
E €<br />
F o<br />
o<br />
st!ill railoal tn rnartaa r|l -dHrl h<br />
rtfl Glild lfr frtfl rllr rHail hr cltd rd.rlfif llta [tt- rl] rlodrd hr<br />
| , /<br />
Conlocl llmc (ma)<br />
VI<br />
60<br />
50<br />
+0<br />
JO<br />
20<br />
r0<br />
0<br />
60<br />
50<br />
+0<br />
JO<br />
20<br />
t0<br />
5<br />
a()<br />
E<br />
o<br />
t<br />
E<br />
a '<br />
o<br />
F<br />
C<br />
o<br />
t,<br />
c ol'<br />
E<br />
a t<br />
0
I cE<br />
= t|o<br />
t<br />
u<br />
E Co<br />
(J<br />
Hyandd Excel tE nph Half offttt Toyote Ccllca 35 mph Helf olfsct<br />
JO<br />
20<br />
t0<br />
ilH *rhd lh fifta dti rH|d h<br />
oroffPfC$f,drdtrorf<br />
Gonl'oci lfmr (mr)<br />
{0<br />
JO<br />
20<br />
t0<br />
0<br />
s 3"<br />
E +<br />
€-E<br />
€ ieo<br />
a Llr<br />
E €<br />
F o<br />
0ro<br />
Flgure 36. Contact veloclty and travsl currra for 35 mph half offeet tests.<br />
60<br />
lCtil ailhfl tna tiadt.. rll a|.hd tr<br />
0 1o 1o f tp f 1p 10 f f .d+o*f<br />
Gonlocf ttmr (rnr)<br />
50<br />
C<br />
.o+<br />
I<br />
r,<br />
C<br />
1 6 g<br />
E<br />
-<br />
2 0 8<br />
t0<br />
0<br />
383
Table 7. Steering column <strong>Int</strong>rusion measurements from fllm<br />
analysls.<br />
t'1E3. '<br />
FF'E<br />
HO2E<br />
boS6<br />
.l,r#-e; .:ssl *<br />
z -o<br />
,2<br />
3-'<br />
65<br />
o.a<br />
70<br />
li5<br />
l.a<br />
,2<br />
t.,<br />
63<br />
8;'<br />
le6<br />
to'<br />
6.6<br />
4A<br />
1.5<br />
loro<br />
ts'<br />
le"<br />
-9t'*<br />
E.2l<br />
36 -3<br />
(ln)<br />
iHF<br />
(ln)<br />
'-<br />
(roh)<br />
vcon<br />
(ilDh)<br />
60 I+' Er'<br />
167 8ot lr3<br />
9f 8tt"<br />
9re<br />
l.l<br />
6l<br />
2.1<br />
65<br />
o.6<br />
66<br />
Ir rtForrnc<br />
Tsble 8. Che$t contact and velocity summary'<br />
T?'<br />
frt"<br />
9ta$<br />
o.f<br />
65<br />
:- t8fillTllSf,l"s, not utid to c@putc totrl<br />
Table 9. Summary of steerlng column pre' and post'tsst<br />
measuremsnt$.<br />
TEAT<br />
FfiB:T t8 tt lo<br />
FFIE-T<br />
FFIE-r i8 t8 l:l<br />
tsoaE-H<br />
xo35-H N8 t3 it<br />
HOEE-T<br />
totE-T t8<br />
Etl.EiE r ' "r<br />
21<br />
z9 9 t:ts<br />
As previously pointed out, one should not use this to<br />
conclude that it is better to contact the wheel early to reduce<br />
the contact velocity because the effects of the wheel motion<br />
can still affect the dummy after initial contact.<br />
In looking at dummy response for the 35 mph Toyota test'<br />
parameters other than intrusion and contact velocity appear<br />
to dominate. The chest acceleration in the Toyota was<br />
unexpectedly high at 105.8 g's. Not only was this much<br />
higher than the 78.2 g's in the Hyundai test, but it was also<br />
disproportionately higher than the 49.1 g value seen in the<br />
lower speed Toyota test. Examination of the post-test<br />
measurements reveals that the Toyota steering assembly<br />
$rroked 2.4" at ?5 mph but only stroked 1.9" at 35 mph and<br />
the Toyota column stroked less than the Hyundai at both<br />
speeds, see table 9. This difference in stroke between the<br />
two Toyota tests is percentage-wise higher than that for the<br />
two Hyundai tests, which measurcd 2.7 inches and 2.2<br />
inches for the 25 and 35 mph tests, respectively. The posttest<br />
measurement of the steering column angle also shows a<br />
significant difference in the Toyota and Hyundai column<br />
behavior. The column angle for the Toyota did not change at<br />
all at 25 mph, but changed 14 degrees toward the vertical at<br />
35 mph. This large angle change creates the additional<br />
problem ofreducing the horizontal component ofthe stroke,<br />
making the column less effective in absorbing the<br />
horizontal component of the occupant's motion.<br />
Additionally, as the column angle changes the lower rim of<br />
the wheel comes in contact with the dummy's chest or<br />
abdomen at an increased velocity and force. Since no<br />
significant increase in abdominal displacement was noted,<br />
see table 5, it can be deduced that the relatively stiffToyota<br />
384<br />
IEST ilO, FF25H FFI6H FFZsI FF35I f,dzsH HO35H HOZ6T HO35T<br />
ch$t Contrct<br />
Tlna (hr)<br />
chart TFavcl<br />
Dl rtrnca (l nt<br />
[!ftEtt'$il . t.onr<br />
FllI lhtly6lt<br />
Contrct Vil. (Dph)<br />
illP"li!l'i't"or,r<br />
Totrl Contact<br />
Vrloc{ty (mphl<br />
65 5A<br />
lo. I lt<br />
2e. I E7 -L<br />
22.4 2.1.2<br />
2.4 3.5<br />
e{.8 to.7<br />
64 6l<br />
lr,9 12. r<br />
2s.6 2A.A<br />
26,6 29<br />
0.e 1,3<br />
e5.8 30, r<br />
77 sA<br />
t0,6 6, f<br />
z2,u rE.9<br />
-0.5*r 5,f<br />
22.9 21.L<br />
?4 66<br />
r t.4 10,8<br />
e3.0 27.1<br />
0.2 0.6<br />
?i.2 27.9<br />
three-spoke wheel significantly loaded the chest in this test'<br />
It is also important to note in this test that there is very little,<br />
0.8 inches, vertical intrusion in the Toyota at 35 mph' The<br />
large change in the angle of the Toyota column appears to be<br />
due to a non-axial load applied at the base of the steering<br />
column by the steering rack, which was forced rearward by<br />
the engine and structural supports intruding the floorpan'<br />
Additional film analysis was used to detemline that the total<br />
dummy motion (including stroke of the dummy's chest) was<br />
only 9.2 inches at 35 mph compared to ll.8 inches at 25<br />
mph. It was concluded that the large change in the column<br />
angle precluded axial stroke and did not allow for energy<br />
absorption in the non-axial loading direction. Also the front<br />
end of the column shaft was rigidly fixed or possibly moved<br />
by an intruding steering rack. This phenomenon explains<br />
the excessively high chest acceleration.<br />
Behavior of the Hyundai column was also investigated'<br />
The stroke of the column in the 35 mph test was 2.? inches<br />
and the stroke in the 25 mph test was 2.7 inches. This<br />
indicates that the column did not perform as well at 35 mph'<br />
The cause of this reduced column stroke appears to be<br />
inversely related to the angle change of the steering column<br />
during the test. The post-test measurements of column angle<br />
change along with the stroke distance of the column is<br />
summarized in table 9. The finding that stroke distance and<br />
angle change are inversely related is quite logical since<br />
dummy inertial loads are predominantly horizontal and any<br />
angle change of the column away from the horizontal will<br />
naturally reduce the applied force component along the axis<br />
of the column. Additionally, increasing the angle of the<br />
column with respect to the horizontal creates a larger<br />
component of force perpendicular to the column axis,<br />
resulting in proportionally higher f'riction forces along the<br />
column axis which further resist column stroke.<br />
Another aspect of the intrusion, which had a significant<br />
effect on head acceleration, was the vertical component of<br />
intrusion in the Hyundai (table 7).In the 35 mph impact, the<br />
instrument panel moved approximately 4.5 inches upward<br />
at 74 milliseconds. At 25 mph, the instrument panel moved<br />
1.7 inches upward at 82 milliseconds. These motions were<br />
significant to note because the dummy's nose squarely<br />
struck the instrument panel at these times. Had the intrusion<br />
not occurred, the dummy's head may have struck the<br />
windshield, receiving a lower HIC (due to the lower<br />
breaking force of the windshield) and probably lacerated the<br />
face chamois. In the 25 mph impact the HIC measured l45l<br />
compared to 1424 in the 35 mph impact. The proximity of<br />
these two measurements, in spite of different crash speeds,<br />
can be accounted for by the fact that the instrument panel in<br />
the higher speed test broke up before the dummy's head<br />
struck it, thus limiting the concussive force to the head.<br />
This vertical intrusion may have also affected the dummy<br />
chest response. When the wheel and column are thrust<br />
upward, the forces between the dummy and the wheel are<br />
transmitted in a more axial direction along the column.<br />
Furthermore, if the column is loaded at the bottom of the<br />
shaft from the intruding firewall, engine, steering rack, etc.,
then these intruding forces may be absorbed from the<br />
column stroke rather than being tran$mitted directly to the<br />
driver. It should be noted that this phenomenon is beneflrcial<br />
for absorbing intrusion forces only if the column is not fully<br />
stroked.<br />
Occupant kinematics were next evaluated for the offset<br />
tests by film analysis and by using the crash pulse to obtain<br />
the contact velocities. The first comparison is between the<br />
Hyundai and Toyota in the 25 mph test. Film analysis of the<br />
Hyundai (see figures 29 and 30) shows that the dummy's<br />
first torso contact with the wheel is the abdomen to the lower<br />
rim at approximately 67 milliseconds. Next, the chest<br />
contacts the hub at 77 milliseconds. Analysis from the<br />
overhead camera shows that no significant rotation (less<br />
than I.5 degrees counterclockwise) of the occupant<br />
compartment and very little lateral motion (about 2.0 inches<br />
to the right) have occurred by this time. The effect of the<br />
lateral motion is significant because the dummy hits the<br />
wheel a similar distance to the left of the wheel's center axis.<br />
This causes the chest to load the column non-axially, which<br />
causer; the stroking mechanism to perform poorly and the<br />
rim to act as a principal energy absorber for the thorax. This<br />
motion was observed to be similar for all half barrier tests<br />
conducted in this series as well as for previously conducted<br />
car-to-car offset tests.<br />
From the Hyundai crash pulse, the contact velocity was<br />
calculated to be 22.9 mph (see table 8) between the chest<br />
and hub. There was no additional intrusion velocity in this<br />
test and apparently the column had already started to stroke<br />
since the column velocity was measured to be -0,5 mph<br />
(away from the occupant). The chest 3 millisecond clipped<br />
acceleration was 44 g's. This acceleration is lower than the<br />
25 mph full frontal Hyundai acceleration, because of the<br />
non-axial loading of the hub. Therefore, the softer wheel<br />
provides a better stroking force at 25 mph than the column.<br />
In the Toyota crash test, the contact velocity was<br />
calculated to be 23 mph at the measured contact time of 74<br />
milliseconds. A very small intrusion velocity of 0,2 mph<br />
was recorded from film analysis, making the total contact<br />
velocity 23.2 mph. The three millisecond clipped chest<br />
acceleration is 45 g's. This figure is consistent with that<br />
obtained in the Hyundai test. It also appears to be in<br />
agreement with the dummy acceleration of 49.1 g's<br />
measured in the Toyota full ftontal test which, though<br />
slightly higher, can be explained by a slightly higher contact<br />
velocity of 25.8 mph. It appears that even though this<br />
vehicle also translated to the right like the Hyundai, its<br />
movement was slightly less at 74 milliseconds, measuring<br />
only 1.3 inches by overhead film analysis. This combined<br />
with a wider diameter steering wheel hub in the Toyota, see<br />
photographs of wheels in figure 37, allowed the column<br />
rather than the wheel rim to effectively restrain the<br />
dummy's torso. Comparison of the dummy's abdominal<br />
deflection showed remarkable similarity; L75" for the<br />
Hyundai and l.l4'for the Toyota, see table 5.<br />
Next, the 35 mph half offset tests were compared for chest<br />
response. Dummy kinematic plots for these te$t$ are shown<br />
Hwndd Sl€.rlng Wh€€l<br />
Toyob $tr.r|ng Who.l<br />
Flgure 37. Photographs of tteerlng wheels removed from both<br />
test v€hlcle8,<br />
in figures 30 and 32. The Hyundai driver dummy had an 84 g<br />
chest acceleration clipped value while the Toyota dummy<br />
had only a 69 g's, 3 millisecond clipped acceleration value.<br />
Examination of the contact velocity shows that the Toyota<br />
driver contacted the steering wheel at 27.9 mph (including<br />
.6 mph intrusion velocity), while the Hyundai driver<br />
contacted the wheel hub at only 24.1 mph (including 5.2<br />
mph intrusion velocity). The cause of the large difference in<br />
contact velocity can only partially be explained by crash<br />
pulse differences. Examination of contact velocity curves,<br />
figure 36, shows that contact velocity difference would only<br />
be 2 mph or less at the same contact time or spacing. Since<br />
the spacing was decreased by the intrusion in the Hyundai,<br />
contact occurred l6 milliseconds sooner. This fact accounts<br />
for the greatest difference in contact velocity, causing the<br />
Hyundai driver to make contact before the relative speed<br />
between the car and the dummy was allowed to increase to<br />
its maximum potential. However, since these relative<br />
motions are still occurring between the dummy and the car<br />
after the initial contact, forces and resulting accelerations<br />
are still being imparted to the dummy. Therefore, it must be<br />
concluded that the only explanation for the dummy<br />
response difference is intrusion while the dummy is in<br />
contact with the wheel. Further evidence to support this<br />
conclusion is the post-test measurements of steering column<br />
stroke which show that the Hvundai stroked more than the<br />
385
Toyota (1.9" versus 0.9" from table 9), apparently due to the<br />
intrusion rather than steering column performance<br />
differences.<br />
Head response comparisons are next discussed by car<br />
type since HIC appears to be a strong function of object<br />
struck and car design as well as crash severity. First the<br />
Hyundai was examined to explain the reason for relatively<br />
high HICs and the reason the head did not break the<br />
windshield in most cases. By film analysis it was<br />
determined that three out of four tests with the Hyundai had<br />
high HICs (142,t-1855) due to contact with the instrument<br />
panel lip. One exception was the case of the 25 mph offset<br />
test in which the HIC was only 910. The difference in this<br />
test was that no significant vertical intrusion of the<br />
instrument panel, only 0.1 inches, occurred. This allowed<br />
the dummy to engage the relatively soft windshield before<br />
hitting the less forgiving instrument panel. It is also<br />
interesting to note that, this is the only Hyundai windshield<br />
which cracked as a result of dummy head contact. In the<br />
other tests the vertical intrusion ranged from 1.4" to 3.7".<br />
Next the HICs of the Toyota driver dummies were<br />
investigated. The value from these tests ranged from 469 to<br />
1586. These values were consistent with crash severity,<br />
since the two low speed tests had a 664 and a 469 HIC value<br />
for the full frontal and the offset frontal, respectively. The<br />
corresponding values for the high speed tests were 1586 and<br />
1375, respectively. It was also noted that both dummies in<br />
the full frontal tests had higher HICs than those of dummies<br />
in matching offset tests. This is readily explainable since the<br />
full frontal crash pulses were of shorter duration, see figure<br />
14, and the dummy kinematics in the offset tests were such<br />
that the dummy struck the windshield/instrument panel<br />
away from the longitudinal centerline of the dummy's<br />
original position. This resulted in the dummy's head<br />
striking the instrument panel off-center where the distance<br />
from the instrument panel lip to the windshield is smaller<br />
allowing the dummy's head to strike the windshield before<br />
hitting the less forgiving instrument panel.<br />
The reason for the higher HICs in the higher speed Toyota<br />
te$ts was not just crash severity, but as previously<br />
mentioned, was more related to the object struck. At the<br />
lower energy levels, apparently the windshield was<br />
sufficient to attenuate the motion of the dummy. At the<br />
higher energy level of the 35 mph tests this was not the case.<br />
In this test the dummy's head slid down the relatively steep<br />
raked windshield and the chin struck the stiffer instrument<br />
panel.<br />
Steering Assemblies<br />
This section compares the steering assemblies for the two<br />
cars, including their mounting, intrusion protection and<br />
energy absorption design concepts. Each of the steering<br />
assemblies were unique in some way, each having some<br />
characteristics that would produce good occupant responses.<br />
No tear down was performed on the column$, so<br />
that specific energy absorbing mechanisms are unknown.<br />
For the high speed tests, the columns, mounting brackets,<br />
386<br />
etc. were removed from the vehicle after the post-test measurements<br />
were taken and were photographed.<br />
The first column investigated is the Toyota Celicacolumn<br />
shown in figure 38. These photographs show the wheel and<br />
column detached and a Toyota wheel/column from another<br />
Toyota which is attached to the mounting bracket. The design<br />
of the bracket appears to be very good for decoupling<br />
the intrusion for the column. It is designed to span the width<br />
of the car from A-post to A-post, such that the firewall may<br />
intrude some distance before contacting the column mount.<br />
Also, the lower column mount is relatively stiff so that when<br />
intrusion exceeds this value, which was not determinant due<br />
to complex geometry and uncertainties, it further resists<br />
intruding forces. The attachment of the column to the mount<br />
is fairly conventional with the bottom part of the column<br />
rigidly attached and a shear capsule mount at the upper end<br />
of the colurnn. The telescoping energy absorbing device is<br />
located between the two mounts. The steering rack is<br />
mounted directly to the firewall. One concern with this<br />
design is that the steering column mounting bracket has<br />
relatively low torsional stiffness, allowing large angle<br />
changes in the column when firewall intrusion forces the<br />
lower end of the column rearward. Another potential concern<br />
is that there is about a 5 inch portion of rigid column<br />
below the bottom mount and a shaft connected to the column<br />
by a U-joint. If this shaft were $horter or the coupling<br />
St66rlng Column Henrov6d from T€$t Vohlcl€<br />
$t6€dng Golufin Atlach6d to Moudtlng BreckEta<br />
Flgure 38. Toyota steerlng and mounting hardwale removed<br />
from teet vchlcle.
were flexible, there would probably be less chance of in-<br />
truding the lower end of this column.<br />
The othercolumn looked at is the Hyundai Excel column<br />
which is quite different in design. Figure 39 shows one view<br />
of the Hyundai steering column and wheel isolated and<br />
another view with the mount bracket. Upon close examina-<br />
tion it can be seen that both upper and lower mounts are<br />
shear type mounts with the shaft portion of the shear capsule<br />
attached to the column. It is also readily observed that the<br />
telescoping energy absorbing mechanism is at the boilom<br />
end of the column. The practical difference between this<br />
design and the Toyota's is that the column will absorb some<br />
energy, albeit a very small amount, proportionally, of the<br />
engine intruding as well as the dummy's forward energy.<br />
Thercfore we have two very differcnt design concepts. The<br />
Toyota resists intruding forces and the Hyundai attenuates<br />
the intrusion by limiting the forces that can be transmitted to<br />
the dummy. The other flspect of the Hyundai design is its<br />
mounting. This system of mounting fixes the mounting<br />
bracket directly to the upper firewall. The only other addi-<br />
St€erlng Column F€mov€d from Teft V€hlclc<br />
$rrarlng Column wtth ltoundftg Brfttrtt<br />
Flgura 39. Hyundal rteerlng End mountlng htrdwara rtmoved<br />
from tart yehlcle.<br />
tion to this mount is an angled support bar going from the<br />
A-pillar to the mounting bracket. It can only be speculated<br />
that the function of this bar is to prevent side intrusion since<br />
it does not appear to serve any function for frontal impact<br />
protection.<br />
The potential problem with the Hyundai design is that<br />
attenuation of intrusion is accomplished only by the one<br />
method just discussed. By mounting the column bracket<br />
directly to the firewall, motion of the column occurs even at<br />
low crash sevedty as $hown by this test series. Another<br />
concem with this type of design is that when the available<br />
stroke of the column is used, about 3 inches in the Hyundai,<br />
there is a direct link between the intruding component and<br />
the occupant. Another disadvantage in this steering system<br />
type is that the inertial weight of the moving part or srroking<br />
pofrion of the steering column could potentially be very<br />
high. However this was probably nonhe cflse as the weight<br />
of the Hyundai steering column and wheel was only ll.2<br />
pounds (4.06 pound wheel and 7.14 pound column) compared<br />
to the Toyota assembly which weighed 15.75 pounds<br />
(4.25 pound wheel and I1.5 pound column).<br />
The designs of the two wheels were also compared. The<br />
photographs<br />
in figure 37 show the Hyundai Z-spoke design<br />
and the Toyota 3-spoke design. Judging from occupant response<br />
and wheel deformation, the wheel of the Hyundai<br />
was apparently softer than that of the Toyota. The softer rim<br />
was advantageous for abdominal protection but was, in<br />
general, not useful for chest protection. One exception was<br />
the 35 mph Toyota full frontal test in which a sofr lower rim<br />
would have lihely reduced chest acceleration.<br />
Summary<br />
These tests provide a better understanding of the behavior<br />
of wheels and columns when subjected to a limited number<br />
of real-world type crashes in which intrusion and offset<br />
Ioading play a major role. It was observed that, as it affects<br />
occupant response, the difference in structural response<br />
between crash mode$ wa$ minor compared to the<br />
differences in intrusion and loading direction of the steering<br />
assembly. It was also determined from this test series that<br />
interior design, shape, material properties and intrusion of a<br />
specific car all work together, synergistically,<br />
to determine<br />
the occupant protection potential. Furthermore these<br />
parameters are dependent on crash pulse since it governs the<br />
contact times and point of impact. Contact time$ are very<br />
important since the relative velocity between the occupant<br />
and interior component changes as a function of time and<br />
the interior components may be moving due to intrusion<br />
thus changing the velocity or the component struck.<br />
387
Influence of Corrosion on the Passive Safety of Private Cars<br />
Written Only Paper<br />
Wolfgang Sievert, Ernst A. Pullwitt'<br />
Bundesanstalt Fiir Strassenwesen (BASI)<br />
(Federal Highway Research Institute)<br />
Dieter Wobben, Helmut Pfisterer'<br />
Rhein i sch-We stfiili scher Ti.iv Es sen (RWTUV )<br />
Abstract<br />
The objective of this study was to determine significant<br />
differences in the degree of initial damage resulting from<br />
corrosion and to assess the relevant influence of corrosion<br />
using vehicle-occupant loading criteria and test-vehicle<br />
damage and loading.<br />
The BASI and RWTUV Essen conducted a joint $tudy of<br />
three different vehicle types to determine the pattems of<br />
impact behaviour resulting from corrosion. An older vehicle<br />
with corrosion damage and a younger vehicle with as<br />
little damage as possible were examined and tested in the<br />
impact test.<br />
The frontal collision type was selected for the study. The<br />
vehicles with their different levels of upkeep revealed significant<br />
differences in both the corrosion level and in the<br />
results of the impact test.<br />
A comparison of the results obtained from the impact<br />
tests revealed that initial corrosion damage had resulted in<br />
an unacceptable reduction in occupant safety levels in a<br />
number of aspects. One aspect which is particularly worrying<br />
is the fact that many weak spots contributing to a reduction<br />
in occupant protection were discovered for those vehicles<br />
which had only suffered low levels of corrosion and<br />
which would therefore have been expected to react a$ new<br />
vehicles.<br />
One aspect of even graver consequence than the corrosion-related<br />
failure of vehicle components was the failure of<br />
the seat belts in two tests.<br />
<strong>Int</strong>roduction<br />
The passive safety of passenger cars which is aimed to<br />
protect vehicle occupants in the event of an accident is<br />
demonstrated by a series of tests conducted when obtaining<br />
approval for a new model. However, new vehicles make up<br />
only a small proportion of total vehicles on the road. The<br />
service life of a passenger car is currently over 10 years<br />
(Zl.l%a of the passenger cars on the road in the Federal<br />
Republic of Cermany in 1987 were more than l0 years old),<br />
while the average age for 1987 was 6.17 years. Age and<br />
performance can be assumed to bring about changes in<br />
vehicles which lead to their modified behaviour in<br />
accidents. Failure mechanisms and corrosion damage were<br />
observed in impact tests conducted at the BASI in another<br />
context and gave rise to this current project.<br />
During the course of its studies, the RWTUV determined<br />
a number of points with severe corrosion damage and<br />
388<br />
therefore considered it necessary to conduct an appropriate<br />
study. A newly developed test unit was used for this<br />
purpose.<br />
The two institutes selected the following types of<br />
vehicles, based on their experience: VW Golf I, type l7;<br />
Ford Fiesta: Daimler Benz W 123.<br />
For each of the vehicle types mentioned, one vehicle<br />
approx. l0 years old showing average corrosion damage for<br />
a vehicle of this age and a 6-year-old vehicle with as little<br />
corrosion damage as possible were examined and then<br />
subjected to impact testing.<br />
Objective of the Study<br />
The studies conducted were performed so as to allow<br />
significant differences resulting from differing degrees of<br />
initial corrosion damage on the basis of vehicle'occupant<br />
loading criteria and test-vehicle damage and loads.<br />
For this purpose, a corrosion test unit was first used to<br />
measure the corrosion damage of the vehicles employed in<br />
the study.<br />
The occupant loading criteria used for the assessment<br />
comply with ECE draft regulation 237 (Economic<br />
Commission of Europe) and take into account the headload<br />
(limit value HIC < 1000), the thoracic acceleration (limit<br />
value a.** E 60g) and the forces acting in the thighs (limit<br />
value F*"* < l0 kN). The pelvic acceleration (limit value<br />
ar*, { 80g) also served as an assessment variable in addition<br />
to the criteria laid down in this draft regulation. Relevant<br />
criteria for vehicle loading were drawn from ECE<br />
regulations Rl2, Rl4, R2l, R33 and R.237.<br />
Following evaluation of the corrosion results, the results<br />
of the impact test$ and the differences between vehicles<br />
with heavy corrosion and those with low corrosion levels, a<br />
test was to be performed to determine whether suitable<br />
measures needed to be introduced to improve the long-term<br />
effect ofpassive vehicle safety.<br />
Corrosion Study<br />
Selection of vehicles and test points<br />
Six passenger cars were selected for the project. Two<br />
vehicles were selected in each case from the same model<br />
(smaller modifications were possible) of manufacturers<br />
VW FORD and DAIMLER BENZ and formed a study pair.<br />
One vehicle of each pair showed only low levels of<br />
corrosion, if at all, and will be referred to below as having<br />
"low<br />
initial damage" (slightly conoded vehicle). The other<br />
vehicle, on the other hand, already showed clear signs of<br />
corrosion damage and will therefore be referred to as<br />
demonstrating "high initial damage" (heavily corroded<br />
vehicle).<br />
At least 50 test points were marked on each of the six<br />
vehicles. These points corresponded to the vehicle-specific<br />
weakpoints and to the body structures important for the<br />
introduction of forces into the vehicle in the event of a
frontal impact. A number of additional areas revealing signs<br />
of corrosion during the vehicle examinations were also<br />
included in the test.<br />
Studies conducted<br />
In order to obtain objective data on the extent of the<br />
corrosion, non-destructive testing was performed with a<br />
new test unit developed by RWTUV. This test instrument is<br />
a compact manual unit which functions on the inductive test<br />
principle. It makes use of the fact that the various conditions<br />
ofthe sheet steel ofthe car, e.g. intact steel sheet, corrosion,<br />
filler, thick coatings ofsurface-protection paint, have different<br />
electromagnetic properties. The test signal recorded<br />
with the probe is evaluated in a microcomputer on the basis<br />
of this "material effect", is allocated to a status class and is<br />
presented on a monitor in the form of a colour display.<br />
The following five colour allocations were used:<br />
I green; No or only very slight corrosion which is<br />
insufficient to impair ritability. The thickness of<br />
the paintwork or underseal protection is less than<br />
3mm.<br />
r green/red: Low to extensive corrosion.<br />
r red: Heavy to very heavy corrosion. Standard<br />
sheet can be easily destroyed by tools when this<br />
indication applies.<br />
r greenL/orange: Steel sheet intact, with an underseal<br />
coating of 3 to 6 mm.<br />
I orange: Steel sheet intact, with an underseal coating<br />
thicker than 6 mm er with corrosion holes<br />
repaired using filler (e.9. polyester).<br />
The test area was examined by positioning the probe of the<br />
test instrument at points in a l0 x l0 mm grid; the colour<br />
indication was transferred to a corresponding printed form.<br />
Results on vehicles with no or very slight<br />
corrosion<br />
These three newer vehicles revealed no visible signs of<br />
corrosion during the thorough visual inspection. The nondestructive<br />
test produced "green" indications almost exclusively.<br />
One exception was the DB W 123 where "red"<br />
indications indicated considerable corrosion in the area of<br />
the belt mounting point on the left-hand inside sill (despite<br />
no external sign of corrosion). This was also confirmed by<br />
mechanical means.<br />
In order to attain the conditions of a non-corroded vehicle<br />
for the pulpose of the comparative studies, a section was<br />
welded onto the vehicle before the crash test in order to<br />
make the mechanical stabilitv similar to that of a new<br />
vehicle.<br />
Results with heavily corroded vehicles<br />
The older vehicles revealed clear signs of corrosion over<br />
various areas during the visual inspection. These were examined<br />
and documented in greater detail during the subsequent<br />
non-destructive test.<br />
In order to allow a quick overview of the corrosion situation<br />
for each vehicle, a simplified classification into three<br />
categories was performed after the data had been recorded;<br />
r No or only very slight rusting (e.g. rust film).<br />
r Surface corrosion, also penetrating the sheet at<br />
individual points.<br />
. Very heavy corrosion, partially with cracks and<br />
holes.<br />
These findings were transferred to sketches of the relevant<br />
vehicle sections.<br />
Results on the Golf, 1977 model<br />
The following visible signs of corrosion were discovered:<br />
. Rusting in the engine chamber, A-pillar rusted<br />
through in places.<br />
r Slight rusting on one door.<br />
r Driver and front-passenger access areas rusted<br />
through in places.<br />
r Right-hand belt securing point rusted through.<br />
r Very heavy corrosion, including holes, in the passenger<br />
compartment at the seam between the floor<br />
panel and the inside sill.<br />
r Areas of corrosion on both sills.<br />
. Very heavy corrosion with underbody rusted<br />
through over a very large area behind the lefthand<br />
transverse link securing point.<br />
Results on the Fiesta, 1978 model<br />
The following visible signs of corrosion were discovered;<br />
. Engine chamber, left-hand side: heavy surface<br />
corrosion.<br />
r Slight rusting of the front-passenger door.<br />
r Relatively heavy surface corrosion in the area of<br />
the door sill.<br />
r Surface corrosion on both seat mounts,<br />
. Very heavy corrosion in the area of the door sill.<br />
. Very heavy corrosion on the underfloornext to the<br />
sill; very heavy corrosion at the jacking point,<br />
including holes in pans.<br />
Results on the Daimler Benz 200, 1976 model<br />
The following visible signs of corrosion were discovered:<br />
. Slight corrosion in the engine chamber.<br />
. Heavy corrosion on the driver's door.<br />
. Severe corrosion on the front-passenger's door,<br />
r Heavy corrosion in the area of the belt securing<br />
point.<br />
r Extensive surface corrosion of the seat mount in<br />
the passenger compartment.<br />
r Heavy surface corrosion with holes in the wheel<br />
house.<br />
r Slight corrosion of the sill in the floor area.<br />
389
Impaqt Tests<br />
The collision type selected for the test was a 0" frontal<br />
collision with an impact velocity of 50 km/h, figure 1. This<br />
collision type accounts for over 607o of accidents involving<br />
passenger cars. Due to its frequency and the high risk of<br />
injury with frontal impacts, this type of impact has more test<br />
specifications and criteria than any other and is a vital aspect<br />
of the type approval procedure (e.g. behaviour of steering<br />
system).<br />
Test configurfltion<br />
The vehicles were each equipped with a Hybrid ll50Vo<br />
male dummy in the front seats. Dummy positioning and<br />
recording of the test data were performed primarily in accordance<br />
with ECE draft regulation R.237. An exception<br />
was made with the DB W123, where the seat position selected<br />
was not the rearTnost position, but instead corresponded<br />
to the dummy's body size. Further test parameters<br />
were also taken from this draft or from regulation R33. The<br />
impact forces were measured with a dynamometric measuring<br />
wall in order to determine the changes in the front<br />
rigidity of the test vehicles. Figure I shows the individual<br />
elements of this measuring wall.<br />
Results of the impact tests<br />
The test results are $hown below so that, for each vehicle<br />
type examined, beginning with the VWColf, it is possible to<br />
draw a comparison between the two vehicles of the vehicle<br />
pair (vehicle with slight initial damage and vehicle with<br />
heavy initial damage). The results were also compared with<br />
criteria from the above-mentioned ECE regulations. The<br />
load on the vehicles is described first, followed by the load<br />
on the durnmies.<br />
Tests with the VW Golf TVpe 17<br />
The accelerations and forces measured on the test vehicles<br />
are much lower on the heavily conoded vehicle. The<br />
high acceleration measured at the transmission tunnel can<br />
be attributed to the interaction of the sensor with parts of the<br />
passenger compartment. The deformations measured on the<br />
vehicle with heavy initial damage are much higherthan with<br />
the slightly corroded vehicle. Table I summarises the vehicle<br />
load values.<br />
The test requirements which are demanded in the various<br />
regulations and guidelines and which were taken into account<br />
accordingly in these tests related to:<br />
390<br />
t Displacement of the steering.tyJtern.-This test<br />
must normally be performed without dummies'<br />
The information provided by the measurements in<br />
the tests discussed here are therefore not fully<br />
comparable with the type approval tests per'<br />
formed on new vehicle models. In tests performed<br />
with the vw Golf, the steering column displacement<br />
in the heavily conoded Golf is larger than in<br />
the slightly corroded vehicle.<br />
Table 1. Vehlcle load vrluG$ In test$ wlth the VW Golf, Type 17.<br />
Dttuatat<br />
rccEllFrTloll at<br />
truB[LBELon tunnGl<br />
6r* tSllttBl<br />
ai" [sllttu]<br />
riiee [s]/ttEl<br />
IEl<br />
aarr tgl ,/ t ltrEl<br />
gill<br />
li* lsl ir[#]<br />
H.avlly<br />
Cotrodcd<br />
llT Golf<br />
dilTllil*".rffil<br />
Tcst vi rluEa lor<br />
I sltqhtly<br />
I corroddd<br />
(KoR r) I v* corf (RoR 2)<br />
ll. 9<br />
36 / 47aa<br />
L7 / 72fri<br />
t7 ,/ 37ia<br />
2L,9 / L3<br />
ltHIiHl,llH<br />
zz,$ / 23<br />
--*<br />
2L,2 / 12<br />
ro.3 / 1r4<br />
36.9 / 11<br />
8L,9 / t2<br />
47,7 / 45<br />
8.8 / 25<br />
s{5<br />
657<br />
r Failure of the DerluElng 86flEor<br />
39 / 34ua<br />
20 / 38fra<br />
{l ,/ 35rs<br />
16. 7<br />
72/ 35[6<br />
36 / 37\B<br />
33 / 50Da<br />
ea.a / L{<br />
30.s / 48<br />
--t<br />
26.2 / L4<br />
9,4 / L6<br />
{o. 5 ,/ lx<br />
eo.6 / 5L<br />
58.7 / 2A<br />
s.s / 27<br />
636<br />
554<br />
The dynamic displacement could not be measured in its<br />
entirety since the marking points required for the measurement<br />
did not remain in camera on the film recording due<br />
to the fact that the front deformation was considerably higher<br />
than expected. The steering column displacement was<br />
203 mm even for the slightly corroded Golf and was therefore<br />
considerably above the criterion limit value (127 mm)<br />
for new vehicles.<br />
t Change in the size of the passenger compartment.---This<br />
requirement also has to be determined<br />
without dummies in a type approval test.<br />
The test values are nevertheless also interesting<br />
for tests with dummies, eyen if the presence of a<br />
dummy may prevent excessive change. The criterion<br />
limit value was not complied with for the<br />
right-hand seat of the heavily corroded VW Golf.<br />
t Door opening behaviour.--:lha two Golfs did not<br />
differ considerably in this point. The doors ofboth<br />
vehicles could be opened without the use of tools,<br />
although only with difficulty and not to their full<br />
opening angles. The changes in the door opening<br />
dimensions (measured longitudinally and diagonally)<br />
lay over the range 5-66 mm. They did not<br />
reveal any clear relationship with the level of initial<br />
damage, the highest value being measured on<br />
the vehicle with low corrosion level.<br />
t Fuel leakage /osses.-These were not discovered<br />
in any project test and are therefore not dealt with<br />
here in any greater detail.<br />
The occupant loads measured on the dummies indicate a<br />
relationship between initial damage and dummy loading<br />
which would tend to demonstrate that higher levels of initial<br />
damage result in higher levels of deformation, that the$e
esulted in lower vehicle decelerations and, consequently,<br />
lower loads on the occupants. However, this relationship<br />
only applied when no steering-wheel or knee impacts occurred.<br />
Force measurements in the belts revealed e.g. such a<br />
tendency. The dummy values are reproduced in tables 2 and<br />
In both tests, the dummy in the driver's seat suffered a<br />
head impact against the steering wheel and the criterion<br />
limit value was exceeded, this being particularly true in the<br />
case of the heavily corroded VW Golf due to the greater<br />
displacement of the steering column and the change in the<br />
seat position.<br />
Thoracic loads corresponded to the various passenger<br />
compartment decelerations and were found to be higher for<br />
the slightly corroded vehicle. This fact is also reflected in<br />
the high€r belt forces.<br />
Pelvic loading was also higher for the slightly corroded<br />
vehicle. No significant forces were introduced into the pelvis<br />
by a knee impact.<br />
In addition to these loads, which could be measured by<br />
means ofphysical values, the occupants ofthe heavily corroded<br />
vehicle were found to be subject to additional risks.<br />
The positions of the belts and the behaviour of the dummies<br />
in the two front seats would also suggest '*submarining".<br />
The faulty behaviourof the seats and the restraining systems<br />
resulted from the considerable change in the position ofthe<br />
seats due to the inadequate rigidity of the floor panel. It<br />
should be mentioned here that the underbody of the two<br />
vehicles examined was not of identical design, the younger<br />
Golf being fitted with a standard reinforcement in the seat<br />
area in the form of a wedge-like section (series<br />
modification).<br />
The load situation for the passenger dummies is virtually<br />
the same as for the driver. Head loading in the Golf tests<br />
with the more severely corroded vehicle produced low values,<br />
however, despite the light impact against the dashboard.<br />
No contact occurred in the comparative test, although<br />
the positional change of the head resulting from the<br />
high passenger compartment acceleration occurred so<br />
quickly that accelerations of more than 40g were measured<br />
for a period of 55 ms. This resulted in the head-load limit<br />
value being exceeded slightly by a value of HIC = 1023. A<br />
knee impact was determined for the passenger dummy in the<br />
heavily corroded Golf, although the loads remained uncritical<br />
here, too, see the summary shown in table 3.<br />
Tests with the Ford Fiesta<br />
These tests were characterised by a seat belt failing in<br />
each impact. The test values are shown in table 4.<br />
The test values show the same tendency as the tests involving<br />
the Colf-the slightly corroded vehicle was more<br />
rigid.<br />
t Displacement of the steering calnnn.-Up to the<br />
dummy impact, the steering-column displacement<br />
in the tests differed considerably; the displacement<br />
of 260 mm for the heavily corroded<br />
vehicle was well above the limit value ( l?7 mm);<br />
Table 2. Vsluea ol the dummy load (drlver) ln the VW Golf, Tlpe<br />
17.<br />
TeBt Point<br />
(Prrt of Bddy)<br />
Heavily<br />
TrBt ValuGE fof<br />
I stightty<br />
Corrod.d I corro*d<br />
192t127<br />
1177<br />
'<br />
\tr/51<br />
162<br />
Linit V8IGE<br />
of<br />
Lold<br />
I I W Golf ((01 l) | vu Gotf (Km ?)l crltffir I<br />
xErp<br />
emr/rrfiE tgJ<br />
Hrc (Htc 36*)<br />
ITIORAX<br />
amx/r3dB lgl<br />
slfi<br />
SEAT BELT<br />
tlmx lklll/t tnEl<br />
F2mx tku/t Iffil<br />
tlmx tklll/t trEl<br />
F4mx tkfll/t I|EI<br />
FEtV I S<br />
rfitsx/83m [g]<br />
FEruR<br />
F trux tkII<br />
8.2<br />
5,4<br />
5.2<br />
7-2<br />
65<br />
6t<br />
65<br />
71<br />
52t51<br />
0.u<br />
0.1.<br />
1000 il000)<br />
66e3me<br />
fl0001<br />
80s3ffi<br />
r0 k[ /8 kxSs<br />
10 kx /E kx3c<br />
r HlC56=(HeEd<br />
Injury Crltlfiffi) cstcutatiol.r lnteryail. = 16ffi<br />
r* sl ($everity trdcx) todd Griteriofl, is m lohglr erFtoyed<br />
'<br />
in current reguldtiffis<br />
t.r6,*<br />
Table 3. Values of lhe dummy load (paeaenger) In the VW Golf.<br />
Tct Point<br />
(Part df Body)<br />
IIEID<br />
emx/tm tgl<br />
Hrc (Hrc 36*)<br />
THMIT<br />
rEr/rlffi I9I<br />
slfi<br />
SEAI BETI<br />
rro tru/t trll<br />
hrx rku/r rffiIl<br />
FImx [kxl/t tftBIl<br />
ro** rkrt/t Imll<br />
PErVt $<br />
rmr/rlc tCI<br />
FENN<br />
Flm (ku<br />
Frmx IkXI<br />
Ifit v.lEr in<br />
HGrvtty I Silghtty<br />
corfodid<br />
I Corro*d<br />
w Gotf (xm r) | Yv colt (xfl a)<br />
16167<br />
371 (et8)<br />
,ot?9<br />
212<br />
4,5<br />
0.8<br />
e.1<br />
t.5<br />
74t44<br />
6l<br />
60<br />
6E<br />
97<br />
7.0<br />
1.6<br />
94151<br />
roel (6el)<br />
51t49<br />
196<br />
8,2 I 63<br />
J-?, t 59<br />
1-?t&<br />
6.8 I 7a<br />
49t47<br />
1.7<br />
0.6<br />
Lirlt Yrlrt<br />
of<br />
Lo.d<br />
crltfflr<br />
1000 (1000)<br />
e0gf*<br />
t1000t<br />
80t*<br />
10 kI /8kxrG<br />
10 kr /8krr#<br />
HIC lt6 r (llcd Injury Cf lt$im) crlculatlon intcrvEl . I6n6<br />
r* SI (SGvrrity ln(|6xt lold critrrlon. lr m longrr 64|to)Gd<br />
In currerit rcf,ulrtiffi<br />
?44t92<br />
taiz *<br />
44t11<br />
305<br />
4,0t68<br />
1.0t&<br />
2,Tt&<br />
4,4 I 92<br />
35/55<br />
0.9<br />
l.l<br />
the comparative vehicle had a displacement of<br />
I l0 mm and thus remained within the limit value.<br />
. Door opening behaviour.-The door opening<br />
behaviour was critical for both vehicles. Tools<br />
391
Table 4. Test values of the vehicle load lor ths Ford Flests.<br />
VEHICI.E<br />
ISAD<br />
PAR,AI.IETER<br />
lcclljlRlTlof, at<br />
tranBfrlBdlon tunnrl<br />
!r* tqll t ldsl<br />
ai" tsllttffil<br />
6ii." tgllttEll<br />
azx tsllttnsl<br />
tsl<br />
ICCII.InIIIOI at slll<br />
!r*r tql ,/ t tusl<br />
";;; lsllttb81<br />
DEtOnXtTrof, rof,clE<br />
iiiii iHi ii iil:i<br />
T6Bt Val<br />
HeavLIy<br />
CoErodEd<br />
FIEATTA (I(OR 3)<br />
uea for<br />
stlghtly<br />
corroddd<br />
FIESTA<br />
(I(OR 4)<br />
16.0 /<br />
iimiiniiiini<br />
ililTlill r*l<br />
t3.2 / 49<br />
L3.A / 77<br />
37.9 / Ic<br />
15, ?<br />
33,4 / 6r<br />
3O.4 / 7,6<br />
2L.7 / 83<br />
L4,7 / 2r<br />
I<br />
46.9 / 24<br />
3O,7 / z2<br />
r7.9 / LL<br />
L3.7 / 67<br />
5O,5 / 16<br />
LA[.a / 23<br />
81.6 / 19<br />
9,7 / LO<br />
655<br />
591<br />
44.5 / 2E<br />
24,4 / 76<br />
45,3 / za<br />
17.7<br />
36,L / za<br />
4L.6 / 28<br />
35.3 / 29<br />
23,7 / r2<br />
16.3 / 9<br />
54.9 / 23<br />
25,7 / Zr<br />
z6.e / 23<br />
f3,3 ,/ 10<br />
49.2 / L6<br />
L7a.7 / 22<br />
ag,t / LA<br />
Lz,O / 33<br />
560<br />
50{<br />
had to be used to open both doors of the heavily<br />
corroded vehicle and the driver's door of the newer<br />
vehicle. The function of the tail door was not<br />
impaired in these tests, however, so that the criterion<br />
stipulated by ECE-R33 is thus satisfied in<br />
full.<br />
. Chang,e in the size of the passenger compart'<br />
rnent.-This was critical for the heavily corroded<br />
vehicle with regard to two aspects-the distances<br />
from the front seats to the dashboard and the distance<br />
from the right-hand seat to the front face of<br />
the footwell. The considerable reduction in the<br />
fiee distances between the test points-the distance<br />
from the seat to the dashboard was approx'<br />
150 mm-resulted both from the seats being displaced<br />
and from a deformation in the face wall.<br />
The load on the dummy in the driver's seat (measured<br />
with regard to the load criteria) was not critical in the test<br />
with the heavily corroded Ford Fiesta, see table 5.<br />
The failure of a seat belt in each impact means that the<br />
tests can only be evaluated to a limited extent, since the<br />
various dummy values cannot be compared with each other.<br />
The assessment of the effect of the corrosion damage therefore<br />
has to rely more heavily on the comparison of the<br />
results obtained for the load criteria of the dummy held<br />
correctly by the belt.<br />
The faults in the seat belts were as foll ows: Opening of the<br />
seat helt buckle Jttr the passenger dummv in the test with the<br />
heavily t:ttrroded vehit:le and tearing away of the lap helt<br />
from the seat fitting o/ the driver's danrn-y in the test with the<br />
slightly conttded vehicle. No signs of unusually heavy wear<br />
to this belt were determined prior to the test' The belt tore<br />
only after the belt-restraint fieams were tom open.<br />
392<br />
Table 5. Test values ol the dummy load (driver) In the Ford<br />
Flests.<br />
I+st Polht<br />
(Port of Body)<br />
lEts<br />
mx/a3m lgl<br />
Htc ililc 36r)<br />
I!!8A[<br />
mx/sJc<br />
sl *r<br />
EEAI-!E.tI,<br />
Flmx IkII/t<br />
FZmx tkill/t<br />
F3mx tkll/t<br />
F4mx IkII/t<br />
e$yls<br />
ffix/dlm lgl<br />
ft!u8<br />
Itfiox tkill<br />
Frux IkII<br />
TffiI<br />
TIIBT<br />
TEI<br />
tBI<br />
N;tvl ly<br />
corrodfd<br />
FIESTA ((M<br />
9ZlE1<br />
6E9 (664)<br />
66t55<br />
4tl<br />
4,1 | 71<br />
o-9 I 76<br />
7,-9 I 58<br />
4.t I t6<br />
76t71<br />
2.0<br />
2-1<br />
valEB for<br />
I srishtty<br />
I corrodcd<br />
l) | FrEsrA fl(oR 4)<br />
146/1 0l+<br />
Tv (572r+<br />
4,E<br />
?,0<br />
5.1<br />
/'.E<br />
48147+<br />
397 +<br />
49+<br />
6gl<br />
5l+<br />
51+<br />
98191 +<br />
1-T +<br />
5.9 +<br />
Llillt VrtEB<br />
of<br />
tod<br />
crl tcr i r<br />
r000 (1000)<br />
609!ffi<br />
tl000t<br />
aohm<br />
10 kx /Eklrlffi<br />
t0 kx /8kx3G<br />
r HIC 56. (Hced Injufy Criteriffi) crtculttlon <strong>Int</strong>.rvrL | 36m<br />
*r SI (sivirlty lndex) told crit$im, is no lo.igor rytopd<br />
In currfilt regutEtiffi<br />
+ tsp bett tear at thc hcight of th! Eert flttlhe<br />
The driver dummy in the heavily corroded Fiesta is decelerated<br />
well by the belt, his thorax hitting the steering<br />
wheel as the latter is displaced into the Passenger compartment.<br />
This is followed by a slight head impact in which the<br />
lower cranium facial strikes the upper section of the steering-wheel<br />
rim.<br />
With the slightly conoded Fiesta, the kinematics of the<br />
driver dummy were uniform for the first 50 ms, after which<br />
the dummy, without additional restraint by the torn belt, was<br />
thrust onto the steering wheel and suffered an impact involving<br />
the abdomen, the thorax and, somewhat later, the<br />
head. Despite the belt tear, the head loads remained small<br />
and were comparable with those experienced in the heavily<br />
corroded vehicle, though this was not the case with the<br />
pelvic loads.<br />
The passenger dummy values allow even less comparison<br />
since the dummy in the heavily corroded vehicle cannot be<br />
evaluated due to the fact that it was nst restrained by the<br />
belt. With the exception of the very high head load resulting<br />
from a double impact against the windscreen frame, loading<br />
tended to be low, however, see table 6, since the dummy was<br />
still decelerated by the belt for approx. 60 ms.<br />
Tests with the DB W 123<br />
As already mentioned before, the belt mounting points in<br />
the door sill of the slightly corroded vehicle had to be<br />
reinforced by steel sections since an unusually high level of
Tablc 6. Paaaenger dummy lofd$ In thr Ford Flesta.<br />
T6t Folnt<br />
(Piit of Body)<br />
rH/t_ tgl<br />
Eln<br />
SEAT BEIT<br />
Fl*<br />
Feaa*<br />
F!-*<br />
Fl*<br />
EEWIE<br />
r hl(/'t; tcl<br />
[Eta<br />
I F16* Ikn I<br />
I Fffi tkxr<br />
!<br />
eo9leol +<br />
I5E4 (1t57) +<br />
Tilt Valul| for<br />
llrtrity ltttghllt<br />
Corfod.d I ctr?o.|rd<br />
FlEttA (rn 3) | FrErrA ((fl t)<br />
6015E +<br />
4tt +<br />
.v#<br />
6E<br />
55<br />
57<br />
6tt<br />
tlrlt Vrl'Jii<br />
of<br />
Lord<br />
crl tGrir<br />
lnEAp | | | |<br />
Lx/tr<br />
Isl<br />
||lc (|ilc 16r)<br />
$S8AI<br />
tHI/t t*l<br />
(kxl/t IFI<br />
(txl/t tBl<br />
(ku/t tBI<br />
t.9<br />
r,t<br />
:|E<br />
2.4<br />
59+<br />
60+<br />
60+<br />
59+<br />
41/Il +<br />
e,E +<br />
5.6 +<br />
6il6i2<br />
9et (Et4)<br />
t7t','<br />
5$<br />
1.9<br />
?,(<br />
5.3<br />
5.6<br />
2,4<br />
2-6<br />
1000 (t000)<br />
6ott0001<br />
8o"J*<br />
r0 tI /EtrI;<br />
l0 kr /Ekrlr<br />
r fllC 36 r (l|nrd lnjury Critcrlffi) c.lcut.tim intcrvrt . !6rr<br />
** 9l (Ssrity ldir) tord criteim, tr ho ln|f,r Wloyed<br />
+ Brtt hEklc oF.ild ilflie th6 t;Et<br />
corrosion (in relation to the overall condition) was ascertained<br />
in this area and this vehicle was intended to represent<br />
a vehicle with little or no corrosion.<br />
For the same reason, the front belt systems were completely<br />
renewed in order to avoid similar faults as in the tests<br />
with the Ford Fiesta (original DB spare pans).<br />
Vehicle loads also corresponded to the above-mentioned<br />
expectations in these tests. Thble 7 shows the vehicle load<br />
values. The deformation behaviour of the vehicles was very<br />
similar although the deformation with the heavily corroded<br />
vehicle was some 70 mm greater.<br />
t Steering systemdisplacement---:lhesteeringsystem<br />
displacement in the$e tests was very low and<br />
was only 16 mm for the heavily corroded vehicle.<br />
As with the comparable values in the tests with the<br />
other vehicle types, this value was also measured<br />
with dummy occupants.<br />
. Door opening behaviour.--The door opening behaviour<br />
in both tests was virtually faultless, although<br />
the opening mechanism of the slightly corroded<br />
vehicle was difficult to operate.<br />
t Passenger compartment size.-The minimum<br />
test point dimensions were complied with in both<br />
tests (uncritical in both tests).<br />
The behaviour of the belt mounts. refer to what mentioned<br />
before, wa$ not as it should have been in the case of<br />
the heavily corroded vehicle since the areas around the<br />
securing nuts were torn out of the sill. The left-hand belt<br />
Table 7. vohlcl€ load vElus8 In the tests wlth the DB w 123.<br />
Y.IfICItt<br />
INAD<br />
PARAI{RTER<br />
tilnrrlfilon tunn l<br />
l* [Ei ir[#i<br />
rt3js tftlltlltl<br />
I<br />
tcl<br />
r?x tql ,/ t [!rJ<br />
lCciLlnrTIOI ft<br />
!IIl<br />
:i* [Ei lilH]<br />
L4,L / 2L<br />
intffii<br />
L7,2<br />
ffi<br />
/ L4<br />
L94,2 / 34<br />
Ln,3 / 15<br />
77,9 / 2A<br />
L7.9 / r1<br />
79.6 / 13<br />
L54.7 / 5A<br />
7L.2 / 28<br />
r3.9 ,/ 68<br />
Dttonllrror<br />
{rr* ,1y.. tml<br />
699<br />
q.* peffi. tml<br />
6et<br />
T€rt Vrlues for<br />
tlravlly I sttgrrtry<br />
corrodtd I CoEroaled<br />
DB n 1e3 (XOR 6) | DB tf 123 (XOR S)<br />
la. e<br />
29.9 / 4L<br />
3O.O / rO<br />
3L.5 / t?<br />
tF,f, / 4L<br />
18, 6 ,/ 61<br />
47.O / 4L<br />
16. I<br />
38.7 / 4l<br />
42.2 / 50<br />
17,6 / 50<br />
27.7 / 26<br />
34.O / 33<br />
r8tl.9 / 3{<br />
L?.Q / L6<br />
26.7 / 35<br />
zz.a / 46<br />
94,5 / L7<br />
LA4,L / 5r<br />
7L.6 / 3L<br />
r8.e / 55<br />
622<br />
551<br />
mounting point was thereby displaced 8 cm to the front. lf<br />
the belt forces measured during the impact are taken as a<br />
basis, the tensile force with which the securing nuts were<br />
tom out of the left-hand mounting point was 4.5 kN. The test<br />
force for the individual mounting points as stipulated in<br />
ECE-Rl4 is 6.8 kN for the sill point.<br />
Thefront seatr were pressed out oftheir original position<br />
towards the doors due to the manner in which the belt forces<br />
were introduced into the seats and the transmission tunnel<br />
section. This was accompanied by a positional change in the<br />
seats in longitudinal direction of around 30 mm. This seat<br />
behaviour probably resulted in the passengers suffering<br />
head impacts against the dashboard in both cases. A further<br />
result of this positional change was that the passenger dummy<br />
was clearly swung out of the shoulder belt. This was not<br />
so evident with the driver dummies due to their impact with<br />
the steering wheel.<br />
The loads on the driver dummies do not allow complete<br />
comparison with each other due to a measuring defect on the<br />
dummy in the slightly corroded vehicle. The loads on the<br />
driver dummies are shown in table 8. Whereas the dummy in<br />
the slightly corroded vehicle suffers only abrief impact with<br />
its forehead against the hub of the steering wheel at the end<br />
of the forward displacement, the driver in the heavily corroded<br />
vehicle hits the cover of the hub with his full face due<br />
to the larger forward displacement resulting from the belt<br />
coming away from the mounting point. The limit value of<br />
the HIC is clearly exceeded. The remaining dummy loads in<br />
the heavily corroded vehicle are low. The load on the thorax<br />
in the newer vehicle is considerably higher than the limit<br />
value, and the pelvic load is also in the region of the limit<br />
value. The form of belt mounting and the forward displacement<br />
of the seat probably laid behind the passenger dum-<br />
393
Table 8. Vslues mea$ured lor the drlver dummy loads in the DB<br />
w 123.<br />
Tcat Point<br />
(PErt of Body)<br />
IIEAD<br />
amex/Eror' tcl<br />
Hlc (Hlc 16r)<br />
THORAX<br />
amEx./E3ffi [gl<br />
sl **<br />
SSAI BEI.T<br />
Ftmx lkill/t tftEll<br />
FziEx tkxl/t tffill<br />
F36sx tkl{l/t tmtl<br />
f4mx tk||l/t trrBll<br />
PELVIS<br />
ailsx/'rfl* tsl<br />
FEIfJR<br />
tlm6x tkrl<br />
Frm'x [k|l<br />
Tcet Vetuoe for Itlrlt vetr,reg<br />
HeEvily lstlghtly lof<br />
corroded lcoffodcd lLosd<br />
DE u 1a3 (KoR 6)l DB H l?5 (Kon 5)l Critcria<br />
'161<br />
/ 154<br />
1598( 1599)<br />
57t52<br />
576<br />
7.tt&<br />
1.1 I 69<br />
t.E | 69<br />
5,1 I 76<br />
58t56<br />
2.7<br />
2.7<br />
1.<br />
8nt73<br />
116<br />
9.1 t8<br />
0,6 | 19<br />
5,1 / 67<br />
5.EtE4<br />
100/80<br />
Lq<br />
7,1<br />
't000 (1000)<br />
60BI*<br />
tl000l<br />
E0S3iG<br />
10 k[ /8krbffi<br />
r0 kil /8krLffi<br />
* HIc 56= (Hc!d lnjury critrriffi) c8tculdtlffi lnterval = 3&m<br />
** sl (severity lrdEx) toEd criterim, is m lmg€r optoyed<br />
+ cEbte of the heEd scceterstlon Ednaor fl+tured aftcr E7m<br />
mies suffering head impact on the dashboard and to the limit<br />
value being exceeded. (table 9).<br />
The pelvic load of the dummy in the newer vehicle lay<br />
close to the limit value.<br />
Table 9. values mea8ured for the passcngcr dummy load In the<br />
DB W 123.<br />
TeBt Polht<br />
(Pirt of Body)<br />
HEAI)<br />
rmx/|'tm tll<br />
Htc (Htc 116*)<br />
TttoR^x<br />
rmx/r5|E tcl<br />
stfi<br />
BEAI EELT<br />
Ftmx fldl/t IEI<br />
Fhrx tklll/t tffiI<br />
flmx tklll/t Iml<br />
F{,n6x [krl/t ttr8l<br />
PELYIS<br />
ribx/hr* tgl<br />
FEI.TJR<br />
Ftmx tkxl<br />
ftilx [ku<br />
394<br />
I<br />
I<br />
I IIII<br />
Hsvl ly<br />
corrodrd<br />
DE U|a (rff 6)<br />
?s7m<br />
lo!8 *<br />
37ttl<br />
319<br />
r,a<br />
1.9<br />
?.7<br />
5,6<br />
Idt VrlH f6r<br />
tl<br />
7t<br />
6E<br />
73<br />
41tW<br />
1.5<br />
1,1<br />
sl lsht ty<br />
corrodrd<br />
Ds uul (ril 5)<br />
1i|4.t90<br />
1&9'<br />
58t77<br />
It5<br />
E.Zl&<br />
4.9 | 65<br />
4.6 I 6?<br />
5.5t&<br />
56t54<br />
0.4<br />
0<br />
Llrl t vrlH<br />
of<br />
Lord<br />
Crl t.rlr<br />
1000 (1m0)<br />
60TJ*<br />
10001<br />
E0TJ*<br />
l0 kx /8lx!E<br />
l0 kx /Elxts<br />
r illC !6 . (HeEd<br />
lnjury Crltrrlo|r) crlcutrtlorr <strong>Int</strong>rrvot ' 56m<br />
fi sI (scvefity lrdrx) tord critffim. ir m longer rrytoyrd<br />
*<br />
t< 36m<br />
The risk of occupants striking sharp edges in the tests<br />
with the DB W I ?3 is limited to the area of the dashboard or<br />
centre console,<br />
Relationship between the results of the corrosion test and<br />
the impact behaviour.<br />
The following sections compare the results obtained for<br />
non-destructive corrosion testing with the damage and results<br />
determined in the impact tests.<br />
VW Golf<br />
The 6 points marked inthe engine chamber all indicated<br />
corrosion damage in the areas of the welded and flanged<br />
seams. The damage suffered in the impact consisted of<br />
considerable deformation to the front section of the vehicle,<br />
with a number of components (fender and door plate) showing<br />
signs of fracturing.<br />
In the area of thewindscreen both A-pillars were found to<br />
have rust blistering and were rusted through at points. The<br />
impact test caused the A-pillars to $tart to tear at these points<br />
and resulted in a high level of deformation (A-pillar bent in<br />
roof section). The high level of corrosion damage in the area<br />
of the A-pillar at the level of the windscreen frame and the<br />
unsatisfactory securing of the door plates resulted in the<br />
upper doar secrian being bent out of the door plane and thus<br />
served as a source ofdanger to the occupants ofthe vehicle.<br />
It should nevertheless be remembered that the side windows<br />
had been wound down to allow better filming and that this<br />
may have influenced the strength of the door frame.<br />
The fact that both sills (inside and outside) showed heavy<br />
signs of corrosion and were rusted through in parts and that<br />
the floor panel had partially come away meant that the si/l<br />
was bent in the area of the right-hand door.<br />
In the area of the right-hand belt mounting point the<br />
corrosion test revealed high Ievels of surface and throughrusting<br />
on the inside sill. However, the belt mounting points<br />
had been strengthened by attaching measuring equipment,<br />
thus preventing the points being torn out in the test. The<br />
effect of fitting the test equipment was avoided in subsequent<br />
tests; it is therefore not possible to evaluate these<br />
areas in the Golf tests.<br />
Heavy corrosion was ascertained at several points in the<br />
areas linking the floor panel to the inside sill. This caused<br />
the underbody to crumple in the impact test, which in turn<br />
resulted in changes in the position of the/ront seats.<br />
The damage determined in the passenger compartment of<br />
the heavily damaged Golf by means of corrosion test equipment<br />
caused sections of the floor panel to come away from<br />
the inside sill in the impact. The sharp, rusty edges of the<br />
sheeting projecting into the passenqer compartment thrs<br />
represented a considerable source of danger for the vehicle<br />
occupants. Sharp edges or dangerous areas of unevenness in<br />
the area which parts of the body may strike are unacceptable<br />
according to the criteria of the ECE regulations. Figure I<br />
shows one example of such sources of danger after impact in<br />
the heavily corroded Golf.<br />
Ford Fiesta<br />
The differences described in the level of corro$ion<br />
resulted in differences in the deformation depth and differ-
Atsa ol tho ddvsfs 8oel.<br />
Ar€a of lhs front-passor1gofs<br />
S€st,<br />
Flgure 1., Defonlatlon of th€ lloor pan€l<br />
In tests wlth the heavlly<br />
corrodod VW Golf<br />
ent behavio;rr of the individual parts, e.g. in the areas of the<br />
lower windscreen frame including the A-pillars, the connection<br />
between the fenders and the side walls of the engine<br />
chamber with the parts functioning as side members. The<br />
areas of interest in the underbody area are the transitions<br />
from the A-pillar to the door sills and the sections of the<br />
underbody connected to the transverse links.<br />
The deformation and damage suffered by the underbody,<br />
the right-hand windscreen frame and the dashboard in the<br />
passenEer compartment of the heavily corroded Ford Fiesta<br />
represented sources of injury for the occupants.<br />
The floor panel in the area of the two sills was found to be<br />
particularly severely damaged even during the corrosion<br />
examination stage.<br />
Daimler Benz W 123<br />
The corrosion damage ascertained on supporting elements<br />
in the front section of the vehicle produced only<br />
slightly greater deformation in the case of the heavily corroded<br />
DB W 123. The transirion point from rhe A-pillar ro<br />
the door sill revealed high levels of corrosion damage, including<br />
rusting-through of the parts, even though the areas<br />
examined showed no external signs of rusting, as just<br />
mentioned before. Despite the high levels of corrosion damage<br />
measured at these points, the slightly corroded and<br />
heavily corroded vehicles behaved in more or less the same<br />
way during the impact; the slightly greater deformation<br />
depth can be seen from the distance between the wheels and<br />
the wheel house.<br />
The corrosion measurements revealed particularly interesting<br />
results for the belt mounting points of the inside sill<br />
for both the slightly corroded and heavily corroded vehicles<br />
of this vehicle type. This corrosion resulted in one of the belt<br />
mounting points being torn out during impact.<br />
Evaluation of the results<br />
The vehicles classified as "slightly corroded" or "heavily<br />
corroded" showed very significant differences in both<br />
the corrosion examination and impact te$ts.<br />
The corrosion damage was determined successfully for<br />
the purposes of the project. For the vehicles categorised as<br />
"slightly corroded", it was possible to demonstrate<br />
that the<br />
absence of corrosion predicted by the measurement did<br />
actually exist. This was demonstrated by the more "re-<br />
silient" behaviour in the crash and by the absence of rust on<br />
the fractured metal parts revealed after the crash. Furthermore,<br />
the results obtained with the corrosion test unit were<br />
found to be very good since they were able to reveal the<br />
important and unusually heavily corroded points in the<br />
Daimler Benz's inside sill.<br />
In many cases, the corrosion damage determined on the<br />
"heavily corroded" vehicles could be attributed directly to<br />
failure of vehicle components.<br />
The comparison of re sults obtained from the impact tests<br />
revealed that, in many points, the level of protection<br />
afforded to the occupant$ was reduced by an unacceptable<br />
degree by the corrosion damage. The limit values demanded<br />
by the various regulations governing the behaviour ofvehicle<br />
components were clearly exceeded in a number of cases.<br />
Particularly alarming is the fact that the slightly corroded<br />
vehicles, which were expected to behave similar to new<br />
vehicles, were found to exhibit a number of weak points in<br />
the field of occupant prorecrion (see rable l0). The following<br />
failure mechanisms were found to be the main causes of<br />
failure for the heavily corroded vehicles:<br />
The displacement of the steering rolumn into the passenger<br />
compartment in the case of the Golf and Fiesta was<br />
found to be considerably higher rhan the legal limit of 127<br />
mm.<br />
The criteria for cftanges in the size of the passen7er compartmeil<br />
were complied with apart from one exception.<br />
This exception related to one passenger compartment dimension<br />
in the te$t with the VW Golf.<br />
The door opening behaviour was only critical in the test<br />
with the Ford Fiesta. The corrosion damage aggravates what<br />
is obviously a design weakness of this vehicle type; the door<br />
opening behaviour was also less than perfect in the comparative<br />
test.<br />
The hehaviour of parts of the passenger comparlment<br />
with respect to the danger of injury they represent for the<br />
395
Table 10. Overvi6w ol the malor te8t results.<br />
vehicle<br />
typB<br />
wl GOI,F<br />
Type 17<br />
FORD FIESTA<br />
DB w l?3<br />
V€hicla Danag€<br />
Heavily Corrod;d I Sliqhtly corrod€d<br />
- crltlcal dlsplaceucnt<br />
of stddring Eyst€D<br />
- DeteffilnatLon of paa-<br />
Eenger conpartfient<br />
Eiz€ rfter inpact,<br />
1 valuG failGal thc<br />
critsrion<br />
- ilrc exceeded for<br />
drlver dumy<br />
- Probabl€ rr8ubEariningn<br />
of driver dumy<br />
- Fallure 6f belt buckl€<br />
right-hand aeEt<br />
- Critical di8plac€nsnt<br />
of at€Gring Ey6teD<br />
- crltlcal d6or openlng<br />
behaviout<br />
- Dat€mimtion of paa-<br />
EEngcr colpartnant<br />
sLz€ aftBr irpact, 3<br />
valu€a faif€d th€<br />
criteria<br />
- Belt nount toEn out of<br />
driver seat<br />
- Hrc dxcdrdBd f6r bdth<br />
driv€r and ffont-seat<br />
paaEenger<br />
- critlcal diaplacenent<br />
of stecrlng Byrtch<br />
- Hrc exceeded fdr<br />
drlver and front-aeat<br />
paF6qng€r<br />
- Iap bdlt of driv€r<br />
duMy torn<br />
- PGlvic load crit€rion<br />
excecdGd<br />
- crltlcal door opening<br />
bchavLour<br />
Heavy corroEion at<br />
belt nountlng polnt in<br />
EIIIt lnproved f,or the<br />
tcst<br />
HIC exceeded for<br />
drlver duMy<br />
critlcal pelvic load<br />
for driver duffiy<br />
occupants was critical in all vehicle types. A direct risk of<br />
injury through corroded body parts was particularly high in<br />
the VW Golf test. While such a risk was also present in tests<br />
involving the Ford Fiesta, this risk was lower. The risks<br />
determined with the Daimler Benz were less grave and<br />
related to a number of the control elements and the<br />
dashboard.<br />
The dummy load limit values, the criteria which most<br />
clearly illustrate the risk of injury to vehicle occupants,<br />
were exceeded, particularly as regards the head load. The<br />
occupant loads in the DB W 123 were unexpectedly high<br />
when measured against the positive results obtained for the<br />
vehicle-specific characteristics.<br />
The assessrzent of the procedure for determining corro'<br />
sion and performing tests must take into account the following<br />
points for an envisaged continuation of the project:<br />
'Ihe<br />
determination of corrosion was primarily schematic<br />
in form and was only in part related to vehicle type and<br />
corrosion damage. This meant a very high number of test<br />
points. It would appear advisable for the future to perform<br />
only a few initial measurements with the corrosion test unit<br />
at the relevant areas of the vehicle type concemed and to<br />
perform exhaustive measurements of only the most pronounced<br />
areas. Such relevant areas are e.g. the belt mounting<br />
points, the seat mounts, the sills and similar frame<br />
components.<br />
'fhe<br />
impact teJtJ were chiefly conducted with the seat<br />
belts and seats already fitted in the vehicles at the time of<br />
purchase.<br />
Irrespective of their existing corrosion damage, the failure<br />
of these component$ can result in high dummy loads, as<br />
396<br />
was also demonstrated in the tests involving the Ford Fiesta.<br />
Future tests must therefore bear this in mind and exchange<br />
the old seat belt system$ for new ones. The used systems<br />
must be examined and evaluated in a separate test (component<br />
test) in addition to the impact test involving the vehicle.<br />
Due to the importance of how the vehicle seats behave in<br />
frontal impacts, these should also be examined thoroughly<br />
prior to the test and, ifnecessary, exchanged and examined<br />
separately.<br />
As shown by the tests with the VW Golf in which the<br />
manner used to fit the acceleration sensor may have prevented<br />
the belt mounting point being tom out of its fitting<br />
location, it is particularly important to ensure that any<br />
measuring instruments fitted are taken into account when<br />
evaluating the results.<br />
The consequences of an accident of comparable severity<br />
as the crash tests conducted here would result in injuries to<br />
occupant$ of "heavily corroded" vehicles ranging from<br />
very severe to fatal. The tests outlined here allow this conclusion<br />
to be drawn, although the low number of tests conducted<br />
to date, the small range of models covered and the<br />
little experience gained in preparing tests, means that it has<br />
not yet been possible to determine corrosion-related damage-and<br />
consequent reductions in safety-which cover<br />
several vehicle types and which can be precisely quantified.<br />
The failure of the seat belts in two tests is of equal if not<br />
greater importance than the conosion-related failure of vehicle<br />
components.<br />
The results of the "slightly corroded" vehicles in the<br />
crash test were also unsatisfactory in a number of points'<br />
Although the german regulation for car approval (STVZO)<br />
does not stipulate any dummy load values, global tests using<br />
dummies are essential for assessing the complex interaction<br />
of the various vehicle components in a frontal impact.<br />
Summary and Conclusions<br />
The examination of three different vehicle types (VW<br />
Golf. Ford Fiesta and DB W 123) to determine their<br />
corrosion-related behaviour in impacts was performed<br />
jointly between the BASI and the RWTUV Essen. The<br />
RWTUV Essen was responsible for selecting the vehicles<br />
and determining the degree of initial damage resulting from<br />
corrosion. A corrosion test instrument newly developed by<br />
the RWTUV Essen was used for determining the level of<br />
corrosion. The BASt conducted the impact te$t$ and test<br />
evaluation.<br />
Significant differences were ascertained between the<br />
"slightly<br />
corroded" and<br />
"heavily<br />
conoded" vehicles. The<br />
differences related to test values for and damage to the test<br />
vehicles, and to test values for the dummies.<br />
The most grave events for the occupant$ resulting from<br />
corrosion-related initial damage were as follows:<br />
r The belt mount was tom out.<br />
r The behaviour of the $teering system.<br />
r The behaviour ofthe vehicle seats in conjunction<br />
with the vehicle's underbodv or seat mount$.
The behaviour of body parts or parts of the<br />
controls with regard to the risk of injury they<br />
represent for the occupants.<br />
Even the tests with the '-slightly corroded" vehicles<br />
yielded results which were also unsati$factory when<br />
measured against the regulations used for assessment<br />
purposes.<br />
The following conclusions can be drawn about the faulty<br />
behaviour ofolder vehicles and, in particular, those vehicles<br />
which are not yet so old:<br />
The resistance of vehicles to corrosion-related and userelated<br />
damage must be enhanced, particularly in the light<br />
of the problems highlighted here relating to the insufficient<br />
stability of the floor assembly, the significant displacement<br />
of the steering system into the passenger compartment, and<br />
The Breed All-Mechanical Driver Air Bag Evaluation<br />
Wrinen Only Paper<br />
Jerome M. Kossar,<br />
National Highway Traffic Safety Administration<br />
Abstract<br />
Results of a program evaluating a potentially lower cost<br />
driver air bag system are presented. The nonelectrical, air<br />
bag retrofit system integrates the complete air bag, crash<br />
sensing, and inflation functions within a single module<br />
mounted over the steering wheel hub. The Nationat<br />
Highway Traffic Safety Administration contracted Breed<br />
Corporation to develop police car retrofit driver protection<br />
systems. Predictive analytics compared favorably with<br />
results measured in tests. Test dummy injury measures<br />
indicate good protection for the range of driver sizes, both<br />
with and without supplementary belt restraints.<br />
Environmental testing indicated that long term elevated<br />
temperature exposure be limited to temperatures no higher<br />
than 90oC (194"F) in order to insure high operational<br />
reliability.<br />
This paper presents the views of the author, and not<br />
necessarily those of the National Highway Traffic<br />
Administration (NHTSA). The numbers in parentheses are<br />
references, listed at the end ofthe paper.<br />
<strong>Int</strong>roduction<br />
The all mechanical Breed Corporation retrofit driver air<br />
bag system was the subject of a National Highway Traffic<br />
Safety Administration program. The program concerned a<br />
nonelectrical air bag system with its crash sensor and<br />
initiating subsystem as an integral part of the inflator, which<br />
in turn is housed within the air bag module mounted over the<br />
hub of a steering wheel. The potential economies<br />
anticipated from the elimination of multiple remote crash<br />
sensors, their wiring requirements, and their electronic<br />
system on*board diagnostic and defect warning apparatus<br />
were the incentives for NHTSA interest. It is possible that<br />
the strength of the belt mounts and belt systems themselves.<br />
The inadequate safety of those vehicles with either no or<br />
only slight corrosion was demonstrated in a global test.<br />
The corrosion-related failure mechanisms of the vehicles<br />
in the frontal impact tests examined in this paper suggest<br />
that the risk to the occupants of a vehicle involved in a<br />
lateral collision (where the stability of the vehicle structure<br />
exerts a direct influence on the occupants) increases at a<br />
much higher rflte as a result of corrosion than is the case in a<br />
frontal impact.<br />
The high number of, in part, dangerous failure events<br />
resulting from a low number of impact tests and the<br />
possibilities for reducing such failures in future with a low<br />
level of effort demands a fuller examination of the problems<br />
relating to older vehicles which have suffered priordamage.<br />
the currently labor intensive production of air bag systems<br />
of this type could be highly automated, and if this<br />
automation were accomplished, the installed system costs<br />
could be approximately one third less than that of the<br />
multiple, electrically signalling, crash sensor systems<br />
prevalent today. Such automation of production would,<br />
however, be costly to develop and is not a product of this<br />
low production volume program.<br />
The simplicity of mechanical design and the presence of<br />
two independent sensing and initiating mechanisms within<br />
the Breed sensor/initiator added to the anticipated system<br />
reliability. A schematic of one half of the Breed sensor/<br />
initiator showing the intemal mechanism of one of the two<br />
identical and independent means of crash sensing and<br />
inflation intitiation is seen in figure I. At program inception<br />
there were reservations concerning the technical feasibility<br />
of a timely distinction between desirable and undesirable<br />
deployment situations based on decelerations of the<br />
steering wheel. The first efforts of the program were,<br />
therefore, directed at establishing such feasibility.<br />
After establishing technical feasibility, the next efforts<br />
involved specific car selection and further development and<br />
evaluation of the air bag system. The last program efforts<br />
involved work towards the qualification of the inflator/<br />
sensor/initiator assembly. Environmental conditioning and<br />
testing, which are representative of industry qualification<br />
practice, have indicated need for design improvement to<br />
ensure operational reliability after long time exposures to<br />
the highest temperature employed in some manufacturer's<br />
system qualification.<br />
Establishing Feasibility<br />
The unique air bag mechanical sensor/initiator to be<br />
employed and its isolated location within the pyrotechnic<br />
gas generator (inflator) mounted to the steering wheel have<br />
produced concems as to the ability of such a system to<br />
397
f<br />
ILfriil"ll:"ttr<br />
thi iinrln! r$ n b.ll lt h.ld ltr tlt rotltlil rlffi !y tlf, sFlil<br />
A dGGlFrtlon ot Fr thm 1.7 6ri 13 ru$lrud to oY6ffi tl$ 3prlfi{ lillil lffi bl$<br />
Ind cMc th. rffrlit btll td m toffiFd.<br />
(hci In r cnih xlth cntr thrtr | a.7 6 dac.lailtlon, tho fttl6 of tl* brll 13 d|laa<br />
n rlffid by $r lIfi tlrosgh th. b.ll dlfrtn clsrrffi In th cyllrrhf tdH.<br />
lf r ilr dHeleHtcs lo|l{ ffiOh rbovc 4.7 E. tlE fo$d EYHI cl ttf b.ll rtll<br />
iluBG thc s0rlm lildcd ldcr io tffi tls'F rhrft srlflclatly tE din t|| tlrl]l| pln.<br />
Flgure 1. Sensor/lnitlator.<br />
distinguish between desirable deployment and nondeployment<br />
events. If deployment was required, could initiation be<br />
produced early enough in the crash event to provide timely<br />
air bag inflation for driver protection? The criteria initially<br />
employed in this program to assess the timeliness of inflator<br />
initiation were: (a) initial air bag loading on the driver must<br />
occur before the time the driver moves forward more than<br />
five inches relative to the compartment interior; and (b) 30<br />
milliseconds must be allocated to the time between inflator<br />
initiation and accomplishment of air bag inflation to the<br />
extent required to impose initial restraining loads on the<br />
driver.<br />
As a service to this evaluation, steering wheel hub acceleration<br />
were recorded during head-on aligned crashes between<br />
a deformable moving barrier and four different 1983<br />
model yearcars: The Honda Accord; Renault Fuego, Dodge<br />
Omni; and Chevrolet Celebrity. These hub acceleration<br />
crash histories were used as inputs by the Breed Corporation<br />
to their computerized math model which predicts deployment<br />
initiation time of their mechanical sensor. Each prediction<br />
is based on the fixed physical design parameters of<br />
their sensor and the specific crash pulse under consideration.<br />
The theoretical results of the Breed modeling are<br />
shown in table l. As this table illustrates, the predicted<br />
initiations of driver air bags in these compact car test<br />
crashes appear close to the timing criteria requirements but<br />
they are generally several milliseconds later than suggested<br />
by the criteria. This infers that some adjustments of the<br />
sensor design parameters would be advisable to provide<br />
improved protection for compact cars.<br />
In tests conducted at the Ohio Transportation Research<br />
Center (TRC) in East Liberty, Ohio, rigid barrier frontal<br />
crash tests of a Ford LTD with an installed Breed steering<br />
wheel mounted sensor (reference l)* produced no sensor<br />
+Numbcrs in parentheses designate references at end of papcr<br />
398<br />
EAEEO AIF BAC<br />
cBAElt SEFOn/ntTtAIOi<br />
HffiE<br />
Table 1. Predlcted alr bag Inltlstlon time.<br />
CGIffi ELOTITI PtEDICIED IXITIAIIil TIflIIED IXITIATIfl '<br />
wfftclE (l'lFllt (sffis) (EECofOtt<br />
:Iil'r : :.:i: :.:i:<br />
rA! c[Ev. ErERrry 61 0.0et 0,0e0<br />
i ESE il EilrlEGXt tlr^f ocdFtllt/Atft 8 6 ct{Tmr cffi3 tY Tft IIE ffiilr ffE foHftb<br />
triggering in 5.1 and 7.1 MPH frontal crashes while a 9.1<br />
MPH crash did cause the sensor to trigger. Preliminary<br />
rough road driving tests were also performed. From these<br />
initial barrier crashes and driving tests it was concluded that<br />
the Breed sensor/initiator provided adequate resistance to<br />
undesirable deployment.<br />
The last feasibility evaluation test series of frontal<br />
crashes employed three Ford LTD's which had been retrofitted<br />
with developmental air bag systems. Prior to the conduction<br />
of these crash tests, NHTSA was supplied with a proprietary<br />
math model of the mechanical sensor by the Breed<br />
Corporation which allowed the user to predict initiation<br />
time based on the crash pulse experienced. Two crash tests<br />
were conducted on each of the three cars, the first at a speed<br />
below that required for air bag deployment and the second<br />
under crash conditions for which deployment was desirable<br />
for driver protection. Based on actual measured acceleration,<br />
NHTSA, using the Breed sensor math model, was able<br />
to compare predicted and actual sensor performance.<br />
The initial test of each of the three Ford LTD's was a low<br />
speed frontal banier crash. The type and severity of the<br />
second crash test of each car was varied. The first car was<br />
subjected to 30.0 mph frontal fixed rigid barrier (FRB)<br />
crash; the second a 12.2 mph FRB crash, and the third a 29.9<br />
mph frontal centerline impact against a l2 inch diameter<br />
rigid pole. The bumper was stiffened by the addition of 38<br />
pounds of steel prior to the pole test. Table 2 presents the<br />
injury measurements obtained from unbelted Part 572 50th<br />
percentile male dummies seated in the driverposition. Table<br />
3 allows comparison of actual sensor initiations with those<br />
predicted from recorded crash pulse measurements. As table<br />
2 illustrates, all the injury measures from dummy<br />
instrumentation satisfy NHTSA requirements and table 3<br />
demonstrates timely and predictable initiation of the air bag<br />
deployment.<br />
The design of the developmental air bags used in this<br />
feasibility series was varied. The first Ford employed an<br />
airbag made from two 28 inch diameter flat disks of coated<br />
nylon sewn together at their circumferences and incorporating<br />
two 1.2 inch diameter vents. The second air bag was<br />
smaller, fabricated from 26.5 inch diameter flat fabric and<br />
containing four 1.0 inch diameter vents. In a successful<br />
attempt to insure that the air bag expanded over the lower<br />
quadrant of the steering wheel before the dummy forward<br />
motion blocked this deployment path, 11 inch long tethers<br />
were added which attached internallv to the front and rear
Table 2. Dummy datE lrom Ford LTD feaalblllty teete.<br />
TES DIHIPTIdI 5{,.0 pfl frflr t<br />
ilotD Mt*lct<br />
HIG 2'F<br />
eril4 xlc FENb 6a - lll E<br />
flE3r ffi. 0 (tt8t<br />
HtrT *rGt. lbd(<br />
t x. tdtt Lm<br />
lltr<br />
ll4r<br />
a!G<br />
tt6<br />
t4t7 Lr. r ll ||<br />
tctu,taF<br />
le.e |til rffl<br />
rr0r0 $lttEf<br />
r rEtD lrrtilt tcfErEtlilil H lnr[li iil clldurril<br />
r G||Err ErTrErF rccEtEt ilil 5t ry tnt m cr|'qt'Ailor<br />
E<br />
ut.9 l+r rfrE<br />
llr 0lr. FotE<br />
t6?<br />
t5-l{tE }t.tttE<br />
AOG 4IGfr<br />
t7 ans<br />
lott Lr. r ?l B tsta Lr. d ?tt F<br />
l0l5 ll. t el E r$e u. a t7 fr<br />
Table 3. Breed Inltlator math modcl performance.<br />
il ils tESt<br />
ffltlil *fi[ IttlltTrfl<br />
r?9 LE | 4.5 Ft ff<br />
iHlll llCrD wtEr<br />
riltsa4.tffi<br />
Fffi[ IIEID 'IITIIT<br />
17? LrD D rz.r rff t4.5 E<br />
fHr[ ilGID lllllll<br />
,ilLEra.7S ff<br />
tHf[ llolb slilh<br />
il<br />
hli EEL ETFffii<br />
teft. ruilfl [EtETtil il ltltIlilfl<br />
fitrEilA<br />
Elltilfi *tEt p ftrE F ittE<br />
'.PILH F IITE<br />
r?r9<br />
tE | 10.0 pff A E (ltl! SfEtll0 ffiL rIE t a6 S E E<br />
fHI[ ttElD $mlH t.Pltu ilE I et s<br />
rstba8.9H<br />
Iffil ilIET FflI<br />
!1.1 B<br />
3fthlF rot t ft:t 5 trrt<br />
t-Pttu s rttf<br />
3ftilI$#L flEIlaB SE<br />
t-Ptln ilttsE<br />
rlutr6 541 5 iilc m filt<br />
l.'lLW E fnl<br />
IIEETIIGH4L IIE9BH SE<br />
t-FIrd ftE a ll B<br />
5ll: (*t) DEFr[t EHtnTS *lt#t tfi H*o<br />
surfaces of the air bag. These tethers sewn on the centered<br />
3.5 inch radius, arrested the air bag during its rearward<br />
deployment causing a more rapid radial expansion of the air<br />
bag into the space between the advancing dummy and the<br />
lower portion of the steering wheel. The tethered bag was<br />
provided with a single vent of L75 inch diameter.<br />
Study of the high framing rate film exposed in each of the<br />
feasibility series deployment crashes revealed deficiencies<br />
in performance not evident from the dummy instrumentation<br />
measurements. During the 30 mph FRB crash it was<br />
observed that at the time of maximum chest loading the<br />
plane of the steering wheel was almost perpendicular to the<br />
dummy chest. The steering wheel rim, thus radially loaded<br />
by the dummy, clearly constituted a significant and unsafe<br />
concentrated load input to the dummy rib cage. The steering<br />
wheel plane rotation was produced as a consequence of the<br />
steering column having rotated to a near vertical position by<br />
the time peak chest loading occuned. Thus, the normal air<br />
bag benefits of well distributed loading on the occupant<br />
were not achieved during the time of maximum driver restraint<br />
loading primarily due to the large forward and upward<br />
rotation of the steering column.<br />
Post crash inspection revealed buckling of the main<br />
bracket suppofr of the column resulting from an excessive<br />
forward pitching moment being reacted from the steering<br />
column into the firewall. This buckling allowed the forward<br />
rotation of the column observed in test. The forward pitching<br />
moment in the steering column is increased beyond that<br />
of a non-air-bagged column as a consequence of the effective<br />
moment arm of the steering column being extended by<br />
the inflated air bag. The column pitching moment is created<br />
by the driver's non-axial loading ofthe aft end ofthe steering<br />
column which produces increased bending of the column<br />
when coupled with the longer moment arm created by<br />
the interfacing air bag. The observed column rotation produced<br />
by air bag addition and the consequent threat to the<br />
driver highlights the importance of assuring adequate column<br />
stability and column mounting strength when driver air<br />
bags are introduced.<br />
The overall results obtained in the feasibility evaluation<br />
encouraged NHTSA to proceed with development of a retrofit<br />
driver air bag system that would be suitable for installations<br />
in police fleets.<br />
Car Selection<br />
Since the feasibility evaluation had uncovered steering<br />
column instability under the loads of the air bag restrained<br />
driver and no simple retrofit to attain stability was<br />
recognized, it was necessary to select another police car for<br />
use in this program. For this purpose a Chevrolet Impala and<br />
Dodge Diplomat were equipped with experimental Breed<br />
driver air bag systems and 30 mph frontal crash tests were<br />
conducted. The air bag for the Impala had a flat diameter of<br />
28 inches, employing six l3 inch long internal tethering<br />
straps arrayed on a centered 7 inch diameter circle with two<br />
1.2 inch diameter vent holes. The only difference in the air<br />
bag used in the Dodge Diplomat was that the vent holes<br />
were reduced to l.l inch diameters. Injury measured from<br />
both tests satisfied criteria as is evident from the values<br />
shown below.<br />
TEST CAR<br />
1983 Chevrolet Inpala<br />
sHESrc<br />
FEMTTR r-oAp$ (LBs)<br />
289 44 1850 1000<br />
1983 Dotlge D1plonat 46I 49 2120 t5 30<br />
Under loads ofthe knee bolster the inboard portion ofthe<br />
lmpala instrument panel collapsed. This explains the low<br />
right femur load. Post test inspection of the Diplomat<br />
revealed that the higher left femur load resulted from<br />
bearing of the deformed knee bolster upon a steering<br />
column mounting bolt. Either of these problems could be<br />
avoided through design modification. It was decided to<br />
proceed with retrofit air bag development for installation in<br />
the Impala.<br />
399
Sled test program<br />
A sled test program to demonstrate the frontal impact<br />
performance of the Breed all mechanical driver's side<br />
retrofit air bag system was conducted in the Transportation<br />
Research Center of Ohio. The Hyge sled facility was used<br />
with a reinforced Chevrolet Impala (GM "8" Body) sled<br />
buck. Various conditions of speed, dummy siee, dummy<br />
type, and air bag/seat belt combinations were tested. For<br />
comparative purposes, these tests also included drivers with<br />
no restraints as well as drivers employing only seat belts.<br />
Both straight frontal and angle fixed rigid barrier impacts<br />
were simulated with vehicle speeds of 30, 35, and 40 mph.<br />
Dummies employed were the 5th percentile female, 50th<br />
percentile male (part 572),95th percentile male, and Hybrid<br />
III (50th percentile male).<br />
The base vehicle for the buck was a 1979 Chevrolet<br />
Impala, four door sedan, equipped with a split back bench<br />
type front seat. So as to provide an unbiased comparative<br />
evaluation, the steering column, steering wheel, instrument<br />
panel, instrument panel suppofring structure, and, when<br />
required, windshield were replaced for each test.<br />
It had been determined that the steering system of the<br />
Impala provided excessive axial play between the steering<br />
wheel and steering column which could produce delay or<br />
distortion of the car crash deceleration pulse reaching the<br />
sensor. A retrofit modification within the aft end of the<br />
steering column was therefore used to reduce axial<br />
clearance. It had also been determined that the steering<br />
column resistance to axial stroking was less than ideal for<br />
application of the air bag system. To compensate,<br />
supplementary stroking resistance was provided by the<br />
application of two u-bolt type clamps to the smaller<br />
diameter tube of the two tube telescoping steering column.<br />
The added stroking resistance was produced by frictional<br />
loads between the smaller diameter column tube and the<br />
attached u-bolts a$ the u-bolts were forced by the<br />
telescoping process to slide down the smaller diameter<br />
column tube during column $troking.<br />
The airbag was a tethered circular planform bag<br />
fabricated by sewing two neoprene coated nylon cloth disks<br />
together at their periphery so as to yield a 28 inch inside<br />
diameter when flat. Tethering consisted of six l2 inch long<br />
$trap$ on a 7 inch diameter circle concentrically sewn to the<br />
air bag front and back inner surfaces. Air bag venting was<br />
provided by two 1.2 inch diameter holes through the<br />
forward air bag surface. The decorative and protective air<br />
bag cover used was standard for use on the Ford 1985<br />
Tempo/Topaz air bag equipped cars. The inflators were 90<br />
gram units containing the Breed mechanical sensor/initiator<br />
supplied by Morton Thiokol Inc. The last thirteen tests<br />
employed the final design sensor/initiator which was<br />
automatically armed upon insertion of the air bag module<br />
into the steering wheel cavity. The earlier air bag tests<br />
required manual arming through insertion of a screw prior<br />
to air bag module attachment to the steering wheel.<br />
Calibration, function and performance were identical in<br />
both sensor/initiator models used.<br />
400<br />
The steering wheels used were the standard for use in the<br />
Ford 1985 Tempo/Topaz air bag equipped cars. It measures<br />
approximately I inch deeper than the standard Impala<br />
wheel, and therefor locates the wheel rim surface plane<br />
about I inch further aft in the occupant compartment.<br />
The knee bolsters used employed a steel tubing frame<br />
around the periphery ofits base which straddled the steering<br />
column. The inboard and outboard lowest ends of the frame<br />
were bolted through the horizontal lower instrument panel<br />
support of the Impala to retain the knee restraint in place.<br />
Twenty gauge sheet steel spanned the peripheral tube frame<br />
and served a$ the mounting surface for the energy<br />
management crushable foam as well as the bearing surface<br />
for knee load transfer into the Impala lower instrument<br />
panel. The crushable energy management material was a 3<br />
inch thick composite consisting of two lrlz inch thick foams<br />
of different materials bonded together. The top material (at<br />
the knee contact) wa$ two pound per cubic foot polystyrene<br />
foam and the bottom material was 6 pound density closed<br />
cell polyethylene, The upper layer which was slotted on its<br />
knee contact surface served the dual function of energy<br />
absorption and capture of the knee for controlled<br />
penetration. A vinyl cover was $ewn over the foam<br />
composite. A light weight brace was bolted between the<br />
inboard point of bolster attachment and the accelerator<br />
bracketry on the fire wall. This brace provided an inboard<br />
load path for knee load transfer from the instrument panel so<br />
as to avoid bending failure of the lower instrument panel<br />
support as had occurred in the first crash test of the Impala.<br />
To compensate for the extra I inch depth of the air bag<br />
steering wheel as compared to the original stock Impala<br />
wheel, the seat po$itioning in these sled tests were a$<br />
follows:<br />
5th percentile female...first seat rail notch aft of<br />
forward<br />
50th percentile male...first seat rail notch aft of<br />
midpoint<br />
95th percentile male...farthest rearward seat rail notch<br />
Most importantly, it should he noted that each air bag<br />
inflation was initiated only by activation of the Breed<br />
sensor| initiaror. The Breed all mechanical sensor/initiator<br />
responded only to the acceleration ofthe steering wheel on<br />
the sled buck. exactlv as it would in a real car crash.<br />
Sled Test Program Results<br />
Some general trends observed from the sled test are:<br />
l. In each ofthe sled tests, when the retrofit air bag<br />
system was added to the three point belt (lap plus<br />
shoulder belts), large reductions of the Head Injury<br />
Criteria (HIC) and substantial reductions in measured<br />
loads in the lap belt and shoulder belt occurred while<br />
satisfying all FMVSS 208 dummy injury measures.<br />
2. The all mechanical retrofit air bag system alone,<br />
when not supplemented by belts, satisfied all FMVSS<br />
dummy injury measurement criteria in the sled tests
when applied to the 5th percentile female<br />
anthropomorphic te$t device up to at least 30 mph, for<br />
the 95th percentile male anthropomorphic te$t device<br />
up to at least 35 mph, and for the 50th percentile male<br />
dummies up to nearly 40 mph.<br />
However, it must be emphasized that sled tests may<br />
provide optimistic evaluations of restraint $y$tem<br />
performance as compared to real car crashes resulting from<br />
the failure of sled testing to produce the passenger<br />
compartment intrusion so frequently found in real crashes.<br />
Such compartment intrusion can foreshorten the occupants<br />
forward travel within the compartment and can also cause<br />
higher impact speeds between the occupant and the interior<br />
intruding surfaces. Either of these intrusion effects would<br />
increase loads on the occupant.<br />
It must also be emphasized that an airbag system by itself<br />
does not provide significant protection for side impacts,<br />
rollovers, and many ejection situations. To provide<br />
protection in these other serious conditions, the air bag<br />
svstem must be combined with some form of seat belt. Also.<br />
Tabl6 4. $led tests ol lmpala retroflt EyEtrms Psrt 572 50th percentlle msle dummler.<br />
SITI^^IE AIR BI8<br />
CICST<br />
DRIER IESTNAIIT I'|88<br />
cn f,| $cE lHTlAIlil lltc<br />
t E. CUP<br />
AIR BtrC $Y$TEI flLY<br />
AIR BIB SYSTEII ilLY<br />
AIR NTG $Y$TEI + ITF EELT<br />
AtR B C 8YS. + l.|P & flfl.fl.DEt BETTS<br />
AIN BAG SY$. + IIP T $|f,'LDET BELIE<br />
LIP & SIfiIfDER IELTS fltY<br />
LTP EELT ilLY<br />
TOTATLY UNESTRAIH<br />
AIR I|lE SY5TEI flLY<br />
AIR BIE SYSTEII + LAP ELTS<br />
ATR IIG $YS. + ITF & EflJI.OEN BELTS<br />
TTP T SIHf,DER BELT$ ilLY<br />
TOTALLY IJTRESTRAIED<br />
AIN BAB SYSTET (TLY<br />
AIN BAE EY$TEI + LTP EELT<br />
LTP & TIflI-D€R 8ELI8 ilLY<br />
-<br />
fr<br />
tro Fll<br />
5{l Ftl<br />
]N IHI<br />
g) rfrl<br />
:n l?rl<br />
:10 prl<br />
l{l rprl<br />
gl Pfl<br />
36 Ftl<br />
5E ptl<br />
T' FII<br />
:[t prl<br />
55 rPtl<br />
40 f?H<br />
40 t?H<br />
40 pr<br />
zt ts.<br />
24 E.<br />
22 rG.<br />
58 t8.r<br />
e4 E.<br />
2a 18.<br />
?5 B.<br />
24 F.<br />
23 13.<br />
25 [s.<br />
since the kinematic and biomechanic fidelities of test<br />
dummies are imperfect, protection levels indicated in<br />
testing for the range of sizes in the human population should<br />
not be interpreted as precise. Additionally, the performance<br />
observed for the various restraint conditions tested in this<br />
Impala sled test buck may not be representative of other car$<br />
with other belt systems or when other air bag sy$tems are<br />
employed. The purpose of the sled test program was to<br />
provide basis for evaluation of the potential benefits which<br />
might be appreciated by police officers according to the<br />
range of their sizes and their restraint usage practices if their<br />
vehicles were retrofitted with the Breed air bag.<br />
Table 4 shows sled test data from all Part 572, Subpart B,<br />
50th percentile male dummies tested with the final design of<br />
the Breed all mechanical driver retrofit air bag system.<br />
From this table it is clear that the crash sensor function<br />
worked consistently well with the exception of the one<br />
sensor which used an obsolete and improper component in<br />
its assembly. Generally, when the proprietary computerized<br />
math model of the sensor mechanism was used to establish<br />
the anticipated air bag initiation time based on measured<br />
t44<br />
210<br />
t6{t<br />
Sllr<br />
?91<br />
85t<br />
7v<br />
661<br />
440<br />
Ir9<br />
415<br />
t$8<br />
1?a7<br />
Itc<br />
l7E<br />
tft<br />
6lcr<br />
39G<br />
39G<br />
7B<br />
9G<br />
IEFI ffi.R<br />
(Fd.58)<br />
tgfl<br />
ttSt<br />
741<br />
714r<br />
#7<br />
t7l<br />
w<br />
2506<br />
{cl 1214<br />
ilc<br />
5t{<br />
TIGIIT FTI<br />
(Fil.ffi)<br />
LATE ITITIATIfl REf,I.TED FROI USE Of II ffiil.ETE OII?IIEIT IT TIG A$$E5|.Y oF Tl: SEXSm C USltC BllSltC lr rEcll ilsll<br />
STEEIITG GOIJII TETIOFIT CLT|pTIG MTFIED TO Pf,OYIffi TM Fq.M ADOITIilAL STNtrIXC NESI$TATCE ABIilE MilAl RETNOFIT LEYET<br />
1E<br />
tilg<br />
tzn<br />
1n<br />
tlE<br />
fi9<br />
ll87<br />
tot<br />
tztt<br />
lTZ<br />
t7a<br />
r6tt6<br />
1695 1799<br />
788 il0<br />
{Et $ 1n<br />
401
steering wheel hub acceleration records, the predicted and<br />
actual measured deployment initiation times were in<br />
agreement within 2 to 3 milliseconds.<br />
Table 4 also provides driver test data allowing<br />
comparison between the protection offered by the retrofit<br />
air bag system when used alone, when used in combination<br />
with the Impala three point belt (lap plus shoulder belt), and<br />
when used as a supplement to a lap belt. This table<br />
additionally provides data from tests of the 50th percentile<br />
male driver restrained only by his lap and shoulder belts, by<br />
a lap belt only, and without any restraint. Since tests were<br />
conducted simulating frontal barrier crash speeds of 30<br />
mph, 35 mph, and 40 mph, the table demonstrates the<br />
influence of these crash speeds.<br />
In the tests simulating 30 mph crashes it is seen that the<br />
excessive chest accelerations experienced with the lap belt<br />
only (72G) and totally unrestrained driver (90G) are<br />
reduced to 39G by the three point belt alone but the three<br />
point belt also produced an undesired increase in HIC value.<br />
When the retrofit air bag system is introduced, either alone,<br />
or in combination with belts. the chest acceleration is seen<br />
to be at the same or a lower level than the three point belt<br />
produced when used alone, but each of the air bag<br />
combinations are seen to reduce HIC to one third or less of<br />
the value produced by the three point belt.<br />
Looking at the 35 mph barrier test simulations in table 4,<br />
without use of the air bag, FMVSS 208 head injury criteria<br />
is exceeded when the dummy is unrestrained or when<br />
restraint is provided only by the lmpala three point belt. The<br />
use of the air bag system alone or supplemented by lap or<br />
three point belts reduces the HIC to low levels with all other<br />
injury measures satisfying FMVSS 208 injury criteria in<br />
these 35 mph frontal barrier crash simulations.<br />
The 40 mph testing $hown in Table 4 demonstrates that<br />
the retrofit air bag system when used alone is almost a<br />
Table 5. Sled tasts ol Inpala retroflt systems Hybrld lll SOlh psrccntlle mEle dumml6$.<br />
DRII'ER RESTRAII{T I,SED<br />
AIR BAG SY$TEI.I OI{LY<br />
AIR EAG SYStFr,l OILY<br />
AIR BAC SYSTEI{ + LAP BELT<br />
AtR 8A6 SYS. + LAP & SHSJIDER BELT9<br />
LAP & $I{ULDER BEIT$ qItY<br />
TOTAILY UIIRESTRAIIED<br />
AIR 8AG SYSTEII + LAP BELT<br />
AIR BAS SY$, + I.AP & S|n'|JER BETTS<br />
402<br />
strutArED AIR BAIi<br />
CRASI{ SPEED IIIITIATIOII<br />
f0 lftl<br />
30 lpH<br />
I0 rffi<br />
30 t?H<br />
30 r?H<br />
30 rfH<br />
55 lfl{<br />
35 rf,H<br />
22 ris.<br />
2l rs.<br />
eu rc,<br />
1{0 DATA<br />
22 l4s.<br />
20 xs,<br />
satisfactory restraint for the 50th percentile male at this<br />
relatively high speed. When the air bag $ystem wa$<br />
supplemented by a lap belt, the dummy injury measures<br />
satisfied FMVSS 208 designations for the head, chest, and<br />
femurs.<br />
Sled tests conducted using the Hybrid III 50th percentile<br />
male dummy (Pat 572, Subparr E) provide an interesting<br />
illustration of the influence of a more compliant and<br />
biofidelic chest on the chest acceleration experienced by the<br />
dummy. Table 5 shows test results using the Hybrid III<br />
dummy in the driver position. In general injury measures<br />
from the Part 572, Subpart B, dummy (the only 50th<br />
percentile male dummy referenced for use in our standards<br />
before the advent of the Hybrid III) are seen to be in<br />
reasonably good agreement with those of the Hybrid III<br />
except for the chest accelerations which are lower in the<br />
Hybrid III tests. The most extreme difference occurred in<br />
the cases of the unrestrained occupant. The Part 572,<br />
Subpart B, dummy registered a 90G chest acceleration<br />
while the Hybrid III experienced 48G in the 30 mph tests. It<br />
should also be noted that all measures shown on table 5 for<br />
the air bag system, both alone and supplemented by belts,<br />
satisfy the injury criteria, including chest deflection<br />
limitations, even at 35 mph.<br />
Tests using the 95th percentile male dummy are shown in<br />
table 6. These data demonstrate dummy injury measures<br />
satisfying FMVSS 208 requirements at 30 mph and 35 mph<br />
when the air bag system is the only restraint employed for<br />
the large driver. It also illustrates satisfaction of FMVSS<br />
208 criteria at 35 mph when the air bag system is<br />
supplemented by lap or lap plus shoulder belts. For this<br />
heavier driver in the 35 mph test$ it can be noted that the<br />
supplement of the three point Impala belts with the air bag<br />
system reduced chest acceleration to 47G from the level of<br />
5 I G that was experienced when only the air bag system was<br />
oolFREsslsl CHEST<br />
Ittc cflEsr (tlcHEs) 3 lts. GLIP<br />
104<br />
263<br />
122<br />
183<br />
793<br />
586<br />
?ffi<br />
4ttc<br />
t.3<br />
e.0<br />
1.3<br />
1.5<br />
1.9<br />
?.8<br />
1.4<br />
1.9<br />
5es<br />
34G<br />
25c<br />
37c<br />
56c<br />
48G<br />
386<br />
5ZG<br />
LEFT FENN<br />
(Pil10$)<br />
856<br />
1144<br />
IIO DATA<br />
419<br />
e86<br />
2530<br />
644<br />
922<br />
RtBllT FEI'uR<br />
(PffOS)<br />
1275<br />
t 195<br />
IIO DATA<br />
249<br />
?63<br />
14t6<br />
602<br />
426
Tabl6 6. Sled teets of lmpala rstroflt systsma 95th percentlle male dummlee.<br />
DTIYER REETIAITT I'8EO<br />
ltneG$YgtEtfltt<br />
AIR BAB EYSTEI ilLY<br />
AIN ltB gfETH + LTP BELT<br />
AtR BAG 8YS. + lJlF I 8llll,oEr ELT$<br />
LAF & E|lOJltrEN BELTS ilLY T<br />
LAP & SIfrJLDER BELTS ilLY<br />
^IR BAG SY$TEI,I flLY<br />
ATR BAG SY$TEil + LAP BELT<br />
AIR BIG SVS. + IJP & SI(UI,DER BELTS<br />
stn uTED Att 8Ac<br />
GMSII SPEED IIITIATIfl IIIC<br />
t{l FH<br />
55 Fll<br />
l5 rfrl<br />
55 Frl<br />
15 FX<br />
S Ftl<br />
25 x$.<br />
21 rs.<br />
?4 r$.<br />
24 n8.<br />
employed. Use of the three point belt without air bag is<br />
shown to ptoduce an excessive HIC level of 1590.<br />
Results of sled tests with the 5th percentile female<br />
dummy are shown in table 7. These results illustrate<br />
satisfaction of FMVSS 208 in the 30mph simulated crash of<br />
the air bag system when used alone or in combination with<br />
the three point belt or lap belt as supplernentary restraint. It<br />
is of interest to note that the 5th percentile female dummy<br />
injury measures, if compared to FMVSS 208 requirements,<br />
indicate inadequate protection from the stock three point<br />
belt system when the belts are employed as her only<br />
restraint.<br />
Table I shows sled test results obtained when the retrofit<br />
air bag system is installed on a tilt wheel. The 50th<br />
percentile male dummy was used to investigate the<br />
con$equences of a tilt wheel adjusted to its maximum<br />
forward tilt position. From these results it is seen that<br />
adequate protection was provided under conditions of<br />
maximum forward wheel tilt, however, it is of intere$t to<br />
fiz<br />
tc8<br />
$1<br />
Et7<br />
1590<br />
HrEtt<br />
I t8. cttP<br />
tEc<br />
5tG<br />
T9G<br />
47c<br />
4E6r<br />
49c<br />
LEFT fEI.I<br />
(Pf,TDS}<br />
r SlflLDER EEII Bffi AY TllE TIIG YIC ETEERIIC HlEEl. tfifn lll CDTTTCTED TllE H.nfi AEDfltIt ETEERIIG Ootltfr 8TRfiE<br />
STARTE AT TIIC OF ICPA.FFER STEERIIG IIIEET NII flTIET<br />
Tabl6 7. Sled teste of lmp8la ratroflt ryrtema Sth percentlle female dummles.<br />
sI;J(ATED AIE BAG<br />
ORI\GR RESTRAIXT I'|SED<br />
cn sH EPEED nililATlolt HrC<br />
l0 ffH<br />
l0 tfH<br />
30 pH<br />
e5 HS.<br />
E xs.<br />
24 rs.<br />
LAP ^P SIHf,.DET BETIS OILY IO I"H 1635r<br />
1476<br />
t544<br />
519<br />
5lr4<br />
trg|r<br />
t94<br />
IIGIIT FET.N<br />
(Pim$)<br />
rtr57<br />
1772<br />
258<br />
{5r<br />
2E<br />
:t2s<br />
compare these results with those shown in table 4 under the<br />
same test speed conditions but with a stock steering wheel<br />
rim plane angle. The comparison is as follows:<br />
It is seen that the tilted wheel cases produced higher HIC<br />
and chest accelerations. It is believed that the air bag<br />
deployment which is directed on a higher trajectory as a<br />
consequence of the steering wheel tilt plane causes a<br />
reduced air bag interaction with the chest while increasing<br />
head loading. A similar influence is seen in comparing the<br />
chest accelerations in the ca$e$ of the tilted wheel when the<br />
air bag system is used as sole restraint and when it is<br />
supplemented by a lap belt. The lap belt supplement raised<br />
the chest acceleration when the wheel was tilted forward.<br />
whereas, in all cases tested with the steering wheel at a<br />
standard angle the lap belt supplement consistently lowered<br />
chest acceleration. With the lower deployment angle<br />
provided by the standard wheel angle, the air bag efficiently<br />
restrains the upper torso and head so that added lower torso<br />
and upper Ieg kinetic energy absorprion provided rhrough<br />
28<br />
585<br />
* F<strong>ONE</strong>.IGTD II?ACTED I.PFER RIT OF STEERITG IJIIEEL ATD THEI TIIE HIE<br />
57c<br />
LEFT F$TN<br />
(PqJps)<br />
J41<br />
N5<br />
re3<br />
&5<br />
RTGIIT FEIIJR<br />
(FOJIDS)<br />
725<br />
81<br />
97<br />
UE
Table 8. Speclal sled teste wlth 50th percentllG Part 572 nele dummles.<br />
SI I,I,JLATED<br />
DRII/ER RESTRAI}IT USED CRASH SPEED<br />
AIR BAG SYSTEII OiILY 50 I,IPH<br />
AIR B^G SYSTEI,I + LAP BELT 30 IIPH<br />
DRIVER RESTRAI}IT USED<br />
AIR BAG SYSTEI'I OILY<br />
HIC<br />
CHEST ACCELERATION<br />
Hrc 160<br />
CHEST ACCELERATION 3OG<br />
SIl.IJLATED<br />
CRASH SPEED<br />
30 l'lPH<br />
TILT TIHEEL STEERING COLU}IN TESTS<br />
SLEO TESTS COTIDUCTEO I'ITH }IA)(IIL{I,''I FORTIARD TILT OF UPPEN RIH<br />
AIR BAG<br />
I}IITIATIO{<br />
zA tls.<br />
?? irs. w6<br />
AilGtED BARRIER SLED TESTSIruLATION<br />
AIR BAG<br />
IIIITIATIOI<br />
26 irs.<br />
ua[ruuu-Brxlu.r<br />
restraining forces of the lap belt reduce the energy<br />
absorption required from the air bag and thereby reduce<br />
head and chest loading. With the tilted wheel, however, the<br />
occupant jack-knife phenomena produced by a lap belt<br />
changes upper torso angle into an already tilted air bag<br />
inducing an early air bag penetration at the steering wheel<br />
lower rim. Once the dummy chest is bottomed against the<br />
lower rim the radial stiffnes$ of the steering wheel rim plane<br />
induces higher chest loading than exists without the<br />
supplementary lap belt.<br />
One test was conducted with the crash pulse of a<br />
perpendicular frontal barrier crash but with the sled bu"k<br />
rotated l5o to the sled motion axis conservatively<br />
simulating a 30o angled barrier impact on the front left<br />
corner (driver side) ofthe car. The results ofthat test are also<br />
presented in table L Driver dumrny injury measures<br />
satisfying FMVSS 208 were recorded in this test of the air<br />
bag system without belt supplements. As can be seen in the<br />
table, air bag initiation occurred at 26 milliseconds during<br />
this te$t where the sled axis was 15" off the axis of the Breed<br />
sensor/initiator. This initiation time which is a few<br />
milliseconds later than that which the aligned crash sled<br />
simulations produced, reflects the directional sensitivity of<br />
the sensor.<br />
The influence of the retrofit air bag system on a driver<br />
restrained by a three point belt is of great interest. Table 9<br />
shows the results of matched test set$. Each set consists of<br />
two tests in which the sarnE dummy size was employed in<br />
tests at the same speed. In the first test of each set only a<br />
three point belt (lap plus shoulder belts) was used to restrain<br />
the driver, while in the second, both the three point belt<br />
404<br />
NOR.I.IAL RII'I ANGLE<br />
144 & 210<br />
35G & 37G<br />
316<br />
43G<br />
296<br />
54G<br />
HIC<br />
516<br />
HIC<br />
CHEST<br />
5 ilS. CLIP<br />
43c<br />
54G<br />
CHEST<br />
5 lrs. CLIP<br />
37G<br />
LEFT FEiUR<br />
(PflJilDS)<br />
1425<br />
LEFT FEI.I,JR<br />
(PflJNDS)<br />
1285<br />
RIGHT FEiIUR<br />
(POUNDS)<br />
15n<br />
398<br />
RIGHT FEI{UR<br />
(FCIJNDS)<br />
1 132<br />
system and retrofit air bag system were simultaneously<br />
employed. The two most important functions of the air bag<br />
system as supplement to the three point belts are seen to be<br />
the consistent large reductions in the threat ofhead injuries,<br />
as evidenced by the head injury criteria (HIC) values<br />
obtained, and the reduction of loads in the lap and shoulder<br />
belts. The large reductions of HIC provided by the air bag<br />
system supplement to the three point belts is clearly an<br />
advantage. The torso belt load reductions produced with the<br />
air bag system are also of particular interest since some of<br />
the early research with belt sy$tems indicated strong<br />
correlation between numbers of rib fractures produced and<br />
measured torso belt load (reference 2). As is shown in this<br />
table the reduced torso belt loading provided by the air bag<br />
system supplement is substantial, averaging over 407o in<br />
these tests.<br />
Impala Car Crash Tests of Final<br />
System<br />
A series of five Impala crashes were conducted at the<br />
Transportation Research Center of Ohio utilizing the final<br />
design configuration of the Breed retrofit driver allmechanical<br />
air bag system. The tests consisted of two<br />
frontal fixed rigid barrier crash tests at 30 mph, a centered<br />
frontal pole crash at 30 mph, a 30 mph right front corner<br />
impact into a 30" fixed rigid barrier, and a 35 mph frontal<br />
fixed rigid barrier crash. Except for the car used in the first<br />
test, during test preparation the vehicles were subjected<br />
only to the Impala retrofit operations developed for<br />
installation of the Breed all mechanical retrofit driver air<br />
bag system. The test dummy in each of these crash tests was<br />
an unbelted 50th percentile male Part 572, Subpart B,<br />
placed in the driver position.<br />
The test car for the first demonstration crash of the final<br />
design air bag system was a l98l model year Chevrolet<br />
Impala. After purchase of this used car, the tilt wheel
Table 9. SIed tests of lmPsla retrollt tystomr alr bag system Influonco on performance ol thraa polnt belt.<br />
DRIVER RESTRAI}IT USEO<br />
SIIIULATED<br />
CRASH SPEED<br />
LAP & SHCIJLDER<br />
BELTS OILY 30 IiIPH<br />
AIR BAG SYS. + LAP & SHf,JLDER BELTS 30 IIPH<br />
LAP & SHCIJLDER<br />
BELTS O{LY 35 IIPH<br />
AIR BAG sYS. + LAP & SHqTLDER<br />
BELTS j5 ;.;pH<br />
LAP & SHflJLDER<br />
BELTS OILY<br />
AIR BAG sYs. + LAP & SHflTLDER<br />
BELTS<br />
LAP & SHflJLDER<br />
BELTS OILY<br />
AIR 8AG sYs. + LAP & SHf,TLDER BELTS<br />
50 HPH<br />
50 tlPH<br />
35 tiPH<br />
35 l,lPH<br />
LAP & SHCIJLDER<br />
BELTS O{LY 30 I,IPH<br />
AIR BAG SYS. + LAP & SHOJLDER BELTS 30 I,IPH<br />
steering column, which was its original equipment, was<br />
removed and replaced with a non-tilt wheel steering<br />
column. Normal air bag retrofit operations were then<br />
followed during the subsequent installation of the air bag<br />
system. The frontal barrier test was conducted at a measured<br />
impact speed of 30.0 mph. Posr rest srudy of the high<br />
framing rate camera film revealed anomalies in the function<br />
of the energy absorbing steering column which had been<br />
installed as a replacement. The column end closest to the<br />
driver was clearly shown in the test frlm during the crash<br />
eyent. The film revealed that the steering column dropped<br />
downward towards rhe dummy's lap during the initial air<br />
bag deployment sequence, prior to subsrantial loading. This<br />
observed motion indicates that the steering column broke<br />
free of the shear capsule much earlier and at lower load than<br />
had been observed in any earlier or subsequent test.<br />
Furthermore, the interval of column stroke extended over<br />
only approximately 25 ms., whereas, a 40 ms. stroke time is<br />
CHEST LAP BELT SHCIJLDER BELT<br />
HIC 3 l'ts. CLIP (PCITNDS) (FCuilDS)<br />
5OTH PERCEIITILE IIATE DI,I,I.IY . <strong>PART</strong> 572 SIJB<strong>PART</strong> B<br />
855<br />
29,|<br />
I 158<br />
415<br />
39G<br />
39c<br />
51c<br />
54G<br />
re61<br />
6?8<br />
SOTH PERCEIITILE IIALE DUIiI,IY . HYBRID III<br />
793<br />
185<br />
95TH PERCEIITILE IIALE rull|Y<br />
r590<br />
817<br />
56c<br />
38G<br />
49G<br />
47c<br />
2456 ,<br />
1452<br />
1431 249t3<br />
.|129<br />
t15Z<br />
lB09 7l,4/<br />
978 1416<br />
2272<br />
1500<br />
'TH PERCEIITTLE<br />
FEMLE DUITIIIY<br />
1635 57c 5U+<br />
585 5tG 476<br />
2240<br />
1826<br />
1920<br />
961<br />
the characteristic timc observed in other 30 mph frontal<br />
tests. It is strongly suspected that the steering column<br />
replacement performed prior to the air bag system retrofit<br />
introduced uncharacteristic column stroking response<br />
during which significantly less driver kinetic energy was<br />
absorbed within the column stroking mechanism. The<br />
dummy injury measures were therefore suspected to be non<br />
representative of the retrofit air bag system and a repeat of<br />
the test was deemed necessary.<br />
The results of this first test are shown in table 10. Also<br />
shown on this and subsequent Hbles ofcrash test results are<br />
the measured times of inflator initiation and the predicted<br />
initiation time based on the Breed proprietary mechanical<br />
sensor math model. To obtain prediction from the Breed<br />
model the steering wheel hub acceleration time history<br />
measured during the crash test was used as the input<br />
excitation to the model. Dr. David Breed had permanently<br />
encoded the design pflrameter$ of the Breed sensor used in<br />
405
the NHTSA sponsored work before the math model<br />
computerized program was supplied to the Govemment<br />
technical manager. The proprietary parameter values in the<br />
executable only program include the weight of the sensing<br />
mass sphere, the spring con$tant of the biil$ spring, the<br />
initial bias spring force and corresponding bias acceleration<br />
on the sensing mass, the travel required to trigger the firing<br />
pin, the diameter and clearance of the sphere within the<br />
interior bore of the cylinder within which the sphere must<br />
move the prescribed amount to produce triggering, and the<br />
various geometrical locations and dimensions of the "D"<br />
shaft and levers within the sensor/initiator. Based on the<br />
input acceleration history the model establishes the<br />
Reynolds number of the air flow passing thru the annular<br />
type orifice between the sensing sphere and cylinder wall in<br />
order to establish the presence of laminar or turbulent flow<br />
and the air velocity for determination of air damping<br />
retarding the sphere's motion. The math model output<br />
includes the sensor/initiator firing pin release time which it<br />
calculates based on the characteristics of the crash pulse<br />
which is input. Acceleration measurements shown for the<br />
chest are maximum 3 millisecond duration values (3 ms.<br />
clip).<br />
A second frontal rigid barrier crash test was conducted at<br />
an impact speed of 30.2 mph. The test car was a 1983<br />
Chevrolet Impala. As in the first and all subsequent car<br />
crash te$ts, no belt restraints were employed on the 50th<br />
percentile male dummy which was in the driver position.<br />
The Breed air bag $ystem performance was the same as had<br />
been demonstrated in the sled tests. In this crash test the data<br />
from the fore-aft acceleration of the head center of gravity<br />
was not recovered beyond 9l millisecond$ after crash onset.<br />
This prevented an accurate determination of the head injury<br />
l98t ll?ArA<br />
lqtfE il.fALA<br />
l98B il?ALA<br />
I9f,E IIPALA<br />
*<br />
FRilIAL FIXED RIGID SANRIER 50.? I?II<br />
CEIITERTIIIE FOTE E9.E I?R<br />
1I{I DECREE FRilTAI BARRIER 30.? }fII<br />
FROTTAT fIXED RIEIb FAIRIER !5.0 I"H<br />
criteria (HIC), but an estimate based on similarity of head<br />
acceleration in sled and crash measurements prior to<br />
channel loss in the crash test was made and is shown on table<br />
I l. Table I I also contains the test data from the center line<br />
pole crash, the 30" angled fixed rigid barrier with the initial<br />
barrier contact on the front right comer of the bumper, and<br />
the 35 mph frontal fixed rigid barrier crash. The data shown<br />
illustrates that head, chest and femurs are provided good<br />
protection in the 30 mph crashes into the front and angular<br />
rigid barriers as well as into the rigid pole impacting on the<br />
car centerline. The 35 mph frontal barrier crash dummy<br />
injury measures indicate satisfactory head and femur<br />
protection with a marginal protection of the chest. The car<br />
preparation for the pole impact did not include and<br />
additional bumper stiffening such had been added to the<br />
Ford LTD in the earlier evaluation of mechanical sensor<br />
feasibility.<br />
It should be noted that the inflator initiation times<br />
measured in these varied crashes demonstrate the Breed<br />
sensor characteristic of quicker response foi the more<br />
violent crash pulses experienced in the 30 and 35 mph<br />
frontal rigid barrier crashes with later responses in the<br />
slower onset pulses of the pole crash and the angular barrier.<br />
Inflator initiation times of 62 ms. in the pole crash and 32<br />
ms. in the 30o angled barrier crash are significantly later<br />
than occurred in the frontal fixed rigid barrier tests. Despite<br />
the later air bag deployments in these slower onset crash<br />
pulse tests, it is clear from the dummy measures that a driver<br />
would be provided good protection. This is a natural<br />
consequence of the sensor/initiator responding only to the<br />
acceleration present in the occupant compartment which,<br />
not by chance, besides producing the triggering of the<br />
inflator also produces the unrestrained driver's motion<br />
Tsble 10. Flrst demonatrrtlon crash t6$t ol Breed r€trofit drlver alr bsg Eystem with suspect ateerlng column tunctlon'<br />
CAR TESTED CNA$[ COIIDITIOI{ CSASI{ SPEED |TC CHE$T L. FEN'R R. FE]IJI II{FI^TM ITITIATIOTI IMEI PREDICTIO{<br />
19Bl II?ALA FROI{TAI FIED RrGIp BARRTER :m.0 HPll xl|* 59 G 13:t0 tB, 1m0 tB. 31 ts. :t0 lr$,<br />
r lllc cstculEtim cor.rtd rut b6 [l8d€ dJc to 1068 of vcrtlcal head exis rceclcrutlon det8 in t68t'<br />
Table 11. Reeults of tlnsl demon$tratlon crs8h t€Ets of Breed retloflt drlvsr air beg $ystem.<br />
C,AN TE$TS CRABI{ OETDITIilI CRASII SPEED IIIC CIIESI t. fEilN R. FEIi'R ItFtAt* trllTl^ttofl lfDEt PtEDtcTIill<br />
t3l<br />
E<br />
58it<br />
ilt6<br />
4eG<br />
21 c<br />
1??0 rB.<br />
1220 LB.<br />
7:t0 LB.<br />
1470 LB.<br />
1450 LB,<br />
t(60 tB.<br />
6{t G 1750 LB. 1260 LB,<br />
20 ils.<br />
25 rS. 23 lts.<br />
62 l{S. 6t tG.<br />
Foru-rft hcrd *crtlretlq'r rccord toft rfter 9l [8, th|,E pre,vEhtlng pr€ci8e ilc dotcminrtlorr. E6sid ori einiterity to<br />
hrd eccclrrrtlotB In pilor stGd tcstirE, Gxtr+otrtloh of thG drts pr8t 91 |B, prorddct r Hlc of sbot t ioo.<br />
32 t+$. l{0T cALcutATEo<br />
20 HS,
within the compartment prior to air bag deployment.<br />
Therefore, in theory and as demonstrated in these resrsr an<br />
air bag deployment which is timely for driver protection can<br />
be produced based on the accelerations present in the<br />
passenger compartment. The car crash testing conducted in<br />
this program was insufficient to confirm with great certainty<br />
that the unique sen$or response characteristics designed<br />
into this retrofit driver air bag module are indeed<br />
appropriate to a$sure timely deployment and resulting<br />
adequate driver protection under a// real world crash<br />
configurations for which air bag protection may be<br />
desirable.<br />
Off Road Car Testing<br />
A series of rough road tests were performed at the<br />
Transportation Research Center of Ohio on a l9g3<br />
Chevrolet Impala to determine under what marginal<br />
conditions a Breed air bag module would deploy. The repon<br />
of the te$ts conducted was written by the engineer who<br />
drove the test car, Mr. Robert C. Esser (reference 3). The test<br />
driving surfaces are well described in his report and include<br />
cobblestone road, staggered bumps, single bump, potholes,<br />
and a small and large earthen ditch. Progressively severe<br />
conditions were imposed on the car by conducting the<br />
passages at increasing speeds. Finally, deployment was<br />
indicated in a 20 mph impact of the front bumper into the<br />
vertical end of the large ditch which consisted mainly of<br />
hard packed clay. In addition to the severe bumper mount<br />
distortion created in the final sequence of large ditch tests<br />
other damage was also produced. A significant sheet metal<br />
crease wa$ produced on the left front fender over the wheel<br />
well and the right front fender was pushed t/z inch rearward.<br />
Subsequent inspection revealed a cracked radiator fan<br />
shroud and wrinkling of the left inner fender.<br />
The test driver who was wearing a wide web four point<br />
belt restraint offers the following opinion in his written<br />
report; --The air bag actuation threshold at any higher level<br />
could result in unacceptable discomfort or injury to the<br />
driver even with use of the production three point seat belt<br />
$ystem." This opinion, although admittedly subjective, was<br />
provided by an experienced engineer in the area of crash<br />
research and testing who is the only person known to have<br />
experienced threshold deployment conditions with the<br />
Breed air bag module installed. Since no acceleration<br />
measurements were made during this test series and movie<br />
coverage was minimal, the change of car velocity in the<br />
deployment event can only be estimated, and that estimate is<br />
approximately l0 mph with an upper limit value of l5 mph.<br />
Environmental Qualification Testing<br />
An environmental exposure and test series which was<br />
typical of qualification testing for air bag gas generators<br />
employed by car manufacturers was conducted on Breed/<br />
Thiokol inflator modules which housed the all mechanical<br />
pyrotechnic sensor/initiators in addition to the normal gas<br />
generator constituents (reference 4). After reme-<br />
dial design implementations to correct deficiencies which<br />
were discovered early thru preliminary exploratory environmental<br />
testing, and a great deal of difficulties controlling<br />
shaker test equipment outputs to insure that desired test<br />
exposure extremes were not exceeded, the qualification<br />
program was completed. The program demonstrated the<br />
Breed sensor/initiator calibrations to be unaffected by the<br />
extensive expo$ures to vibration, thermal and mechanical<br />
shock, humidity, and temperature<br />
extremes which were<br />
used in the qualification test series. The gas generating<br />
characteristics<br />
of the inflator were also shown to be satisfac-<br />
tory after these environmental qualification exposures (reference<br />
5). There was, however, a determination from a<br />
special testing program conducted by the Indian Head Naval<br />
Ordnance Station, that the originally specified maximum<br />
temperature for long term exposure jeopardized sub-<br />
$equent reliability of inflator function. It was established<br />
that 105"C (22loF) desensirized rhe stab primers which<br />
must function as the first element in the pyrotechnic chain of<br />
inflator ignition. 90"C ( 194"F) was found ro be a safe limit<br />
for the cumulative 88 hour exposure employed in qualification<br />
testing which would not degrade system reliability<br />
(reference 6).<br />
Conclusions<br />
The Breed retrofit driver protection air bag system has<br />
been evaluated in this program. The system has been refined<br />
and perfected during the course of this work. Some significant<br />
improvements in design and function were achieved as<br />
a consequence. The initial concept and design of an all<br />
mechanical sensor/initiator integrally housed within the<br />
body of an air bag inflator was shown to be feasible. It was<br />
demonstrated that timely air bag deployments could be<br />
achieved without the use of multiple crash sensors located<br />
in the front end of the car and without expense and complexity<br />
of reliance on electronics fortimely crash severity recognition<br />
and air bag deployment intitiation.<br />
This program has demonstrated that:<br />
( I ) Good frontal crash protection is provided to the<br />
driver under all of the crash conditions tested and at<br />
crash speeds<br />
in excess to those which the Impala belt<br />
system can provide adequate protection.<br />
(2) The air bag sysrem performs well with belr sys-<br />
tems and provides enhancement<br />
to the protection offered<br />
by the belts atone.<br />
(3) The retrofit system provides good accomodation<br />
and protection ro the wide range of potential driver<br />
sizes.<br />
(4) The sensor function which distinguishes need for<br />
air bag deployment is immune to the effects of environmental<br />
exposures,<br />
(5) When the inflator is tested in the configuration of<br />
a car installation, the inflator design provides adequate<br />
protection from moisture to its pyrotechnic contents.<br />
(6) The primers within the Breed sensor/initiator<br />
407
suffer a loss in reliability when exposed to<br />
temperatures above l94oF (90'C) for a period of 88<br />
hours,<br />
References<br />
(l) Stultz, J., (Transportation Research Center of Ohio)<br />
"Bumper Tests", Report Number 840608' July 1984'<br />
Vehicle Research and Test Center, East Liberty, Ohio.<br />
(2) Eppinger, R.H., (National Highway Traffic Safety<br />
Administration)<br />
"Prediction of Thoracic Injury Using<br />
Measurable Experimental Parameters '" Report On The<br />
Sixth I nternational Technical C onference on Experimental<br />
Safety Vehicles (October 1976) DOT HS 80? 50l-<br />
(3) Esser, R.C., (National Highway Traffic Safety<br />
Administation)<br />
"Breed Airbag Program Rough Road<br />
Driving Tests," Report No. RD 38'H, September 1985,<br />
Vehicle Research and Test Center, East Liberty, Ohio.<br />
(4) Schneiter, F.E., (Morton Thiokol Inc.) "Test Plan For<br />
Environmental Simulation And Evaluation Testing of<br />
Inflator with Breed Sensor," Doc. No. UFR-1208(C)'<br />
Morton Thiokol Inc., Utah Division'<br />
(5) Schneiter, F.8., (Morton Thiokol Inc') "Final<br />
Report-special Test Program-Morton Thiokol Inflator<br />
with Breed Mechanical Firing Device" NHTSA Program<br />
No. DTNH22-87-P-01432, Morton Thiokol Inc', Utah<br />
Division.<br />
(6) Michienzi, M., (Indian Head Naval Ordnance Station)<br />
"special Test Report For The Breed Corp. Stab Detonator,"<br />
Report Number STR86006, April 1987, Ordnance Devices<br />
Department, Naval Ordnance Station, Indian Head, MD.<br />
Design of a Crash Attenuation System for a Lightweight Commuter Car<br />
Written Only Paper<br />
L. Glen Watson, P. Barry Hertz, and<br />
Dean L. Beaudry,<br />
University of Saskatchewan<br />
Abstract<br />
Nexus I is a single Passenger, three-wheeled, highly fuel<br />
efficient, lightweight vehicle which was developed with<br />
funding by the Canadian Department of Transport, at the<br />
Univeriity of Saskatchewan (1, 2,3)*' Unlike most safetyoriented<br />
vehicles Nexus was designed with high fuel<br />
transport efficiency (4) as the primary objective- Nexus<br />
was, in addition, developed to comply with the intent of the<br />
Canadian Motor Vehicle Safety Standards (CMVSS) for<br />
passenger cars. This design orientation has led to a very<br />
unique vehicle that tries to combine two attributes that are<br />
widely regarded as incompatible: safety and fuel<br />
conservation. This paper deals primarily with the design of<br />
an unusual feature of Nexus, the nose mounted Crash<br />
Attenuation System (CAS). This crash attenuation system is<br />
designed to protect the frame of the car and hopefully the<br />
passenger from any damage in a frontal collision.<br />
Design Considerations<br />
In the Canadian automobile crash environment the<br />
largest number of cars are subject to frontal collisions (5).<br />
This suggests that there should be a very large payoff in<br />
protecting against impacts from the front. Since only one<br />
prototype of Nexus was being built and because the<br />
designers wished to comply with the CMVSS frontal<br />
collision standards with regard to passenger protection, it<br />
was decided to add an energy absorbing device to the nose<br />
I Nexus is defined to he a connection in a linked Sroup or series.<br />
*Numbers in parentheses dcsignate reference$ at end of papcr.<br />
408<br />
of the vehicle. In the event of a frontal crash this energy<br />
absorbing device would bring the car and the passenger to a<br />
controlled stop from at least 48 kmlh, without decelerating<br />
the frame of the vehicle in excess of 30 "g's".<br />
This deceleration level was chosen since a finite element<br />
analysis of the frame of the vehicle had indicated that the<br />
frame would not yield under a 30 "g" deceleration- The<br />
aerodynamic profile of the vehicle, structural considerations<br />
and anthropometric constraints combined to limit the<br />
energy adsorption device to a length of 0.71 meters. Further,<br />
if one assumed that the device had the shape of a right<br />
parallelepiped it would have to fit in a space 0.25m by<br />
0.35m by 0.7Im. The mass of Nexus and the driver was<br />
estimated to be 410 kg and the CMVSS required that the car<br />
should be tested in a 48 km/h barrier collision. A final<br />
constraint on the design was the proposal by Rauser (6) that<br />
the ideal form of acceleration pulse is an initial peak<br />
followed by a square wave as shown in figure l -<br />
Deflection<br />
Flgure 1. A stepped square wsve responae.
Possible<br />
Crash Attenuation<br />
Mechanisms<br />
The design problem thus became one of finding some<br />
way to absorb (48 km/h)z X al0kg/2 or 472X l0e Newton<br />
meters of energy in rhe CAS 0.25m by 0.35m by 0.7Im or<br />
0.062 cubic meters in volume. As Nexus was being<br />
designed to be a lightweight vehicle, the enargy absorbing<br />
system was also required to be Iight in weight. During the<br />
design, three types of systems were considered in depth.<br />
The candidate systems were:<br />
l. a yielding -'diamond" linkage (7),<br />
2. a rigid polyurerhane foam "nose" (B), and<br />
3. an aluminum honeycomb<br />
..nose" (9).<br />
Simulations of the linkage indicared rhat it could easily<br />
absorb the required energy. However, there were suspicions<br />
thar the Iinkage might fail by buckling wirh liille or no<br />
energy absorption. In addition, the required attachment$ to<br />
the frame would have necessitated some changes to the<br />
"rigid"<br />
bulkhead at the front of the frame.<br />
The proposed foam nose was to be built from layers of a<br />
locally manufactured rigid polyurethane insulation. The<br />
foam nose CAS appeared to be an attractive choice since it<br />
would result in a low mass, economical, energy absorbing<br />
device. Many of the advantages of the foam nose were<br />
shared by the aluminum honeycomb design; however, the<br />
design team initially felt that aluminum honeycomb would<br />
be unduly expensive. Eady in the construction phase ofthe<br />
vehicle u decision to use the rigid polyurethane foam as a<br />
CAS was made.<br />
The first problem encountered in the design of the rigid<br />
foam CAS was to determine its material properties. The<br />
foam stiffness was found to be rate sensitive and temperature<br />
sensitive; further, it was found to have two disparate failure<br />
modes in compression (8).<br />
Under normal temperature conditions the marerial failed<br />
by a plastic buckling of the cell walls. For temperatures<br />
below the glass transition temperature the material failed<br />
through a brittle failure of the cell walls. Figure 2 illustrates<br />
the temperature dependence of the material, It was<br />
determined that in spite of the temperature and velocity<br />
dependencies it would srill be possible to build a CAS from<br />
the rigid polyurethane foam.<br />
The first barrier impact test$ were done on quarter scale<br />
models and these indicated the foam system was feasible, It<br />
was noted however that the force displacement curve did<br />
not have the ideal shape shown in figure L Instead, the force<br />
irtcreased very gradually. This was due to the fact that the<br />
front of the CA$ had a much smallerarea than the back since<br />
it was built to fit into the aerodynamic shell of Nexus.<br />
The next step was the full scale testing of the CAS. This<br />
testing was done at the University of Saskatchewan<br />
pendulum testing facility ( I | ). The full scale resr was only a<br />
partial success. The energy absorbed was as large as was<br />
specified in the initial design, unfonunately the car was<br />
heavier than was anticipated when the CAS was designed.<br />
a rro<br />
J<br />
;<br />
rf uo<br />
vl<br />
g l,l<br />
1t<br />
T<br />
F 200<br />
160<br />
Stndnrufe,i (/rn)<br />
fleure.2.<br />
Deelgn curygq relettng straln_ rar€ and temperature<br />
dependence of one rlgld, cloeedcell polyurethane.<br />
After the CAS had absorbed the design energy, it effectively<br />
bottomed out and the acceleration rate exceeded 30 g's. In<br />
addition, the CAS exhibited a large amount of ..spalling<br />
off " of material which was not yet loaded and hence had not<br />
absorbed a significant amount of energy.<br />
The next stage of the CAS development was to build<br />
quarter scale models of aluminum honeycomb. To avoid the<br />
problems associated with the tapering of the CAS, the<br />
aluminum honeycomb CAS was made in the form of a right<br />
parallelepiped. The one quarter scale models performed<br />
flawlessly. The scaled energy was absorbed and the CAS<br />
was deformed uniformly. Finally, full scale models of the<br />
CAS were built and tested; unfortunately, the tests were<br />
only a partial success. The quarter scale models had been<br />
made from either a single sheet of honeycomb or from two<br />
sheets bonded together. Due to cost constraints it was<br />
decided to construct the full scale CAS from four layers of<br />
honeycomb with layers of fiberglass and polyester resin<br />
between them. This arrangement proved to be barely stable<br />
and in some of our impact test$ one of the interior layers of<br />
honeycomb was extruded laterally almost intact and it<br />
absorbed almost no energy (figure 3).<br />
The remainder of the CAS did not have enough material<br />
to absorb all of the energy and once again the CAS bottomed<br />
out undcr the load. However, in other experiments the Crash<br />
Attenuation Systems which remained stable under testing<br />
Flgure 3. Fallure of an unstsble GAS.
easily absorbed all of the required energy' Figure 4 shows<br />
the acceleration deflection curve for an aluminum honeycomb<br />
CAS; as can be seen the CAS performed very well'<br />
The dip in the midpoint of the curve was probably<br />
associated with some lateral motion of one of the<br />
honeycomb layers. It is believed that the instability could be<br />
removed by using a single thicker layer of honeycomb.<br />
Drcdil{fmrutrrllmr<br />
lc tull slt dynamh trtr of r,hrminurn ltFnc:|Gsrlb<br />
ena rdid p6fu-rttfrhiit-Fim qrrrgf abmrtiry tilnrPff moddr<br />
g<br />
Floure 4. Deceleratlon veraua Time tor full scale te$ts of rlgld<br />
poTyurethane fosm and alumlnum honeycomb modele.<br />
Conclusions<br />
In this paper we have introduced the idea of a nosemounted<br />
crash energy absorber which would limit the<br />
deceleration to the frame of a vehicle in the event of a barrier<br />
collision. The work that we have presented demonstrates<br />
that such a safety feature can be added with very little<br />
increase in the mass of the vehicle. In addition to mechani<br />
cal linkage systems, rigid polyurethane foams and<br />
aluminum honeycombs show good promise of providing<br />
adequate crash protection.<br />
References<br />
(l) Eichendorf, R., Gerwing, D., Hertz, P.8., "Design of<br />
the Nexus Vehicle", <strong>Int</strong>. J. of Vehicle Design (to appear).<br />
Passenger Car Crash Worthiness in Moose/Car Collisions<br />
Written Only Papers<br />
P. Ltivsund, G. Nilson, M. Y. Svensson,<br />
Chalmers University of Technology, Sweden<br />
J. G. Terins,<br />
Volvo Car Corporation, Sweden<br />
Abstract<br />
This paper describes the development and verification of<br />
a moose-dummy for testing the crash worthiness of cars in<br />
moose-car accidents.<br />
410<br />
(2) Beaudry, D.L., Hertz, P.B', and Watson, L'G.<br />
"Construction of the Nexus Vehicle", <strong>Int</strong>. J. of Vehicle<br />
Design (to appear).<br />
(3) McEachern, R.A., Watson, L'G', Hertz' P.B"<br />
"Predicting the Strength of Welded Aluminum Structures",<br />
Transactions of the Society of Automotive Engineers 1988<br />
Paper No. 880902.<br />
(4) Hertz, P.8., "Technical Aspects of Transport Energy<br />
Efficiency" Department of Mechanical Engineering'<br />
University of Saskatchewan, July 1982.<br />
(5) Transport Canada Report TP948CR7705,<br />
"Impact<br />
<strong>Conf</strong>igurations and Severities in Canadian Passenger<br />
Vehicle Collisions".<br />
(6) Rausern M., "Energy absorbtion of passenger car<br />
body structures made of steel and aluminum", <strong>Int</strong>' J' of<br />
Vehicle Design. Special Issue on Vehicle Safety, 1986 pp.<br />
l r3-128.<br />
(7) Gerwing, D.H., Hertz, P.B., "Phase l-Report<br />
Design of 'Nexus' Vehicle Transport Canada" Contract No'<br />
osv83-00060.<br />
(8) McEachern, R.A., Sargent, C.M., and Watson, L.G',<br />
"Observations on the Material Properties of Low Density<br />
Rigid Polyurethane Foam" submitted to Materials Science<br />
and Engineering.<br />
(9) McEachern, R.A., Watson, L.C., and Hertz, P.8.,<br />
"Frontal<br />
Crashworthiness Modelling of a Lightweight<br />
Commuter Car" Presented at the Winter Annual Meeting of<br />
the American Society of Mechanical Engineering, Boston,<br />
Mass.. December 13*18, 1987. Published in Trends in<br />
Vehicle Design Research 1987, ASME DE- Vol. l l pp. 53s9.<br />
(10) Beaudry, D.L., Watson, L.G. and Hertz, P.8., "The<br />
Application of Finite Element Modeling in the design of a<br />
Crash Attenuation system for a Lightweight Commuter<br />
Car" Proceedings of the 4th <strong>Int</strong>ernational ANSYS<br />
<strong>Conf</strong>erence, May l-5, 1989, Pittsburgh, Pennsylvania.<br />
(ll) Ken, D., Fischer, T., Werle, S., Hertz, P.B. "Full<br />
Scale Crash Testing Facility for Lightweight Vehicles" <strong>Int</strong>.<br />
J. of Vehicle Design (to aPPear)'<br />
The dummy is based on and verified against the results of<br />
a staged collision in which a passenger car impacts a moose<br />
cadaver. The cadaver test is also described in the report.<br />
Moose-car accidents contribute to about 2 percent of the<br />
death casualties in the Nordic road traffic and the type is<br />
even more represented among slighter injuries. Since<br />
several attempts to reduce the frequency of moose-car<br />
accidents have proved to have minor effect improvements<br />
of the crash worthiness of passenger cars in this kind of<br />
impact might be desirable.
<strong>Int</strong>roduction<br />
The Scandinavian moose, sometimes also called elk. is a<br />
huge member of the deer family. A new-born moose weighs<br />
about l0 kg and a full grown male might, in rare cases,<br />
weigh up to 1000 kg but wirh an average of between 300 and<br />
400 kg.<br />
In other words this wild animal is almost as heavy as a<br />
horse and of similar size but has longer and slimmer legs.<br />
This means that when an ordinary passenger<br />
car impacts a<br />
moose, only a negligible part of the animal's mass will be<br />
struck by the strong, frontal part of the car. Most of the<br />
animal's mass instead will be impacted by the windshietd<br />
and roof construction. Car-moose collisions occur in the<br />
countryside, on roads with speed limits in the range of 7()-<br />
I l0 km/h. Requirements on unobstructed field of view and<br />
modern styling trends have made many cars inadequate to<br />
withstand such an impact.<br />
The animals are well hidden in the vegetation and do<br />
often enter the road very swiftly and without warning.<br />
Cautiousness and driving experience thus offer poor<br />
protection against this type of accident. Passenger car-<br />
moose collisions contribute to about ZVo of the death<br />
casualties in the Nordic road traffic (l), (2).*<br />
Different attempts to prevent the accidents have been<br />
undertaken. The most important are:<br />
r Trees and bushes along the roadsides of the major<br />
roads have been cut down to give clear sight a few<br />
meters on each side of the road.<br />
Road signs have been put up in order to wam the<br />
drivers at places where the animals are known to<br />
cross frequently.<br />
r Wildlife fences have been mounted along such<br />
parts of the major roads where moose most<br />
frequently cross.<br />
The first two methods $eem to have slight effect. The<br />
third method has provcd to be efficient, but is rather<br />
expensive. The animals change habits and find new places<br />
to cros$ the roads.<br />
It has become obvious that improvement of the crash<br />
worthiness of passenger cars in this type of accident would<br />
be a better way to decrease the numbers of killed and injured<br />
road users. This has been observed by the Swedish<br />
authorities and in lg82 a working group was established<br />
with the official research institutions and the car<br />
manufacturers.<br />
A moose-dummy was assembled and crashtests were<br />
conducted (3). Although obtaining valuable dara from rhese<br />
tests the group decided in 1985 that an improved moosedummy<br />
was needed for the future work. This paper<br />
describes the development of the latter dummy.<br />
Materials and Methods<br />
This project can be divided into two sections:<br />
(l) A staged collision with a passenger<br />
car impacting a<br />
*Numtrrs in prrenthe$cs dcsignate references at cnd of paper<br />
moose cadaver in order to get insight into the mechanisms of<br />
moose-car collisions.<br />
(2) Design of a moose-dummy and validation by a staged<br />
collision similar to (l) with rhe cadaver replaced by the<br />
dummy.<br />
General test conditions<br />
The tests were made with an equivalent test set up. The<br />
mid plane of the car coincided with the center of mass of the<br />
moose-cadaver/dummy (figure l). The speed of the test cars<br />
were 79 and 76 ft6/h respectively. Each collision was high<br />
speed filmed from both sides of the vehicle and from above.<br />
W<br />
Flgure 1. TBst conflguratlon.<br />
Test cars<br />
The cars were instrumented with accelerometers (Endevco<br />
2262) and force sensor$ (Load-indicator, AB20). The<br />
accelerometer$ were placed on the roof at the b-pillars and<br />
on the floor at the side members. The roof-rails were sawn<br />
up just behind the b-pillars and force sensors were installed.<br />
The cars were equipped with high speed film cameras. The<br />
two vehicles had cameras mounted on top of the boot, covering<br />
the wind screen area from behind. In the cadaver resr two<br />
floor-mounted cameras covered the wind-screen and frontal<br />
half of the roof construction from below.<br />
In the dummy test the deformation of the roof structure<br />
and the penetration of the dummy into the passengers companment<br />
was covered by one floor-mounted camera which<br />
covered four specially designed gauge rods. Three rods<br />
were made of PVC-pipe and were fixed to the upper windshield<br />
frame, one in the middle and the other two in line with<br />
the front seat occupants positions. All three rods pointing<br />
straight backwards along the inside of the roof. The fourth<br />
rod was made of a thin aluminum pipe and was designed to<br />
measure the penetration of the dummy through the windshield<br />
opening. [t was mounted horizontally in a rig which<br />
allowed the rod to glide with friction. It was placed in the<br />
midplane of the car inside the passengers compartment at a<br />
height corresponding to the middle of the wind screen opening.<br />
At the frontal end of the rod was fixed an aluminum<br />
plate 150 X 200 mm. The fronral end had its initial position<br />
300 mm behind the upper wind screen frame.<br />
The vehicles were equipped with an automatic braking<br />
system which was pneumatically powered and electromechanically<br />
triggered. The device was connected to the<br />
original hydraulic braking system of the car.<br />
Moose cadaver<br />
The moose cadaver was of a four-year-old male, weighing<br />
260 kg. The center of mass of the moose body was at the<br />
7:th rib, 1.35 m above the ground. The cadaver hung in four<br />
4ll
steel wires that were cut off, with specially designed cutting<br />
devices (Norabel AB), at first contact between the car and<br />
the moose. The cutting device was made up by a small<br />
housing through which the wire was passing. Inside the<br />
housing, a wedge, driven by explosive agent, cut the wire<br />
when an electrical detonator was triggered. The trig-to-cut<br />
time did not exceed 2 ms.<br />
Moose dummy<br />
The design and construction of the moose dummy was<br />
based mainly on the experiences from the cadaver test' In<br />
that test the moose-body responded roughly like a water<br />
filled sack, that is no evident rigidity due to e.8. the skeletal<br />
structure could be observed, to the impact.<br />
The dummy thus mainly consisted of water. The water<br />
was divided into impermeable compaftments, twenty high<br />
pressure hoses (Heliflex, I1299) with an inner perimeter of<br />
320 mm and an outer of 340 mm. The hoses were filled with<br />
water to 5.7 dm3/m which gave a cross sectional area corresponding<br />
to a rhomboid with diagonals with the rutio 2ll.<br />
The hoses were tightened at the ends by welding and all<br />
air inside was removed. To avoid ripple inside the hoses<br />
they also contained five interlayers of a polypropylene fiber<br />
mat (ENC-TEX AB, Y065) (figure 3). The mat consisted of<br />
two sheetings separated by thin, transverse, synthetic fibers<br />
which gave a high flow resistance.<br />
Flgure 3. Gross-Eoctlon of one hoae placed lnelde lts Poclrct In<br />
thE mstrir. Lengtht In [mml.<br />
The hoses were mounted together in a material matrix.<br />
The matrix consisted of a number of sheets of a knitted<br />
fabric (ENG-TEX AB, Yl55) sewn together with a 6 mm<br />
wide flat-lock seam (figure 2). The cross section of the<br />
dummy thus got a rhomboidal pattern. Each rhomboid<br />
"pocket" had a perimeter of 390 mm. Each hose was covered<br />
with a polyethene film to allow easy glide inside its<br />
pocket, which is essential in a bending motion of the<br />
dummy.<br />
Flgure 2. s) Crosg-sectlon and b) alde vlew, of the mooss dummV.<br />
tengttrb in [mm]. Ths dummy was hung wllh lta lower edge<br />
1m above the ground.<br />
Results<br />
Cadaver test<br />
With this test setup the forelegs were hit by the car front,<br />
while the hind legs were passed. When the front hit the<br />
forelegs the hooves bent up under the bumper thu$ fixing the<br />
legs at this position during the first 50 ms after first contact'<br />
This forced the moose body downwards, towards the<br />
bonnet. Observations from the high speed films indicated<br />
Flgure 4. Drawingt from the hlgh'apeed tilm of the cgdsvcr test<br />
sh-owlng the lntru$ion ot ths moose'body lnto th6 pass€ng_€rs'<br />
compar:tment. The numbers show the tlmB past from flrtt<br />
oontact betwssn the vehlcle and the cadaver In [m$1.
that not much of the cadaver's mass was rotated in this<br />
initial sequence even though lhe supedicial parts, the skin in<br />
particular, were considerably twisted (figure 4).<br />
At approximately 80 ms after first contact the pelvis was<br />
hit by the right frontal part of the roof. This occurred at a<br />
speed of ?6 km/h and induced a force peak of about 20 kN in<br />
the right force sensor and caused an acceleration peak of<br />
about 30 g at the b-pillar (figures 5 and 6).<br />
The force then rapidly decreased at the right side and<br />
slowly increased at the left side. The force pulse on the left<br />
side was lower but with a longer duration. The maximum<br />
value was about l4 kN (figure 6). The impact had a duration<br />
of about 80 ms during which the car velocity dropped from<br />
78.9 to 65.9 kmih, in complete accordance with the law of<br />
impulse. The pulses in the floor accelerorneters never<br />
exceeded I 0 g and had an average value of about 4 g (figure<br />
5).<br />
Irl<br />
40<br />
30<br />
20<br />
10<br />
0<br />
0 lO t0 !20 lco 100 1.0 IErl 0 {0 80 lto 160 200 lto lm.l<br />
Flgure 5, s-1. Accelerometer signalr from ths cadsv€r t€st<br />
(a,b,c) and from the dummy tegt (ii,e,l). Flgures a) and d) shsw<br />
thedght-b-plllar slqnals, !l and c) show thb left-b:illlar ilgnals<br />
End c) and f) show lloor slgnals.<br />
The moose body proved to be very deformable and<br />
flexible. It bent around the a-pillars and the wind-screen<br />
frame and penetrated deep into the compartment. Maximum<br />
penetration occurred after 150 ms, at which tirne the moose<br />
body was as far inside as a few tenths of mm:s in fronr of the<br />
b-pillars (figure 4).<br />
The wind-screen dropped into the car at an early stage,<br />
thereby shielding the two floor-mounted cameras. Thus the<br />
penetration could only be observed from one side view and<br />
the boot-mounted camera.<br />
The residual deformations of the car roof was up to 180<br />
mm in the x-direction and 130 mm in the negative<br />
z-direction (figure 7).<br />
tkill<br />
10<br />
t5<br />
rz<br />
16<br />
t2<br />
3<br />
{<br />
0<br />
a<br />
{<br />
0<br />
0 {0 60 12C 16A 20A [mEI<br />
kNl<br />
Figure 6, a-f. Force ssnaor slgna|e from the cadaver (a,b,c) and<br />
the dummy (d,e,f). a) and d) rlght alde algnals, b) and e) left slde<br />
8lgnal3, c) and f) superposition ol the signsls from both sldes.<br />
Dummy test<br />
The dummy showed great similarities with the cadaver in<br />
the interaction with the roof construction. The penetration<br />
into the passenger's compartment was about as deep as in<br />
the cadaver test. The acceleration and force pulses also<br />
showed good correlation (figures 5 and 6).<br />
The impact speed was 76 km/h, corresponding to the<br />
windshield impact at the previous test. The residual deformations<br />
of the car roof was up to 400 mm in the x-direction<br />
and 180 mm in the negative z-direction (figure 7).<br />
Discussion<br />
Cadaver test<br />
Statistics show that moose in the first month$ of their<br />
second year of life are in majority amongst the animals<br />
involved in car-moose accidents. In this age they usually<br />
have a body mass in the range of 18f280 kg. We therefore<br />
decided to use a cadaver in this weight range. The cadaver<br />
used was a starved four-year-old male weighing 260 kg. A<br />
normal weight for this animal would have been about 350<br />
kg.<br />
The cadaver was dissected immediately after the test. The<br />
strength of the rib bones was then tested and found<br />
20<br />
16<br />
t2<br />
s<br />
0<br />
t6<br />
6<br />
2A<br />
z4<br />
20<br />
r6<br />
t2<br />
6<br />
4<br />
0<br />
0<br />
0o 110 l60 2oo<br />
t20 t60 eoo<br />
413
Flgure 7. Residual windshleld lrame deformations: a) top vl€w<br />
b) lrontal view<br />
considerably higher than of ribs of a one-year-old animal.<br />
The evidently flexible and ductile behavior of the body,<br />
shown in the high-speed films, indicated that the moose<br />
body was loading the roof construction with a pressure that<br />
was rather evenly distributed over the contact surfaces. The<br />
final deformations of the car gave the same indications. It<br />
was believed that the skeleton plays a minor role in this kind<br />
of impact.<br />
The center of mass of the cadaver used in this test is about<br />
100 mm higher than what is typical for a one-year-old<br />
animal. It was however concluded that the cadaver was an<br />
acceptable model for a one-year-old moose.<br />
Due to rotation of the moose, the spine "rested" against<br />
the upper wind-screen frame during the crash. It is difficult<br />
to tell whether the spine in another configuration would<br />
behave as a load carrying structure or not, which would give<br />
implications to the dummy development.<br />
The speed of impact was chosen in the range of 70-l l0<br />
kmTh since this is the interval where the injurious accidents<br />
appear. 80 kmlh was considered a reasonably tough speed<br />
which was expected to give moderate deformations and<br />
thereby to enable meaningful force measurements.<br />
Accidental data show that impacts where the center of mass<br />
of the animal coincides with the mid plane of the car are the<br />
414<br />
most serious (2). That is why this configuration was chosen<br />
in the two tests.<br />
The Volvo 244 was chosen as test aar since it was the most<br />
common car in the Scandinavian countries at that time. A<br />
large reference material was available in Volvo Car<br />
Corporation's accidental data, with a great number of well<br />
documented moose-car collisions.<br />
In the Volvo accident files the severity is noted by the<br />
Vehicle Deformation Index (VDI) scale (SAE J 224 B,<br />
Collision Deformation Classification).<br />
The car in the cadaver test got a VDI of 60, which places<br />
the crash among the severe in the most frequent group (VDI<br />
55-60) in Volvo's accidental data for this kind of impact.<br />
This accords quite well to previous discussions. The most<br />
severe accidents with moose have a VDI in the region 75-<br />
80. Accidents with VDI > 80 are very rare. Volvo experts<br />
found the deformations very characteristic for this type of<br />
accident (l).<br />
The moose was equipped with three pairs of<br />
accelerometers (Kyowa AS200A). That is three devices on<br />
the hit $ide and three at the reciprocal spots on the sther side.<br />
The accelerometers were meant to give baseline data for<br />
estimating the compression of the moose body. However,<br />
the rotation of the outer parts of the moose took the sensor$<br />
out of direction at an early stage and this is why the available<br />
information is of minor relevance.<br />
Dummy development<br />
The cadaver test indicated that the moose could be described<br />
mainly as a water-filled sack in this kind of impact'<br />
Thus, a strong, soft and non-elastic container with a viscous<br />
content of a density close to I000 kg/m3 was expected to be<br />
an appropriate dummy solution. Roughly, the container<br />
should have the shape of a moose body.<br />
As mentioned the crash-configuration with the center of<br />
gravity of the moose hitting the car's mid plane is considered<br />
the worst one. The moose itself is rather asymmetric in<br />
all dimensions around its center of gravity, but to increase<br />
repeatability and to simplify moose-dummy construction<br />
the dummy was made symmetric around its transversal<br />
plane through the centre of gravity.<br />
In all dimensions the mass distribution was arranged to<br />
simulate the configuration of the cadaver (from centre of<br />
gravity to head end in the asymmetric case) in the critical<br />
part of the collision, 80-160 ms after first contact when the<br />
head and the hind legs are moving at the sides of the car in a<br />
horizontal plane.<br />
To accomplish this we used hoses of different lengths<br />
(figure 2).<br />
The hoses were only filled to half their maximum volume<br />
in order not to hinder the bending. Since the sheets in the<br />
material matrix are made of a knitted fabric and thus are<br />
tensile, the matrix must have a pre-tension in the vertical<br />
direction. Pre-tension decreases the deformation of the matrix<br />
when the dummy is hung up. The cross sectional area of<br />
each pocket in the matrix will increase and the length of the<br />
matrix decrease duc to gravity when the dummy is hung
up. Each pocket was given a perimeter of 320 mm in the<br />
empty unloaded matrix and had a perimeter of 390 mm<br />
when the dummy had been put together and hung up. The<br />
length of each pocket in the empty matrix must be lSOVo of<br />
the hose length in order to get the same length as rhe hose<br />
when the dummy is hung up.<br />
Dummy test<br />
This test showed good agreement with the cadaver test.<br />
Both the signals from the accelerometers and the deformation<br />
of the car showed such good agreement that we considered<br />
the dummy to be a valuable and inexpensive test tool<br />
for this kind of impact. The dummy test was a more severe<br />
impact to the car due to the fact that the mass of the dummy<br />
was equal to the mass of the cadaver with forelegs. The mass<br />
of the forelegs of the cadaver was accelerated by the car<br />
front before the body impacted the wind-screen area and did<br />
not contribute to the wind-screen impact but did reduce the<br />
car speed prior to wind-screen impact- The speed at windscreen<br />
impact was set 3 km/h lower in the dummy test, to<br />
give the same impact speed at the wind-screen area in both<br />
tests. The mass to be accelerated by the wind-screen/roof<br />
construction wa$ however still higher in the dummy case. In<br />
this respect the 260 kg-dummy was reciprocal to a 310 kgmoose.<br />
The contact with the forelegs in the cadaver test<br />
pulled the cadaver slightly downwards" Thus the lower edge<br />
of the wind-screen frame and the top of the dashboard took a<br />
greater part of the impact energy in the cadaver test. This<br />
also adds to the fact that the dummy impact was more severe<br />
to the roof construction.<br />
The car in the dummy test got a VDI of 75, which places it<br />
among the moderate in the most severe group.<br />
Acceleration measurements were left out in the dummy<br />
test since the design of the dummy did not allow the same<br />
method for mounting the accelerometers and since no reference<br />
information from the cadaver test was available.<br />
General considerations<br />
The injury-inducing mechanisms in moose-car impacts<br />
can be divided into two major groups.<br />
( I ) Direct contact between passenger's head and moose<br />
body. Prior to this study the generally accepted theory was<br />
that contact occurred between the head and the upper<br />
wind-screen frame due to the fact that the frame is pushed<br />
backwards during the crash. This study however shows that<br />
the moose body is much deeper inside the companment than<br />
the frame through all the critical part of the crash. The<br />
occupants head will thus hit the moose body rather than the<br />
car structure. A deeper analysis of Volvo's accidental data<br />
tends to confirm this conclusion. The medical reports on<br />
head-injured pas$enger$ in all cases show diffuse, blunt<br />
trauma.<br />
The deformed wind-screen frame is however a great risk<br />
factor in the so-called secondary impacts. That is when the<br />
car after impacting the moose collides with something else,<br />
e.g. a tree or another car. Secondary impact occurs in approximately<br />
20Vo of the moose-car accidents.<br />
Volvo's accidental data also showed that the use of seat<br />
belts significantly decreases the risk for severe injuries in<br />
this kind of impact. All accidents in all Volvo models where<br />
injuries were reported over a period of five years were<br />
studied. We found 396 injured passengers, all from the front<br />
seat. Of these ,372had used their seat belt. ln this group, we<br />
found one killed (AIS 6) and two critically injured (AIS 5).<br />
In the left 24 cases where the seat belt was not used or the<br />
usage was hard to determine, four fatally and two critically<br />
injured were found.<br />
Even with restrictions and reservations to this brief study<br />
it is likely that significant differences will remain.<br />
(2) Glass pieces from the wind-screen give face and arms<br />
injuries ( I ), (2). This is a very common injury mechanism in<br />
moose-car collisions but the injuries are in general moderate.<br />
Severe cases can occur e.g. when glass lacerates the<br />
eyes, but these are very rare.<br />
Reduction of the amount of glass pieces emerging from<br />
the wind-screen would reduce the number of injuries of this<br />
kind.<br />
References<br />
(l) Lind, B. (1981) "Viltolyckor, sammanstiillning av<br />
olycksmaterial", Report from Volvo Car Corporation,<br />
Criteborg (in Swedish).<br />
(2) Thorson, J. (ed.) (1985) "Moose Collisions and<br />
Injuries to Car Occupants", Reporl from Departments of<br />
Environmental Medicine, Surgery and Forensic Medicine,<br />
University of Umei and Occupational Health and Safety for<br />
State Employees, Umefr (in Swedish).<br />
(3) Turbell, T. (1984) "Simulated Moose-Collisions, a<br />
methodology study", VTl-meddelande nr 402, Swedish<br />
Road and Traffic Research Institute, Linkiiping (in<br />
Swedish).<br />
Acknowledgement<br />
We would like to thank professor Bertil Aldman, head of<br />
the Department of Injury Prevention at Chalmers University<br />
of Technology, for valuable comment and advices to our<br />
work.<br />
We would also like to thank veterinarian Bengt-Ole<br />
Rtiken forsharing with us his deep knowledge of the mooseanatomy<br />
and for help with rigging, dissection and postcrash<br />
analysis ofthe cadaver. Thanks to Swedish Road and<br />
Traffic Research<br />
Institute for practical help and to Swedish<br />
Transport Research Board for financial $upport.
Investigation, Evaluation, and Development of AdvancedConcepts in Three-Point<br />
Belt Comfort Enhancement Devices<br />
Written Only Paper<br />
David J. Biss,<br />
David James, Ltd.<br />
Abstract<br />
An investigation was conducted into the $ources of slack<br />
caused by comfort and convenience devices, which can<br />
affect the safety performance of the basic three-point belt<br />
design. Limited field observations were made to correlate<br />
$ources of slack identified from the literature and personal<br />
experience to the wearing configurations of shoulder straps<br />
on the typical American highway. From this background, a<br />
research program was carried out to investigate with $led<br />
tests in the laboratory the dynamic restraint performance of<br />
three-point belts with previously observed and documented<br />
amounts of slack. The tension relief (eliminator) "windowshade"<br />
device (TRD) was chosen as the item for laboratory<br />
scrutiny because it is the single most frequent cause of<br />
slack in American belts and because it produces a pattern of<br />
slack which mimics that from many other sources. The<br />
results of these sled tests define the expected envelope of<br />
performance of a typical TRD. From these results, design<br />
improvements to three-point belt comfort and convenience<br />
devices are suggested which will improve, in an immediate<br />
and cost effective manner, the safety performance and reliability<br />
of belts containing these devices.<br />
<strong>Int</strong>roduction<br />
The Three-Point Safety Belt<br />
It is particularly appropriate to be discussing the safety<br />
performance of the three-point belt system here in Giiteborg<br />
thirty years after Mr. Nils Bohlin, a native son of Sweden<br />
and a long time resident of Gdteborg, received a Swedish<br />
patent (l)* on this device. The foresight ofthe inventor is<br />
best demonstrated by noting that the basic configuration<br />
illustrated in his patents ( 1,2,3) of a single strap, three point<br />
belt system anchored at the B-pillar, tunnel and sill areas<br />
(figure l) is used in the majority of the worlds' automobiles<br />
today. Retractors have been added to the basic design, and<br />
certain derivative designs have appeared, some with<br />
multiple straps, dual spool retractors and other features, but<br />
the safety performance expectations for these later<br />
additions, changes and refinements, are still judged against<br />
the basic requirements for safety belt performance Bohlin<br />
laid down over three decades ago. The most basic of these<br />
performance requirements was that a properly designed<br />
three-point belt must restrain a person in a "physiologically<br />
favorable manner" (2) by interacting appropriately with the<br />
human anatomy.<br />
The subject of the present study encompasse$ the safety<br />
performance implications of adding "comfort and<br />
*Numbert in parenthescs designate rfcrences at end of paper<br />
416<br />
Deut5cfe Patente<br />
EnNnB 6<br />
. PricdttrhJifrNeil0lg87<br />
NILS TVAR BOHTIN<br />
Gotcbary (Schrvcdcn)<br />
Sicherheitsgxt ltir Fahrzeuge<br />
p4cnticd vom 21. AugEt lt59 ft<br />
t)rFDrdnunlF-5i(h.rhcit*un wrcin v*ntli.hfi Schri$ in dcr EnRirllunr dcr<br />
trnckhrhwor'rhrungcn lir Emfrfrhmge- Dic bir d$in bckrnnten Sirhcrhcirfiunc<br />
ih'm cincn shidlicltn. nrh untcn rcrichtctcn Druc! rufd* Rnrtlnr rur<br />
unrl ltxrtrusn cimn *t*ndichcnTtil dcrSprnnunp im Brurtlorb rufdhltwtohh*.<br />
&'hli;r trfin'Jlng bcrillt cimn Sichcrb.irl$.r, dcr rcwohl rlcn Obtrldrp+<br />
Ejf-Q$h .lqn LJtrrErkilru in phyriolqi*h gnnsti3cr Vci* fcthilt, Drzu dicm lc cin<br />
tkrlcntxxhlg a bcidcn Scitcn d6 Sitrc! ud eid rurmmcnhin6enrJc Sclrling+<br />
Ertildfi ilt Brutr und Hofrg!fi.<br />
Flgure 1. Bohlln's patent lllustration lor the threo-point $af6ty<br />
bslt.<br />
convenience" enhancement devices to Bohlin's basic<br />
design of the three-point belt.<br />
Safety Belt Comfort and Convenience.<br />
The history of the three-point safety belt is inseparably<br />
interwoven with the development and addition of devices to<br />
enhance the comfort and convenience of the wearer (4,5).<br />
The concept behind certain devices such as the emergency<br />
locking retractor (ELR) are so fundamental to the acceptability<br />
of the three-point belt to the average user that there<br />
has been little debate concerning the appropriateness of<br />
introducing reliable ELR designs.<br />
Other devices such as comfort clips and tension relief<br />
devices (TRD) devices-more generically known as windowshade<br />
devices) have generated much more controver$y<br />
because they introduce pre-impact wearing slack that is<br />
obvious to the trained eye might well enhance belt user<br />
injuries.<br />
The discussions and arguments overthe years concerning<br />
the safety implications of introducing these and other comfort<br />
and convenience devices have generally centered<br />
around a lack of reliability to lock when required, or the
propensity to introduce slack, either in the preimpact, or the<br />
crash environment (4,5,6,7). Fundamental in these argument$,<br />
implied or explicit, is some underlying defirnition or<br />
concept of the "comfort and convenience" gained by the<br />
addition of these devices against which the downside risks<br />
can be compared.<br />
Probably the most comprehensive attempt to formalize a<br />
definition of comfort and convenience and to quantify attributes<br />
thereof, was in the NHTSA Notice of Proposed<br />
Rulemaking, Notice 17, of December, I979 (8). This action<br />
elicited numerous comments which can be summed up as<br />
follows;<br />
. , . the relationship of comfort and convenience to<br />
wearing rates has not been established and there is<br />
evidence to the contrary (9).<br />
Comfort and convenience goal.r.-Although this attempt<br />
at quantifying and regulating the comfort and convenience<br />
of safety belts by the NHTSA met with response$ typical of<br />
that above ( 10, I I , I 2), clearly there are some basic attributes<br />
safety belt designers have been striving for over the years.<br />
The more progressive features seem to have emanated<br />
mainly from the application of fundamentally sound and<br />
ethical design practices by applying research, evolution,<br />
and simply user feedback. Some characteristics of the main<br />
comfort and convenience concepts and devices are;<br />
r Neat, safe and clean stowage; convenient to grasp,<br />
extract, buckle and unbuckle<br />
r Limited or adjustable impingement on sensitive<br />
areas:<br />
Face<br />
Neck<br />
Female breasts<br />
r Permit occupant non-crash/non-braking movements<br />
inside the vehicle<br />
t Limit webbing retraction forces (European design<br />
philosophy)<br />
t Cancel webbing retraction forces (US design<br />
philosophy)<br />
There are distinctly different perceptions in Europe and<br />
the United States concerning the relationship between the<br />
fundamental safety requirements of safety belts, and the<br />
effect comfort and convenience features might have on this<br />
safety performance. The most enlightened approaches in<br />
Europe stress an integrated approach with attention to the<br />
fundamentals of safety belt performance and comfort such<br />
as anchorage location, and reliable and smooth retractor<br />
function, including attention to webbing tension, component<br />
friction, etc. (4,13,14). This European philosophy can<br />
be summarized by the concept that a large measure of<br />
"comfort"<br />
is derived from the security of knowing rhat the<br />
safety belt system provided will protect to the best extent<br />
possible<br />
in a crash (15).<br />
The American approach has been to add extemal devices<br />
such as windowshades, guide loops and comfort clips to<br />
the belt to achieve some definition of comfort<br />
(5,7,9,10,11,12,16).In the past, the more frequent and varied<br />
styling changes in U.S. cars $omewhat precluded the<br />
European approach. This American design philosophy predetermined<br />
that there would be numerous forced tradeoffs<br />
between safety belt safety performance and comfort<br />
(17,18,19).<br />
Also, comparing pre and post mandatory belt use law<br />
(MUL) rates in both regions (20), the u$age rate in European<br />
vehicles (operatedboth in Europe and the Unired States) has<br />
been consistently and significantly higher than in American<br />
automobile$. The differing European and American philosophical<br />
approaches to three-point belt design and safety<br />
performance evaluation cannot be traced to fundamentally<br />
different medical or biomechanical considerations. By all<br />
measures, the European integrated safety approach has been<br />
more successful because, the safety belt designs which have<br />
resulted are not significantly compromised over the original<br />
Bohlin concept, and yet, are more widely accepted by the<br />
vast majority of a population spectrum not fundamentally<br />
different than that found in the United $tates.<br />
Comfort and Convenience<br />
Enhancement Devices<br />
Discussion<br />
E me r g e ncy I o c k i n g 7's I t'ss 1p t'.-The emergency locking<br />
retractor (ELR) was the first major supplemental device<br />
added to the basic three-point belt. Its development was<br />
underway in Sweden in 1962 and regulations for approval<br />
were adopted there in 1967. The ELR became standard<br />
equipment on Volvo cars in 1968 (4). It is interesting that the<br />
first Swedish regulations on ELRs required that they be<br />
sensitive to both webbing and chassis accelerations, and this<br />
requirement has carried through to the present day. Soon<br />
after ELRs were introduced into significant numbers of cars<br />
in Sweden, adjustments were made to locking sensitivities<br />
to satisfy user complaints concerning lock-up during<br />
fastening of the belt. As other countries introduced ELRs in<br />
the coming years they had the benefit of the prior Swedish<br />
experience as well as generating a learning curve of their<br />
own (19).<br />
The typical American designed ELR is vehicle<br />
acceleration sensitive (VSR) only, FMVSS 2(X) requires a<br />
locking sensitivity of 0.7 G before the webbing extends I<br />
inch. The typical European retractor is sensitive to both<br />
vehicle and webbing accelerations (mandatory in Sweden)<br />
and is required by EEC 771541to lock at 0.45 G before 2<br />
inches of strap movement. The Federal requirements are<br />
that the retractors lock when tilted over l5 deg. EEC77 /541<br />
requires that locking take place when the ELR is tilted l2<br />
deg. or more.<br />
Emergency tensioning retractor.-The next major<br />
practical advancement in ELR technology was when<br />
Daimler-Benz, in conjunction with REPA (21,22),<br />
developed the emergency ten$ioning retractor (ETR). The<br />
first generation design would, upon receiving a signal from<br />
a crash sensor, pretension the continuous loop belt webbing<br />
4t7
to 3fi)'-400 lb. Later design objectives were primarily to<br />
eliminate slack by rewinding up to l0 cm of webbing when<br />
slack was pre$ent. The ETR retained all the comfort<br />
advantages of the ELR with the added safety performance<br />
that the pretensioning during frontal collisions not only<br />
eliminated any slack from the belt, but tied the occupant<br />
tightly to the vehicle for maximum ridedown benefits. A<br />
number of patents (24,25,26) for pretensioners had been<br />
granted in the 1970's but Daimler was the first to implement<br />
the technology into a significant number of its Mercedes<br />
cars beginning in 1980. The Daimler ETR, however,<br />
initiates only upon a frontal impact within the sensitivity<br />
zone of the air bag crash sensor. Patents by Takata (23) and<br />
VW (24) pointed out accurately that intermittent locking of<br />
ELRs during rollovers and other multiple impact crash<br />
modes permitted gross amounts of spool-out in some<br />
instances, and their patents put forth pretensioning and<br />
positive locking as countermeasure for these and other crash<br />
modes.<br />
Passive belts.-Some passive belt designs have major<br />
convenience features incorporated into their designs. The<br />
shoulder strap of the Toyota/Takada motorized anchor<br />
system is extremely easy to enter-so easy in fact that even<br />
a seasoned belt wearer at times forgets to use the manual lap<br />
belt. Additional periodic chime wamings and easier access<br />
to the stowed and donned lap belt buckle should be<br />
considered for inclusion into this system so that lap belt<br />
usage is encouraged to the extent possible.<br />
Semi-passive helt features,-An example of a semipassive<br />
belt feature, as the concept is used here, is the<br />
Mercedes motorieed extension arm that hands the occupant<br />
the belt buckle from difficult stowage positions in coupes,<br />
etc.<br />
The comfort and convenience implications of other<br />
recent passive and semi-passive belt-designs will be<br />
discussed below in connection with slack they can be<br />
expected to introduce.<br />
Dual spool ELR retract4l's.-Qys1 the years various<br />
designs of dual spool ELR retractors have been used,<br />
usually in a configuration of one retractor for the lap belt<br />
and one for the shoulder belt. On some models. Volvo uses a<br />
dual spool, dual sensitivity retractor in a single strap design<br />
to minimize webbing on the reels while maintaining<br />
acceptable comfort levels. If in these multiple retractor<br />
designs, the retractors function smoothly and lock reliably,<br />
the safety performance of these systems should be<br />
equivalent to that of the basic three-point continuous loop<br />
three-point system.<br />
A system in which separate lap and shoulder belts are tied<br />
together at a latch plate is becoming more common in<br />
American passenger vehicles. This is particularly true for<br />
certain "passive" belt designs in which the two ELR<br />
retractors are mounted in the door. In the American dual<br />
spool retractor design, however, vehicle-sensitive-only<br />
retractor$ of U.S. Federal specification are being used in the<br />
lap belt. Should there be no lock-up or delayed lock-up in<br />
one of these $y$tem$, particularly during a rollover, the<br />
418<br />
occupant can face increased excursions and possible<br />
ejection from the belt.<br />
Automatic lotking retactors.-Automatic locking<br />
retractor (ALR) devices certainly earn a mention in the<br />
history of devices added to belts to increase comfort<br />
because their intended function is to stow the belt neatly and<br />
make retrieval more convenient. ALRs have been used<br />
primarily with lap-strap-only seat belts-not typically with<br />
belts incorporating shoulder harnesses. If these devices<br />
function properly and the positive locking feature locks<br />
reliably, the dynamic performance of the strap will closely<br />
emulate that of a strap (albeit with higher elongation<br />
properties) without a retractor.<br />
Comfort c/lps.-Comfort clips to prevent the webbing<br />
from rewinding fully against an occupant's shoulder/chest<br />
were introduced almost simultaneously with the<br />
introduction of ELR retractors which placed the shoulder<br />
strap under constant tension against the occupant's chest. In<br />
Europe, comfort clips were phased out as the retractor<br />
designs were refined, while in the United States, the basic<br />
concept of the comfort clip evolved into the windowshade<br />
device. In conjunction with the installation of shoulder belt<br />
retractors, comfort clips were installed as standard<br />
equipment in many American vehicles before the<br />
windowshade device came into widespread use. The<br />
fundamental problem with comfort clips was that the lay<br />
usercan, and routinely does, set an arbitrary amount ofslack<br />
in the belt without having any real biomechanical<br />
appreciation or guidance a$ to the resulting hazards<br />
(r7,r9,27).<br />
Routing guides, loops, hooks, etc.-Before 1974, the<br />
major U.S. manufacturers uniformly used a hard mounted,<br />
no retractor shoulder belt either in a four-point<br />
configuration or in a Type 2a detachable shoulder strap.<br />
After 1974, three-point belts appeared in the U.S. with the<br />
ELR and other structural anchors positioned to<br />
accommodate the more divergent styling contours of the<br />
American car. Many times supplementary routing loops,<br />
hooks, etc, were used to guide the shoulder belt strap over<br />
the occupant's shoulder and away from the face/neck area.<br />
Many of these guide loops were attached to adjustable head<br />
restraints and were designed in conjunction with an ELR<br />
located on the $ide roof rail behind the occupant.<br />
Figure 2 is a photograph of an unprompted driver on the<br />
road which shows the triangulation slack effects such<br />
routing loops and hooks routinely introduce into a belt<br />
system. These hooks and loops are usually made of plastic<br />
and, upon restraint crash loading, particularly when they are<br />
the element forming the apex of the triangle, they will break<br />
and the real slack in the belt will manifest itself as the strap<br />
snaps into direct tension. Although guide loops can be of<br />
value in certain applications, such as coupes and<br />
convertibles, their use should be closely monitored to<br />
ensure that unnecessary and excessive slack is not a<br />
consequence of this use.<br />
Te nsi on re lief' (w indow s hade ) device s.-Tension relief<br />
devices (TRD), or more appropriately called tension
Flgure 2. Trlangulatlon rlack a$socletod wlthgulde loopf.<br />
elimination devices (19), are generically called<br />
"windowshade"<br />
devices in the U.S. because this device is<br />
designed to be set and reset at different lengths of webbing<br />
slack analogous to the functioning of a roll-down<br />
windowshade. The original design concept for these<br />
devices was pioneered by General Motors (12) and was<br />
introduced shortly after the 1974 Federal requirements for<br />
the mandatory installation of rhree-point belts. The TRD<br />
was promoted as a feature which would make three-pofnt<br />
belts more acceptable to the wearers and increase belt use.<br />
The Federal Rulemaking history on rhis device has been<br />
confusing and contradictory. These devices were first<br />
addressed in Federal Rulemaking in 1976 (16) with the<br />
admonition that "the tendency for such retractors to permit<br />
introduction ofexcessive slack is an argument against their<br />
use." Nonetheless TRDs were subsequently permitted with<br />
the requirement that their proper use be explained in the<br />
associated vehicle owner's manual.<br />
When further comfort and convenience inspired Federal<br />
Rulemaking was initiated in late 1979, the (U.S.) Moror<br />
Vehicle Manufacturers Association stated in their response.<br />
"Experience<br />
shows such features as emergency locking<br />
retractors, tension-relieving devices, webbing guides and<br />
improvements in anchorage locations have not resulted in<br />
significant increased belt usage" (10). The Ceneral Motors'<br />
response to this Docket stated, ". . .we (CM) pioneered the<br />
tension-relieving device because we believe that persons<br />
disposed to use belts might be discouraged by constant belt<br />
pressure. . . ." But the information that is available is<br />
contrary to the NHTSA contention that the lack of comfort<br />
and convenience in today's belt systems is the cause of low<br />
use. . . (l?).<br />
The controversy surrounding the introduction of the<br />
windowshade was evident even inside General Motors. A<br />
1976 management evaluation (28) of the windowshade<br />
TRD reported, "On numerous occasions during the driving<br />
Frocess I glanced down to find the shoulder belt with<br />
excessive slack. . . . In all, I find the mechanism tricky and<br />
don't have confidence in what it's going to do next."<br />
In the belt supplier industry, the view concerning the<br />
widespread introduction of the TRD was ambivalently<br />
expressed in 1977 by Henderson (19):<br />
"Although<br />
the author believes the tension<br />
eliminator device represents a considerable step<br />
forward in safety belt comfort when used intelligently,<br />
he is uncertain of the wisdom of risking the excess<br />
slack which reduces the safe deceleration space for the<br />
occupant within the vehicle."<br />
This author goes onto explain the availability of a "belt<br />
tension reducer" which provides two levels of retraction<br />
force and ". . . avoids the danger of excess slack and no<br />
action by the user or complicated automatic devices are<br />
necessary to ensure colTect stowage" (19).<br />
The TRD device does make the shoulder harness more<br />
'*comfortable,"<br />
in the sense that it reduces the webbing<br />
tension forces on the shoulder to zero. This type of<br />
"comfon,"<br />
however, is the same type of comfort achieved<br />
if the belt is not on at all. In Europe another dimension is<br />
included in the concept of "comfort" which emphasizes the<br />
feeling of security obtained by having a shoulder strap snug<br />
against the body ready to protect in a collision (15). The<br />
windowshade device in its present design configuration<br />
then appeals to tho$e who are not predisposed to wear the<br />
belt in the first place. It is questionable whether the<br />
generally good performance of the basic three-point belt<br />
should be compromised for all users, in order to make a<br />
special appeal to recalcitrants.<br />
Although a number of TRD designs were refined over the<br />
years in attempts to minimize the possibilities for excess<br />
slack, many were not. Currently there are still designs on the<br />
U.S. market which will routinely introduce l8 inches of<br />
slack, or indeed any amount of available slack, during the<br />
same type of occupant movements the ELR was originally<br />
designed to permit.<br />
Tension reduction ( lowering) devices.-Tl,Ds are similar<br />
to TRDs because, within a design envelope of belt<br />
movement a few inches forward of the normally seated<br />
occupant, the tension forces are reduced by a dual level<br />
rewind spring device that can be reset to maximum<br />
retraction force with a windowshade release type<br />
movement. The main difference with the TRD<br />
windowshade, however, is that the TLD does not eliminate<br />
the tension; rather, it reduces the retraction tension force in<br />
this comfort zone to a level which will still keep the strap<br />
snug on the shoulder. Henderson (19), in his 1977 report on<br />
devices available to enhance comfort and convenienge,<br />
described in some detail the functioning of rhe TLD. Certain<br />
high-line Toyota models currently incorporate this TLD as a<br />
comfort extra. Although this device avoids the excessive<br />
slack problems of the TRD, the reduced tension can become<br />
a problem if the belt twist$ or encounters excessive friction<br />
in the hardware guides. These potential problems should be<br />
amenable to correction by careful, coordinated design of the<br />
components.<br />
Adjustable shoulder helt anchor point.-Some<br />
manufacturers have chosen to address the belt fit problem<br />
4r9
through the use of an adjustable, load carrying shoulder belt<br />
anchor point. This feature is standard on some Mercedes<br />
and Saab models, and has been an available option on<br />
Volvo. The attractiveness ofthis feature is that it can solve<br />
the belt fit problem without any degradation in optimum<br />
belt performance. However, it requires a motivated user to<br />
change the anchor position and a knowledgeable user to set<br />
the anchor in a biomechanically advantageous position. For<br />
most u$ers. and for most belts without windowshades, a<br />
comfortable anchor location with the belt on the shoulder<br />
will ensure near optimum belt safety performance as well.<br />
Even with these caveats, if this device i$ set at the opposite<br />
extreme indicated by occupant size, the effectiveness ofthe<br />
shoulder belt restraint is not grossly compromised. The<br />
adjustable shoulder anchor device is most useful for regular<br />
occupants of the same vehicle riding in the same seating<br />
positions, particularly for children.<br />
The Safety Implications of Comfort<br />
Devices<br />
The safety implications of the comfort enhancement<br />
devices discussed here are most frequently attributed to the<br />
possibility these devices will inadvertently or deliberately<br />
introduce slack into the belt system in the process of trying<br />
to achieve some sort of "comfort." An in-depth discussion<br />
of the safety effects of this slack requires consideration of<br />
how such slack originates and of what its effects are?<br />
Safety Belt Slack: A Definition and History<br />
The terms "belt slack," "occupant ride-down," and "restraint<br />
system efficiency" have been used frequently over<br />
the years in the literature, but typical use refers only to<br />
general concepts with little precision or definition. Slack as<br />
it is used here falls into two categories. First, pre-impact<br />
slack will mean a loose belt which is prone to as$ume a<br />
dangerous position on the body before the impact. Second,<br />
dynamic impact slack arises as the occupant moves forward<br />
inside the vehicle with low or no restraint forces due to preimpact<br />
slack, delayed retractor lock-up, or restraint system<br />
compliance.<br />
One early school of thought for maximizing belt restraint<br />
system performance was to simply tie the occupant as tightly<br />
as possible to the vehicle interior in an attempt to achieve<br />
the $ame chest accelerations as the vehicle's crash pulse.<br />
In 1968 Bertil Aldman and Ame Asberg of Gdteborg<br />
performed some of the earliest reported rigorous research<br />
(29) into the issue of slack effects on three-point belt restraint<br />
performance. They modeled simplified three-point<br />
belt systems with high and low strap elongation properties<br />
restraining a simplified single mass occupant, the responses<br />
of which were comparable to chest responses for an actual<br />
vehicle occupant. The modeled systems were then subjected<br />
to input crash pulses from actual vehicles of various<br />
onset rates, amplitudes and durations.<br />
Their research and a review of previous work (30) did<br />
show that for an acceleration test environment with a low<br />
4ZO<br />
rate of onset, and for tight restraint straps that resulted in<br />
negligible occupant displacement relative to the vehicle, the<br />
occupant's chest respon$es were approximately the same<br />
level as that for the vehicle. However, for actual car crash<br />
environments and practical automotive restraint characteristics<br />
they found:<br />
"The<br />
resulting peak acceleration ofthe occupant is<br />
always higher than this average deceleration ofthe car.<br />
. . . impact amplification always exists when (realistic<br />
automotive) belts are used. . . . The amplification results<br />
from the general shape ofthe input (crash) pulse,<br />
the stiffness of the restraint, and any slack present in<br />
the system. The introduction of any appreciable slack<br />
is disastrous to the protective capacity of stiff systems<br />
by producing high peak accelerations with a high rate<br />
of onset. . . . The safety obtainable in any car is wasted<br />
if it is equipped with a stiff restraint system that can be<br />
used with a slack. Therefore. it seems advisable in the<br />
future to take into consideration the deformation characteristics<br />
of the car and the restraint together. "<br />
Aldman's and Asberg's research proved to be insightful<br />
because, even though they did not directly mention the slack<br />
effects of ELR retractors on three-point belt performance,<br />
their results were directly applicable to the issue of the I 968<br />
introduction of ELRs into production cars in Sweden.<br />
ln 1977 Morris analyzed three-point belted occupant response<br />
data from full scale frontal barrier tests of 1976<br />
model year automobiles to determine the effects of slack on<br />
restraint system performance (3 l). Morris developed a useful<br />
definition of ridedown by overlaying the shoulder belt<br />
forces onto the acceleration crash pulse (figure 3) and calculated<br />
the ridedown from the overlap of these curves. His<br />
approach took into account the influences of ELR characteristics<br />
such as lock-up time, amount of film-spool, etc., as<br />
well as webbing elongations. His results showed a strong<br />
correlation between ridedown duration and peak shoulder<br />
!<br />
4<br />
c<br />
t<br />
o<br />
E<br />
Illustratlons of polnts used to detennlne<br />
duratlons of llde down.<br />
Flgure 3. A dellnltlon of rlde down (from Morrlg, reference 31).
elt loads. None of the vehicle crashes Morris analyzed had<br />
appreciable pre-impact slack set in the windowshade, so<br />
any slack time he documented was from ELR and webbing<br />
compliance influences.<br />
In 1980 Reichert and Bowden (32) of Departmenr of<br />
Transport Canada published the results of sled tests conducted<br />
to a$sess the effect of slack caused by windowshade<br />
comfort devices on the safety performance of three-point<br />
belt systems. They compared three-point belts with no retractors,<br />
fl retractor in the shoulder belt, and a retractor in the<br />
lap belt each with 2.5, 5 10, 15, and 25 cm of slack. Their<br />
results showedl<br />
. . . (The no retractor) belts produced an almost<br />
linear increase in slack time, head excursion, peak head<br />
acceleration, and HIC with increasing slack.<br />
. . . (The retractor at the shoulder harness anchor)<br />
belts showed much higher values of head excursion<br />
and HIC at low slack (settings) and (a) lesser dependence<br />
on slack. Peak acceleration ofthe chest was less<br />
than with type A belts at large slack(s).<br />
. . . (The retractor at the lap anchor) belts performed<br />
similarly to the Type A (shoulder rerracror) belts.<br />
Retractors modify the effect of slack on occupant<br />
dynamics and appear to reduce the prolection against<br />
head contact provided by seat belts.<br />
Aldman's and Ashberg's research again proved, in retrospect,<br />
insightful because, their results were later to be confirmed<br />
by Monis, and Reichert and Bowden, among others.<br />
From this research (29,31,32) and others (7, 13,24,33,<br />
34, 35, 36, 37, 38, 39), the theoretical limits on three-point<br />
belt restraint system performance in a particular vehicle for<br />
the driver or passenger can be determined by analyzing the<br />
vehicle stopping distance; the vehicle deceleration crash<br />
pulse the principle direction offorce; the elastic and energy<br />
absorbing properties of the restraint system; and, the distance<br />
inside the vehicle available for occupant translation<br />
and articulation. Applying these general principles ro a specific<br />
vehicle environment will, in conjuncrion with judicious<br />
design decisions, lead to optimizing the three-point<br />
belt performance in that vehicle. This process will only<br />
succeed, however, ifthe full envelope ofpossible effects on<br />
belt performance of slack caused by devices such as ELRs,<br />
TRDs, routing loops, moving anchor points, etc. are quantified<br />
and considered.<br />
Slack Caused by Comfort and Convenience<br />
Devices<br />
Slack caused by comfort and convenience devices arises<br />
from two sources, pre-impact slack in which a loose belt is<br />
prone to assume a dangerous position on the body before<br />
impact; and, dynamic impact slack in which the occupant<br />
move$ forward inside the vehicle with low or no restraint<br />
forces due to pre-impact slack, delayed retractor lock-up, or<br />
restraint system compliance.<br />
Slack caused by ELRs.--The primary failure mode of<br />
concern for the ELR is that it may not lock or might lock late<br />
during an impact. Although one might be able ro express the<br />
probability of this happening as a small fraction, rhe consequences<br />
are nonetheless catastrophic when it does happen,<br />
indicating that special attention during an effects analysis is<br />
warranted. The function of the ELR is to permit wearers to<br />
move their upper torsos around freely inside the vehicleup<br />
to the limits of webbing available-in the non-braking,<br />
non-crash situation. This free movement capability changes<br />
from a desirable attribute in the non-crash situation to a<br />
failure mode if exhibited in the crash condition.<br />
The typical American designed ELR is vehicle acceleration<br />
sensitive only with the locking mechanism being a<br />
suspended, Iead-weighted pendulum lifting a locking bar<br />
into the path oflocking teeth on the retractor spool ends. The<br />
typical European retractor is sensitive to both vehicle and<br />
webbing accelerations. FMVSS 209 requires a vehicle acceleration<br />
locking sensitivity of 0.7 C before webbing extends<br />
I inch, while EEC77l54l requires European retractors<br />
to lock at 0.45 C before 2 inches of strap movement.<br />
Federal regulations also require that the retractors lock<br />
when tilted over 15 deg. EEC 77 l54l requires that locking<br />
take place when the ELR is titled 12 deg. or more. The<br />
American Federal ELR then is less sensitive to these two<br />
standard prescribed locking modes than is the EEC ELR and<br />
there has been some discussion that this lower sensitivity<br />
can be expected to affect the outcomes for accidents on the<br />
highway (4,6,15,23,24), particularly for multiple impacts<br />
and rollovers.<br />
Horizantal plane impacts.-The ideal conditions to promote<br />
reliable vehicle sensitive ELR pendulum locking are<br />
impacts confined principally to a horizontal plane in which<br />
the vehicles do not roll appreciably and which generate a<br />
single delta-V crash pulse which maintains a relatively constant<br />
absolute level without radical fluctuations. Such conditions<br />
are generated in the typical frontal barrier crashes<br />
but discussions have occuned concerning whether these<br />
laboratory conditions and the FMVSS 209 type test apparatus<br />
adequately evaluate ELR's in foreseeable accidents on<br />
the highway. Bohlin in l98l (4) stated:<br />
"There<br />
are no regulations today on the testing of the<br />
vehicle sensitive locking function which probably reflects<br />
the reality. . . . It is therefore proposed that the<br />
regulations regarding the emergency locking features<br />
of the retractor should be seriously reconsidered."<br />
In 1975 Mackay (6) analyzed failure modes for ELR belts<br />
and observed:<br />
"The<br />
third failure mode applies to inertia reels<br />
where complete failure to lock or locking so late as not<br />
to provide adequate occupant protection, has been recorded.<br />
Such cases are characterized by occupant trajectories<br />
and contacts similar to those observed for<br />
unrestrained occupants. . . . Subsequent examinations<br />
of such reels have not shown a cau$e, and we conclude<br />
that either preimpact braking or some dynamic characteristic<br />
of the locking mechanism is responsible."<br />
421
In the early 1970's NHTSA found that emergency locking<br />
retractors installed in some automobiles were not locking<br />
reliably when subjected to the FMVSS 209 acceleration<br />
test (40,41,42). In the case of one American style retractor<br />
subsequent investigation showed that initial tip-to-tip contact<br />
of the ratchet teeth with the lock pawl teeth could cause,<br />
in some circumstances, the retractor to delay locking or not<br />
to lock at all. In response to this investigation the manufacturer<br />
made a number of changes in the locking mechanism<br />
which apparently rectified the immediate problem. At the<br />
conclusion of this investigation (41), however, questions<br />
sunounding the actual reliability of these and similar ELRs<br />
to lock when required in real accidents were not completely<br />
resolved. The retractor$ subject to this NHTSA investigation<br />
were the same basic design as those used in most<br />
American cars up to the present.<br />
Rollover and multiple impacts.-*-{here have been instances<br />
investigated by this author where occupants ofvehicles<br />
involved in rollover accidents were found with threepoint<br />
ELR belts still around them but with excessive<br />
amounts of slack up to and including the full unwound<br />
amount. There have been other similar notations during the<br />
years of experience with the ELR concerning the possibility<br />
that the simple undamped locking mechanisms in some<br />
ELRs might not lock reliably in rollovers or multiple impacts.<br />
A number of patents address these vehicle dynamics<br />
considerations including one by Takata-Kojyo (?3) which<br />
stated:<br />
While these (typical ELR) systems possess many<br />
advantages, they are frequently unreliable since the<br />
reel braking is either of too short a duration, or is<br />
maintained for an indefinite period and they otherwise<br />
leave much to be desired. . . . Another object of the<br />
pressnt invention is to provide an improved inertia<br />
responsive safety belt locking system in which an adequate<br />
braking interval is assured independently of the<br />
sequence of events following the braking actuation.<br />
A patent by Volkswagen (24) also described the real<br />
world crash environment in which ELR retractors are called<br />
on to reliably lock.<br />
Currently known automatic (ELR) belt winders . . .<br />
release . . . the safety belts after tightening (locking)<br />
thus defeating the desired restraining action. . . . a<br />
stopping or locking device is provided for maintrining<br />
the increased safety belt tension, once applied, in order<br />
to prevent the vehicle occupants from falling free in the<br />
direction of travel in the event of continued deceleration.<br />
Such a stopping device is especially important in<br />
accidents in which the vehicle undergoes several successive<br />
impacts . . . or ovefiums.<br />
These patents as well as indications from field accident<br />
investigations, indicate that certain oscillatory dynamics<br />
are present in multiple crash modes which are strongly<br />
suspect in causing intermittent locking, or failure to lock, of<br />
ELRs (4,6). A major difficulty surrounding public discus-<br />
422<br />
sion of these possible failure modes is that if such a failure<br />
occur$, the pattern of evidence looks the same as if the<br />
occupant was unrestrained. Realistic multiple impact dynamic<br />
testing related to real world accidents should be undertaken<br />
with the specific intention of finding the intermittent<br />
and unlocking failure modes of typical ELR designs.<br />
Once these failure modes have been identified, discussions<br />
can commence onhow to evaluate different ELR designs for<br />
this type of vulnerability, and, the search for improved<br />
designs will be further stimulated.<br />
Film spool s/acft.-A major finding of the NHTSA 35<br />
mph New Car Assessment Program begun in 1979 was that<br />
the film spool effect
years and had been phased in for a number ofyears before<br />
that. Thus, over 100 million automobiles presently on the<br />
American highways are equipped with this device resulting<br />
in significant safety implications to the driving public.<br />
The typical belt tension eliminator (reducer) "windowshade"<br />
device can be readily added to almost any ELR<br />
spool shaft. The TRD introduces slack of two types into the<br />
three-point belt: pre-impact slack, which precludes the belt<br />
from automatically and completely retracting to fit the<br />
wearer; and dynamic slack which can sacrifice crash phase<br />
ridedown and increase occupant body segment excursions<br />
inside the vehicle.<br />
Concerning pre-impact, wearing slack-there have been<br />
analogies drawn between the intended slack a windowshade<br />
device introduces into a torso belt and the recommended<br />
slack (one fist's width) in the pre ELR torso belts. This<br />
analogy is misleading from a number of standpoints.<br />
Major changes in operational performance of three-point<br />
belrs occurred wirh the addirion of rhe ELR (32). The most<br />
major of these was that the conventional ELR introduced a<br />
certain amount of unavoidable dynamic slack into the system<br />
from, at minimum, film-spool and the elongation of the<br />
associated extra webbing. Even though this dynamic ELR<br />
slack has been minimized in many recent designs, it still is<br />
the ca'te that any slack introduced by the windowshade<br />
device is cumulative to normal ELR associated slack.<br />
In addition to slack effects which permit additional forward<br />
motion of the occupant with little or no restraint<br />
forces, there are slack effects which permit the shoulder<br />
strap to assume, pre-impact, a dangerous configuration on<br />
the body. This occurs, for example, when the strap lies off<br />
the corner of the shoulder. This study has demonstrated that<br />
this configuration can occur with as little as 1.3 inches of<br />
pre-impact slack and this study further confirms dangerous<br />
abdominal loading as an expected consequence in both<br />
frontal and frontal oblique impacts.<br />
Further contradictions to the assertion that the present<br />
designs of the TRD will introduce only a prescribed amount<br />
of slack, are observations as well as personal experience<br />
showing the windowshade can, and often does, introduce<br />
gross amounts of slack (4 to 24 inches) during normal driving<br />
movements ( 17, 18, 19,27). These are movements of the<br />
type the ELR was originally designed ro permir, but the<br />
intent of the basic non-TRD ELR design is that the belt<br />
webbing must unwind and rewind to follow the wearer at all<br />
times.<br />
Typically how the TRD causes excess slack can best be<br />
explained using the schematic graph shown in figure 4 in<br />
which belt length unwound from the reel is plotted against<br />
time periods of arbitrary duration. The first time interval<br />
represents the occupant pulling out extra belt webbing to get<br />
it around himself for buckling and then the belt rewinding<br />
snug back onto the shoulder. The second interval includes<br />
the limited movements of the shoulder/torso with the belt<br />
snug. The third event is the occupant leaning forward within<br />
the windowshade cam setting distance, then leaning back<br />
with the windowshade still set. This prescribed amount of<br />
l<br />
f<br />
5<br />
!<br />
)<br />
I<br />
o<br />
.J<br />
I<br />
5tsdlrdr. u'Eiltotron r". r."r^o pqst --f--<br />
rne<br />
Figure 4. A human factors analyria of the operatlon of the tenslon<br />
reliel "windowshade" devlce.<br />
slack has been in the range of2 to 5 inches for various TRD<br />
designs, but in recent years is typically around 2 inches. The<br />
next interval depicts the wearer's motion to reset the windowshade<br />
to the snug configuration.<br />
The next two intervals show what typically happens when<br />
a driver, for instance, leans forward to look for cross traffic<br />
or to manipulate the radio controls. If the shoulder of the<br />
wearer oscillates slightly while the belt is in rhe extended<br />
position, the entire sequence mimics the motion of the occu-<br />
pant putting on the sear belt in the first place. The TRD is<br />
capable of setting all the way out to the end of the spooled<br />
webbing, and being a simple mechanical cam device, it<br />
cannot discriminate many times between the motions of<br />
putting the belt on and just leaning forward with a slight<br />
rocking motion. Of course, one can stress that TRD users<br />
should closely monitor their belts for no more than the<br />
prescribed amount of slack, but this does not answer the<br />
question of what the hazards are during the periods the belt<br />
strap is away from the body in its TRD set, or process of<br />
being reset, condition.<br />
An interesting insight comes to light when one reviews<br />
the history of the windowshade TRD in conjunction with an<br />
analysis of the operating characteristics of the combined<br />
TRD-ELR system. Figure 5 shows webbing tension forces<br />
ploned against forward extension of the belt for two makes<br />
of American cars equipped with the TRD and for a European<br />
car without the TRD. The starting point was with the<br />
strap snug on the occupant's shoulder. Two competing<br />
makes of American cars exhibited essentially the same webbing<br />
tension versus webbing extension characteristic and<br />
these forces are about 50d/o higher than those exhibited by<br />
the European ELR. Also, in the critical area where the belt is<br />
snug against the normally seated wearer, the American tension-extension<br />
characteristic rises much faster than that for<br />
the European ELR.<br />
The present TRD design then has been used in somewhat<br />
of a self-fulfilling prophecy role-thar of eliminating retraction<br />
fbrces which are in the first place higher than for<br />
belt systems which do not contain the device. This dichotomy<br />
is understandable when considering one of the main<br />
design requirements of the TRD. The tension elimination<br />
condition must be immediately cancelled when the door is<br />
-<br />
.
n<br />
c<br />
'{J<br />
-<br />
U<br />
c<br />
30<br />
c E 0<br />
ut<br />
0J<br />
0,<br />
tr ia<br />
E<br />
-a 0,<br />
><br />
r 6<br />
J<br />
c<br />
rI<br />
c<br />
ol 4<br />
c<br />
_a<br />
0 4 S<br />
Shoulder Forword<br />
Movennent (tn,)<br />
r l l<br />
0 1 0 e 0 3 0 4 0<br />
Shoutder Forword Movenrent (crr,)<br />
Floure 5. Webblnq tengion versua lonrard extenslon for TRD<br />
an? non-TRD thre-e-point belta.<br />
unlatched because, in turn, there must be an immediate and<br />
strong spool torque applied to overcome the inertia from a<br />
stationary belt, and thus avoid having a non-retracting belt<br />
fall out the door to be damaged or to trip an exiting occupant.<br />
A door-operated plunger is used with TRDs to cancel<br />
the windowshade setting and permit this retraction when the<br />
door is opened.<br />
Although many concerns have been raised over the years<br />
about the use ofa device to deliberately introduce slack into<br />
the three-point belt ( 19,28,32); it was not until 1987 that the<br />
first comprehensive study on how belts equipped with the<br />
TRD were being worn on the highway was carried out and<br />
published by the Insurance Institute for Highway Safety<br />
(?7). Observations for this IIHS study were taken of suburban<br />
Maryland drivers and they showed that for restrained<br />
drivers ofTRD equipped cars, 27 percent had I to 2 inches<br />
of slack in their belts while 8 percent had 3 inches or more.<br />
As a direct comparison, foreign cars without the TRD were<br />
monitored and only 5 percent of the belted drivers in those<br />
had I to 2 inches of slack while none were observed to have<br />
over 3 inches of slack.<br />
This author has performed a brief audit of the IIHS study,<br />
again for suburban Maryland drivers, and has found it to be<br />
a representative sample of the slack visible through the side<br />
window from a distance. A difference in procedures with<br />
the IIHS study was followed in this audit in that drivers were<br />
approached and asked to have the position of their threepoint<br />
belt photographed from next to the car where the<br />
photographer could get a picture of the entire shoulder strap<br />
and parts of the lap strap. If these drivers moved their belts<br />
in any way before the photo, they were not included in the<br />
study.<br />
The photographic results of this study showed that in<br />
many instances where the IIHS probably would have quan-<br />
424<br />
LrEanql<br />
A<br />
x<br />
o<br />
{<br />
1985 Chevy Cavqlltr<br />
1986' l{.rcrebs lsE<br />
1985 t'lercury Horqus<br />
,rt<br />
l<br />
tified 0 to 2 inches ofslack, from an obserrration point close<br />
to, and looking down into, the car; there was observed an<br />
additional I to I inches of slack lying in the occupant's lap<br />
next to the latch plate (see figure 6). The findings from the<br />
IIHS study are valuable considering the observation viewpoint<br />
they had; however, the amount and frequency of slack<br />
they reported is probably understated because they could<br />
not $ee the latch plate area where a significant portion of<br />
slack webbing slack typically accumulates.<br />
It was also noted in the present observations that about 5<br />
percent of the occupants were using the windowshade device<br />
as a facilitator for wearing the shoulder harness under<br />
the arm without the normal discomfort caused by retractor<br />
tension (see figure 7). This photographic based study is<br />
continuing and additional results will be published<br />
elsewhere.<br />
The TRD can inadvertently introduce slack from occupant<br />
dynamics during pre-impact vehicle dynamics such as<br />
braking maneuvers and running over rough ground. During<br />
such occupant jostling, the TRD can set itself resulting in a<br />
slack belt at impact. It is appropriate to also add here that in a<br />
number of the sled tests reported in the next section, the<br />
windowshade slack did not reset to zero in the belt even after<br />
a 30 mph impact. Thus, the implications for the present<br />
design of the TRD is that it reduces the protection of the<br />
3-point safety belt in multiple impacts in yet another way'<br />
The EEC regulations 77l54l give a good overview of the<br />
concems which should be considered in conjunction with<br />
TRDs.<br />
3.2.2.1. the straps are not liable to assume a dangerous<br />
configuration.<br />
3.2.2.2. that the danger of a correctly positioned<br />
belt slipping from the shoulder of a wearer<br />
as a result of his/her forward movement is<br />
reduced to a minimum.<br />
Again the findings from the sled test portion of this study<br />
confirm the significant probability of the belt straps slipping<br />
from the proper areas of the body to dangerous areas because<br />
of the dynamic influences of slack during frontal or<br />
frontal oblique impacts (e.g. shoulder to the abdomen).<br />
The implications on belt performance of TRDs as they are<br />
presently designed sometimes lead to biearre results. Observations<br />
by the author, which are exceptionally difficult to<br />
record via photography, are that with the TRD set, and the<br />
near window open, excess slack ends up in a wind blown<br />
loop behind the occupant. The shoulder strap is snug on the<br />
user but the wearer many times does not realize there is a big<br />
Ioop of excess belt strap behind him, and apparently from<br />
the number of times this has been observed, does not realize<br />
the hazard of the situation.<br />
During the history of the TRD windowshade in American<br />
vehicles there has been until recently a notable absence of<br />
publicly released data from U.S. researchers both on the<br />
effects on belt wearing patterns on the highway, and on the<br />
biomechanical implications for impact protection. There
Flgure 6a<br />
Flgure 6s<br />
Fl$urla 6a41. Ilplcal slack In TRD-wlndowshade balts.<br />
has been no comparable study to that of the 1980 Reichert<br />
Canadian study (32) in the United States and this has impeded<br />
both public debate and Rulemaking on this subject. In<br />
198 I , Culver and Viano (38), reported results for slack belt<br />
tests in far side oblique impacts but did not report the effects<br />
of shoulder strap aMominal loading. In 1982 NHTSA conducted<br />
four sled tests (43) to demonstrare the potential effects<br />
of slack caused by the TRD windowshade on threepoint<br />
belt performance.<br />
Flgure 6d<br />
Flgure 6b Flgure 6e<br />
Flgure 6l<br />
Although the presently reported sled tests certainly do not<br />
represent a full qualification test program a particular TRD<br />
device; this test program and associated analysis is presented<br />
here as a $uggested outline of the types of tests which<br />
should be run to assess the effects of the types and amount$<br />
of slack caused by comfort devices as typically found with<br />
users on the highway. Because the TRD is the most frequent<br />
source of this user slack (27), it was chosen as the device for<br />
an indepth sled test research program to as$ess the affects of<br />
425
Flgure 7d<br />
Flgure 7c<br />
Flgure 7l<br />
Figures 7a-71. $lsck shoulder belts under arm in THD equlpped vehicles.<br />
slack on three-point belt performance. Many of the findings<br />
are applicable to other comfort enhancement devices as<br />
well.<br />
Slack effects,from<br />
"passive" belts.-Some passive shoulder<br />
belts can be considered convenience enhancement devices<br />
while others will have to be judged on their individual<br />
merits. Figures 8a-8c show one design for a three-point<br />
"passive"<br />
belt which uses dual spool retractors mounted in<br />
426<br />
Figure 7e<br />
the door, and even though this system contains a normal<br />
buckle, theoretically at least, one can get into and out ofthis<br />
car without unbuckling the belt. This design has qualified<br />
for NHTSA approval, but surveys have shown (44) that the<br />
usage rate is lower for this "passive" system than for the<br />
manual three-point belt system it replaced in the same mod-<br />
el car.
Flgure 8a<br />
Flgure 8b<br />
Flgure Ec<br />
Flgure 8. Slack In thre€-polnt,.passlve"<br />
belt daelgne.<br />
There has been a misconception that the TRD device<br />
would be phased out with the introduction of passive belts.<br />
The "passive" systems shown in figures 8a-8c are in the<br />
cars which make up a significant portion of the U.S. market<br />
share and they do contain the TRD windowshade device.<br />
When looking at figures 8b-8c it is difficult to determine<br />
why a TRD is included in these systems because, when the<br />
belt is taut, the strap is two inches forward of the average<br />
size occupant's shoulder and at least one inch forward of the<br />
sterDum.<br />
From the field observations mentioned earlier. for this<br />
design of "passive" belt in a four-door sedan, the only way<br />
for the belt strap to make contact with the shoulder is by<br />
introducing slack via the TRD. This is, however, not a safety<br />
feature because this type of strap positioning is unpredictable<br />
and simply adds more dynamic slack into the system.<br />
Slack efficts of other "comfort" devices.-A number of<br />
references to slack caused by other comfort and convenience<br />
enhancement devices have been included in this<br />
paper such as routing loops breaking and so on. A number of<br />
the tests discussed below contained slack, albeit from the<br />
TRD, which would be typical of these other situations and<br />
the results should be applicable accordingly.<br />
A Sled Test Program to Evaluate the<br />
Effects of Slack-as <strong>Int</strong>roduced bv the<br />
Windowshade Device<br />
A laboratory sled test program was undertaken to study<br />
the effects of belt slack on the $afety performance of a<br />
typical American-made single retractor, continuous loop,<br />
three-point seat belt system (VSR/ELR equipped with a<br />
TRD) using the Hybrid III dummy as rhe resr device. The<br />
TRD feature was chosen for attention because it is the<br />
leading cause of slack in seat belts in the U.S. (27). Many<br />
observations and findings of this study are, however,<br />
independent of the TRD-the TRD just being the cause of<br />
the $lack which can occur by other means. For instance, the<br />
findings from the oblique impact tests apply to slack related<br />
issues such as jammed webbing, guide loop, triangulation,<br />
anchor point location, etc.<br />
General Test Protocol<br />
Test Environment.-Table I summarizes the test protocol<br />
and the results for the slack belt tests. Twenty-eight sled<br />
tests were run in a recent model Ford LTD/Crown Victoria<br />
front seat sled buck as representing<br />
the average full-sized<br />
American car interior layout. For economy of testing and<br />
repeatability, all occupants were tested in the left front seat<br />
position. The steering system was installed or removed to<br />
create a driver or mirrored passenger<br />
environment.<br />
H'f i;Jil' o",n;"':lio':*"0_:i::*"01,""1".<br />
*, ffi<br />
SH/SLT IIF<br />
to<br />
I<br />
I<br />
ll<br />
rB<br />
r9<br />
r4<br />
26<br />
z1<br />
m<br />
b<br />
26<br />
22<br />
t6<br />
l2<br />
r{<br />
!q.l 9<br />
-1.0 0 468 tlj 30. I<br />
)q I o o.o o 525 {oq ,7.7<br />
19 | d 0.5 o 675 58? j6.o<br />
n / o Lq 0 6{4 486 38.4<br />
to / 0 r.6 d ?:0 605 4o.o<br />
30 / o 2.3 0 02r 730 44.d<br />
10 / O 3.o 0 1026 88o 4r.9<br />
Jo / o 5.o 0 910 69E 46,6<br />
p / 9 t.3 o rd23 986 43.9<br />
N / 6 q.o 0 !359 1359 rB.i<br />
30 / o 18,0 0 715 126 37.6<br />
10 / o r8,o o i98 ?98 {2-6<br />
10 / 38<br />
-r.o<br />
10 / 18 o,o<br />
30 / 38 0.0<br />
l0 / 3E r,l<br />
30 / 1E 2,5<br />
30 / 36 3,0<br />
3d / 16 3,0<br />
10 / 3E 1,D<br />
36 / 18 3.0<br />
3d / l8 2.3<br />
15'/ o o.o<br />
J5 / O 3.o<br />
10 / O o.o<br />
JO / O 3.0<br />
fi/n -1.0<br />
10 / o l.o<br />
422 ts 4,2<br />
352 228 31,6<br />
616 {1t 38,2<br />
379 l0l 29.9<br />
587 485 37,6<br />
t96 ?83 3o.t<br />
F4? 4r4 42.8<br />
{rJ 325 37,1<br />
256 16? 34.7<br />
W 351 J7.9<br />
ll92 1161 {9-r<br />
149r r37o ,2.1<br />
q52 852 32,7<br />
b97 Ei7 l?,8<br />
rlr0 1rl0 17,4<br />
1165 1165 t9-0<br />
15fr<br />
l407<br />
1302<br />
r4d3<br />
rl97<br />
rcrS<br />
1{2?<br />
l6r6<br />
14to<br />
1292<br />
ETE<br />
16fl<br />
2059<br />
u36<br />
18?6<br />
14C9<br />
1"95<br />
1836<br />
r50l<br />
r.26<br />
1,?t<br />
1 -Zt<br />
1,19<br />
l,66<br />
1.ff<br />
l.0l<br />
o.B<br />
o-s<br />
- Tssts ss Jo +h B,B,V,, Acruar hlh V. 3t.5 rph.<br />
- T€8tr EE 15 lph LE,v,, Acrud hlr. v. 37,5 !ph,<br />
- In t$ts l0 s 11. rhr hlr es 6ff s. shmld;r,<br />
- q/d dsnotss qu6ttlongtr chsst d6r6tkitm drrr tn Tssrs t? d t8<br />
. n/t denot€8 ihsF rs no rFmsducsr lof thlr r.rr.<br />
L19 P SS<br />
r,54 Piss<br />
1.70 PA53<br />
r.45 Prss/m ffi<br />
1.38 FtSs<br />
0.?0 F^gs/of s|M<br />
r,75 FS<br />
3.2t q,/d' Ptgs/ffi w<br />
z,E? q/d PAf4/|ff m<br />
r,16 P^$s<br />
1.{{ PrES<br />
1.37 Pr.$s<br />
FS<br />
PASS<br />
PS<br />
PS<br />
PH<br />
Pffi<br />
Pls<br />
PAS/oF SLffi<br />
PASS<br />
PAS<br />
PS/OF ruR<br />
PH<br />
1,30 Dn<br />
Ll[ DR<br />
1.66 Dn<br />
1,37 DR/RPqT ' 13
The three-point belts used were the stock LTD belts obtained<br />
through the dealer. These belts were single spool,<br />
vehicle sensitive/emergency locking retractor (VSR/ELR),<br />
three-point continuous loop systems with a cinch lock latch<br />
plate such that when the belt was on, webbing could move<br />
from the lap strap into the shoulder strap, but as designed,<br />
not the other way. These belts were equipped with a tension<br />
relief '-windowshade" device (TRD).<br />
The sled pin chosen for the Transportation Research Center<br />
of Ohio (TRC) HYGE sled provided a reasonable analog<br />
to the 30 and 35 mph barrier crash pulses for this vehicle<br />
yielding 32.5 and 37.5 delta-V's respectively for these two<br />
test conditions.<br />
Data reutrded.-Table I shows the data collected. In<br />
addition to the data shown, three 1000 frame-per-second<br />
cine cameras were stationed for front and side orthogonal<br />
views. The normal components of head and chest accelerations,<br />
along with chest deflections, were recorded on the<br />
Hybrid III which was calibrated immediately prior to the<br />
test series. Belt loads and neck forces were also recorded<br />
while femur loads were not.<br />
Specific test protocol.-These sled tests were conducted<br />
in two primary phases: With a head-on, 0 deg. orientation,<br />
and, with the sled buck rotated 38 deg. to the left. This sled<br />
rotation simulated far side oblique impacts with occupant<br />
PDOF angles to the inside of the car for both the normally<br />
oriented driver and the mirrored passenger. Thirty-eight<br />
degrees was chosen because this is approximately the angle<br />
at which the shoulder belt traverses across the car from the<br />
B-pillar D-ring to the latch plate. If the belt works properly,<br />
one might expect the shoulder strap to provide effective<br />
restraint of the upper torso in a direction approximating the<br />
belt loop orientation in the car. Another rationale for choosing<br />
the 38 deg. angle was that given practical resource<br />
limitations, this one sled angle is a reasonable simulation of<br />
impact orientation angles on the highway up to approximately<br />
twice the sled angle, or 76 degrees.<br />
For the 0 deg. frontal sled impacts, repeat tests were<br />
performed and data trends plotted to permit identification of<br />
outlier points beyond the predictable or explainable envelope<br />
of conditional relationships. Results for these tests<br />
confirmed that the test conditions had been well controlled,<br />
and that the Hybrid III dummy had performed in a repeatable<br />
and predictable manner. Reference 45 describes the<br />
specific details of the Hybrid III performance in these tests.<br />
ForTests I through I I and 18, slack in the passenger shoulder<br />
belt was gradually increased from -1.0 in. to 18.0 in.<br />
Tests I 2, I 3 and I 5 were of the driver at 30 mph with 0.0 and<br />
3.0 in. of slack. Test l4 was of the driver at 35 mph with -l.0<br />
in. of slack, while Tests l6 and I 7 were of the passenger at<br />
35 mph with 0.0 and 3.0 in, of slack, respectively.<br />
The three independent variables evaluated during the<br />
oblique tests were shoulder belt slack (defined as the extra<br />
webbing through the shoulder belt D-ring at the beginning<br />
of the test), the position of the belt with respect to the arm/<br />
shoulder joint, and lap belt slack etrtablished by measuring<br />
between the center lower abdomen and a corresponding<br />
428<br />
point on the taut belt. Upon detailed analysis of the results,<br />
the effect of 0 to 3.0 in. of lap belt slack was not strongly<br />
significant in the type belt tested using an ATD.<br />
Frontal0 Degree Sled Tests<br />
Data analysis and results.-For the 0 deg. tests, the outcome<br />
variables most sensitive to the slack independent variable<br />
were head speed and displacement relative to the interior.<br />
Figure 9 shows the head excursion envelopes for<br />
passengerTests I through ll,16,lTand lS,whilefigure l0<br />
shows the head excursion envelope for the driver occupant<br />
at 30 and 35 mph, Tests l2 through 15. Figure I I shows head<br />
speeds relative to the interior versus time and displacement<br />
for Tests I and 9. Figures l2 through l8 show individual<br />
cine frames for selected 0 deg. frontal tests showing key<br />
kinematic times during each event such as maximum head<br />
velocity, impact head speed, and head maximum forward<br />
displacement.<br />
I'lote Heod Stortinq Poliltioni Hove Been Adlusted ior Cqmer0 Pordllor<br />
Figure 9. Head excurslon trslectories lor passenger te8t8.<br />
Noter Heod Stortinq Positions Hove Been Adjusteci for Cdmero Porollox<br />
Flgure 10. Head ercursion traiectorles for driver tssts.<br />
Chest results.-The shoulder belt strap forces (along<br />
with transfer forces from the head/neck when contact ocr<br />
curred) were the restraint forces on the chest during these<br />
tests. The present condition of -1.0 in. of slack in Test I was<br />
achieved by tightening and locking the belt at 40-50 lb<br />
preload. From Table l, this modest preload did not increase
0, ,^<br />
L'] IU<br />
E<br />
a<br />
'11<br />
o .<br />
tu<br />
E +<br />
OJ<br />
T<br />
l4<br />
e<br />
Flgure 12a<br />
-C o_<br />
H<br />
_r:<br />
o<br />
0l<br />
_ 1 0<br />
o<br />
U<br />
T<br />
5<br />
TEST *01<br />
30 mph,/0'Possenge.<br />
- 1.0 in Elqck<br />
Its I $09<br />
30 nph/O'Possengsr<br />
8.0 in sldak<br />
5 1 0 1 5 a 0 e 5<br />
Heod Excursion (in)<br />
l l l r l r<br />
0 1 0 e 0 3 0 4 0 5 0 6 0 7 0 8 0<br />
Heod Excursion (cn)<br />
Flgure 11. Felative hesd speeds versus hsad excurslons for<br />
-1 .0 in. slack (teat #1) and 8.0 in. stack (te8t #g).<br />
Flgure 12b<br />
Flgure.I2. .Test #l-pasarngel wlth -1.0 In. slack. Speed: 30<br />
mph; dlrectioni 0 dogr€€8.<br />
Figure 13a<br />
Floure 13b<br />
Flfiure..l3..Test+Z-psea€nger wlth 0.0 in. stack. Speed: i0<br />
mph; directioni 0 degr€e8.<br />
Flgure 14a<br />
Flgure 14b<br />
Flgure..14. .Test #O8-paslsnger wlth 5.3 ln. slack. Speed: 30<br />
mphi direction: 0 d6grcas.<br />
429
.-l<br />
Figure 15b<br />
Flgure 15. Test #09-pase€nger with 8.0 in. slack. Speed: 30<br />
mph; direction: 0 degrees,<br />
Figure 16a<br />
Flgure 16b<br />
Flgure 16. Test #l2drlver wlth 0.0 ln slack. Speed: 30 mph;<br />
dlrectlon: 0 degrees.<br />
430<br />
Flgure 17b<br />
Flgure 17. Test #1S-driver with 3.0 In. slack. Speedr 30 mph;<br />
dlrectlon:0 degreea.<br />
Flgure 18a<br />
Fioure 18b<br />
Fi[ure 18. Test #14+]lver with *1.0 in. slack. Speed: 35 mph;<br />
direction: 0 degrees.
chest deflections while it reduced the chest accelerations<br />
from 37.7 to 30.1 G's. The shoulder strap load increased<br />
from 1407 to 1504 pounds with this amount of preload. For<br />
belt slacks up to 3 inches, chest accelerations were directly<br />
proportional to slack while belt loads and chest deflections<br />
were generally inversely proportional to slack. For slack<br />
conditions greater than 5 inches, the effects on chest responses<br />
of head/neck impacts to the instrument panel began<br />
to dominate.<br />
The highest chest deflection for the 0 deg. test series was<br />
I.86 in. for the 35 mph driver with a moderately pretightened<br />
belt. The highest chest acceleration of 52.3 G<br />
resulted for the 35 mph passenger with 3.0 in. belt slack. For<br />
the 30 mph passenger tests, there were no chest accelerations<br />
or deflections approaching the corridor limits established<br />
for this ATD (less than 60 G-3 ms clip and 2.0 in.<br />
chest deflection). These results are most probably attributable<br />
to the combined factors of vehicle crash pulse, retractor<br />
spool-off, and webbing stretch properties having to some<br />
extent been tuned to the dynamic loading characteristics of<br />
the Hybrid III chest response corridors. This is also consistent<br />
to some extent with the findings of Reichert (32) discussed<br />
above.<br />
Effects on chest responses of the belt initially off the<br />
shoulder against the basic condition of the belt strap on the<br />
shoulder were as$es$ed in two frontal tests. For a slack of 5<br />
in. with the strap off the shoulder (Test l0), the belt loaded<br />
into the right lower abdomen below the rib cage, and across<br />
the lower left rib cage structure. This concentrated loading<br />
on the Hybrid III chest structure, with reduced restraint<br />
contribution from the shoulder, caused both chest accelerations<br />
and deflections to increase.<br />
With l8 in. slack and the belt strap initially off the shoulder<br />
(Test I I ), the chest accelerations were below those for<br />
the l8 in. on-shoulder slack condition (Test l8), while chest<br />
deflections were the same. Belt loads were recorded in Test<br />
I I but not Test 18, so a direct comparison is not possible.<br />
The belt loads for Test I I were somewhat below peak onshoulder<br />
values because of influences from the head/neck<br />
impacting the instrument panel.<br />
Head results"-Head (center of) speeds relative to the<br />
interior of the compartment ver$us time and versus head<br />
excursion were plotted for each of the eighteen 0 deg. frontal<br />
tests in which varying amounts of torso belt slack was<br />
set. These head kinematic plots have been published recently<br />
elsewhere (45) and the remaining results from this study<br />
will be summarized here. Figure I I shows an overplot of the<br />
head speed versus excursion data for the passenger occupants<br />
in Tests I and 9. The head speed versus time and head<br />
speed versus forward excursion plots were con$tructed for<br />
each frontal test by detailed kinematic analyses of the high<br />
speed cine films. Cross checks indicated that the data was<br />
consistent and the Hybrid III's performance was repeatable.<br />
The head speed increased uniformly and predictably as the<br />
amount of slack in the shoulder belt is increased. Predictable<br />
exceptions occurred in Tests l0 and I I where the belt<br />
strap started off the shoulder and those results will be dis-<br />
cussed in more detail below. The kinematics plots of head<br />
motions of Figure 9 and l0 have been adjusted for parallax<br />
so that these plots look like the cine film frames and the<br />
time-based event$ match. The basic trajectory data were not<br />
corrected for parallax and thus the derivative results of<br />
relative head speeds and excursions inside the compartment<br />
are somewhat understated, but uniformly so.<br />
Results from this sled test program show the peak head<br />
velocities and excursions within the compartment are sensitive<br />
and repeatable outcome variables when plotted against<br />
the control variable of shoulder belt slack. In this series of<br />
tests, and indeed in any similar belt restraint tests conducted<br />
in a realistic compartment interior, head response variables,<br />
such as accelerations and the derived Head Injury Criteria<br />
(HIC), are strongly influenced by the energy absorption<br />
characteristics of what surface the head impacts and the<br />
relative orientation during that impact.<br />
These considerations were explored to some extent by<br />
TarriEre in 1982 (46), when he quantified the component<br />
forces acting on a three-point belted driver's head impacting<br />
a vehicle's steering wheel. TarriEre's argument, however,<br />
that the HIC limits can be safely increased to 1500 for belted<br />
drivers, gives insufficient attention to the fact that for this<br />
occupant, many impacts of the steering system with the<br />
head occur into the delicate facial area. The relatively weak<br />
facial bones are easily fractured causing serious cosmetic<br />
injuries, and these structures can also be driven rearward<br />
into the brain area. TarriBre's other argument, that no head<br />
injury is expected to occur if there is no head contact, is<br />
somewhat confirmed by the presently reported 30 mph 0<br />
deg. frontal results. When no impact occurred, the HIC36<br />
was below 1000. In the 35 mph 0 deg. tests, however, the<br />
HIC36 was over 1000 even for the no contact situation (Test<br />
l6).<br />
A 1986 study by Grdsch, et al. (47) confirms these concems<br />
regarding the insensitivity of the HIC to predict facial<br />
injuries and develops a Facial lnjury Criteria (FIC) as a<br />
basis for evaluating injuries to belted occupants. The results<br />
from his analysis indicate when comparing different energy<br />
absorbing steering wheel treatments, including air bags,<br />
some will exhibit higher HICs, but lower FICs. These authors<br />
$tate, with considerable substantiation, that in such<br />
instances, the FIC should be the controlling factor.<br />
These concepts can be related to the results of the present<br />
study by reviewing plots of maximum head velocity against<br />
the head forward excursion for the -1.0 (Test I ) and the 8.0<br />
(Test 9) in slack conditions. The envelope of head kinematics<br />
traced out for these conditions show the vulnerability of<br />
the head to impact injury is related not only to the head<br />
velocity (kinetic energy) at any given point, but is also<br />
related to how far forward in the compartment (how close to<br />
interior surfaces) the head is positioned when going that<br />
speed. For Test l, with the moderately pretightened shoulder<br />
belt, the maximum relative head speed was 17.4 mph<br />
which occurred after the center ofthe head had traveled l2<br />
inches-not near to striking any interior surfaces or objects.<br />
431
For Test 9, with 8 inches of slack in the shoulder belt, the<br />
maximum head speed was 29.4 mph which occurred after<br />
the center of the head had traveled 22 inches. This maximum<br />
head speed point was just one inch short of the 23 inch<br />
mark where the head impacted the instrument panel at a<br />
speed of 27.9 mph.<br />
The present approach to analyzing the effect on head<br />
re$ponse$ of increasing belt slack uses the rationale that the<br />
relationship of higher relative head speed and greater forward<br />
excursion inside the compartment is a good predictor<br />
ofthe potential for serious head and facial injuries. Substantiation<br />
for such an approach is given in terms of the kinetic<br />
energy dissipated in stopping the head from various relative<br />
interior velocities. For instance, the kinetic energy of the<br />
head (using Grdsch's effective mass of 16 pounds) at a<br />
relative head speed of 17.4 mph (which is the head speed for<br />
the best performing belt test of this series) is 162 ft-lb,<br />
whereas the kinetic energy for the head with 8 in. of slack in<br />
the belt and a head speed of 29.4 mph is 462 ft-lb, a factor of<br />
2.85 increase. As a comparison, the kinetic energy asso-<br />
l6<br />
)to<br />
x<br />
E<br />
o<br />
E.-<br />
>rc<br />
E<br />
U<br />
5ro<br />
.E<br />
E<br />
I<br />
u70<br />
u<br />
-60<br />
0<br />
r<br />
30 mph,zO'Possenger<br />
I<br />
I<br />
o/<br />
^o /o<br />
o /<br />
I<br />
5 1 0<br />
ShoutdeF Bett Stock (h,)<br />
l0 a0 30<br />
Shoul.der Bett Stock (cm,)<br />
-"-*<br />
Flgure 19. Maxlmum h6ad velocltle$ veraus ehoulder belt<br />
elack.<br />
n<br />
o<br />
Totat Herd TFavet<br />
ForraFd Axls Travet<br />
I<br />
j<br />
I<br />
T<br />
/<br />
{<br />
J-<br />
,t<br />
)6<br />
ry<br />
IFtr<br />
5 t 0<br />
Bett Stlck (hches)<br />
-10 0 r0 20 30 40 50<br />
Shoulden Bett Slqck (cm,)<br />
Flgure 20. llsxlmum head cxcurslona vsrsut ehoulder belt<br />
slack.<br />
432<br />
T<br />
t<br />
E - -<br />
6<br />
)a:<br />
E<br />
I<br />
f<br />
.E<br />
t<br />
tu<br />
I<br />
U<br />
30<br />
9as<br />
F<br />
b<br />
20<br />
--E<br />
ciated with the maximum relative head speed of 34.2 mph in<br />
these te$ts, is 625 ft-lb, a factor of 3.86 increase.<br />
Figure l9 summarizes the maximum relative head-tointerior<br />
velocity versus shoulder belt slack for the 30 mph<br />
frontal pa$senger tests in which the strap was on the shoulder.<br />
Figure 20 summarizes the maximum head excursion<br />
inside the compartment versus shoulder belt slack for these<br />
same conditions. For ten of the l8 frontal 0 deg. sled tests in<br />
this program, the test conditions were closely controlled,<br />
and the results for these ten tests can be directly compared in<br />
Figures 19 and 20. A perceptible break or knee in these<br />
curves occurs between five and eight inches slack, reflecting<br />
the onset of head impacts with the instrument panel for<br />
slack setting over 5 inches. In future testing it would be<br />
interesting to investigate possible influence of the Hybrid<br />
III head/neck/torso dynamics on these findings.<br />
To consider the effect of the torso strap being off the<br />
shoulder before impact, Figures 2l and 22 werc prepared<br />
which include Tests ll and 18. A simple normalization<br />
proce$$ was used by plotting the actual head speed and<br />
displacements for these off-shoulder tests, and then considering<br />
what additional apparent slacks might be introduced<br />
to have the off-shoulder data points fall on the on-shoulder<br />
l6<br />
0<br />
ir.<br />
=<br />
9'"<br />
t<br />
f,<br />
5ro<br />
Should€r Bclt $tqck (h,)<br />
| | | _.. _l .__-___ _._-<br />
-lt 0 l0 e0 30 40<br />
Shoutder Belt S(ack (cF)<br />
Flgure ?1. Msrlmum head vslocitles versus shoulder belt<br />
slack wlth ofl-shoulder condltions included.<br />
c70<br />
' 6 0<br />
t<br />
s<br />
t<br />
F30<br />
=<br />
6<br />
>ei<br />
E<br />
! a<br />
E<br />
30<br />
te5<br />
Note, The Bett off-Shoutdrr Increases the Effectlve StaEk Byl<br />
- Test 10, Fron 5 h, to / h = e h<br />
- feEt U, Fron 18 h. to 24 h, = 6 h,<br />
30 nph 0'Fdssenoer<br />
I<br />
/<br />
.v<br />
I<br />
fr<br />
lo<br />
F-dI<br />
/<br />
5 1 0 1 5<br />
ShoeLder Bett St0ck (h,)<br />
q--<br />
---F<br />
. 1 0 0 t 0 d 3 0 4 0 5 0 6 0 7 0<br />
ShoqldfF Bett $tock kE,)<br />
Flgure 22. Msxlmum hesd excureions vsrsus ehouldsr belt<br />
slack with ofl-shoulder condltions lncluded.
curves. The results of this analysis indicate$ that with the<br />
belt off the shoulder, a slack of 5 inches looks kinematically<br />
like a slack of 7 inches. With l8 inches of slack. the belt off<br />
the shoulder looks kinematically like a slack of 24 inches.<br />
The 5 to 7 inch slack analogy for the on and off-shoulder<br />
conditions is reasonable to describe this effect quantitatively.<br />
However, at the l8 inch slack setting the head<br />
impacts to the instrument panel were so heavy that this kind<br />
of comparison is presented here as descriptive only. It is<br />
interesting to compare the responses for the off-shoulder<br />
conditions in Figure 2l and 22 with those in table I . For the<br />
5 inch off-shoulder condition, the chest acceleration, shoulder<br />
belt load, and chest deflection was the highest for any of<br />
the 30 mph frontal 0 deg. passenger tests, whereas the head<br />
respon$eri were not the highest in this series.<br />
Figure 23 compares the peak head speed versus shoulder<br />
belt slack for the previously discussed 30 mph frontal 0 deg.<br />
pa$$enger tests with these same variables for the 30 mph<br />
frontal 0 deg. driver tests and the 35 mph frontal 0 deg.<br />
driver/passenger tests. This last comparison can be made<br />
because the peak head speed occurs before impact. Even so,<br />
when comparing the 30 mph driver with the 30 mph passenger,<br />
the driver peak head velocities are slightly and consistently<br />
higher. This effect has not as yet been totally explained<br />
but it is probably due in part to the positioning of the<br />
hands and arms holding the steering wheel.<br />
dt+<br />
u<br />
t u 12<br />
o ' -<br />
oj<br />
-b<br />
o<br />
0r .^<br />
I T U<br />
E<br />
f,<br />
X<br />
E ^ 6<br />
_c<br />
r<br />
1i<br />
H.=<br />
tu<br />
d<br />
0J<br />
I<br />
Ea0<br />
f<br />
T<br />
d<br />
E<br />
3C Eph/o' +<br />
Drtver<br />
/<br />
'A<br />
6<br />
0 5<br />
Shoutder Bett Stock (inches)<br />
0 1 0<br />
Shoutder Bett SIock (cm,,r<br />
Figure ?3. Itlgxlmum head veloclty veraua shoulder belt alack<br />
for trontal drlvers and passengers<br />
at 30 and 35 mph.<br />
Shoulder belt slack in the range of0 to 5 inches is found<br />
most frequently in American cars because the automobile<br />
and belt manufacturers designed the U.S. type windowshade<br />
tension relief devices to introduce slack amounts<br />
in this range. These devices will however, introduce any<br />
amount of slack up to the total amount of webbing available<br />
under certain circumstances. The results of these tests, as<br />
presented in figure 23, show that the effects ofintroducing 5<br />
inches of slack into a shoulder belt is approximately equiva-<br />
/o<br />
' 30 Aph/o'<br />
ParrtngaF<br />
lent to raising the barrier equivalent impact severity from 30<br />
to 35 mph, a severe result when kinetic energies are considered.<br />
At a given slack, going from 30 to 35 mph B.E,V.<br />
raises the maximum head speed about 6.5 mph.<br />
Figure 24 relates both HIC and HIC36 to the shoulder belt<br />
slack for Tests I through 9 and I 8, all of the pa$senger tests<br />
at 30 mph. The HICs rise predictably for slacks of - I .0 to 8<br />
in., but then fall significantly from 8 to l8 in. More data<br />
points would be desirable in this range to fully explain this<br />
drop at the higher slack levels, but in the absence of such<br />
additional data points, the following observations can be<br />
made here. First, the top and brow of the instrument panel in<br />
the late model Ford LTD is constructed of a plastic substructure<br />
which is a reasonably good energy absorber if impacted<br />
in an advantageous direction. With the l8 in. of slack in<br />
these tests the Hybrid III's head hit more of the flat upper<br />
yielding surface of this instrument panel, and in two tests<br />
yielded HIC's between 700 and 800.<br />
Leeendr<br />
O Btss Possenger HIC<br />
tr Blss Passenoea HIC36<br />
# Esser HIC<br />
P Roneo HIC<br />
O Blss 3-poht Ilnrver HIC<br />
1 6<br />
Shoutder<br />
E l0 le l,t 16 l8<br />
Bett Stock (lnches)<br />
t0 a0 30 r0<br />
Shoutder Bett Stqck (cft.)<br />
Figure 24. Comparlsons of HIC vs, Shoulder Belt Slack trom<br />
Vsrlous Research Programr.<br />
Figure 24 also compares the HIC values from this study<br />
with those previously reported by Esser and Romeo (43,48)<br />
of three-point belt sled tests performed by TRC in Ford<br />
sedan sled bucks with the $ame Ford belts. For the Esser<br />
passenger tests at 30 mph, the HIC values match the present<br />
data closely up to 2 inches. He then has no data to report<br />
until a forth test at 163/+ inches slack. In his tests, the instrument<br />
panel was constructed of a sheet metal substruature<br />
which probably explains the large difference in the HIC<br />
values for his I 63/+ in. slack test and the results for the I 8 in<br />
slack tests reported here. These results again demonstrate<br />
the significance of not only of the head speed at impact, but<br />
433
Test fl2, Driver: J0 mph<br />
Test #15, Driver<br />
Projection of Test #1 PoEs6nger Results to q 30 mph, -1.0 in slock Teet for Driv€r<br />
Figure 25a-25c: Head Tralectorles lor 0 deg. 30 mph Drlver Wlth<br />
-i-o, o.o and 3.0 inches Slack.<br />
the energy absorbing characteristics of the surface<br />
impacted.<br />
Romeo conducted a 30 mph three-point belted driver sled<br />
te$t with a Hybrid II in the same body buck used for this<br />
study and his test produced a HIC of 865, essentially the<br />
same a$ obtained in this study. In his study, Romeo also<br />
tested a lap belted only driver with the same design of<br />
steering wheel and column used in this study and recorded a<br />
HIC of 2584, considerably more than the peaks recorded in<br />
either the present tests, or in Esser's tests.<br />
Figures 25a and 25b compare the head kinematics for the<br />
driver occupant with 0.0 and 3.0 inches of slack for the 30<br />
434<br />
mph test condition. As the results discussed above showed,<br />
the steering wheel is well within the head swing trajectory<br />
of the driver even with zero slack. However, the location of<br />
the dummy's face/head impacts into the steering wheel<br />
changes with the amount of slack as does the impact speed.<br />
The steering wheel used in this test series would be classified<br />
by Glyons (49) as a non-energy absorbing type in which<br />
the plastic molding is primarily for cosmetic purposes. Although<br />
the highest HICs for the driver tests at 30 mph was<br />
1165, l2o/o over the 1000 limit FMVSS 208 uses to predict<br />
brain injury, analyses similar to Grdsch (47) and Gloyns<br />
(49) would most probably predict serious facial injuries for<br />
all the driver tests at 30 mph with slacks of zero or more.<br />
The results of the present study have been structured in<br />
such a way as to permit interpolation of the results to related<br />
test conditions which were not actually run on the sled. For<br />
instance, figure 25c shows the predicted results of a driver<br />
test at 30 mph 0 deg. frontal with a pretightened belt.<br />
Whereas the head impact speeds for the zero and 3.0 inch<br />
slack conditions were in the 20 mph range, pretightening the<br />
belt to between 40 and 50 pounds drops the head impact<br />
speed below 8 mph. This again emphasizes the usefulness of<br />
the head speed envelope ("how far-how fast") analysis<br />
developed in this study.<br />
The influences of the force-deflection characteristics of<br />
the various surfaces impacted by the head during the presently<br />
reported tests have been considered, but the mean'r to<br />
rigorously control these impact conditions were not immediately<br />
at hand. It was found during these tests that the initial<br />
head impact point for both the driver and passenger test$<br />
could be repeated predictably. It was, however, more difficult<br />
to control the mutual head-to-surface force-deflection<br />
characteristics of these impacts which determine variations<br />
in head acceleration, and thus HIC levels (and with extended<br />
capability, facial injury indices). The presently reported<br />
results show that this may be possible using the Hybrid III<br />
dummy and with considerably more resources than were<br />
expended here-for instance purchasing new steering columnrl<br />
and wheels for each test and instrumenting the faces<br />
per Grrisch. Short of this, using the maximum relative head<br />
velocities as a predictor of head/face injury potential is an<br />
intermediate, but useful tool in studying the effects of shoulder<br />
belt slack.<br />
Oblique $led Test Results<br />
The 38 deg. orientation of the sled body buck for Tests I 9<br />
through 28 was approximately the angle at which the shoulder<br />
harness defines a plane cutting across the car. If the strap<br />
stays on the rib cage structure during oblique impacts in this<br />
range of severity, one would expect that the belt should<br />
provide effective restraint.<br />
Figures 26a through 26e show two high speed movie<br />
views of the kinematics of the Hybrid III in the 30 mph, 38<br />
deg. oblique sled test in which the belt was pretightened to<br />
40*50 lb (approximately-1.0 in. slack). This pretightening<br />
pocketed the belt into the dummy's clothing and skin, and as<br />
the impact progressed, it became obvious that this pre-
pocketing contributed to the belt effectively staying on the<br />
shoulder and chest structure (clearly across the stemum)<br />
throughout the test. The frame in this figure shows the<br />
Hybrid III at its maximum forward excursion (before rebound)<br />
to the front and right.<br />
Figure 26a<br />
Figure 26b<br />
Figure 26c<br />
Flgure 26d<br />
Flgure 26e<br />
Flgures 26a-26e: Test #1g-Passeng€r wlth -1.0 ln. slack.<br />
Sp-eed: 30 mph; obllque 38 degreee.<br />
Figures 27a through 27e show two high speed movie<br />
views of the kinematics of the Hybrid III for these same test<br />
conditions but with the belt slack set at 0 in. In this condition,<br />
when the belt is initially positioned on the shoulder, it<br />
seats or pockets itself into the occupant's clothing and flesh<br />
early in the impact sequence and the strap stays on the<br />
shoulder/chest structure-well up on the sternumthroughout<br />
the impact.<br />
The effect of slack on Hybrid III responses in frontal sled<br />
tests has been discussed above and is a good starting point to<br />
discuss the effects of slack in the oblique sled tests reported<br />
here. In these tests, added to the forward motions are the<br />
lateral motions caused by the 38 deg. sled orientation. When<br />
the torso strap is off the shoulder, 1.3 to 3.0 inches of slack is<br />
enough to permit the belt to hang low on the chest/sternum<br />
area pre-test. During the impact the belt changes position<br />
coming off the right rib cage and is barely on the left rib cage<br />
structure, if at all. This amount of slack also allows the belt<br />
to hang over the corner of the shoulder, but in the Hybrid III,<br />
that is still within the range of the notch in the shoulderjoint<br />
flesh at that point. As the impact progre.ese$ the belt catches<br />
in the shoulder notch, but this is still not enough to keep the<br />
belt from assuming a dangerous biomechanical position<br />
across the lower thorax and abdomen during loading.<br />
43s
Flgure 27a<br />
Figure 27b<br />
Figure 27c<br />
Figure 27d<br />
Floure 27e<br />
Fllurea 27a-27e: TsEt #26-pa$sanger with 0.0 in. slack.<br />
Speed: 30 mph; oblique 3E degrees.<br />
With 3 inches of slack in the belt, but initially positioned<br />
on the shoulder, the belt strap initially pocketed itself into<br />
the occupant's clothing and chest flesh at the beginning of<br />
the impact sequence. As the sequence progressed, the shoulder<br />
strap stayed on the rib cage long enough to effectively<br />
restrain the forward and lateral motions of the thorax without<br />
the belt slipping into the abdominal area. Similar results<br />
were obtained in Tests 20 and 22 where the belt was initially<br />
on the shoulder but with 2.5 and 2.3 inches of slack, respectively.<br />
Again the belt stayed on the rib cage long enough to<br />
arrest the forward and lateral motions without the strap<br />
slipping off into the abdominal area. In both these tests the<br />
shoulder belt strap passed over the notch in the shoulder<br />
flesh of the Hybrid III without snagging, as frequently happened<br />
in terrts where the belt was initially off the shoulder.<br />
Figures 28a through 28g show that with as little as l.3<br />
inches of slack, the belt can be positioned off the shoulder,<br />
permitting the occupant's rib cage/shoulder structure to<br />
come out of the belt early and cause severe abdominal<br />
loading. The initial position of the shoulder strap is near the<br />
top of the shoulder flesh notch of the Hybrid III. During this
Flgure 28d<br />
Flgure 28f<br />
Flgure 289<br />
Figure 2Bc<br />
Fllures 28a-289: Test #zFpas$enger with 1.3 in. slack. $peed: 30 mph; oblique 38 degrcee. Belt Inltlally poaltloned otl-ahoulder.<br />
437
impact the belt partially snags in this notch, but despite this,<br />
the dummy still twisted out of the belt as the impact progressed<br />
and the strap loaded heavily into the lower chest/<br />
abdomen area. Again, this test emphasizes the importance<br />
of the initial position of the shoulder strap on an occupant<br />
just before an impact.<br />
On this point, it is interesting to draw the reader's attention<br />
back to one of the significant claims in the original<br />
Bohlin patent for the three-point belt (1,2,3). The threepoint<br />
belt, when positioned on the body properly, should<br />
apply restraint forces to the body in a "physiologically<br />
correct" manner to engage the strong skeletal structures of<br />
the body. Clearly, the results of these sled tests demonstrate<br />
non-compliance with this fundamental principle when the<br />
belt is positioned off the shoulder or even on the corner of<br />
the shoulder before the impact.<br />
The initial position of the belt at the beginning of the<br />
impact is a strong determinant of where the belt will physiologically<br />
load the anatomy during the impact. As little as<br />
1.3 inches of slack allows the belt to drop 6 to 8 inches<br />
vertically on the chest/sternums, and this initial orientation<br />
seems to be a dominant factor in the configuration of the belt<br />
loading during impact. In this case, again, loading dangerously<br />
into the lower chest/abdominal area.<br />
A sled test was conducted in which the occupant was<br />
leaned forward with the belt strap on the shoulder/thorax<br />
with 3 inches of webbing unwound from the retractor (Test<br />
?8). In this test the occupant's forward and lateral motions<br />
were effectively restrained while the strap stayed on the rib<br />
cage shoulder structure. Thus, even with the occupant leaning<br />
forward to take advantage of the freedom of movement<br />
provided by the ELR, and with the shoulder strap snug and<br />
positioned properly, the slack effects are minimal if the<br />
occupant does not strike anything. The findings of this<br />
study, that where the belt starts out on the anatomy is critical<br />
to safety belt performance, was confirmed again in this test.<br />
There is no analog in the human for a notch in the flesh at<br />
the shoulder. It is doubtful that the human shoulder would<br />
act like the Hybrid III shoulder in impacts such as these<br />
tests, catching the belt during oblique tests. As such, it is<br />
probable that the belt would end up even lower on the<br />
human or cadaver than on the Hybrid III as photographed<br />
here. Accordingly, oblique occupant retention tests on<br />
three-point belts which have a tendency to introduce slack<br />
during use should be re$ted not only with the Hybrid III, but<br />
with surrogates in which the shoulder simulates the human<br />
both in the pre-test and test conditions. Altematively, an<br />
improved Hybrid III shoulder should be produced so that<br />
the range of biofidelity of this ATD can be extended to<br />
frontal oblique impacts.<br />
These results strongly suggest that public information<br />
campaigns are needed to better educate belt users about the<br />
biomechanical implications both of wearing shoulder belts<br />
slack and of not having them positioned on the clavicle area<br />
before any potential collision.<br />
438<br />
An Assessment of the Safety Effects of<br />
Slack on the Safety Performance of the<br />
Three-Point Belt<br />
Summary of sled test findings,-The results of this sled<br />
test program lead to an overview of the safety effects on<br />
three-point safety belt performance of the TRD<br />
windowshade which can be summarized as follows:<br />
r Biomechanically, where the shoulder strap is<br />
initially positioned on a person before an impact<br />
has just as significant an effect on crash<br />
perforrnance as does the amount of slack.<br />
r For the three-point belt tested, the most sensitive<br />
outcome variables were the head speeds and<br />
excursions inside the compartment versus<br />
shoulder belt slack.<br />
r Modest levels of pretightening, 40-50 pounds,<br />
significantly reduce first the probability, and<br />
second the severity oflhe occupant's head striking<br />
the interior; and, also significantly reduces the<br />
likelihood that the occupant's torso will come out<br />
of the belt in oblique impacts.<br />
r Forthe passengeroccupant in the three-point belt/<br />
interior system tested, there was only a slight<br />
degradation of occupant injury measures with one<br />
inch of slack and the belt on the shoulder as<br />
compared to the zero slack setting. However,<br />
r As little as 1.3 inches of slack permits the belt to<br />
lie over the corner of the shoulder resulting in<br />
poor belt placement and a dangerous<br />
configuration of belt loading during the impact.<br />
r Thus, for the passenger occupant, there is a<br />
narrow range of slacks, one inch or less, which<br />
might be permitted for comfort reasons under<br />
certain circumstances.<br />
r For driver occupant$, the steering wheel is in the<br />
head swing zone for all slacks greater than zero.<br />
The speed at which the head impacts the steering<br />
wheel changes modestly from 19.7 to ?2.3 mph<br />
when the slack is increased from 0 to 3.0 inches<br />
but as the slack is increased, the face is more likely<br />
to be directly impacted versus the forehead/skull.<br />
With modest pretightening of the shoulder belt<br />
4G-50lb, the head impact speed drops to 7.8 mph<br />
and the head contact point moves even further<br />
away from the face.<br />
r The driver obtains all the same benefits of modest<br />
pretightening ofthe belt as the passenger, plus the<br />
benefit that the severity of his head impact with<br />
the steering wheel significantly reduced.<br />
r These results indicate clearly the immediate need<br />
for either air bags or energy absorbing steering<br />
wheel treatments for drivers of all three-point belt<br />
equipped cars to protect the face during impacts as<br />
many of the works referenced herein have pointed<br />
out before.
The Emergency<br />
Locking Retractor<br />
Reconsidered<br />
ELRts as crash sensors<br />
Over the past twenty years intense efforts have gone into<br />
the analysis of air bag crash sensors. Such efforts have<br />
routinely included many non-standard tests to determine the<br />
sensitivity of the sensor to initiate reliably in a wide variety<br />
of crash modes. At least in the public arena there has been no<br />
reponed comparably intense analysis designed to determine<br />
the limits of reliable operation and failure modes of the<br />
emergency locking retractor. As mentioned above there has<br />
been some discussion (4,6,23,24) about the possibilities for<br />
the ELR to not lock in certain circum$tances. but when these<br />
types of situations have reached the public discussion stage<br />
(41,42), the resolution involved rhe rarionale that possible<br />
failure to lock or delayed lock would only occur in a few<br />
isolated instances. Such a rationale has neverbeen accepted<br />
in the development and evaluation of air bag crash sensors.<br />
Based even on the limited public record, it seems<br />
warranted to initiate programs to evaluate the reliability of<br />
various ELR designs to lock reliably. The first area to<br />
consider is the rollover mode where there are multiple<br />
impacts from many different directions on the vehicle<br />
chassis, where the occupant motion is probably not in phase<br />
with these vehicle dynamics, and where the ELR<br />
requirement to maintain its locked position-that the<br />
occupant maintain constant tension on the webbing-is<br />
likely to be violated a number of times during the impact. A<br />
dynamic version of the FMVSS 301 rollover test in which a<br />
balanced body buck with a three-point belted occupant is<br />
rotated at a speed of, for instance, one revolution per second<br />
for a sustained period of time would be a reasonable staning<br />
point. Funher investigative steps should include preimpact<br />
shake dynamics to simulate rough ground or partial fall<br />
conditions just prior to impact.<br />
Design Concepts Growing Out of This<br />
Study<br />
Rethinking the Tension Relief Device<br />
r The present design of the TRD is unsatisfactory<br />
because, even within its prescribed operation<br />
envelope, it introduces slack which can be<br />
hazardous in oblique impacts, and it routinely<br />
introduces even more than the recommended<br />
amount. The root of the problem isthat the present<br />
TRD is a negative option devirc as shown in<br />
Figure 29a, and gives the wearer the above<br />
described amounts of slack whether or not he<br />
wants it, knows what to do with it. or knows the<br />
biomechanical implications of it. There are better<br />
alternatives as discussed below.<br />
r Although the European approach to safety belt<br />
performance effectively precludes the TRD<br />
I<br />
E<br />
J<br />
o<br />
l<br />
.E<br />
s<br />
!<br />
l<br />
I<br />
o<br />
I<br />
E<br />
l<br />
o<br />
l<br />
E<br />
t<br />
!<br />
)<br />
o<br />
T<br />
o<br />
J<br />
O<br />
E<br />
tr<br />
Posrtrve actron, e.S" Ou5hing button,<br />
setE on€ the controlted slock, bst<br />
only Ffoh ofrgindl bett-on posilon.<br />
AAy for{o/d notton beyond<br />
E In. rf5ati bstt to Enug,<br />
TRn connot be ret *ben leq^hg<br />
lo.wq.d. fhere ls oniy one TRD<br />
setthg per belt *eo.Lhg.<br />
B<br />
---f--<br />
l<br />
I<br />
;<br />
6<br />
j<br />
t : l<br />
t t<br />
Figure$ 29s-29b: Operatlonal comparison of present TRD<br />
wlndowshada with controlled elack zone device.-<br />
device, $ome type of slack eliminator with a<br />
strictly controlled limit to the amount of slack<br />
possible might be indicated for obese persons and<br />
other "special conditions." However, based on<br />
the European experience with comfort designs<br />
and wearing rates, and the industry'$ own<br />
assessment of the impact of the TRD on usage<br />
rates, it appears unnecessary to expose all users to<br />
the downside risks associated wilh the pre$ent<br />
operational characteristics of these devices. Thus,<br />
the windowshade should be sold only as an option<br />
for special cases and only in a highly modified<br />
form.<br />
An all new concept is shown in Figure 29b.<br />
Comparing with the present negative option<br />
device in Figure 29a, the new concept is a positive<br />
option device that will only introduce a strictly<br />
controlled amount of slack (one inch or less as<br />
indicated by the results of this study) and only sets<br />
one "comfort zone" per belt application. Such a<br />
device would appropriately be called a<br />
"Controlled<br />
Tension Zone Device (CTZ)." This<br />
concept eliminates the grossly excessive slack<br />
that the TRD can introduce, and restores the best<br />
functional attributes of the ELR, that of keeping<br />
the belt strap near the che$t. One concept is to<br />
have a positive action "push button" or some<br />
other actuator available to the occupant to only<br />
439
introduce the controlled zone slack ifthe occupant<br />
actually feels enough discomfort to positively<br />
take action. Otherwise the ELR works as normal.<br />
Another version of the concept is that the forward<br />
motion of the shoulder, much like the present<br />
TRD, would set the one time limited slack into the<br />
CTZ, but if there was any forward motion at all<br />
beyond the stop, the device would reset the<br />
webbing to snug.<br />
Pretighteners vs. Pretensioners vs,<br />
Positive Locking Devices-a Proposed<br />
Definition<br />
The results of this study confirmed the many benefits<br />
reported elsewhere ofpretightening a belt in the early stages<br />
of a crash event. Although it would at first seem to be a<br />
solution to the TRD slack problem to install such<br />
pretensioners in conjunction with the TRD, special<br />
considerations are in order. Pretensioners (ala Daimler-<br />
Benz) are not indicated for use with TRD belts because the<br />
relatively high pretensioning force (300-400 lbs) could<br />
snap the belt tight from a slack position creating a dangerous<br />
cabling action. An alternative to the high level pretensioners<br />
is one suggested by this study, that of a pretightener capable<br />
of modest tension in the 4f50 lb range.<br />
When considering these more modest levels of<br />
pretightening many new possibilities open up for improving<br />
the safety performance and reliability of typical three-point<br />
belt designs. This modest pretightening should accomplish<br />
the same positive locking task discussed above (in which<br />
damping was used) to prevent intermittent locking and<br />
unlocking of the retractor spool. With the pretightening<br />
forces low, pre-impact anticipatory initiation can be<br />
considered in which the belts would tighten and positively<br />
lock during emergency braking, tripping actions, rolling<br />
motions, etc. Because the pretightening forces are low, and<br />
thus the energy requirements are low, the units can be<br />
designed to be easily resetable by the user in either the<br />
preimpact, or impact initiation scenario. The initiation<br />
sensing mechanism of the pretightener can take consider*<br />
able advantage from the extensive pool of analysis<br />
techniques developed for air bag crash sensing and other<br />
shock type sensing tasks.<br />
In short, an easily resetable pretightener/positive locking<br />
device can be triggered which would:<br />
r Eliminate the slack from tension eliminators and<br />
other causes. In the process of eliminating this<br />
slack, the easily resettable pretightener will<br />
position the torso strap properly on the shoulder<br />
which was shown in this study to be critical to the<br />
safety performance of the three-point belt'<br />
r Positively lock (damp) the ELR retractor and<br />
prevent unlocking and reel-out during multiple<br />
impacts and rollovers.<br />
r A continually renewable energy source would<br />
recharge the pretightening device while the<br />
vehicle is in normal use, examples:<br />
Normal occupant movements of putting on and<br />
wearing the belt could store energy in springs for<br />
the pretightener function.<br />
Electrical energy from the vehicle could be used<br />
at low rates to recharge the pretightener energy<br />
source.<br />
r Alternatively, for higher set crash levels of<br />
initiation, but yet lower than the damage point of<br />
the retractor hardware, easily serviced replaceable<br />
energy sources are a possibilitY.<br />
r The attractiveness of these concepts are that they<br />
can be incorporated in an incremental fashion and<br />
each one will improve the performance of the<br />
present TRD belt system. A coordinated program<br />
to incorporate these measures as a system will, of<br />
course, lead to the optimal pay-off.<br />
Conclusion<br />
The present design of the TRD windowshade is<br />
hazardous in a number of ways and urgently needs<br />
rethinking in order to conform to the original safety goals of<br />
the three-point belt patent. To the extent that tension<br />
elimination devices will continue to be sold to the general<br />
public, major redesigns are necessary to meet these goals.<br />
Some concepts are presented here, based on considerable<br />
first-hand analysis experience, which would go a long way<br />
towards meeting these goals. Additionally, the types of<br />
concepts, designs and devices which will improve the<br />
tension elimination/reduction devices will, in most<br />
circumstances, greatly improve the performance and<br />
reliability of other three-point belt hardware components<br />
such as the emergency locking retractor.<br />
References<br />
(l) Sverige Patent227 568, "Siikerbetssele<br />
vid fordon,"<br />
Uppfinnare; N.I. Bohlin, AB Volvo, G0tenborg, Patenttid<br />
Frfln Den 29 Augusti 1958.<br />
'(2) "Safety<br />
United States Patent 3,043,625, Belt," Nils<br />
Ivar Bohlin, Gdteborg, Sweden, assignor to Aktiebolaget<br />
Volvo, Gciteborg, Sweden, filed August 17, 1959, Serial No'<br />
834,258.<br />
(3) German Patent No. 1101987, (Award presented as<br />
Most Important Patent No. 8) "Safety Belt for Vehicles,"<br />
Nils Ivar Bohlin, Giiteborg, Sweden, patented from August<br />
?4, 1959 on.<br />
(4) Bohlin, N.1., "Refinements of Restraint System<br />
Design-A Primary Contribution to Seat Belt Effectiveness<br />
in Sweden," Proceedings, <strong>Int</strong>ernational Symposium on<br />
Occupant Restraint, American Association for Automotive<br />
Medicine, Toronto, Ontario, Canada, June l-3, 198 I.<br />
(5) Johannessen, H. George, "Historical Perspective on<br />
Seat Belt Restraint Systems," SAE Paper 840392,<br />
<strong>Int</strong>ernational Congress & Exposition, Detroit, Michigan,<br />
February 27-March 2, 1984, pp.217-225.
(6) MacKay, G.M., P.F. Gloyns, H.R.M. Hayes and D.K.<br />
Criffiths, "Europcan Vehicle Safety Standards and Their<br />
Effectiveness," University of Birmingham, U.K., Proceedings,<br />
4th <strong>Int</strong>emational Congress on Automotive Safety,<br />
NHTSA, Washington, D.C., July, 1975, pp. 431454.<br />
(7) Bohlin, N.L, "Srudies of Three-Poinr Restrainr<br />
Hamess Systems in Full Scale Barrier and Sled Runs," AB<br />
Volvo, Giiteborg, Sweden, 8th Stapp Car Crash and Field<br />
Demonstration <strong>Conf</strong>erence, Wayne State University,<br />
Detroit, Michigan, October, 2l-2?, 196/..<br />
(8) Federal Register, Vol. 44, No. 251, Monday,<br />
December 31, 1979,49 CFR Part 571, (Docket No.7zl-14:<br />
Notice l7), "Federal Motor Vehicle Safety Standards:<br />
Improvement of Seat Belt Assemblies."<br />
(9) Ford Motor Company, Reply to DocketT4-14; Notice<br />
17, NPRM, Letter to Joan Claybrook, Adminisrraror,<br />
NHTSA, April I, 1980.<br />
(10) Motor Vehicle Manufacturers Associarion, Reply to<br />
Docket 74-14, NPRM, Letter ro Joan Claybrook,<br />
Administrator, NHTSA, April l, 1980.<br />
(ll) Chrysler Corporation, Reply ro Docket 74-14,<br />
NPRM, Letter to Joan Claybrook, Administrator, NHTSA,<br />
March 28. 1980.<br />
(12) General Motors Corporarion, Reply to Docket 74-<br />
14, NPRM, Letter to Joan Claybrook, Administrator,<br />
NHTSA, April l, 1980.<br />
(13) Danner, M., K. Langwieder, and Th. Hummel,<br />
"The<br />
Effect of Restraint Systems and Possibilities of Furure<br />
Improvements Derived from Real-Life Accidents," SAE<br />
Paper 840394, Society of Auromotive Engineers,<br />
Warrendale, PA, 1984.<br />
(14) Kendall, D.L., M. Fowkes, I. Gazeley, and C.M.<br />
Haslegrave, "Comfort<br />
and Convenience of Safety Belts in<br />
Everyday Use," Report No. l98l/2, The Moror Indusrry<br />
Research Association, Warwickshire, England.<br />
(15) Personal Comrnunicarion with N.I. Bohlin.<br />
(16) Federal Register, Vol. 41, No. 243, Thursday,<br />
December 16, 1976,49 CFR Part 571, (Docket No. 7zt-14:<br />
Notice 7), "Federal Motor Vehicle Safety Standards."<br />
(17) Moffan, Charles, A., Edward A. Moffatt. and Ted R.<br />
Weiman,<br />
"Diagnosis of Seat Belt Usage in Accidents,"<br />
SAE Paper 840396, Warrendale, PA 15096.<br />
(18) Bedard, P., "Slack Thinking in Detroit," Car and<br />
Driver, Vol.32, No. 12, June 1987, pp. 190-191.<br />
(19) Henderson, C., "Comfort and Convenience<br />
Improvements to Increase Safety Bett Utilization," SAE<br />
Paper 770187, <strong>Int</strong>ernfltional Automotive Engineering<br />
Congress and Exposition, Detroit, Michigan, February 28-<br />
March 4. 1977.<br />
(20) Grimm, A.C., "<strong>Int</strong>ernational<br />
Restraint Use Laws."<br />
University of Michigan, UMTRI, Research Review, Vol.<br />
18, No.4, Jan.-Feb. 1988.<br />
(21) Mitzkus, J.E. and H. Eyrainer,<br />
--Three-Poinr<br />
Belr<br />
Improvements for Increased Occupant Protection," SAE<br />
Paper 840395, Society of Automotive Engineers,<br />
Warrendale. PA. 1984.<br />
(22) Grtisch, L., H. Kaiser, and W. Schmid,<br />
"Mathematical<br />
Movement and Load Simulation for<br />
Persons Involved in an Automobile Accident," SAE Paper<br />
871 109, Governmentflndustry Meeting and Exposition,<br />
Washington, DC, May l8-21, 1987.<br />
(23) United States Parent 3,825,205,<br />
"Moror<br />
Vehicle<br />
Safety Devices," T. Takada, Takata Kojyo Co. Ltd., filed<br />
June 8. 1972.<br />
(24) United States Patent 3,87l,47O,<br />
"Safety Belt<br />
Tensioning Device," Schwanz et al., Volkswagenwerk<br />
Aktiengesellschafr, fi led October 21, 1972.<br />
(25) United States Patent 3,871,683,<br />
"Vehicle<br />
Safety Belt<br />
Tightener," S. Otani, Nissan Motor Company, Ltd., filed<br />
January 23, 1974.<br />
(26) United States Patent 3,929,2O3,<br />
"Mounting<br />
Device<br />
for Shoulder Harness Type Safety Belt," Y. Nagazumi,<br />
Nissan Motor Company, Ltd., filed January 17, 1974.<br />
(27) Ciccone, Michael A. and JoAnn K. Wells,<br />
"Improper<br />
Shoulder Belt Use by Maryland Drivers,"<br />
Insurance Institute for Highway Safety, Washington, DC,<br />
June 1987.<br />
(28) Emshwiller, J. R., "Seat-Belt<br />
Slack: Comfort Device<br />
in U.S. Car Raises Safety Concern," The Wall Street<br />
Journal, July 31, 1987.<br />
(29) Aldman, Bertil and Arne Asberg, "Impact<br />
Amplification in European Compacts," Laboratory for<br />
Traffic Medicine, Swedish Council on Road Safety<br />
Research, SAE Paper 680790, Society of Auromotive<br />
Engineers, Warrendale, PA, 1968.<br />
(30) Stapp, J.P., "Human Exposure ro Linear<br />
Deceleration," Parts I arrd 2, AF Technical Report 5915,<br />
I 949-19s l.<br />
(31) Monis, J.8., "Seat Belt Performance in 30 MpH<br />
Barrier Impacts," U.S. Department of Transportation,<br />
NHTSA, Report No. DOT HS-802 480, April 27, t977,<br />
National Technical Information Service, Accession No.<br />
PB-269 962.<br />
(32) Reichert, J.K. and T.J. Bowden, "A Study to<br />
Determine the Quantitative Effects of Seat Belt Slack,"<br />
DCIEM Report No. 8fR-64, Prepared for Deparrment of<br />
Transport Canada, Defence and Civil Institute of<br />
Environmental Medicine, Downsview, Ontario, November<br />
1980.<br />
(33) Horsch, J.D., "Occupant<br />
Dynamics as a Function of<br />
Impact Angle and Belt Restraint," General Motors<br />
Research Lab., SAE Paper 801310, Society of Auromorive<br />
Engineers, Warrendale, PA, 1980.<br />
(34) Backaitis, S.H., L. Delarm, and D.H. Robbins,<br />
"Occupant<br />
Kinematics in Motor Vehicle Crashes," SAE<br />
Paper 820247, Society of Automotive Engineers,<br />
Wanendale, PA. 1982.<br />
(35) Rattenbury, $.J., P.F. Golyns, H.R.M. Hayes, D.K.<br />
Griffiths, "The Biomechanical Limits of Seat Belt<br />
Protection," Proceedings, American Association for<br />
Automotive Medicine, Louisville, KY, October 34, 1919.<br />
(36) Shanks, J.E. and A.L. Thompson,<br />
"Injury<br />
Mechanisms to Fully Restrained Occupants," McGill<br />
MI
University, Montreal, SAE Paper 791003, Society of Automotive<br />
Engineers, Warrendale, PA, 1979.<br />
(37) Niedener, P., F. Waltz, and U. Zollinger, "Adverse<br />
Effects of Seat Belts and Causes of Belt Failures in Severe<br />
Car Accidents in Switzerland During 1976," Twenty-First<br />
Stapp Car Crash <strong>Conf</strong>erence, SAE Paper 770916, Society of<br />
Automotive Engineers, Warrendale, PA, 197'7.<br />
(38) Culvea Clyde C., and David C. Viano, "Influences<br />
of Lateral Restraint on Occupant <strong>Int</strong>eraction With a Shoulder<br />
Belt or Preinflated Air Bag in Oblique Impacts*," SAE<br />
Paper 810370, <strong>Int</strong>emational Congress and Exposition, Detroit,<br />
Michigan, February, 1981.<br />
(39) Dance, M. and B. Enserink,<br />
"Safety Performance<br />
Evaluation of Seat Belt Retractor$, SAE" Paper 790680,<br />
Passenger Car Meeting, Dearbom, MI, June I l-15, 1979.<br />
(40) 49 CFR, Ch. V (10-l-86 Edition), National Highway<br />
Safety Traffic Administration, DOT.<br />
(41) CIR 1419, 1436, U.S. Department of Transportation,<br />
NHTSA, t976*r977.<br />
(42) CIR 1424, U.S. Department of Transportation,<br />
NHTSA, 1970-75.<br />
(43) Esser, R.C., "Restraint Model Validation Tests<br />
(Phase l)," Report No. SRL-51, U.S. DOT/NHTSA, Vehicle<br />
Research and Test Center, February 1983.<br />
(44) "NHTSA To Check Showrooms To See If Belts Are<br />
Attached," IIHS Status Report, Vol. 24, No. 4, April 2?'<br />
1989.<br />
Investigation of Fire in Cars<br />
Written Only Paper<br />
Eva Johansson,<br />
Saab Car Division<br />
Abstract<br />
With the purpose to test how an engine compartment fire<br />
develops toxic gases and fire in the passenger compartment<br />
five full-scale tests have been performed by Saab Car Division<br />
together with the National Testing Institute of Sweden'<br />
This is a description of the test method, performed tests<br />
and the conclusions from the tests.<br />
The firewall was videorecorded during the tests to see<br />
where, when and how the fire passed though the wall into<br />
the passenger compartment.<br />
A heat sensing camera and thermocouples attached to the<br />
bulkhead were used to measure the differences in temperature<br />
during the tests.<br />
To achieve data about the smoke CO and CO2 concentrations<br />
were sampled during the test.<br />
The conclusion is that this method is useful for testing the<br />
fire spread through the bulkhead and the development of<br />
toxic gases in the passenger compartment.<br />
The materials that are used to seal around the passages for<br />
electrical wiring, flexible tubings etc. are extremely important<br />
for the fire spread in cars.<br />
442<br />
(45) Biss, D.J., "Safety Performance Evaluation of Slack<br />
Effects in Three-Point Belts Using the Hybrid III Dummy in<br />
Frontal and Frontal Oblique Sled Tests," Presented at the<br />
l6th Annual <strong>Int</strong>emational Workshop on Human Subjects<br />
for Biomechanical Research, Atlanta, Georgia, October 16,<br />
1988.<br />
(46) TaniEre, C., D. Lestrelin, G' Walfisch, and A. Fayon,<br />
"The<br />
Proper Use of HIC Under Different Typical Collision<br />
Environments,<br />
"<br />
Ninth <strong>Int</strong>emational Technical <strong>Conf</strong>erence<br />
on Experimental Safety Vehicles, U.S. Department of<br />
Transportation, NHTSA, Kyoto, Japan, November l-4,<br />
1982, pp. 321-336.<br />
(47) Grtisch, L, et al., "New Measurement Methods to<br />
Assess the Improved Protection of Airbag Systems," Daimler-Benz<br />
AG, 30th Annual Proceedings, American Association<br />
for Automotive Medicine, October 6-8, 1986, Montreal,<br />
Quehec.<br />
(48) Romeo, D., and R.C. Esser,<br />
"Airbag Demonstration<br />
Program (<strong>Volume</strong> I)," Report No. RD 583-2, U.S' DOT/<br />
NHTSA, Vehicle Research and Test Center, January 1984.<br />
(49) Gloyns, P.F., S.J. Rattenbury, A.Z. Rivlin, et al.'<br />
"steering<br />
Wheel Induced Head and Facial lnjuries<br />
Amongst Drivers Restrained by Seat Belts," Accident Research<br />
Unit, University of Birmingham, U.K., VIth, <strong>Int</strong>ernational<br />
IRCOBI <strong>Conf</strong>erence on The Biomechanics of Impacts,<br />
Salon de Provence, France, September 8,9,10, l98l'<br />
<strong>Int</strong>roduction<br />
Fire is something that man has leamt to use for different<br />
purposes. But we are well aware of the risks if the fire gets<br />
out of control. Statistics about deaths caused by fire in<br />
Sweden during 1986 shows a total number of 105 deaths of<br />
these fires most of them were caused by fires in houses and<br />
only four of them were fires in cars. Although fire in cars is<br />
not so common it is very important to investigate this<br />
question to avoid unnecessary risks.<br />
To start a fire you need three things heat, oxygen and a<br />
material that can bum.<br />
There are many hot areas in a car, exhaust systems with<br />
catalytic converter, engine parts etc. Flammable materials<br />
and flammable liquids, fuel and different oils are also<br />
available. All around there is oxygen in the air, so all the<br />
necessary ingredients to get a fire started are available in a<br />
car, primarily in the engine comPartment.<br />
A fire consists of three different phases flammability<br />
phase, burning phase and the last phase when all the<br />
flammable material is burnt and the fire ceases (see figure<br />
l).<br />
The important thing in the flammability phase is to<br />
increase the time before ignition. This could be done in two<br />
ways, either you can choose different materials that are<br />
difficult to ignite or you can add different chemicals to
Flgure 1. The dltferent phases<br />
In a flre,<br />
d.veloped fire<br />
plastics but unfortunately most of these chemicals also<br />
increase the toxicity of the smoke.<br />
In the second phase, the burning phase the temperature i$<br />
so high that all organic materials bum. Then the important<br />
thing is to prevent or at least delay the time for fire spread<br />
into the passenger compartment. For that a car body is<br />
needed, especially bulkhead and floor, that is designed to do<br />
so.<br />
The test method used as described below is aimed for<br />
studying the second phase in a car fire.<br />
Test method<br />
The tests were conducted at the Swedish National Tbsting<br />
Institute in Boras. In a big hall ( l8 X 34 m) called fire church<br />
it is possible to perform full scale fire tests indoors. The<br />
reason for this is that parameters such as wind and<br />
temperature can be eliminated. Before testing the vehicle<br />
was prepared and instrumented as follows.<br />
Preparation of the Yehicle<br />
l. The car body was cut off just behind the B-pillars.<br />
2. The front ofthe car body was supported at the rear end<br />
to get an horizontal floor.<br />
3. A board of 20 mm thick plastic glass was mounted at<br />
the back to allow sampling of CO and CO, concentrations in<br />
a closed passenger compartment.<br />
4. The front seats, most of the instrument panel and the<br />
carpets were removed for full vision of the passages in the<br />
bulkhead.<br />
5. The engine compartment was left in running order with<br />
all equipment in$talled, including liquids. The engine was<br />
not running before or during the test.<br />
Trm<br />
6. The length of the fuelpipes wa$ increased and the pipes<br />
were bent up along the side structure and filled with fuel to<br />
get some pressure in the system.<br />
Instrumentation<br />
l. Thermocouples were attached close to all the different<br />
pa$sages<br />
through the bulkhead and in the motor compartment.<br />
In each test about twenty thermocouples were used.<br />
2. Concentration of CO and CO, in the smoke was sampled<br />
inside the vehicle where the drivers head would have<br />
been located.<br />
Other test equipment<br />
L Videocamera to record the bulkhead area during the<br />
test.<br />
2. Heat sensing camera as a complement to the thermocouples<br />
to see the temperature distribution of the bulkhead.<br />
3. Cameras to take pictures of special events.<br />
4. A digital timer.<br />
Description of the test<br />
r Four small cubes (dimension 50 X 50 X 50 mm)<br />
filled with 200 ml heptan (in each cube) was placed just<br />
in front of the bulkhead in the same height as the floor,<br />
two on the left hand side and two on the right hand side<br />
(see Fig. 3). The reason to ignite there is to test the<br />
worst case. If the fire start$ in the front this would<br />
increase the time for the fire to enter the pa$senger<br />
compartment.<br />
r The cubes with heptan were ignited and the hood<br />
was closed.<br />
r During the test the bulkhead was recorded with a<br />
videocamera, a heatsensing lR-camera,* temperatures<br />
were measured and the firesmoke sampled.<br />
r When the passenger compartment was filled with<br />
smoke the plastic glass at the rear was removed.<br />
r The test continued until the fire entered the passenger<br />
compartment. Then the fire was extinguished.<br />
*IR = the camera works with infrared technology.<br />
Flgure 2. The car aftor preparailon. Flgure 3. lgnltlon at polnt 1 and 2.
Performed tests<br />
Altogether five tests were perfbrmed. Three of them with<br />
Saab 9000 and two with Saab 900. The following is a<br />
description of the differences in the tests and the results'<br />
Test No. l-Saab 9000<br />
As a special investigation the fuelpipes (normally metal)<br />
were changed to plastic pipes in this test. The reason for this<br />
was to see whether the fire followed the pipes backwards<br />
under the floor to the fuel tank. The ventilation fan was not<br />
running.<br />
The temperatures close to all passengers and in the engine<br />
compartment was measured.<br />
Results:<br />
The temperatures on the bulkhead was about 20G-300"C<br />
when the seals around the passages staned to melt away'<br />
The concentrations of CO and CO2 increased slowly according<br />
to figure 4 and 5.<br />
slEffia<br />
I(OLOXIDI(OISENTRATIff{<br />
zsn<br />
TPPIT]<br />
- e s e { B<br />
rilfoflil<br />
Flgure 4. CO concentratlon.<br />
5 AB Cmg 8790t7<br />
r(otDlo)irH(or.cEt{TFAufti tPHrl<br />
69ffi<br />
- 2 8 2 '<br />
Flgure 5. CO" concantratlon.<br />
444<br />
l?<br />
t4<br />
ta t{<br />
tht|PEnlflf, cc)<br />
rEtfER nn (c)<br />
ffi.e<br />
$ArE ffiV Bli<br />
6.s l0,o<br />
TID (lfil{}<br />
EAAB @EDII EIE<br />
rrD fl{s{)<br />
$lr| ffif,tfV Bl8<br />
TtD fl{D{)<br />
rE.e<br />
rE.e
Er?ERAnn (c) tAtt ffi+f,f,Y EtB<br />
TErfEtAnn (G) lAll ffifff EIE<br />
s.s 6.e le .8<br />
TD (l0l)<br />
FIgure 6. Temperaturcr mcsrursd st the bulkhead.<br />
Special observations after ignition (minutes;seconds);<br />
8:fiF-Smoke started to enter the passenger compartment.<br />
In this test the ventilation fan was not running.<br />
A question rose, would there have been<br />
more smoke earlier in the passenger compartment<br />
if the ventilation fan had been running?<br />
8:45-Seals around passages started to melt. Flames in<br />
the engine compartment were visible through the<br />
bulkhead.<br />
l0:05-Fire entered the passenger compartment.<br />
l2:20-The test was stopped and the frre extinguished.<br />
The fuelpipes in the engine companment were bumt to<br />
the point where they were bent in under the floor.<br />
Test No.2*--Saab 900<br />
The ventilation fan was not running. The temperatures<br />
close to all passages and in the engine compartment were<br />
measured.<br />
Test results:<br />
The temperatures on the bulkhead ranged from 50"C up to<br />
325" C. The lowest temperature was measured in the area<br />
where the bulkhead is made of two metal sheets attached to<br />
each other. The air between the metal sheets works as an<br />
insulation.<br />
Smoke started to enter the passenger compartment earlier<br />
in this test. The concentration of CO and COr were higher in<br />
this test according to figure 7 and 8.<br />
(The toxicity of the smoke is a difficult area. The time to<br />
get hurt by it depends on different parameters for instance,<br />
how fast you breathe, the size of the person, an adult can<br />
manage more, etc.)<br />
Special observations after ignition (minutes:seconds):<br />
Z;fi)'--Smoke started to enter the passenger compartment.<br />
6:(XI--Some seals around passages melted and we could<br />
see flames in the engine compartment through<br />
the bulkhead.<br />
8: l4-Flames entered the passenger compartment.<br />
l0:5fThe test was stopped and the fire extinguished.<br />
ff13*iffi*"r*t*^rrm tP'nl<br />
Flgure 7. CO concentratlon.<br />
SAAB ggg<br />
KOLDIOXTH(O}ICEHTRATT(}{ EPFIIl<br />
- 2 9 2 . 1<br />
Flgurc 8. COz concentratlon.<br />
11<br />
ll<br />
n ,l<br />
r<br />
A<br />
t MJ<br />
tg<br />
I<br />
Il<br />
V<br />
\<br />
t2<br />
t,t<br />
445
IEI?ERANN C$T iAAD F+NOY fi!<br />
IEIfENANN CG)<br />
TD flrDll<br />
r8.0<br />
8 rt gHnfi' &t<br />
e.o 6.8<br />
r0.8 tE.t<br />
TD 00{}<br />
Test No.3-Saab 90fi|<br />
In this test the fire was ignited in a different way. The<br />
Saab 9000 is constructed with a "box" in front of the bulkhead<br />
(see figure l0). In this test only one cube filled with<br />
100 ml heptan was used and placed in the center and at the<br />
bottom of "the box " (see figure I 0). The purpose was to test<br />
the innerwall of the "the box"<br />
The ventilation fan was not running. The temperatures<br />
close to all passages and in the engine compartment was<br />
measures as in test no; l.<br />
Test results:<br />
The fire spread into the engine compartment earlier than<br />
into the passenger compartment. The fire spread into the<br />
passenger compartment 2-3 minutes faster than in test no: I<br />
(Saab 9000, ventilation fan not running). Temperatures and<br />
concentrations of CO and COr during the test according to<br />
figure ll and 12.<br />
Special observations after ignition (minutes;seconds);<br />
5;00-The fire entered the engine companment.<br />
446<br />
TETfER^IIR CC) $Arc ffif,olr Et<br />
gn.<br />
8.0 6.e 18.8<br />
TID CIIDO<br />
Flgure 9. Temperatures at lhe bulkhesd.<br />
Flgure 10. "Box" ln the lront of the bulkhead Saab 9000. lgnl.<br />
tlon at polnt l.<br />
7:26-The fire entered the passenger compartment.<br />
9:00-The temperatures on the bulkhead are 100-<br />
150"c.<br />
l0;45-The te$t was stopped and the fire extinguished.<br />
Test No.4-Saab 9000<br />
This test was exactly the same as test no: I except for one
I(OLOXIDXOHCEHTFATIfl{ TPHT] sAlE s99 - 83 rEnPE*rnn rcf,|o cl stl! sc<br />
eSss<br />
eE6S<br />
I E6S<br />
IBBP'<br />
sg9<br />
4 3 6<br />
nMEUtN)<br />
Flgure 1 1. CO concentrstlon.<br />
XOLOIOXIDKONCENTRATTON<br />
IPPH] SAAB SS0S B3<br />
I essg<br />
I BEE6<br />
a66B<br />
6EEE<br />
4gog<br />
2006<br />
s<br />
Figure 1?. CO? concentrEtlon.<br />
IE|fENITLR tCN^O CJ 6A t tfll - lfiov lit<br />
56s<br />
eEc<br />
250<br />
t5t<br />
tee<br />
so<br />
e<br />
't*l-,-1<br />
ffi<br />
'i l\<br />
,/,-*<br />
I<br />
A<br />
*/1"J !<br />
te t5<br />
TtD EnD{r<br />
t5<br />
rID [HIN]<br />
ftl<br />
h t<br />
D 1<br />
s<br />
e6a<br />
fl<br />
l5r<br />
ls<br />
6a<br />
e<br />
TE|fER^Itft TGfi^O CJ<br />
rHe<br />
ffi<br />
leG<br />
,|e6<br />
fl<br />
ist<br />
e<br />
6ae<br />
{le<br />
43S<br />
c<br />
sAA! Sa - 811<br />
6<br />
SA/IE ffi<br />
TEIfERAITJfi TEF^D C] 5lA6 ffie<br />
lss<br />
t<br />
- llt<br />
re<br />
./i<br />
A ,fq<br />
+r<br />
! i<br />
/ r"i<br />
r.' | | r14<br />
I<br />
) \ -<br />
Flgure 13. Temprratured<br />
at the bulkhead.<br />
I<br />
/l/\<br />
I u<br />
T<br />
--/^ i!::--'-<br />
i<br />
t5<br />
rID EITII{]<br />
rrp tnitxl<br />
TrD l|uf{l<br />
t6<br />
h l<br />
lra<br />
rra<br />
h t<br />
to ll<br />
tc l?<br />
Tr ll<br />
ft la<br />
lu 15<br />
fr 16<br />
tc l{<br />
Tr 19
KOLOXIPXOTIGEHTRATI't{ CPHIT SAAB ST6 - PROV 84<br />
e500<br />
3ffi9<br />
r60s<br />
tsso<br />
540<br />
o<br />
Flgure 14. CO concentratlon.<br />
KOLDIOXIDXOHCEHIRATT(I{ TPFI{]<br />
eE66<br />
ts€6<br />
6<br />
Flgure 15. CO2 concenlratlon.<br />
TE}fEFAT(h EGEAD CJ SllE ffiO - Ffiry !,1<br />
o6d<br />
EE'<br />
,165<br />
t66<br />
zeo<br />
tee<br />
5<br />
448<br />
sAlB gggE - PROV 84<br />
TID (HINI<br />
h l<br />
lrl<br />
es<br />
sAlS afre - PHw F.<br />
rr, rE ao<br />
s^l! s€66 ' PFOV 84<br />
salB 9666 - PFOV F4<br />
rID [HIt{'<br />
s E t6 15 ea<br />
Flgure 16. Temperatures at the bulkhead.<br />
rID ETIIH]<br />
Ta5<br />
-,-.- .To I<br />
Tr9<br />
te l0<br />
To ll<br />
Tp l7<br />
fs la<br />
re 2d
parameter. The ventilation fan was running. The purpose of<br />
this was to investigate whether the concentration of CO and<br />
CO, increased and if fire spread eadier into the passenger<br />
compartment. The temperatures close to all passages and in<br />
the engine companment was measured as in test no: I.<br />
Flgure 17. GO concsntrstlon.<br />
XOLDIOXIDI(OHCEHIRATIOT.I<br />
TPPTI]<br />
| 2S€g<br />
Flgure 18. CO? concentrstlon.<br />
rE|fecAtr,* t6FAo cl<br />
5EE<br />
sAts5 Ffilry !5<br />
SAAA 9gS - PRov Bs<br />
saJlB s66<br />
ta lE<br />
PROV 85<br />
t5<br />
ITD T'dIH)<br />
TID TI{IN]<br />
TID IItINl<br />
trl<br />
tE<br />
?+2<br />
toJ<br />
S^AB DO6 - tsLov Bs<br />
SllBs - PRovBS<br />
ILFI,tP^TUR TBftrD c,I SAAB 9{TS _ PROY BS<br />
5AS<br />
u5s<br />
asq<br />
lsB<br />
t60<br />
sg<br />
g<br />
6 e te 16<br />
sAlB sB - PROV ES<br />
Flgure 19. TemBeratures at tha bufkherd.<br />
TID THIH]<br />
t2 t5<br />
IID IHIHI<br />
r5<br />
TIO THTN]<br />
-'--<br />
lo 6<br />
-.+ Tc t<br />
- -.- t{ |<br />
-- Ts I<br />
1c I0<br />
tr ll<br />
Iu t5
Test results:<br />
Compared to test no: I (Saab 90(X), ventilation fan not<br />
runrring) a small increase of CO and a large increase of the<br />
CO2 concentrations were measured according to figure 14<br />
and 15.<br />
The smoke entered the passenger compartment a little<br />
earlier than in test no:1.<br />
When comparing the temperatures from this test with<br />
those from test no: l, a delay for about 3 minutes was found.<br />
This delay was found also in the time for fire entering the<br />
passenger compartment. The shape of the temperature<br />
curves was almost identical with the ones from test no:l<br />
except for the delay.<br />
Main observations after ignition (minutes:seconds):<br />
l0:05-The wiring to the ventilation fan was short-circuited,<br />
the fan stopped.<br />
l3:25-Some seals around passages has melted away.<br />
The flames in the engine compartment were<br />
visible.<br />
I 3 :55-Fire entered the passenger compartment.<br />
l5:45-The test wa$ stopped and the fire extinguished.<br />
Test No.S-Saab 900<br />
This test was exactly the same as test no:2 except for one<br />
parameter. The ventilation fan was running. The purpose of<br />
this was to investigate whether the concentration of CO and<br />
CO2 increased and if fire spread earlier into the passenger<br />
compaftment. The temperatures close to all passages and in<br />
the engine compartment was measured as in test no:2.<br />
Test results:<br />
The temperatures measured in this test were almost identical<br />
with those from test no:2. Also the time when the fire<br />
entered the passenger compartment was almost exactly the<br />
same (minutes;seconds test no:1 time 8:14 and test no:5<br />
time 8:00).<br />
The concentrations of CO and CO2 did not increase compared<br />
with test no:2 (Saab 900 ventilation fan not running).<br />
Main observations after ignition (minutes:seconds):<br />
5;30-The wiring to the ventilation fan was short-circuited,<br />
the fan stopped.<br />
6:45-Some seals around passages had melted away.<br />
7:Z5-Flames were visible through the bulkhead.<br />
8:00-Fire entered the passenger compartment.<br />
l0:19-The test was stopped and the fire extinguished.<br />
Conclusions<br />
The repeatability of the test method is good.<br />
The test flethod is useful for testing firespread through<br />
the bulkhead and development of CO and CO2<br />
concentrations in the Passenger compartment.<br />
450<br />
HOTOFRUHSTEHPTRAIURENrffiaD Cl sAE SH6<br />
I oos<br />
6 6 l o 1 6 m<br />
TlD thll{l<br />
Flgure 20. Temperaturea In the englne compartment Sssb<br />
9000.<br />
e I s I te t6<br />
TIO IIIIH]<br />
Flgure 21. Temperatures In the engine compartment Saab 900.<br />
If and when the fire spreads into the passenger compartment<br />
the concentration of CO increases rapidly. The<br />
concentration is highest when the passenger compartment is<br />
completely closed.<br />
If the ventilation system continues to run when a fire is<br />
beginning in the engine compartment the amount of smoke<br />
in the passenger compartment increases.<br />
The bulkheads fire resistance could be increased by<br />
design. Important for the bulkhead fire resistance are the<br />
following design features:<br />
r Temperature insulation of the bulkhead, for<br />
instance two sheets of metal with an insulating material<br />
in between.<br />
r Seals used around passages for wires, flexible<br />
tubes etc. Use seals that are difficult to ignite.<br />
. Protect passage$ and holes from flames and heat.<br />
Locate them as low as possible, use glass fibre or<br />
metal-foil to reflect the heat.<br />
r Avoid large holes.<br />
. Keep the number of holes as low as possible.
The Effect of Restraint Design and Seat Position on the Crash Tlajectory of the<br />
Hybrid III Dummy<br />
Written Only Paper<br />
D G C Bacon.<br />
Motor Industry Research Association,<br />
Crash Protection Centre<br />
Ahstract<br />
In a series of HyGe sled tests on the Hybrid III dummy,<br />
the effects of seat belt and seat geometry on dummy trajectory<br />
were examined. A three dimensional spatial measurement<br />
system was used to evaluate the dummy behaviour<br />
alongside the standard instrumentation results.<br />
The first part of the test series compared dummy size and<br />
then went on to examine the effect of the influence of belt<br />
parameters. These included belt length, stiffness and effects<br />
of weblocks and pre-tensioners. An under$tanding was<br />
gained of the effects of these parameter changes and the<br />
degree to which a car with poor occupant protection performance<br />
in a crash may be improved without re-developing<br />
the vehicle structure. The second part assessed dummy behaviour<br />
when the seat was out of the standard position.<br />
These tests involved changing seat back angle, cushion<br />
angle and cushion friction. The results show the effect on<br />
injury levels of changes from the settings used in compliance<br />
testing. The results in this paper provide guidance to<br />
improved occupant protection through changes in restraint<br />
system design.<br />
<strong>Int</strong>roduction<br />
The aim of this Industry and Government sponsored<br />
project, coordinated by MIRA, was to develop a reliable<br />
method of determining the trajectory of a dummy in a crash<br />
situation and thus to provide vehicle manufacturers with a<br />
means of correlating dummy movement with variations in<br />
seat and belt parameters. Changes in crashworthiness<br />
performance could then be assessed more accurately by the<br />
techniques developed in this study.<br />
Initial studies of repeatability in measuring trajectory<br />
showed that variations were less than lOmm in the dummy<br />
movement up to a position where impact with a steering<br />
wheel would occur. Test conditions could be sufficiently<br />
controlled to enable the small effects of some parameter<br />
changes to be determined.<br />
The project was considered in four overlapping phases:<br />
A Literature Search.-Relevant papers to assist the<br />
test and analysis prograrnme.<br />
Development of a Spatial Measurement System.-<br />
This phase covered the adaptation of a proprietary but<br />
relatively undeveloped $patial tracking system to<br />
perform the task of recording the dummy trajectory in<br />
three dimensions. This included the writing of<br />
computer programs for analysing and presenting these<br />
trajectories.<br />
Test Series.-A programme of dynamic sled tests<br />
performed on the MIRA HyGe facility. Restraint<br />
$yrrtem parameters were varied and the effect<br />
determined on dummy trajectory and injury criteria. A<br />
total of about 50 tests were planned covering a matrix<br />
of test configurations.<br />
Analysis.-Instrumentation data from the dummies<br />
were analysed by the appropriate routines to generate<br />
the injury criteria. The trajectories were analysed for<br />
peak excursions, velocities and other characteristic<br />
dimensions.<br />
Changes in restraint sy$tem parameters were evaluated<br />
against the generated data and conclusions drawn about<br />
their effectiveness. The topics of Hybrid III repeatability,<br />
Hybird II/III comparison, seat belt anchorage locations and<br />
dummy submarining have been covered in another paper<br />
(l).* This paper presents part of the project work<br />
investigating the effect of dummy size, seat belt type and<br />
seat configuration on the crash trajectories.<br />
Development of a Spatial Measurement<br />
System<br />
One of the initial phases of the project wa$ to ascertain<br />
which of the available measuring systems would be suitable<br />
for data collection in a HyGe test environment. Three<br />
systems were evaluated at MIRA under test conditions and<br />
the selected system is described here.<br />
VICON is a three-dimensional measurement system<br />
using photogrammetric techniques, interfaced to a PDP-<br />
I 1fl3 computer system for data capture and presentation. A<br />
cine film digitisation $y$tem can also be interfaced with the<br />
analysis software. VICON records the po$ition of retroreflecting<br />
markers in the camera's field of view and the<br />
markers are illuminated by lights clo$e to the camera lens<br />
axis (figure l).<br />
rNumbers in puentheses designtrte rcfercnces f,t end of paper<br />
Flgure 1. Traloctory mof,sursmsnt $ystem.<br />
451
The standard system uses high stability, 625 line, 2:l<br />
interlaced TV cameras to produce 50 fields of data per<br />
second. Each camera in the system produces a wide band<br />
( l2 MHz) video signal, which contains over a quarter of a<br />
million pixels in each TV frame. The interface extracts the<br />
relevant co-ordinate information from the signals from each<br />
camera and passes it to the system computer.<br />
For the applications which require a higher sampling rate<br />
than 50 frames/second, high speed cameras are used. These<br />
cameras offer sampling rates of up to 200 Hz, and use a<br />
rotating shutter to freeze the movement.<br />
Any bright points in the picture are seen as shoft pulses in<br />
the video signal, typically of lfi) nanosecond duration' A<br />
Marker Detector module connected to each camera picks<br />
out these pulses and converts them to accurate, digital<br />
timing signals. A Co-ordinate Generator transforms the<br />
timing pulses into crystal controlled counts of the position<br />
of each point resolving the horizontal position to l;1Ofi) and<br />
the vertical position to l;3fi) at 60 Hz. For 2fi) Hz frame<br />
rates the horizontal resolution is l:400.<br />
These data are transferred via FIFO buffers onto<br />
computer disc together with any other data that may have<br />
been recorded at the same time. The resulting disc file is<br />
limited only by disc capacity and may run to several million<br />
co-ordinates.<br />
Once the data capture is complete, the software begins to<br />
process this vast amount of data. First, a data reduction<br />
algorithm calculates the centroid of each marker to provide<br />
a file of co-ordinates representing the position of each<br />
marker in each TV frame. Next, the data is sorted<br />
interactively, labelling every marker in every frame for all<br />
the cameras. Sorting algorithms aid this process, tracking<br />
the markers through the data field under the operator's<br />
control. This produces a two-dimensional trajectory file.<br />
Finally, a three-dimensional mathematical model of the<br />
motion is created from the two-dimensional trajectory file<br />
using the principles of close range photogrammetry and<br />
camera parameter calibration.<br />
Structured programming techniques have been used to<br />
provide a modular system of over 20 separate programs in<br />
an integrated set which runs under the host operating system<br />
with multi-user capability.<br />
The applications software package processes the threedimensional<br />
data available to give a wide range of graphical<br />
output.<br />
The following table gives the main specification$ of<br />
VICON $patial measurement sy$tem.<br />
Test Equipment and Procedure<br />
HyGe Test<br />
A rig was constructed to mount on the HyGe sled which<br />
was equipped with a right hand production seat. The seat<br />
itself had the runners removed and was bolted to a rigid<br />
bracket. Several brackets were manufactured to suit the<br />
different seat types and configurations required for the test<br />
programme.<br />
452<br />
Table 1. VICON Speclflcstlon<br />
Accuracy SD ; Zmm with 2m field of vlew<br />
Preclelon 5D ( Zmm with ?n fleld of view<br />
Sample Hate t00 Hz<br />
Number of Cameras 2 - 7<br />
Number of Matkers t-t0<br />
SD = Stenderd Deviation<br />
The acceleration pulse (figure ?) wari chosen to simulate a<br />
48 km/h (13.4 m/s, 30 mile/h) car impact. This provided<br />
representative test conditions which would have relevance<br />
to a range of vehicles. This pulse gave a sustained<br />
acceleration level of20-249 and delta-V in the region of52<br />
km/h (14.4 mls.32 mile/h).<br />
Flgure 2. llyGe eled pulse.<br />
Anthropometric Dummies<br />
Unless otherwise specified the Hybrid III (reference 2)<br />
50th percentile male dummy was used. The 5th percentile<br />
female dummy and the 95th percentile male dummy were<br />
used in two tests.<br />
Before each test series, the dummies were fully calibrated<br />
to part 572 ofthe Code ofFederal Regulations in accordance<br />
with Motor Vehicle Safety Standard 208. For each test the<br />
dummy was positioned as specified in Section l0 of this<br />
regulation. The position of the dummy was measured prior<br />
to the test. The dummies were also inspected after each run<br />
and the joint torques checked.<br />
Restraint Systems<br />
Anrhorag,es.-The initial anchorage positions used were<br />
based on the manufacturers' drawings of anchorage location<br />
relative to H-point. Variations were made from these
positions to determine an optimum restraint position. All<br />
seat belt anchorage positions were measured relative to the<br />
dummy H-point position as determined using a reference<br />
manikin. The standard seat belt position was as fitted in a<br />
production vehicle with the seat at mid position.<br />
Seat belts.-The standard production belts used for the<br />
tests were of lZVo elongation webbing and 3m in length<br />
(unless otherwise stated). The length of belt stored on the<br />
reel before each test was in the region of 625 mm.<br />
Seats<br />
Three types of seat were used for the tests. The two<br />
prinicpal models (Type A and Type B) were producrion<br />
seats supplied by vehicle manufacturers. The third was a<br />
leather covered version of Type A seat. This was used to<br />
investigate the effects of seat friction.<br />
For the standard configuration the seat$ were installed<br />
with the standard cushion angle as fitted in production and<br />
the back angle set to 25 degrees unless otherwise specified.<br />
Some tests were performed using one seat with a range of<br />
back and cusion angles. New seats were used for the majority<br />
of the tests.<br />
Photography and Spatial Measurement<br />
High reflectivity markers were fixed to the dummy in the<br />
positions shown in figure 3. When illuminated by a high<br />
inten$ity light source, on the same optical axis as the viewing<br />
camera, these markers show up as bright spots. The<br />
markers themselves were in the shape of spheres, hemispheres<br />
or discs which had been covered with retro-reflective<br />
tape. The positions of the viewing cameras were similar<br />
to those shown in the sketch of the VICON system in figure<br />
l.<br />
z<br />
,*J<br />
Flgure 3. VICON marksr po8ltlons and axls convrnllon8.<br />
Three l6mm high speed cameras running at 1000 pps<br />
were also used to provide a visual record of the tests.<br />
To assess the contact velocities and contact angles ofboth<br />
the head hitting the steering wheel and the knee hitting a<br />
knee bolster pad, the planes of a fictitious steering wheel<br />
and bolster pad were added to the trajectory plots. These<br />
planes were defined using standard EEC data measured<br />
from acutal production vehicles.<br />
Test Instrumentation<br />
For all the tests the dummy was instrumented with triaxial<br />
accelerometers in the head, chest and pelvis. The Hybrid III<br />
dummy also contained a chest displacement transducer and<br />
instrumented neck. Load cells were fined to the lap and<br />
diagonal belts and a wire potentiometer was used to measure<br />
the amount of seat belt reel-out.<br />
For all the test$ the instrumentation results were analysed<br />
ro the requirements of FMVSS 208.<br />
The accelerometer outputs from the head were analysed<br />
to produce the Head Injury Criterion (HtC). Even though<br />
the dummy head did not strike any structure in these rests<br />
and HIC without impact is not widely accepted, the HIC was<br />
used to rank the severity ofthe head accelerations.<br />
Co-ordinate Sign Convention<br />
For all tests the coordinate system used was as follows:<br />
X-longitudinal, positive rearwards<br />
Y-lateral, positive to dummy right hand side<br />
Z-vertical, positive upwards<br />
These coordinates are funher described in figure 3.<br />
Test Programme<br />
The test programme was divided into several sessions<br />
where the tests were grouped conveniently according to the<br />
parameters<br />
being studied and also to provide a logicat progression<br />
to the project. In outline, the subject matter for this<br />
paper was as folJows;<br />
r Comparison of 5th percentile female and 95th<br />
percentile male dummies<br />
r Effect of seat belt webbing stiffness<br />
r Effect of seat belt length<br />
. Pre-tensioners and Weblocker investigation<br />
r Effect of seat back angle<br />
r Effect of seat cushion angle<br />
r Effect of seat cusion friction<br />
Table 2 summari$es the relevant tests. To aid comprehension<br />
of the programme which involves several variables,<br />
some sub-matrices of the table are given in the discussion of<br />
the results.<br />
Results<br />
Where possible graphical data were prepared foreach test<br />
as follows:<br />
. Top of Head, forehead, chest, pelvis, knee<br />
Trajectory (X-Z plane)<br />
X Displacement and velocity/time<br />
Z Displacement and velocity/tirne<br />
Resultant velocity/X displacement<br />
Change in angle/time (X-Z plane)<br />
r Shoulder forward rwist/time (X-y plane)<br />
In addition summary data from the instrumentation results<br />
and trajectory analysis were provided as follows:<br />
r Head<br />
HIC 36 ms.250 ms<br />
Resultant acceleration (3 ms)<br />
Forehead peak resultant velocity<br />
453
Table 2. Testa carrled out In parametrlc study.<br />
Rm No T6Et spBciflcettm Comonts<br />
l6<br />
2l<br />
22<br />
2'<br />
24<br />
2'<br />
26<br />
27<br />
28<br />
z?<br />
l0<br />
il<br />
12<br />
11<br />
I4<br />
,5<br />
t6<br />
t7<br />
]8<br />
19<br />
40<br />
4l<br />
42<br />
41<br />
44<br />
46<br />
47<br />
,2<br />
5J<br />
54<br />
56at BA CA lclt<br />
B<br />
B<br />
B<br />
B<br />
B<br />
A<br />
A<br />
5U<br />
A<br />
su<br />
5U<br />
LF<br />
5U<br />
su<br />
SU<br />
SU<br />
A<br />
5U<br />
5U<br />
LF<br />
5U<br />
A<br />
LF<br />
A<br />
B<br />
B<br />
B<br />
I<br />
B<br />
5td<br />
std<br />
std<br />
5td<br />
std<br />
std<br />
100<br />
100<br />
400<br />
400<br />
std<br />
5td<br />
srd<br />
5td<br />
5td<br />
5td<br />
std<br />
400<br />
400<br />
400<br />
400<br />
400<br />
400<br />
400<br />
25F<br />
5td<br />
std<br />
std<br />
5td<br />
std<br />
std l2c<br />
std l7s<br />
5td 8*<br />
std 5r<br />
std Ltl<br />
std t2$<br />
std uc<br />
std tz$<br />
std tzn<br />
5td t?x<br />
5td FA<br />
5td l2c<br />
5td l?f,<br />
std RA<br />
std FF<br />
14.50 LzZ<br />
14.5c l2x<br />
14.50 r2r<br />
14.50 r2x<br />
-5.50 lzx<br />
-5,50 l?s<br />
-5.50 FA<br />
-5.50 FA<br />
-5.50 r2s<br />
-5.50 r2x<br />
std r2s<br />
std r2s<br />
std l2r<br />
Sttl l?r<br />
std l2c<br />
B -TypaBueat<br />
A - Typc A saet ln dtendrrd ffidltlon<br />
stj - Typs A aart, anti-aubfEflnlng pen<br />
remvrd<br />
LF - Lddthdr ecat (low frlction) Type A<br />
RA - Lorsr anchorEgrs mvad hlghar end to<br />
tha fedf<br />
FA - Ldwer enchorEgca mvod lowar end fofrerd<br />
FF - Foot r66t mv6d foEHard<br />
454<br />
Bad6lln6 t66t<br />
EffBct of H6bblng stlffruBs<br />
Effact of wabblnq atlffmaa<br />
Effact of bclt langth<br />
Effgct of balt lanqth<br />
Standard Typa A aaata<br />
Slgnlflcent Bubrarinlnq<br />
Stghtftcant Buboarlnlng<br />
5th oarcantlb famlp<br />
95th pilccntlls mls<br />
{ablockar uscd<br />
HEblock6r u$d<br />
Hl16 pr6-trnalonrr<br />
BA - Beck Angle<br />
CA - Cu8hlon Angl6<br />
tH - lzf wcbblng 50ftn<br />
longar than atandard<br />
stl - lzs xebblnq 500m<br />
slbrtsr than standard<br />
Forehead resultant'impact' velocity at steering<br />
wheel plane<br />
Max. change in head angle<br />
Head angle at 'impact'<br />
Max. angular velocity<br />
Max. forward displacement<br />
Chest<br />
Resultant acceleration (3 ms)<br />
Deflection (Hybrid III only)<br />
Max. Forward displacement<br />
Max. Vertical displacement<br />
Max. Change in angle (X-Z plane)<br />
Shoulder forward twist (X-Y plane)<br />
Pelvis<br />
Max. Forward displacement<br />
Max. Vertical displacement<br />
Max. Change in angle<br />
Knee<br />
Max. Forward displacement<br />
Max. Vertical displacement<br />
'Impact'<br />
velocity with knee bolster plane<br />
Seat Belt<br />
Lap load<br />
Diagonal load<br />
Reel-out<br />
Dummy Size<br />
Tests were made with a 5th percentile female (Run 46)<br />
and 95th percentile male (Run 47) to compare their performances<br />
with the 50th percentile Hybrid III (Run 16). The<br />
restraint systems and seats for the three tests were the same.<br />
The comparative trajectories for the head, chest, pelvis and<br />
knees are shown in figure 4. Summarized te$t data for the<br />
tests are given in table 3.<br />
Flgure 4. Dummy slze comparlson. Head, chest and pelvla<br />
trsl€ctorles.<br />
Table 3. Dummy motlon comparlson r€sults-<br />
Rh<br />
No<br />
I6<br />
46<br />
47<br />
- stlmRD sth ftEt[tnu<br />
I XXEE ilOI AVAITABLT I<br />
)my Typrl5izr HIC<br />
( I6'ns)<br />
HIII 50th<br />
prre;ntib nilc<br />
5th psrc6ntl16<br />
fenele<br />
95th prrcrntllB<br />
m16<br />
194<br />
I094<br />
1t2<br />
tl6dd<br />
xcurrion<br />
(mm)<br />
650<br />
622<br />
829<br />
H6Ed<br />
Psak<br />
/6loclty<br />
12.9<br />
12.5<br />
Il,6<br />
lhad Inpaet<br />
Veloclty<br />
(n/a)<br />
ll.9<br />
ib ContEct<br />
8.9<br />
Chset<br />
AccsIsrEtlffi<br />
(9 ovor !m)<br />
16.7<br />
44,9<br />
J2.O<br />
The instrumentation results for the 5th percentile female<br />
show high HIC and chest acceleration values. The acceleration<br />
of the dummy is expected to be higher than a 50th<br />
percentile due to the lower mass if subjected to the same<br />
forces. As the diagonal belt runs high across the chest,<br />
shoulder rotation and head forward excursion were low. It<br />
can be seen from figure 4, the 5th percentile dummy does<br />
not make contact with the steering wheel plane when sitting<br />
in the standard position. In practice a 5th percentile driver<br />
would be expected to adjust the seat, bringing the occupant<br />
closer to the vehicle interior. In this case the head could<br />
contact the steering wheel at any velocity up to the peak of<br />
12.5 m/s.<br />
The 95th percentile male dummy produced a greater moment<br />
about the diagonal belt and was less well restrained.<br />
There was considerable rotation ofthe upper body out ofthe<br />
belt with a head forward excursion of some 830mm. This<br />
was high compared with 650mm for the 50th percentile<br />
Hybrid III and 620 mm for the 5th percentile female Hybrid<br />
II. By the same reasoning that the 5th percentile HIC and<br />
chest acceleration are high, the 95th percentile results are<br />
low by comparison.<br />
As with the sth, the 95th percentile occupant would be<br />
likely to adjust the driving position, changing the head<br />
impact position. The velocity at impact would be expected
to be higher than the 8.9 m/s recorded but lower rhan rhe<br />
I I.6 m/s maximum head resultant velocitv.<br />
Belt Type<br />
Tests were conducted to compare the standard belt system<br />
(Run l6) with a range of belt options;<br />
| . l7 Vo Webbing stiffness, standard is l27o (Run 2 I )<br />
2. 8% Webbing stiffness (Run 22)<br />
3. Belt Sfi)mm longer than standard (Run 24)<br />
4. Belt 50omm shorter than standard (Run 23)<br />
5. Weblock sy$tem$ (Runs 52,53)<br />
6. Pre-tensioner system (Run 54)<br />
Webbing Stiffness<br />
Trajectory results for the 3 tests with different webbing<br />
stiffnesses are shown in figure 5.<br />
- SIAilDAR0 IELI<br />
---- t?* ut6Bt[G<br />
-.-.- E* wEEBttG<br />
(tHEst I PELvrs<br />
ilOT AVAIIAELE '<br />
5,,9t#ij,ryJi"Tlns<br />
Bllffness comparlson. Head, chest and pet-<br />
In the case of the lTEo belt there was an increase in the<br />
head forward excursion. The 87o belt showed a slight decrease<br />
in excursion from standard but this could be within<br />
normal scatter. The trajectory graphs show the increase in<br />
head and chest forward movement due to the l77o belt. The<br />
head impact velocity into the steering wheel plane increased<br />
for both the 8% and lTVo belts due to the changed impact<br />
location. The llVo belt also allowed more movement of the<br />
chest. The belt stiffness appeared to have had most effect on<br />
chest acceleration (see table 4 for test data). The instrumentation<br />
results showed an increase, in chest 3ms exceedence.<br />
for the stiffer belt and a corresponding decrease for the<br />
softer one. Both HIC values however were greater.<br />
Belt Length<br />
Trajectory results for the three tests with different webbing<br />
lengths are shown in figure 6.<br />
Changing the length of the seat belt had a much greater<br />
effect on the dummy performance than the belt stiffness.<br />
There was a clear increase in head excursion from 650mm to<br />
70omm for the longer belt (Run 24) and a decrease to 600<br />
for the shorter (Run 23). The corresponding head impacr<br />
velocities were also respectively increased and reduced (see<br />
table 4 for test data). The chest forward rotation in the case<br />
of the long belt was some 15 degrees higher than with the<br />
shorter one.<br />
Fig.ure 6.. Webblng length comparleon. Head, chest and petyt$<br />
lralectorles.<br />
Seat belt reel-out as recorded by the wire potentiometer<br />
was down to 25 mm for the short belt and up to 90mm for the<br />
long belt. The standard belt reel-out was normally in the<br />
region of 40-50mm.<br />
Weblock and Pre-tensioner Systems<br />
The effect of the weblock (Runs 5?,,53) was similar ro<br />
that of the shortened belt. Reel-out was of course reduced<br />
and head excursion brought down (figure 7). The impact<br />
velocity was significantly reduced from the standard configuration<br />
(table 4).<br />
0.t<br />
- STArmno fftI<br />
---- vtl Ldrr<br />
- - - PntrtBtotEn<br />
3tttfir6 Yxttl<br />
FtltE<br />
aff<br />
-04 -0 4 -0.{ -01<br />
tttt't<br />
Flgure 7. Weblock and pro-trnalonor comparleon. Head, chest<br />
and pelvla tralectorlee .-<br />
Table 4. B€lt type results.<br />
nI<br />
Xo l.lt lyp6 HIT<br />
(l6s)<br />
l6<br />
2l<br />
22<br />
24<br />
52<br />
9l<br />
54<br />
Stond.rd<br />
l7t<br />
8t<br />
-5oth<br />
+50lh<br />
l|block<br />
I.bIock<br />
P16trnrLmr<br />
t9l<br />
429<br />
58r<br />
441<br />
546<br />
,26<br />
?BJ<br />
272<br />
H6od HrEd :hsEt lhr.t Ch$t B.lt<br />
I+rct<br />
Yrloctty (n) 0 sv6f ItrE) in) (dss ) ttut<br />
(r/c)<br />
(n)<br />
tt.9<br />
12,J<br />
12,l<br />
lI.7<br />
rr.]<br />
I0,2<br />
9.4<br />
10.0<br />
650<br />
677<br />
640<br />
600<br />
toJ<br />
,20<br />
t00<br />
izJ<br />
The pre-tensioner system used for the tests was of the<br />
type normally activated by a length of cable attached to a<br />
collapsing part of the vehicle structure. A bracket was<br />
36,7<br />
r5, ]<br />
19,5<br />
Jr,6<br />
16,6<br />
t,9<br />
tt, r<br />
t5.8<br />
250<br />
t{l0<br />
7J2<br />
24I<br />
264<br />
214<br />
2fi<br />
n5<br />
44<br />
40<br />
J4<br />
t7<br />
{4<br />
42<br />
4'<br />
49<br />
52<br />
25<br />
90<br />
ft<br />
29<br />
d0<br />
455
mounted to the sled to retain the cable outer and the cable<br />
itself was attached to the sled rails with a shear bolt. This<br />
bolt may have sheared slightly early but the general performance<br />
of the pre-tensioner system was good (Run 54). The<br />
seat belt reel-out was not down as far as in the weblock tests<br />
but the head excursion and impact velocity were both down.<br />
Both these $ystems were seen to have a beneficial effect on<br />
rhe HIC.<br />
Seat <strong>Conf</strong>iguration<br />
Cushion and Seat Back Angles<br />
All seats were of standard production design, with cloth<br />
covers and incorporating an anti-submarining pan. The<br />
design cushion angle was 4.5o up at the front and the<br />
standard back angle was taken to be 25o reclined. The<br />
anchorage locations were standardised for most of the test<br />
runs,<br />
Data from tests in table 5 have been summarized in Table<br />
6. With a constant cushion angle of 4.5o, dummy trajectories<br />
for the three back angles are compared in figure 8' The<br />
effects of the three cushion angles against constant back<br />
angle is shown in figure 9.<br />
Tsble 5. Test matrlx lor cushlon angle and sest back angle<br />
lnvestlgatlon.<br />
Back Angle<br />
Cuehion<br />
Anglo<br />
100 250 40o<br />
-5 .50 44 42*t 41++<br />
4. 50 26 25 2S<br />
14.50 55 ,7<br />
* with lower anctroragoa for*ard and louer<br />
++ illth leather s6et (1or friction)<br />
Table 6. Seat conflguratlon resulte.<br />
Rm<br />
t\t5<br />
25<br />
26<br />
28<br />
tl<br />
Run<br />
Ntmbers<br />
The base configuration for this series was the Type A seat<br />
set with a 25 degree back angle and 4.5 degree cushion angle<br />
(Run 25). This produced slightly different results from the<br />
Type B system, notably a higher belt reel-out and head<br />
excursion. The head velocity was, however slightly lower'<br />
456<br />
HIC<br />
]60t )<br />
15 ]70<br />
t7<br />
40<br />
42<br />
4t<br />
44<br />
Il5<br />
27z<br />
420<br />
h2<br />
599<br />
47i<br />
475<br />
494<br />
468<br />
lbrd tbid<br />
Imcct<br />
/sloclty<br />
(n/r)<br />
!xcurtlon<br />
(n)<br />
lt.9<br />
lr.0<br />
I2,2<br />
It,8<br />
ll.2<br />
lr.6<br />
t2,2<br />
12.6<br />
ll.9<br />
lr.0<br />
685<br />
610<br />
750<br />
7J2<br />
660<br />
795<br />
748<br />
77}<br />
7t7<br />
660<br />
Ch6t<br />
Frd<br />
dtBpl<br />
(n)<br />
z6s<br />
290<br />
T(R<br />
276<br />
268<br />
,7e<br />
,21<br />
t9t<br />
t04<br />
212<br />
Chirt<br />
Dffi<br />
dlBpl<br />
(-)<br />
I6l<br />
14I<br />
196<br />
16r<br />
t4r<br />
L52<br />
188<br />
268<br />
205<br />
170<br />
Chert<br />
Rot.<br />
(dlc)<br />
44<br />
J7<br />
57<br />
47<br />
60<br />
47<br />
l8<br />
57<br />
42<br />
P6lYlr<br />
Fild<br />
dtrpl<br />
(u)<br />
168<br />
189<br />
t85<br />
202<br />
148<br />
166<br />
22J<br />
,66<br />
20r<br />
198<br />
PcIvld<br />
Dom<br />
dlspl<br />
(m)<br />
48<br />
E'<br />
lI4<br />
49<br />
4l<br />
2E<br />
4t<br />
148<br />
54<br />
58<br />
P6lYlr<br />
Rot,<br />
(d"9)<br />
t0<br />
I<br />
t4<br />
22<br />
I5<br />
ll<br />
A<br />
r6<br />
r5<br />
Flgure E. Back angle comparlson' H€ad, chest, pelvls end kne6<br />
trai6ctorles.<br />
Flgure L Cuahlon angle comparison. head, chett' pelvls and<br />
knee trslsctories.<br />
Changing the seat back angle to l0 degrees reduced both<br />
forward excursion and head impact velocity (Run 26).<br />
Although head overall excursion from rest is low, the head<br />
actually moves slightly further forward than standard due to<br />
the more forward statting position. The belt, however, pulls<br />
the dummy up more sharply than in the standard position'<br />
The fact that less belt is left on the reel in this position could<br />
have a contributing factor to this. The overall change in<br />
angle of the body segments during the test was reduced, as<br />
would be expected, although the head angular velocity<br />
showed little change. Similar effects were observed in<br />
reverse when the seat back angle was increased to 40<br />
degrees (Run 28).<br />
With the standard back angle and a cushion angle of 14'5<br />
degrees there was little change in the results (Run 35). A 40<br />
degree back angle (Run 37) with this cushion angle<br />
produced a similar effect to that of the standard back angle'<br />
Excursion and impact velocity both increased.<br />
It appears that, with a good lap belt, the cushion angle has<br />
little effect on the dummy trajectory.<br />
Seat Friction<br />
All seats were fitted with the standard anti-subrnarining<br />
pan. The lower friction was achieved with a leather seat<br />
covering.<br />
A limited number of runs were carried out with the low<br />
friction seat and comparisons were made with cloth covered<br />
seats. Comparative head, chest, pelvis and knee trajectories<br />
are given in figure 10. Table 7 provides test information on<br />
the friction series of tests.
0.t<br />
0.r<br />
c!<br />
- mrr iar, fr|il|lo ciiitn|ril<br />
---- tEllHtr stl. Stmm<br />
r*l6ulATr0l<br />
- -,- ltfiffin ttal. S'<br />
6tct. -5 5. fl,rtffi<br />
,*na*tr.\<br />
slttfrtr vEtt<br />
?L^xl<br />
#<br />
ms<br />
HEAO<br />
-r'+ -l I -t a -0. -0.i -0 { -t t o0 6 t 0.a. t,.<br />
Flg.urr 10. Low frlcllon eeat tssts. Hced, cheat, pelvls and knee<br />
tralsctorles.<br />
Table 7. Test matrlr tor rsst lrlctlon Invosilgf,tlon.<br />
Cuchlon<br />
Angle<br />
*<br />
++<br />
Beck Anglo<br />
l0c 250 400<br />
-9.50 40r, 45*<br />
4.50 'I*, 2t+*<br />
14.50<br />
loathor soit - frlctlon coefficlent 0.45<br />
cloth seat - frictlon coafficlont 0.7<br />
Run<br />
Nulbere<br />
In the standard position (Run 3l) there was a general<br />
increase in forward movement of the dummy in the region<br />
of 30mm at the pelvis and 50mm at the head. Impact velocities<br />
however were similar. When this seat was tested in the<br />
extreme situation of a 40 degree back angle and a -5.5<br />
degree cushion angle (Runs 40,43) there was lirtle change<br />
in the dummy overall movement save the expected increase<br />
in the chest linear and angular displacement.<br />
Conclusions<br />
Of the three spatial measurement systems evaluated in<br />
the early stages of the project, the VICON system was<br />
selected as providing automatic data capture capacity to the<br />
specification of 30 markers at 200 Hz sample rate using 3<br />
video cameras. This equipment was u$ed successfully to<br />
gather dummy trajectory data on the 50 tests planned on this<br />
project.<br />
The tests with the varying dummy size and seat positions<br />
emphasise that wherea$ compliance testing is performed<br />
under one set of conditions there is a wide range of others<br />
that need consideralion during the design and development<br />
stages. For example, the tests have shown that a good lap<br />
belt fit allows a wide range of cushion angles to be used<br />
safely.<br />
The seat belt tests showed that belt stiffness changes do<br />
not have as much effect as changes in the belt length. A<br />
shorter belt shows less reel-out and restrains the occupant<br />
bener. Weblocks and pre-tensioners<br />
also achieve this.<br />
Acknowledgements<br />
The Motor Industry Research Association would like to<br />
thank the following for their contributions and assistance in<br />
the project, and their agreement to publish.<br />
UK Department of Trade and Industry<br />
ASE (UK) Ltd<br />
Rover Croup Ltd<br />
Britax Safety Systems Ltd<br />
Ford Motor Company Ltd<br />
Jaguar Cars plc<br />
Rolls Royce Motor Cars Ltd<br />
Transport and Road Research Laboratory<br />
Oxford Metrics Ltd<br />
References<br />
(l). Freeman, C.M. and Bacon, D.G.C. "The<br />
3-Dimensional Trajectories of Dummy Car Occupants<br />
Restrained by Seat Belts in Crash Simulations." 32nd Stapp<br />
Car Crash <strong>Conf</strong>erence, May 1988.<br />
(2) -'Hybrid III-A Biomechanically Based Crash Test<br />
Dummy". J. K. Foster, J. O. Kortge and M. J. Wolanin. 2lst<br />
Stapp Car Crash <strong>Conf</strong>erence, 1977. SAE No. 770938.
Technical Session 2B<br />
Accident Investi gation<br />
and Data Analysis<br />
Chairman: S. Christopher Wilson, Canada<br />
In-Depth Study of Motor Vehicle Accidents in Japan<br />
Masahiro ltoh, Koshiro Ono,<br />
Japan Automobile Research Institute, Inc.<br />
Yasuhiko lrie,<br />
Traffic Safety and Nuisance Research Institute<br />
Abstract<br />
The Ministry of Transport (MOT) is carrying out a motor<br />
vehicle accident investigation every year for the accurate<br />
determination of the actual status of motor vehicle accidents,<br />
clarification of the relationship between motor vehicle<br />
construction/equipment and human injuries, reinforcement<br />
of motor vehicle safety standards (Safety Regulations<br />
for Road Vehicles) and the promotion of technical evaluation<br />
of individual items of existing standards. Each investigation<br />
consists of case studies aimed at the in-depth study of<br />
specific details of accidents, conditions of accidents occurred<br />
in investigation area$, and statistic survey to find the<br />
prop€r position of each accident subject to investigation.<br />
Roughly l0O cases of accidents are studied and 4,500 cases<br />
are subject to the statistic survey for the duration of four<br />
months in every year. Investigation data are processed into<br />
computer files to allow a proper analysis, according to the<br />
purpose of study at any time as called for.<br />
<strong>Int</strong>roduction<br />
The MOT of Japan has been carrying out the<br />
investigation and analysis of motor vehicle accidents every<br />
year since 1973, in line with the recommendation submined<br />
by the Council for Transport Technics in 1972, which<br />
pointed out that **it is necessary to clarify the correlation<br />
between traffic accidents and motor vehicle construction/<br />
equipment (interior parts and components), and take<br />
effective $afety measures" to upgrade motor vehicle safety.<br />
The second recommendation was submitted by the Council<br />
in 198 I, which stated that the system and contents of the<br />
investigation should be strengthened. ln response to the<br />
recommendation, the methodology of investigation and<br />
analysis employed in past has improved since 1986, and<br />
areas, duration and number of accidents subject to<br />
investigation have been expanded, along with further<br />
upgrading and reinforcement of motor vehicle safety<br />
standards. Moreover, the investigation/analysis system has<br />
been improved to obtain useful data for the international<br />
harmonization of the standards.<br />
The Traffic Safety and Nuisance Research Institute of the<br />
MOT and Japan Automobile Research Institute, Inc. (JARI)<br />
are engaged in such investigations. An appropriate study<br />
theme, such as the effectiveness of fastening seat belts, the<br />
effectiveness of steering with energy absorbing system, the<br />
actual condition of side collision, the occurrence of vehicle<br />
fire and the compatibility of large trucks, etc. is selected<br />
each year, and approximfltely 100 cases of accidents are<br />
studied in detail for four months every year. Case study/<br />
analysis on correlation among the striking (impact) speed,<br />
vehicle deformation, injured region of occupants, and<br />
damageable objects of vehicles is done for each accident.<br />
All traffic accidents involving human fatalities/casualties<br />
that have occurred during the investigation period in areas<br />
concerned are also studied. The MOT reflects findings of<br />
the analysis to upgrade and reinforce motor vehicle safety<br />
standards (to equip the driver's seat belt with ELR device,<br />
to use HPR glass for motor vehicle windshields,<br />
reinforcement of fuel leakage preventive requirements,<br />
etc.), as well as the confirmation of each item of standards<br />
and the intemational harmonization of such standards.<br />
The present status of motor vehicle accident<br />
investigations and analysis carried out since 1973 will be<br />
described in this paper, and analytical results on<br />
relationships between types ofaccidents and vehicle speeds<br />
immediately before collision, occupant injuries and impact<br />
speeds, comparison of severity of occupant injuries in terms<br />
of EBS (Equivalent Barrier Speed) between occupant$ use<br />
seat belts and those not use them, the degree of sideward<br />
intrusion of the vehicle on the side collision and the severity<br />
of occupant injury and so on will be also reported.<br />
Motor Vehicle Accident Investigation<br />
Methodology<br />
Accident investigation are being carried out by JARI as a<br />
contract work entrusted by MOT. The "Motor Vehicle<br />
Accident Analysis Committee" consisting of experts in<br />
motor vehicles, medicine, traffic engineering, govemment<br />
administration agencies concerned, etc. is formed within<br />
JARI for deliberations on the methodology of investigation<br />
and analysis, etc. and for the preparation of annual reports<br />
based on findings of the investigation and analysis.<br />
The accident analysis section of Traffic Safety and<br />
Nuisance Research Insitute of the MOT and the accident<br />
analysis team of the JARI are engaged in the investigation<br />
under the joint cooperation of the National Police Agency,<br />
the Ministry of Construction, the Medical Association of<br />
Japan and so on.<br />
The duration of investigation is four months per year,<br />
459
followed by five months of the analysis and preparation of a<br />
rePon.<br />
Objectives of investigation and analysis<br />
Indepth investigation for the determination of the actual<br />
status of accidents in order to clarify the relationship between<br />
motor vehicle construction/equipment and the severity<br />
of human injury, contrilute to the upgrading and reinforcement<br />
of motor vehicle safety standards, and the<br />
verification of effect of the standards.<br />
Accidents Subject to Investigation<br />
Case studies<br />
Investigation are done on vehicle to vehicle accidents and<br />
single vehicle accidents involving mainly passenger cars<br />
and trucks (hereinafter refened to four or more wheeled<br />
vehicles unless otherwise specified) with relatively large<br />
damages of vehicles of accidents in which the correlation<br />
between the vehicle construction/equipment and injuries<br />
appear to be significant, and those deemed effective for the<br />
objectives of investigation.<br />
Statistic surveys<br />
Statistic surveys are carried out for all traffic accidents<br />
involving injuries occurred during the four month period of<br />
investigation in a specific area (Ibaraiki) in order to determine<br />
the statistic position of each accident subject to<br />
investigation.<br />
Areas and number of accidents investigated<br />
Seventy or more accidents are investigated out of all<br />
accidents occurred in the specific area. For particular accidents<br />
such as those involving of injured occupants use seat<br />
belts and vehicle fires. 30 or more accidents were selected<br />
out of accidents occurred in areas around the specific area<br />
ffi*'.**"<br />
trlr.. rlrlr.r<br />
tlll<br />
AEcla.rr i.r.rlitrrirr<br />
+<br />
{<br />
ff'<br />
(D lrr6iratori lo to thr Flie hcrdqurrkE 0r Frlin<br />
ti! dlracM rid condition 0[ ercb rccidcni tt rrE<br />
of t.lctbom.<br />
O Ttc Flicc isdqsrtcr+ inlorr ol Ellftt rpf.otrirti<br />
rtrrdcrr to h iircrtitrtcd by tba inrEulalqr L!f,cD<br />
lilBtrutis tm lcs to ihc Flrcc ttrtlor, tbr accidtrt<br />
sE tE rrFrr EhoE ctc.<br />
Flgure 1. Outllna of csso study method.<br />
460<br />
(Tokyo, Chiba, and Tochigi) and other areas in Japan (mainly<br />
Hokkaido, Sizuoka, Aichi, Hyogo, Okayama and<br />
Hiroshima).<br />
Method and System of Investigation<br />
Case studies<br />
Outline of the method of the case studies and the system<br />
of investigation are as shown in figure I . Investigators of the<br />
expert level are carrying out investigations according to the<br />
following procedure.<br />
(l) Investigation in the Specific Area (Ibaraiki)<br />
Investigators go to the police headquarters of the<br />
prefecture or confirm the occurrance and condition of each<br />
accident by means of telephone, and select appropriate<br />
accidents to be investigated. For each accident thus<br />
selected, the investigation team goes to the police station<br />
and finds out the nece$sary information, and carries out the<br />
investigation on traffic environments on the accident scene,<br />
together with the investigation on vehicle involved in the<br />
accident ifthe vehicles are still on the scene ofthe accident.<br />
If the vehicles are already moved out of the scene, the team<br />
finds the place where the vehicles were moved, then goe$ to<br />
the repair shop, etc. to check on the vehicles. Afterwards,<br />
the team goes to the hospital, etc. for the investigation of<br />
regions, details and severity of injuries of person(s)<br />
involved in the accident.<br />
(2) Investigation in Other Areas<br />
lnvestigators obtain accident information from the Road<br />
Traffic Information Center, etc. and select proper objects of<br />
investigation, or phone into the prefectural police<br />
headquarters for the injury of occurrence of accidents or<br />
confirmation of details of each accident so as to select<br />
proper objects of investigation. Then the inve$tigation team<br />
carries out the necessary investigation according to the<br />
same procedure as that of the specific area.<br />
Statistic survey<br />
ln order to determine conditions of accidents occured in<br />
the specific area during the investigation period and to identify<br />
parameter for the selected cases to be studied, investigators<br />
go to the prefectural police headquarters and check on<br />
the number of vehicles involved, the number of persons<br />
involved per type of accident (fatality, $evere injury and<br />
minor injury) and so on for all traffic accidents which involve<br />
casualties or fatalitie$.<br />
Data collection forms<br />
As the purpose of the motor vehicle investigation and<br />
analysis is the clarification of the relationship between the<br />
motor vehicle construction/equipment and the severity of<br />
human injury, items to be investigated were so set that<br />
conditions of vehicle construction/equipment, and the correlation<br />
between parts of components that contacted and<br />
occupants, and injured regions of occupants could be clearly<br />
determined. Details of investigation were al$o set that
traffic environments on occurTence ofaccident can be determined.<br />
Figure 2 shows major items of investigation in systematic<br />
manner classified by "human factors", "motor vehicles"<br />
and "traffic environments". All investigation items<br />
are converted into computer codes, and details entered in<br />
the data collection forms are stored in computer files after<br />
the completion of investigation and data processing, which<br />
are used in subsequent analysis.<br />
@t<br />
g 1l<br />
rffiil<br />
t4l<br />
(fudrit Ertscrir, rErul<br />
affif 0l *cuMrrr I<br />
Flgure 2. Detalls and malor Item$ of Invertigation.<br />
Outline of Accidents Subject to the<br />
Investigation<br />
Number of accidents and number of persons<br />
involved in accidents classified by fiscal year<br />
and types of accidents<br />
Table I shows the number of accidents classified by fiscal<br />
years. The number ofaccidents subject to case studies so far<br />
Table 1. Outllne ol numbers ot dlfferent types of accldentg<br />
lnYestlgated.<br />
ft- ts f T u<br />
H[1. S f,u( b 69. il ut@& 157{15 S<br />
lfftt?.8 fle{. e flffis m{19.n il66<br />
tilflg lD lt0l s l0{ts ll0[# ril0trs<br />
tfl0t ls fot s s67. fl il0?.6 ilsca ll<br />
Fdr*|.. l0 *t0o.1.. d rr !'crf l. 111illfi I{ LE llo0.p lza0zE<br />
57(tS t?{ls<br />
ffi0m rff(Iffi lmi lm tfi( Im lott( t@<br />
il5 t I lm lul<br />
l0J tr9<br />
il9 s il $l<br />
il s<br />
ti<br />
I t t3<br />
lro ts ln I& lsl<br />
Drrr.rr | ourr Esnrlr lsl u fll lBl<br />
ldiltrril *rorctcli/H r'&rr r rtcl'rri lfi l9 il0<br />
ml s fll E? WI<br />
k ef FrHr lrlld lhtrl'ird) u{ {6 6loth sof, s E7@. S il5tiD<br />
lld{3afi l*{t.0 tsH.s 155(S. m lfit(5{. m<br />
Ht{t Is Det0 lflts ls ilt2t ffi Irr5ffifl<br />
mt(lm s(tE B(IE Hi tffi I{{{ lffi<br />
amounts to 1,015, consisting of 157 cases of vehicle to<br />
vehicle head-on collisions, 264 cases of side collisions, 168<br />
cases of rear-end collisions, 168 cases of rear-end<br />
collisions, 245 cases of single vehicle accidents, 124 cases<br />
of four-wheeler to two-wheeler or bicycle accidents and 57<br />
cases of vehicle to pedestrian accidents.<br />
Vehicles involved in the accidents consist of 1,04 1<br />
passenger cars, 139 vans, 514 trucks and l3 other<br />
vehicles-1,707 vehicles in total. The number of occupants<br />
in the vehicle$ amounts to 2.834. Other included in case<br />
studies are 80 motorcycle/mopeds and 44 bicycles,<br />
involving 210 riders/cyclists. As for the classification of<br />
accidents involving occupants, there are 265 fatalities,<br />
1,664 casualties and l,l l5 no-injury case$.<br />
Number of vehicles classified by principal<br />
direction of impact force and general area<br />
of damage (forms of impacts)<br />
The number of vehicles and ratio of the principal direction<br />
of impact force, generfll area of damage and type of<br />
accident for vehicle to vehicle collisions and single vehicle<br />
collisions subject to case studies are shown in figure 3.<br />
= Rerr-end colltsion<br />
:<br />
ffi srnrle vthicle sccideit<br />
lrnr-iidcd<br />
| ?7( l.9t)<br />
0thrrr qrnrrr | ztg (15<br />
I ztg (li, ir) ll)<br />
Abrcrt I 19( l.3t)<br />
Toul I l$l( l00f)<br />
x0tc<br />
0ilrrr: l0f. 0lt. 0t8, crc<br />
lbr.nt: Firc hrr!lr ntt<br />
rictr r{iiiil. lrtl<br />
irtq rrtrr. !tE,<br />
Lrrvc 0ut unltrori,<br />
Flgure 3. Numbers ol vehlcles and rEtloe claaalfled by forma of<br />
vehlcle lmpact8 and type of accfdenla.<br />
The classification is done by using three digits ofcodes of<br />
CDC (Collision Deformation Classification according to<br />
SAE J224)-namely, frontal collisions are classified into<br />
I lF, l2F and 0lF, side collisions 02R.03R.04R.08L. 09L<br />
and l0L, rear-end collisions 058, 068 and 078. Other colli-<br />
461
sions such as l0F.01R.048. etc. are classified as those with<br />
different directions of impact force, and vehicle fires during<br />
running without involving collision are classified as<br />
"absent".<br />
The number of vehicle subject to analysis is I ,43 I , which<br />
consist of782 vehicles involved in front collisions (54.67o),<br />
187 vehicles involved in side collisions (l3.\Vo), 197 vehicles<br />
involved in rear-end collisions (l3.8%o),219 vehicles<br />
involved in collisions of other direction of impact force<br />
(l5.3Vo),27 vehicles involved in collisions from both sides<br />
(l.9Vo) and l9 vehicles without collisions (l.3Vo).<br />
Number of occupants and severity of injuries<br />
classified by principal direction of impact<br />
force<br />
Number of occupants and ratios classified by the princi<br />
pal direction of impact force, general area of damage and the<br />
severity of injury are shown in figure 4. The greatest number<br />
( 1,280) of occupants classified by the prinicpal direction of<br />
impact force is observed in frontal collisions, followed by<br />
345 occupants in side collisions and 287 occupants in rearend<br />
collisions.<br />
Figure 4. Numbers of occupants and ratlos classlfled by lorms<br />
ol vehlcle Impacts and severlties of iniuties,<br />
Ratios of injury severity classified by the principal direction<br />
of impact force shows that rear-end collisions account<br />
for the highest rute of 9l.7Vo for minor injury and no-injury<br />
cases. Side collisions for the highest rate of 35.6Vo for severe<br />
injury and fatality cases.<br />
462<br />
InjurY sGYerll,<br />
fl r. t-rts o<br />
ffi r.t-rrs o.s*z'o<br />
El - r.,r-rts z. s*s. o<br />
ffi r.r-rrs o,o-.r.o<br />
Itt' 0 0.5<br />
-2,t<br />
I<br />
[6 l{l<br />
Irr.rr, l0r, 0lr. tlr, .r.,<br />
Atr.*rj lilr lilrlr rrl<br />
rlir rrrrira. lrll<br />
t t<br />
-i.0<br />
t0<br />
tr<br />
6.0<br />
*t.!<br />
tr<br />
tr<br />
5it I. tl)<br />
15t ilt. en<br />
t0t L tD<br />
il5 t010 ttt ttr 2t5il t00n<br />
Position of accidents subject to case studies<br />
Statistic $urveys have been also carried out since 1986 for<br />
all traffic accidents occurred in the specific area during the<br />
investigation period, for the clear determination of parameter<br />
for the selected of accidents subject to case studies.<br />
The total number of accidents covered by the statistic<br />
surveys in three years up to 1988 (total duration: l2 months)<br />
is 12,647.<br />
Vehicle to vehicle collision and single vehicle accidents,<br />
which are main targets of investigation, amount to 5,929 of<br />
which 198 accidents have been subject to ca$e studies.<br />
Comparison of severity of injury between statistic surveys<br />
and case studies shown following results. Statistic<br />
surveys yielded ll9 fatalities (Z.OVo),795 severe injuries<br />
(l3.4Vo) and 5,015 minor injuries (84.67o). According to<br />
case studies, on the other hand, fatalities are 80 cases<br />
(4O.4Vo), severe injuries 90 cases (45.SVo) and minor injuries<br />
28 cases (14.l7o), with higher ratios of fatalities and<br />
severe injuries than the statistic surveys.<br />
Comparison of vehicle running speeds immediately before<br />
collisions between statistic surveys and case studies<br />
indicates that case studies show higher speeds in terms of<br />
cumulative incidence rates, as shown in figure 5. It is also<br />
found from the classification by type of accidents that the<br />
speeds are generally higher for case studies as shown in<br />
figures 6 to 9. According to the comparison of the speeds by<br />
the 50o/o line of cumulative incidence rates, single vehicle<br />
accidents show the highest speed range. Likewise, it is also<br />
found by looking at the relationship between the severity of<br />
occupant injury and the speed immediately before collision<br />
that the speeds of case studies are generally higher for<br />
severe and minor injuries than the statistic surveys, though<br />
the $ame tendency is observed between them for fatalities,<br />
as most of them covered by the statistic surveys are also<br />
included in the case studies as shown in figures l0 to 12.<br />
s<br />
2 500<br />
?000<br />
ffiffiffiH\*^<br />
200 roo il<br />
1 500<br />
I 000<br />
500<br />
4 150 5<br />
l<br />
E tn<br />
I<br />
z<br />
VAsraLisric<br />
+ survey<br />
! crsc<br />
+ 3tu(ty<br />
i0 lrt 50 6d ti irt q0 I00 I l0 120 130 lao<br />
Speed (lu/h)<br />
Floure 5. Numbers of vehlclee and cumulativg incidence rate$<br />
cldssified by vehicle speeds lmmedlately before colllglon.<br />
q<br />
G<br />
0<br />
0<br />
o<br />
5 0 E E<br />
o<br />
l<br />
d<br />
I<br />
0 o
400<br />
o<br />
i r00<br />
E 0l<br />
E 2oo<br />
E<br />
0<br />
i<br />
E too<br />
Head-on colllslon<br />
@*ristic<br />
+ SUtrct<br />
I cr*<br />
4F stud,<br />
t0 a0 50 60 70 E0 90 lo0 ilo 120 ljo lto<br />
Speed (ltr/h)<br />
I'<br />
0 0 ;<br />
0<br />
d<br />
h<br />
o<br />
g<br />
o<br />
E<br />
5 0 t<br />
o<br />
d<br />
t<br />
0 "<br />
Flgurc 6. Numb€ra ol vehlclea and cumulative incidencc ratas<br />
claaslfled by types of accldente and vehlcle speeda lmmedlately<br />
before colllslon.<br />
n<br />
500 n H n<br />
*de nffi ffiHn n<br />
colrrtroh<br />
?oo roo F<br />
1 000<br />
.9 rso<br />
o<br />
* 100<br />
E r o<br />
Flgure 7. Numbere ot yehlcle$ and cumulatlve lncldence rates<br />
classlfled by type$ of accldsnts and vehlcle apeeda lmmedlately<br />
before colllsion.<br />
o<br />
E<br />
I<br />
E<br />
2 500<br />
2000<br />
1 500<br />
1 000<br />
500<br />
150<br />
100<br />
strucl<br />
Ych ic lc<br />
lu !0 50 6[ 70 80 90 100 ll0 120 l]D 140<br />
H A<br />
Speed (krlh)<br />
3tl rklnt<br />
rchiclc<br />
Flgurc 8. Numbert ol vehlclee and cumulatlve Incidcnco ratos<br />
clagalfled by types ot accldcnts and vahlcle apeeda lmmediat6ly<br />
before colllslon.<br />
6<br />
o<br />
fu :r<br />
Relr-€nd colltsloo<br />
o o F<br />
@**iatic<br />
+ $rttt<br />
E *tc<br />
+ rtrdt<br />
0 l0 20 t0 a0 t0 60 70 8o 90 100 rrd lto rI0 lr0<br />
SDe6d (lclh)<br />
50<br />
d<br />
o<br />
o<br />
-E<br />
o<br />
n<br />
5<br />
I<br />
0 a<br />
o<br />
6<br />
p<br />
I<br />
a<br />
q A<br />
q<br />
0 6<br />
r A<br />
o<br />
I<br />
Slngle vehlcle lccldent<br />
@s[uslrc<br />
+ Sufvey<br />
rl lu ?0 l0 .0 50 60 ?r) E0 90 I00 lt0 120 ll0 ll0<br />
Speed (!u/h)<br />
loo F<br />
o<br />
!<br />
0<br />
0<br />
5 0 E<br />
E<br />
o<br />
G<br />
I<br />
0 u<br />
Flgure 9. Numbers of vehlcles and cumulatlve lncldence rstes<br />
clasalfled by types of accldents and vehlcle speeds lmme.<br />
dlately before colllslon.<br />
E c o<br />
6<br />
o<br />
!<br />
3 3 0<br />
I r o<br />
I<br />
E to<br />
Fetal I ty<br />
0 l0 20 lo a0 t0 60 70 E0 90 l0o ll0 120 130 140<br />
Speed (kr,/h)<br />
roo t<br />
Flgure 10. Numbers of occupEnls and cumulatlve Incldence<br />
rates claseiflsd by E€vsrltl€a of Inlurlee and vehlcle epeeds<br />
lmmedlatoly belore colllslon.<br />
E<br />
d<br />
r<br />
5<br />
g<br />
o<br />
I<br />
?00<br />
150<br />
100<br />
50<br />
severe lnJury<br />
o l0 ?0 30 a0 50 60 r0 80 90 100 tto t?0 t30 lao<br />
speed (kr/h)<br />
Flgure 11. Numberg of occupants and cumulatlvs lncidence<br />
rates cle8slfied by E€varltl€a of Inlurlea and vehlcle apeedr<br />
lmm6dlat6ly b€fors colllElon.<br />
It is found from foregoing data that fatalities and severe<br />
injuries are the majority of accidents subject to case studies<br />
and that the speeds immediately before collision are also<br />
higher.<br />
0<br />
€<br />
o<br />
o<br />
qr1 E U<br />
o<br />
F<br />
I<br />
!<br />
0 u<br />
100 g<br />
o<br />
0<br />
G<br />
0<br />
o<br />
c<br />
e<br />
5 0 t<br />
E<br />
o<br />
!<br />
a<br />
I<br />
J<br />
o '
E rro<br />
!<br />
c<br />
E<br />
j roo<br />
1 1 0<br />
-<br />
na<br />
NHH<br />
illnor lnjury ^ 100 r<br />
@stattsltc<br />
+ surv€y<br />
! crsc<br />
+ ttudy<br />
,l lrl :c J0 40 50 60 70 80 90 100 ll0 I20 130 110<br />
Speed (krlh)<br />
Floure 12. Numbsrs of occupanls and cumulatlve Incidence<br />
rafes claesltled by g€verltlc+i ol iniuriee and vehlcle rpeeds<br />
lmmedlately belore colllslon.<br />
Analysis of Accidents Involving<br />
Passenger Cars<br />
Of all vehicles involved in accidents, passenger cars<br />
(limited to bonnet-type cars) with the highest vehicle ratio<br />
and relatively small differences in vehicle construction and<br />
weigh were analyzed in terms of the principal direction of<br />
impact force, general area of damage, relationship between<br />
the impact speed (equivalent barrier speed) and the severity<br />
of injury, etc.<br />
Principal direction of impact force and<br />
number of vehicles classified by equivalent<br />
barrier $peed<br />
The distribution of speeds of vehicles subject to case<br />
studies is studied according to the classification by the principal<br />
direction of impact force. It is found from figure 13<br />
that speeds are slightly higher for side collisions than those<br />
of frontal collisions in terms of equivalent banier speeds<br />
(values obtain by calculating energy absorption rated from<br />
o<br />
E<br />
I t-<br />
Floure 13. Numberr of yrhlclss and cumulatlve Incldcnce<br />
rsfcs clrttlfled by prlnclpal dlrectlong ol lmpact lorce and<br />
equlvElsnt bsrrlar sprcdS.<br />
4M<br />
10<br />
I<br />
8<br />
o1<br />
ol<br />
o-j<br />
70t<br />
o<br />
L<br />
I<br />
ol<br />
10<br />
o<br />
ffiFtort<br />
! siac<br />
ffilar<br />
+ trort<br />
+ Stdc<br />
+F lcr r<br />
10 20 30 40 50 60 70 80 90 100<br />
Equlvalent berrler epeed (krlh)<br />
E<br />
o<br />
d<br />
0<br />
U<br />
o<br />
E<br />
100 ;<br />
E<br />
e<br />
!<br />
I<br />
a<br />
o<br />
6<br />
0 a<br />
E<br />
o<br />
q<br />
I<br />
0 u<br />
amount$ of crushes of vehicles and converting the values<br />
into barrier impact test speeds), and the speeds of rear-end<br />
collisions are lower than others. The speeds on the 507o line<br />
of cumulative incidence rates is 25km/h for side collisions.<br />
2lkm/h for frontal collisions and lOkm/h for rear-end<br />
collisions.<br />
Severities of occupant injuries classified by<br />
principal direction of impact force and<br />
equivalent barrier speed$<br />
Injuries ofoccupants involved in accidents are compared<br />
according to classifications of principal direction of impact<br />
force and equivalent barrier speeds. Severities of occupant<br />
injuries are classified by J-AIS (compared with AIS: J-AIS<br />
0.5 and 1.0 are equivalent to AIS l; likewise, J-AIS 1.5 and<br />
2.0 = AIS 2; J-AIS 2.5 and 3.0 = AIS 3; J-AIS 6.0 through<br />
9.0 are for the classification of fatalities by hours, which are<br />
equivalent to AIS 6), and the severity of the maximum<br />
injury of each occupant is expressed as "M.J-AIS".<br />
Cumulative incidence rates of the maximum severity of<br />
occupant injuries are classified into fatalities (M.J-AIS 6.0<br />
through 9.0), severe injuries (M.J-AIS 2.5 through 5.0),<br />
minor injuries (M.J-AIS 0.5 through 2.0) and no-injury<br />
(M.J-Ar S 0).<br />
The data compared by the principal direction of impact<br />
force are shown in figures 14 to 16. Although this compari-<br />
d<br />
e<br />
o<br />
6<br />
I<br />
O<br />
90<br />
80<br />
70<br />
60<br />
50<br />
40<br />
30<br />
?0<br />
l0<br />
0<br />
I{urbcr<br />
of<br />
occultnta<br />
+il.J-AIS 0 204<br />
* il.J-AIS 0,5-2. 0 383<br />
+il.J-AIS 2.5-5. 0 114<br />
+il.J-AIS 6,0-9. 0 5 9<br />
0 lil 20 l0 {0 50 60 ?0 80 90 100<br />
Equlvalent barrler epeed (krlh)<br />
Flgure 14. Cumulative incldence rat€l of occuPant Inlurles involved<br />
In lrontsl colll$lons classlfled by equlvalent barrler<br />
sp€eds and aeverltles of lnluries.<br />
fl<br />
6<br />
o<br />
d<br />
s<br />
E<br />
o<br />
E<br />
g<br />
E<br />
tr<br />
G<br />
)I<br />
3<br />
90<br />
80<br />
70<br />
60<br />
50<br />
40<br />
JO<br />
?o<br />
10<br />
0<br />
+t.J-Ars 0<br />
l||bcf<br />
of<br />
ffiGUDtnrl<br />
60<br />
+t,J-AIS 0,5-2. 0 r0r<br />
+il.J*AIS 2,5-S. 0 6 3<br />
+ ti, J-Ats 6,0-9. 0 { 2<br />
0 l0 e0 50 .0 50 60 t0 80 90 100<br />
Equlvrlent barrler epeed (kr/h)<br />
Figure 15. Cumulatlve Incldencs rates of occupant lnlurlea lnvolved<br />
In elds collaslons classlfled byequivaltntberrlsr speedg<br />
and severlllea of lnlurler.
e<br />
6<br />
o<br />
€<br />
I<br />
a<br />
u<br />
rQo<br />
90<br />
EO<br />
70<br />
60<br />
50<br />
40<br />
JO<br />
20<br />
10<br />
0<br />
l[bcr<br />
of<br />
trcuFrltE<br />
+ll.J-AI$ 0 5l<br />
* ll,J-AI9 0.$-2.0 lrg<br />
+ il,J-AIS ?,5-5,0 3<br />
+ll,J-AIS 6,0-9,0 6<br />
l0 20 l0 .0 50 60 70 E0 90 I00<br />
Equlval6nt barrter Epeed (kr/h)<br />
Flgure 16. Cumulatlve Incldence ratgs ol occuofnt Inlurle$ Involved<br />
In rear.end colllslons classllled by sqLlvaledt berrler<br />
spasda and aavsrltlea of Inlurler.<br />
son shows similar tendencies of injury between frontal and<br />
side collisions, injuries occur from relatively low impact<br />
speeds for rear-end collisions but speeds to have caused<br />
fatalities are relatively high. It should be noted, however,<br />
that this tendency is not clearly determined, as the number<br />
of occupants involved in fatal accidents is small.<br />
Comparison of severities of occupant injuries<br />
between those using sert helts and those<br />
not using them<br />
The mandatory use of seat belt was reinforced since November<br />
1986 in Japan, on the whole, the rate of belt use (it<br />
wzs 92Vo for drivers involved in vehicle to vehicle and<br />
single vehicle accidents according to the national statistics<br />
of 1987) has been improved to have contributed to the<br />
reduction of injuries in accidents. Using rates in case studies<br />
are, however, generally quite low, and it was as low as 237o<br />
for drivers involved in accidents subject to investigation in<br />
1988. This low using rate is presumably due to rhe facr that<br />
cases with reduced injuries owing to seat b€lt use normally<br />
would not be included in case $tudies, a$ severe injuries and<br />
fatalitie$ are main objects of case studies, which resulted in<br />
the seemingly low using rate. Effects of seat belts on the<br />
reduction of injuries are observed here, where front seat<br />
occupants are considered as the object of analysis. The<br />
o<br />
H '<br />
-<br />
I<br />
t<br />
0<br />
B 3<br />
d<br />
5 2<br />
= .<br />
E<br />
0<br />
"""<br />
o o o 0 6<br />
"Affi<br />
d866";<br />
OeOOc o o o a<br />
0 l0 20 30 .0 50 60 ?0 80 90 l0o<br />
Equlvalent barrler speed (krlh)<br />
Be I ted<br />
I<br />
A 5<br />
A ro<br />
Flgurs 17. Soverltlee ol occupant Inlurles Involved In lrontll<br />
colllslons clsrslflrd by cqulvdlcnt bairlsr apoodr.<br />
number ofoccupants subject to the analysis is 78 for those<br />
who use seat belts (3 or more point belts) and 505 for those<br />
who do not use seat belts.<br />
Figure l7 shows the relationship between the severity of<br />
the maximum injury and the equivalent barrier speed. Effects<br />
of seat belt use were not recognized in this figure.<br />
Thus, occupants with negative factors to have reduced the<br />
effect of seat belts are excluded from those who use seat<br />
belts. Namely, occupants of vehicles collided by trucks with<br />
large amounts of intrusions (30cm or more) into the vehicle<br />
compartments, causing underride, or where rear seat occupants<br />
not use seat belts pushed front seat occupants through<br />
seat backs, etc. are excluded for the purpose ofcomparison.<br />
Table 2 shows the breakdown of occupants who are<br />
deemed to have such negative factors.<br />
Table 2. Number of occupantr lor whlch thc sfiect of teat bolt<br />
u$o on tho reductlon ol Inlury |3 prerumably reduced.<br />
[ause of prcsufiably rcduccd 0r i ver Co-dr i ver Totr I<br />
Largc ailount of intrusron (30cr or nore) l 3 l7<br />
Underr rde col I rsron I I<br />
llfong use 2<br />
lnflucnce of unbeltcd rerr se!t occuprnt 2 4<br />
Torn I L O o 32<br />
According to this comparison, the effect of seat belts can<br />
be recognized, as the injury severity is lower for those using<br />
seat belts than those not using seat belts, as shown in figure<br />
18.<br />
ra<br />
-<br />
3<br />
I<br />
t)<br />
l r<br />
€<br />
1 2<br />
J<br />
E<br />
0<br />
a "..'<br />
f i l a<br />
0 l0 20 30 r0 t0 60 ?0 80 90 100<br />
Equlvdlent bsrrler Bpeed (krlh)<br />
Unbe<br />
o<br />
c.}<br />
\ ,<br />
Ited<br />
I<br />
l0<br />
20<br />
Flgure 18. Ssvorltlor of occupanl Inlurlcr Involvsd In lrontal<br />
collltlonr clamllled by equlvalent balrler rpesdr.<br />
A comparison of cumulative incidence rates is also made<br />
between occupants using seat belts and those not using<br />
them, according to the classification by severities of injuries.<br />
Figure l9 shows cumulative incidence rates of occupants<br />
using seat belts, while figure 20 shows the rates of<br />
those not using seat belts. It is found from these figures that<br />
equivalent barrier speeds tend to be higher for those using<br />
seat b€lts in each category of injury severity.<br />
50<br />
455
a<br />
0<br />
0<br />
0<br />
a<br />
o<br />
6<br />
I<br />
O<br />
ool<br />
rol<br />
uoJ<br />
701<br />
uol<br />
50-l<br />
4 0'i<br />
,'ol<br />
20 1<br />
':l<br />
Belted<br />
liurber<br />
OI<br />
occupants<br />
+!f.J-AIS 0 22<br />
+ll.J-AIS 0,5-2,0 28<br />
++lq,J-AIS ?.5-5.0 16<br />
+lt.J-Ars 6.0-9,0 t2<br />
! I j ;n li 40 50 b0 70 irl ttr 100<br />
Equlvalent barrler speed (krlh)<br />
Flgure 19. Cumulatlve lncldence rstes of occupant Injurlet Involvsd<br />
In frontal colllslons clas$lflcd by equlvalenl barrler<br />
speeds and severllles of Inlurler.<br />
This difference is particularly significant for cases of no-<br />
injury (M.J-AIS 0) and minor injuries (M.J-AIS 0.5-2.0),<br />
which may be also considered as an effect on the injury<br />
reduction by use of seat belts.<br />
As have been compared so far, the effect of seat belt use<br />
on the injury reduction is recognized, but occupant injuries<br />
caused by the improper use of seat belts or injuries of front<br />
seat occupants resulted from the pushing by rear seat occupants<br />
not using seat belts are also found recently. Activity to<br />
prompt on promote the proper use of seat belts and the<br />
development of a more comfortable seat belt system are<br />
considered necessary, since such problems are likely to<br />
increase along with the increasing use of seat belts.<br />
+t<br />
E : area of slde slII lower Plane<br />
to the slndow frane lorer Plane<br />
ril<br />
-fit i<br />
l l r l<br />
lli<br />
J(<br />
il:<br />
M :<br />
*<br />
o^<br />
$ro<br />
Ito<br />
Hoo<br />
0<br />
E s o<br />
5 + o<br />
g J o<br />
8 2 0<br />
i 1 0<br />
6 o<br />
0 1 0 2 0 1 0 4 0 5 0 6 0 7 0 8 0<br />
Equlvelent berrler speed (krlh)<br />
Unbelted<br />
l{u[ber<br />
of<br />
0ccuPants<br />
* rrr.J-AIS 0 135<br />
+ ll|.J-AIS 0,5-2.0 25r<br />
-* Irl,J-Ars 2.5-5.0 71<br />
+ ltl.J-AIS 6.0-9.0 42<br />
Flgure 20. Cumulative incidenc€ rates ot occupant lniurles ln.<br />
volved In frontal colllalona claeelfled by €qulvalent barrier<br />
eposde and severltles ol injuriet.<br />
Side collision accidents<br />
The number of vehicle collided sideward by other vehicles<br />
or objects (CDC codes; 01, 0?,03, 04, 05R; 07, 08,09,<br />
10, lll-) and subjected to investigation classified by the<br />
principal direction of impact force and general area of damage<br />
is 192 (right-side collisions: 92 vehicles; left-side collisions:<br />
100 vehicles) as shown in figure 21. As for the principal<br />
direction of impact force, direction of 02 o'clock and l0<br />
o'clock from the forward direction are most frequently<br />
found, including directions of 03 o'clock, while collisions<br />
from the backward direction are few. By looking at intruded<br />
vehicles classified as E or A according to the CDC (E: area<br />
of side sill lowerplane to the window frame lowerplane; A:<br />
area of side sill lower plane to the roof top), intrusions into<br />
.!3tl<br />
presence<br />
of lntruslon<br />
related vehicle<br />
A : area of side slll lower plane<br />
to the roof top<br />
ffiH<br />
Flgure 21. Numbers of vchlcles classlfled by prlnclpal dhectlons of lmpsct force, general arGas of damage$, and absenc€/presence<br />
of lntruslon <strong>Int</strong>o passengsr compartment.<br />
466
their passenger compafrments are found in 103 vehicles out<br />
of 149 vehicles classified as E, and 42 vehicles ofout of43<br />
vehicles classified as A. As forthe general area of damage, P<br />
(middle), F (front) and Y (front + middle) account for the<br />
majority, with great amounts and rates of intrusions for P<br />
and Y in particular. The most frequently found principal<br />
direction of impact force into the passenger compartment is<br />
09 o'clock.<br />
Relationship between equivalent berrier<br />
speed and maximum intrusion into passenger<br />
compflrtment<br />
The relationship between the equivalent barrier speed<br />
and the maximum intrusion into passenger compartment in<br />
vehicle to vehicle and single vehicle accidents is shown in<br />
f,tgure 22. Vehicles collided from direction of 0t,02,03,09,<br />
l0 or I I o'clock, with the general area of damage in P, D<br />
(entire side plane), Y, Z (middle + back) and the range of E,<br />
A or H (bumper upper plane to the roof top) are covered<br />
here. It is found from this figure that some correlation<br />
exists between the equivalent barrier speed and the maximum<br />
intrusion into passenger compartment$, but significant<br />
variations are also found from single accident vehicles.<br />
Therefore, it was decided to limit objects of the analysis<br />
to vehicle to vehicle collisions, and the relationship mentioned<br />
above was analyzed again.<br />
The relationship between the equivalent barrier speed<br />
and the maximum intrusion into passenger compartments<br />
according to the classification by the general area of damage<br />
was thus re-evaluated. Namely, general areas of damages<br />
are classified into R D (E, A, H) and Y, Z (E, A, H), and<br />
principal directions of impact force are classified into three<br />
categories of 03,09 o'clocks, 0l,l I o'clocks and 02,10<br />
o'clocks. Figure 23 shows vehicles with the general area of<br />
damage in the zone of P, D while figure 24 shows vehicles<br />
with the general area of damage in the Y,Z zone, with each<br />
of them classified by the principal direction of impact force.<br />
;<br />
150<br />
It0<br />
130<br />
r?0<br />
..9 tto<br />
g 100<br />
9 s o<br />
E ro<br />
*<br />
Eo<br />
I<br />
5<br />
. -<br />
JU<br />
! , 0<br />
f 3 0<br />
?0<br />
l0<br />
0<br />
DuatE arcr: P. tt. Y, z (8, A, ll)<br />
Dlrectlon: 01. 02. 03, 09, 10, ll<br />
O c<br />
o o o A o<br />
" g8 4<br />
:lir:a<br />
iUE o -<br />
o o<br />
o<br />
0 l0 20 30 .0 50 60 t0 80 90 100<br />
Equlvalent barrler epeed (k|/h)<br />
vchlclc to vGhlclt<br />
coII l3 lon<br />
o l<br />
o l<br />
o 5<br />
Slntlr vchlclc<br />
ecldGnt<br />
a l<br />
4 ?<br />
A 3<br />
Flgure 2e. texlmum <strong>Int</strong>rurlonr <strong>Int</strong>o pessenger compartmGntr<br />
In $ldt colllslons clscalflcd by squlvalent barrler spcrds (vehlcle<br />
to vehlclo colllslons and rlngle vehlcle accldents).<br />
150<br />
l a0<br />
t30<br />
.9 rro<br />
d 100<br />
q 90<br />
i 8 0<br />
! s o<br />
I<br />
r l0<br />
4 3 0<br />
?0<br />
l0<br />
0<br />
150<br />
la0<br />
| 30<br />
'* 1?O<br />
I ' - -<br />
9 rro<br />
E 100<br />
3 g o<br />
5 so<br />
h<br />
E ? 0<br />
- 60<br />
!l so<br />
! r o<br />
s 3 0<br />
t0<br />
DilidE arer: P, D (E. A. Hl<br />
Dlrectlon:03,09<br />
0 l0 20 30 10 50 60 10 80 90 100<br />
Equlvalent barrler epeed (krlh)<br />
DU|l $c6: I, Z (E, A, [)<br />
Dlr*tlon:03,09<br />
01, lI<br />
0e. l0<br />
0 l0 20 t0 r0 50 60 ?0 80 90 100<br />
Equlvalent blrrler apeed (kr,/h)<br />
- 0s, 09<br />
o l<br />
d 2<br />
o 5<br />
Flgure 24. Maxlmum <strong>Int</strong>ruglong <strong>Int</strong>o paraengcr compartmsnta<br />
In slde colllsions classlfled by oqulvalcnt barrler apeeda (vehlcle<br />
to vehlcle colllrlons).<br />
Comparison of both figures shows that the intrusion into the<br />
P, D zone tends to be slightly greater than that of the Y, Z<br />
zone, and the maximum intrusion into the passenger compartment<br />
is slightly greater where the principal direction of<br />
impact force is in the range of 03,09 o'clocks, while it is<br />
smaller where it is within the range of 0l,I I o'clocks. This<br />
tendency is more significant in the Y, Z zone. As described<br />
so far, some correlation is found between the equivalent<br />
barrier speed and the maximum intrusion into the passenger<br />
compartment by the classification of principal direction of<br />
impact force as mentioned above.<br />
Injuries of vehicle occupants<br />
- 03. 09<br />
o l<br />
o 2<br />
Flgure 23. Maxlmum <strong>Int</strong>ruslons <strong>Int</strong>o psrasng€r compErtmenls<br />
ln elde colllelons classllled by equlvalcnt barrlrr spaadr (vehlcle<br />
to vehlcle colllalona).<br />
Table 3 and table 4 show numbers of injuries as classified<br />
by damageable parts and components against front seat<br />
occupants and regions of injuries. As regards damageable<br />
parts and components against the occupants, those at both<br />
sides of passenger compartments account for the highest<br />
rate of 42.8Vo in vehicle to vehicle collisions, while they<br />
account for 37.SVo in single vehicle accidents, and objects<br />
out$ide vehicles are direct causes ofdamages in other cases.<br />
As for the classification by regions of injuries, head, neck<br />
and chest account forhigherrates in vehicle to vehicle colli-<br />
467
sions, while head accounts for the highest rate in single<br />
vehicle accidents. Damageable parts or components caused<br />
relatively severe injuries are door panels, A-pillars and vehicle<br />
interior deformations and exterior parts/components<br />
of the other vehicle in vehicle to vehicle collisions, while<br />
A-pillars, roofside rails and objects outside vehicle in single<br />
vehicle accidents.<br />
Relationships among the severity of the maximum injury<br />
of occupants, equivalent barrier speed and the maximum<br />
intrusion into the passenger compartment were studied<br />
next, by classifying general area of damages into P, D, Y and<br />
Z (E, A, H) and principal direction of impact force into two<br />
categories of 01, 02, 03 o'clocks and 09, 10, 1 I o'clocks,<br />
with front seat occupants as the objects of analysis. Figure<br />
25 and 26 show the relationship between the equivalent<br />
barrier speed and the severity ofoccupant injury classified<br />
by the direction of impact and the location of sitting. Although<br />
a clear tendency cannot be found due to great variations<br />
among individual vehicles, it is found that severity of<br />
injuries in struck side occupants are generally severe than<br />
those of the opposite side occupants, and for the occupants<br />
of left seats in particular where the principal direction of<br />
impact force is with the zone of 09, 10, ll o'clocks' The<br />
occuffence of injuries are found for both right and left seat<br />
occupants where the equivalent barrier speed is l0km/h or<br />
higher and fatalities are found where the equivalent barrier<br />
speed is 35km/h or higher for both right and left seat occupants,<br />
where the principal direction of impact force is in the<br />
zone of 01, 02, 03 o'clocks. In case where the principal<br />
direction of impact force is in the zone of 09, 10, I I<br />
o'clocks, injuries are found for both left and right seat<br />
occupants where the equivalent barrier speed is l5kmft or<br />
higher and fatalities are found where the equivalent barrier<br />
speed is 25km/h or higher for left seat occupants and 45km/<br />
h or higher for right seat occupants. Likewise, the relationship<br />
between the maximum intrusion into the Passenger<br />
compartment and the severity of occupant injury has been<br />
$tudied. It is found as shown in figure 27 and 28 that variations<br />
among individual vehicle are even greater than the<br />
above. The occurrence of injuries are found where the<br />
amount of intrusion is Ocm or more for left seat occupants,<br />
and 5cm or more for right seat occuPants, while the occurrence<br />
of fatalities are found where the intrusion is 35cm or<br />
more for both right and left seat occupants, where the principal<br />
direction of impact force is in the zone of 01, 02, 03<br />
o'clocks. In case where the principal direction of impact<br />
force is in the zone 09, 10, I I o'clocks, injuries are found<br />
from the Ocm intrusion for both left and right seat occupants,<br />
while the fatalities are found from the intrusion of 20cm for<br />
Table 3. Numbsrs of Inlurlet ol occupants Involved In slde colllslons classifled by damageable parts, reglons and aeverltles of<br />
Inlurlee (vehlcle to vehlcle colllrlona).<br />
t.<br />
lj<br />
hrrlr ldrr.rurill<br />
I lrrsr<br />
tli<br />
I t,rl lrt<br />
{.r'..0r orlil '.1'.1<br />
crrrrErl r.tror Elrr. I'rdr. rM*i 1 rDo.r Jr.br<br />
1[ttllrr1010t0<br />
i<br />
ol'." 0 r.5 t0 t! I { (q 5 0 r 0 | 0 e 0.1'll,l r.o r.: ro rt ro.'jj<br />
I<br />
I t<br />
! ? ! rrr0r0,.jie.ir I r 0 r r ro !.0 | oro t 1! rr ro r.0.1'll,l ? 0 | 0.1".0. i | 0 il r[:l<br />
t ? t t l ? i l<br />
I l '<br />
lfr flFt7 ! r r r rFral lm a ! e i l r r f r<br />
r{[ti xr*rrt u-rr]r I E<br />
Tgble 4. Numbers ot hlurles of occupants Involved ln elde colllslons claaallled by damageable parts, reglont snd seYsritie$ of<br />
inlurles (slngle vehlcle accldents).<br />
- I rrnd8hrcld<br />
E I insrurelr gutl<br />
""<br />
Slrli:",l,'iT''<br />
" "lrmf<br />
I *rdt-rrrl<br />
! | ourirda ottftr<br />
= | rqo EurrrcG<br />
468<br />
t,0 l.tr 10 z5 1.0 {.0 5.0 ? 0 9 0 4'lt<br />
1 1 |<br />
l t z<br />
t l<br />
t r i<br />
l l l 3 6<br />
2 l l l<br />
2 2 l 1 6<br />
t 1 1 5<br />
t l<br />
l t<br />
l r<br />
2 a 6 2 9 l l ? l<br />
ctrYrcrl rrlr0n<br />
?lll|lI'en* trrbrl tn* tr.br<br />
*.1f0-,j ,,, t0 r.0 t0 s.0 I o s.o,11l,l r.o e0,lll,l I.s Lo to r.o,l'l!,r 5 J.0 r, 0t;i; nru!lr rlnitolr^r(r<br />
l t l r S<br />
l l l S<br />
I t 2 2 t t 5 l l t 2 r 2 1<br />
2 2l r r 2
left seat occupants and from the 4thm intrusion for right<br />
seat occupants.<br />
h<br />
s<br />
I<br />
T n<br />
- -<br />
i r<br />
o<br />
l'2<br />
E r<br />
0<br />
DuatE $cr: P. It, Y, Z (E, A, H)<br />
Dtrcctlon:0L 02,03<br />
0 t0 ?0 30 a0 50 60 ?0 80 90 100<br />
Equtvalent berrler epeed (krlh)<br />
Rltfit lrotrt<br />
trauFfit<br />
o l<br />
o 2<br />
U N<br />
Oro<br />
Lcft frort<br />
ftcuDmt<br />
a l<br />
A 2<br />
A 5<br />
Figure ?5. Saverltlee of Inlurlor of occupsnt8 Involved In slde<br />
colllslon$ clesslflrd by cgulvalsnt barrlsr apeede (vehlcle to<br />
vehlcle colllslon*).<br />
0<br />
I<br />
6<br />
H ?<br />
I<br />
? r<br />
-<br />
E l<br />
0<br />
B s<br />
6<br />
a l<br />
)<br />
0<br />
Dutf, rr€r: P, D, Y, Z (E. A' ll)<br />
Ittrectlon:09,10.1f<br />
A<br />
a . A a<br />
o g q<br />
o € o O<br />
A o . o O s<br />
a O o<br />
l0 t0 t0 a0 50 50 ?0 80 90 100<br />
Equlvelent birrler epeed (kr,/h)<br />
Rldrt lront<br />
occupmt<br />
o l<br />
6 2<br />
o 5<br />
Olo<br />
trlt front<br />
occuP6ht<br />
a l<br />
A ?<br />
A 5<br />
Figure 26. $avsrltles of Inlurlea of occupanla Involved In slde<br />
collislons classlflad by equlvalent barrler apeeds (vehlcle to<br />
Yehlc16 colllslona).<br />
I<br />
t<br />
3 1<br />
I<br />
? 5<br />
E<br />
5<br />
h<br />
o<br />
B r<br />
6<br />
1 l<br />
I<br />
E<br />
0<br />
Itr.ar rrcr: P, lt. Y, Z (8. A, lll<br />
Itlrmtls: Ol,01,0t<br />
A O<br />
0 l0 t0 30 {0 50 60 ?0 N0 90l0it0ttf,tf,tot50<br />
llarllul lntruslon (cr)<br />
llttt lront<br />
ftcrDer<br />
o l<br />
o t<br />
o s<br />
Olo<br />
L.ft front<br />
*euFmt<br />
A l<br />
a l<br />
A 5<br />
Flgure 27. Severltles ot Inlurlcr of occupants Involved In slde<br />
colllslons classllled by merlmum <strong>Int</strong>ruslons <strong>Int</strong>o pssssnger<br />
compartm€nta (vehlcle to vehlcle colllslons).<br />
6<br />
- 6<br />
-- i<br />
I<br />
t<br />
0<br />
B 3<br />
s<br />
5 ?<br />
= .<br />
E<br />
0<br />
Durte rrci:'P. D. I, Z (E, A" H)<br />
Dlrectlon:09.<br />
r0.11<br />
0 l0 20 30 r0 50 60 ?0 80 s0l0ht0r2hti.0l50<br />
llarlrur lntru8lon (cr)<br />
Rlttt front<br />
oecuptnt<br />
p l<br />
o z<br />
Oto<br />
Latt front<br />
dcuDfit<br />
a l<br />
A 2<br />
Flgure 28. Seyerltlrs of Inlurler of occupanl8 Involved In slde<br />
colllslons classlfled by marlmum <strong>Int</strong>ruslons <strong>Int</strong>o psssongsl<br />
compartments (yehlcle to vehlcle colll$lon$).<br />
Summary<br />
Accident case studies being canied out at present and<br />
stati$tic surveys for the clear determination of parameter for<br />
the selected accidents have been described in this report,<br />
together with the outline of accidents investigation so far<br />
and some examples of analysis on seat belts and side<br />
collisions.<br />
The following can be pointed out by summarizing findings<br />
of this report.<br />
(l) Rates of fatalities and severe injuries, and vehicle<br />
speeds immediately before collision are higher in accidents<br />
covered by the case studies than those ofother accidents in<br />
general.<br />
(2) The distribution of number of vehicles classified by<br />
the principal direction of impact force and the equivalent<br />
barrier speed has been studied for passenger cars. It is found<br />
that equivalent banier speeds are slightly higher in side<br />
collisions than those in frontal collisions, while the speeds<br />
are lower in rear-end collisions. Likewise, the distribution<br />
of severities of occupant injuries has been studied. It is<br />
found that the tendency of injuries is similar between frontal<br />
and side collisions. while it is different for rear-end<br />
collisions.<br />
(3) The effect of rhe seat belt use on the reduction of<br />
injury has been compared between passenger car occupants<br />
use seat belts and those not use them who were involved in<br />
frontal collisions, according to the classification by the<br />
equivalent barrier speeds. As a result, the effect ofseat belt<br />
use on the injury reduction is recognized on comparison<br />
taking account of passenger companment intrusion rate,<br />
underride collisions into trucks and the effect on rear seat<br />
occupants without use seat belts.<br />
(4) Conelation is found between the equivalent barrier<br />
speed and the maximum intrusion into the passenger<br />
compartment in vehicle to vehicle side collisions by<br />
limiting the zone of principal direction of impact force and<br />
the general area of damage. For single vehicle accidents,<br />
469
however, variations among individual vehicles are great and<br />
clear correlation cannot be determined. This is presumable<br />
due to the difference in object to which each vehicle collided.<br />
For occupant injuries, those of oacupants in struck<br />
vehicle tend to become severer in general, but the tendency<br />
is not clear when it is considered in relation to the equivalent<br />
barrier speed or the maximum intrusion into the passenger<br />
compartment.<br />
Postscript<br />
Objectives, methodology, outline and some of analytical<br />
results of motor vehicle traffic accident investigations<br />
carried out so far under the Ministry of Transport of Japan<br />
have been reported. We intend to carry out more studies/<br />
investigations and analysis of data in order to reflect the<br />
findings to motor vehicle safety standards.<br />
References<br />
(l) The Councils for Transport Technics,<br />
"Technical<br />
Measures for Safety of Motor Vehicles-First Program for<br />
Future Motor Vehicle Safety Standards", September, 1972<br />
(Japanese).<br />
(2) The Councils for Transport Technics,<br />
"Technical<br />
Measures for Safety of Motor Vehicles-Second Program<br />
Plan for Future Motor Vehicle Safety Standards", October,<br />
1980 (Japanese).<br />
(3) Land Transport Engineering Department, Regional<br />
Transport Bureau, Ministry of Transport, "Motor Vehicle<br />
Accident Investigation and Analysis Reports", 1973 to<br />
1988 (Japanese).<br />
(4) Koshiro Ono and Takashi Sato, "Review of MOT<br />
Vehicle Accident Investigation in Past Seven Years",<br />
Proceedings Ninth <strong>Int</strong>emational Technical <strong>Conf</strong>erence on<br />
Experimental Safety Vehicles, Kyoto, Japan, October 1982.<br />
(5) SAE Recommended Practice J2?4a, "Collision<br />
Deformation Classification<br />
",<br />
(6) P.L. Harms, M. Renouf, P.D. Thomas and M.<br />
Bradford, "Injuries to Restrained Car Occupants; What are<br />
the Outstanding Problems?", Proceedings Eleventh<br />
<strong>Int</strong>ernational Technical <strong>Conf</strong>erence on Experimental Safety<br />
Vehicles, Washington, D.C. United States, May 1987.<br />
(7) Dietmar Otto, Norbert Siidkamp and Hermann Appel'<br />
"Residual<br />
Injuries to Restrained Car Occupants in Frontand<br />
Rear-Seat Positions", Proceedings Eleventh<br />
<strong>Int</strong>emational Technical <strong>Conf</strong>erence on Experimental Safety<br />
Vehicles, Washington, D.C. United States, May 1987.<br />
(8) David C. Viano, "Limits and Challenges of Crash<br />
Protection", Accident Analysis and Prevention, Vol. 20,<br />
No.6. December 1988.<br />
The Crash Avoidance Rollover Study: A Database for the Investigation of Single<br />
Vehicle Rollover Crashes<br />
E,A. Harwin, Lloyd Emerp<br />
National Highway Traffic Safety<br />
Administration.<br />
U.S. Department of Transportation<br />
Abstract<br />
In an effort to more fully understand the contributions of<br />
the vehicular, environmental and driver characteristics to<br />
the frequency of rollover crashes, a dedicated database with<br />
a broad spectrum of variables, has been developed. This<br />
database, denoted by the acronym CARS (Crash Avoidance<br />
Rollover Study;, includes data from approximately three<br />
thousand single vehicle rollover crashes. Vehicle types<br />
encompassed by this study include passenger cars, light<br />
trucks, utility vehictes and vans. The contents of the CARS<br />
database were collected over a one and a half year period by<br />
trained investigators from the Maryland State Police and<br />
supplemented by information derived from analyses by<br />
NHTSA staff. This database contains all levels of reported<br />
accident and injury severity.<br />
<strong>Int</strong>roduction<br />
The National Highway Traffic Safety Administration<br />
(NHTSA) is involved in continuing research into the causes<br />
470<br />
and the effects of rollover crashes. The goal of this research<br />
is to answer the following questions:<br />
r What vehicle factors influence rollover<br />
propensity?<br />
r What environmental factors affect rollover<br />
frequency?<br />
r What driver factors are causal to rollover<br />
involvement?<br />
r What changes in vehicle design, highway design,<br />
and driver behavisr will reduce the risks<br />
associated with rollovers?<br />
This research ha$ taken several approaches including<br />
accident data analysis, development of sophisticated<br />
vehicle handling and rollover computer simulations and<br />
full-scale experimental testing. Analysis of a validated<br />
rollover database is considered essential to support these<br />
efforts, as well as aiding in the develoPment of future<br />
rollover countermeasures.<br />
Past analyses of rollover crash data, revealed the areas of<br />
information where existing files do not meet the needs of<br />
ongoing rollover research. Thus NHTSA decided to<br />
construct a database which could yield a maximum amount<br />
of information on topics such as accident scene<br />
characteristics, the driver condition and the precrash<br />
vehicle stability and handling behavior.
Existing Data Bases<br />
Three major sources of accident data, developed by<br />
NHTSA, are available to support accident analysis research.<br />
They are the Fatal Accident Reporting Sysrem (FARS), rhe<br />
National Accidenr Sampling Sy$rem (NASS) and the Crash<br />
Avoidance Research Datafile (CARDfile) (l).*<br />
FARS is an excellent source of infonnation pertaining to<br />
the consequences<br />
ofaccidents when fatalities are involved.<br />
FARS variables and collection criteria allow tletailed<br />
evaluation of topics related to vehicle crashworthiness<br />
characteristics. However, since FARS deals solely with the<br />
accidents in which a death occurs, accidents with less severe<br />
injury levels are not included in the database. Also, as<br />
Edwards (?) indicates, the lack of success in crash<br />
avoidance problem identification, using crashworthiness<br />
oriented databa$es, stems from the fundamental differences<br />
in the approach to accident harm mitigation. That is, the<br />
accident data collected by crashworthiness researchers is<br />
more closely related to understanding injury causes, in<br />
order to lessen their severity, than to accident prevention.<br />
NASS has an extensive variety of data variables in its<br />
files. Not only do the files have information pertaining to<br />
the consequences of rollover crashes, but the automated<br />
NASS files may be supplemented by examining the hard<br />
copy files for additional information concerning precrash<br />
conditions (3). These files have been used by researchers as<br />
the benchmark of national representativeness for police<br />
reported accidents. However, as NASS is a sample, it lacks<br />
the numbers of observations deemed appropriate for<br />
analyses on the vehicle make/model level.<br />
CARDfile is a database constructed from state police<br />
accident reports from five states, and was designed to<br />
improve the precrash information available at the vehicle<br />
make/model level. The file variables were selected to<br />
include indicators of precrash stability and control. The<br />
large size and representativeness of the CARDfile data files<br />
allows statistical analyses to be performed at the vehicle<br />
make/model level. However, to maximize the NHTSA<br />
capability to analyze single vehicle rollover accidents with<br />
respect to precrash handling, stability, roadway<br />
characteristics, and driver condilions, it was determined<br />
that an enhanced CARDfile style database, with a broader<br />
range of variables, was necessary.<br />
CARS Database<br />
Design Criteria<br />
NHTSA research has shown that over ninety percent of<br />
vehicle rollover accidents do not involve another vehicle.<br />
This finding, along with past analyses of single vehicle<br />
rollover accidents, rruggests that the medium best suited for<br />
rollover data analysis would be a detailed study of single<br />
vehicle rollover crashes. If complete, this data could<br />
provide an excellent opportunity to test hypotheses relating<br />
to the role of the vehicle, the accident scene, and the driver<br />
in these crashes. It was determined that a single vehicle<br />
rollover accident database, with emphasis on issues relating<br />
rNumbcrs in parenthescs designale references at cnd of paper.<br />
to crash avoidance, would be designed using police repoft$<br />
and supplemented<br />
by the following $ources;<br />
. A trained accident reconstructionist would<br />
investigate and verify the original state accident<br />
repon.<br />
r The accident reconstructionist would interview<br />
the original accident investigating officer for<br />
verification of certain data and for additional<br />
information.<br />
r The reconstructionist would interview the driver<br />
to derive additional accident data characteristics<br />
such as precrash handling or road condition.<br />
r The vehicle registration record would be obtained<br />
for the rollover accident vehicle from the state<br />
registration file.<br />
r The complete driving record of the rollover<br />
vehicle driver would be obtained to aid in<br />
assessing driver related factors.<br />
r NHTSA analysts would provide $tabiliry and<br />
vehicle damage analysis results.<br />
The resulting CARS files were constructed from every<br />
available single vehicle rollover accident occurring in the<br />
state of Maryland from August 1987 until December of<br />
1988. Its files consist of approximately three thousand<br />
accidents for the vehicle classes of passenger car, light<br />
truck, rrtility vehicle, and van. Since these rollovers are of<br />
sufficient number, and were obtained over a continuous<br />
period of eighteen monrhs, CARS has rhe following<br />
beneficial characteristics:<br />
Accidents resulting in all levels of injury severity<br />
were obtained.<br />
Sufficient numbers of accidents, representing a<br />
current vehicle make/model population, were<br />
obtained. This allows for analyses to be<br />
performed based on specific make and models.<br />
A broad spectrum of accident variables were<br />
obtained which permit the reconstruction of a<br />
vehicle's probable precrash movements.<br />
The numbers oferrors introduced by handling and<br />
coding mistakes were minimized by the<br />
redundant collection of data and by performing<br />
multiple levels of data verification.<br />
Since CARS represent$ a continuous time period<br />
and a defined geographical area, the commonly<br />
used data normalizing metrics for exposure, such<br />
as vehicle registration, can be easily employed.<br />
Data Collection Methodology<br />
The Crash Avoidance Rollover Study, CARS, was<br />
designed to meet the above data criteria to provide an<br />
enhanced crash avoidance rollover database. past and<br />
present efforts of database collection, such as NASS, rely on<br />
the utilization of numerous teams of accident<br />
reconstructionists. It is costly, in time and available<br />
resources, to train sufficient numbers of teams necessarv for<br />
471
a project the size of CARS. A more cost effective solution<br />
was to mobilize the trained accident reconstructionists of<br />
the Maryland State Police. This elite group of officers,<br />
trained in accident investigation techniques, were already<br />
geographically placed throughout the state. This special<br />
team of accident reconstructioni$ts were given specific<br />
collection instructions and data acquisition forms. When a<br />
rollover, which met the above criteria, was reported, a<br />
member of the team was dispatched to collect the required<br />
data.<br />
Data source redundancy and data cross checking<br />
capability were designed into the CARS collection<br />
methodology. For example, the Maryland Motor Vehicle<br />
Accident Report gave the location and description of the<br />
accident site. This was validated and upgraded by on-site<br />
measurements and photographs of the accident scene.<br />
Data from multiple sources were also collected to<br />
facilitate reconstruction of accident precrash and causal<br />
factors (table l). The data sources for these elusive factors<br />
include the following:<br />
r Maryland State Motor Vehicle Accident Report<br />
r Driver interview by accident reconstructionist<br />
r Original investigating officer interview taken by<br />
the accident reconstructionist<br />
r Additional physical evidence was collected at the<br />
accident scene and from the crash vehicle by the<br />
accident reconstructionist<br />
Table 1. Dsta sources.<br />
FOLICE ACCIDENT REFOFT<br />
VEHCLE FEFONT<br />
VErcLE<br />
This information was then used for accident evaluation<br />
by NHTSA engineers. For example, the precrash behavior<br />
of the vehicle, before rolling, was estimated. A<br />
determination was made as to whether the accident vehicle<br />
was skidding, what type of skid occurred (such as spinning<br />
or sideslipping) and an assessment was made as to the<br />
probable cause of that skid (such as braking or steering).<br />
One engineer performed this evaluation to minimize<br />
inconsistencies.<br />
Data was also derived from photographs of the CARS<br />
vehicles. Structural damage to accident vehicles was<br />
evaluated by using a modified version of the SAE<br />
Recommended Practice (J224). This practice provides a<br />
basis for the classification of a vehicle's deformation level<br />
caused by an accident. ln the CARS database, vehicle body<br />
damage was coded using this SAE zero to nine scale to<br />
represent the extent of vehicle body deformation. Zero is<br />
coded for no body damage and nine is coded when body<br />
472<br />
BEOBTRATION<br />
ENCINEERINC EVALUATION<br />
INTERVIEWS:OFIVER ANO OFFCEA<br />
OREINAL IHVESiIdAIdO OFFEEF<br />
RECONSTFUCTIOffIST<br />
SI^IE AEOI$TFATPN FILEg<br />
AECONATFUCTI<strong>ONE</strong>T<br />
BTATE LECEHSINO FILES<br />
tust cM# oaTA AHAIYST$<br />
flffig4 ENCINFFF<br />
RECONTBWTFNI8T<br />
GSNERAL AACEENT/ORIVER INFOAKATIfr<br />
VFHICTE MEASUREMENIg AfiD FHOTOS<br />
MAXE/MOOEL VEAIFEATION<br />
TIhE MEAEUREMEflTS AilO MODEL INFOFMATION<br />
MEASUNEMENTF/HOTOE<br />
O<br />
ORIV€R TICKET FECOFO<br />
VEHICLE OEFORMAIION EVALUATPN<br />
FHECAAS STABILITY ABEE9EEilT<br />
DHNEA, fiO^OWAY, VErcLE OSOITEH<br />
intrusion is complete. This coding allowed for as detailed of<br />
an analysis as the photographic evidence could provide.<br />
One team of NHTSA crashworthiness analysts performed<br />
this coding to maximize consistency.<br />
Data Quality Control<br />
Data quality control procedures were instituted at every<br />
level of the database construction process.<br />
The Maryland State Police selected to investigate CARS<br />
crashes were those who had been trained and certified by the<br />
State of Maryland as accident reconstructionists. These<br />
officers were chosen for their proven abilities and interest in<br />
accident reconstruction. This group was then briefed by the<br />
Maryland State Police project leader and NHTSA engineers<br />
regarding the objectives of the vehicle rollover project and<br />
the proper use of the data forms. All vehicle measurements,<br />
accident scene measurements, and accident reconstruction<br />
procedures were thoroughly discussed with this group.<br />
The next level of data quality control was intrinsic to the<br />
CARS data gathering design. As mentioned above, multiple<br />
sources of key, yet difficult to acquire, information were<br />
used. Data indicating such accident descriptors as driver<br />
physical condition, vehicle speed, and vehicle skidding<br />
were subject to this redundant data gathering method' The<br />
third level of data quality control was implemented by the<br />
NHTSA receiving engineer. Each accident data form was<br />
checked for missing or improperly entered data, and for<br />
completeness and appropriateness with respect to the CARS<br />
collection criteria. Forexample, if an incoming accident file<br />
lacked a driver record it would be withheld until the missing<br />
material could be recovered from the Maryland State Police<br />
computer files.<br />
Quality control efforts were rigorously implemented at<br />
the data entry level, Using separate sessions, the raw data<br />
was double entered. The two resulting data files were then<br />
subjected to a computer data comparison program where<br />
each data inconsistency was documented. The appropriate<br />
accident file was then pulled for each flagged observation,<br />
and, wherever possible, corrected.<br />
A fifth level of quality control was applied to assure a<br />
dependable vehicle make and model coding. The vehicle<br />
identification number, CARDfile output code, vehicle type<br />
code, and vehicle photographs were double checked for<br />
consistency. The verified vehicle code was then processed<br />
by a CARS program which was designed to separate truck,<br />
vans, and utility vehicles into distinct make/model groups.<br />
For example, the make/model category for a Ford pickup<br />
was broken down into Fl50's, F250's, etc.<br />
The most ambitious step of the data verification<br />
procedure used a series of computer programs, written<br />
expressly for CARS. These programs checked all variables<br />
against an acceptable, predetermined value range. When<br />
inconsistencie$ were reported, records would be pulled, and<br />
the values verified or corrected.
CARS Datahase Organization<br />
CARS is composed of five data files and two user files.<br />
The data files are entitled Accident, Vehicle, Tire. Driver.<br />
and Passenger. The two user files are the Vehicle Parameters<br />
and the Variable Library, The above files are in SAS<br />
(Statistical Analysis System) format and are installed on a<br />
VAX I l/780 mini-computer. Their configurarion, as<br />
outlined in table 2, allows forrapid examination of variables<br />
taken from one file or, for more complicated analyses, file<br />
merging. Examples of the use of these files, individually<br />
and collectively, may be found in the Analysis section of<br />
this paper.<br />
Table 2. Crash avoldance rollover study detabase.<br />
Accident file<br />
+<br />
lr"*tro I<br />
The Accident file contains over sixty variables which<br />
describe such accident related factors as the roadway characteristics,<br />
environment. roadside attributes and the sequence<br />
of crash events (table 3). The variable, -tripping,'<br />
which estimates the rollover initiating event, proves to be<br />
especially beneficial in demonstrating the effects of roadway<br />
and roadside features on the risk of single vehicle<br />
rollover accidents. The variables which describe the land<br />
use at the crash site may be of particular research interest.<br />
Table 3. Accldent flle contents.<br />
TIME OF CFASH<br />
OESCRIPTOF TYPE<br />
SEQUENCE OF EVENTS<br />
$EVEBITY MEASURES<br />
ROADWAY DESCFIPTOHS<br />
HOADSIDE DE$CRIPTOHS<br />
WEATHEB/LIGHT<br />
PRECRASH MOVEMENT INDICATOFS<br />
LOCALE<br />
OTHEB<br />
NUMBEF OF VAHIABLES<br />
2<br />
7<br />
2<br />
17<br />
o<br />
6<br />
€<br />
3<br />
t1<br />
Past NHTSA analyses have shown that rural environments<br />
are significantly related to the incidence ofrollovercrashes<br />
(4).<br />
Vehicle file<br />
The Vehicle file contains over sixty variables which allow<br />
investigation of vehicle related factors in rollover<br />
crashes (table 4). This file was generated using an extensive<br />
make/model coding and verification system (see the section<br />
on Data Quality Control) so that accident analyses may be<br />
performed on distinct make/model groups. Vehicle level<br />
precrash stability (the incidence of skidding, for example)<br />
and crash outcome (the amount of vehicle deformation,<br />
number of quarter tums rolled, etc.) variables allows the<br />
researcher to obtain insight into the entire crash accident<br />
scenario. This file also contains parameter measurements of<br />
the accident-involved vehicle.<br />
Table 4. Vehlcle flle contents.<br />
Tire file<br />
MAKE/MODEL IDENTIFICATION<br />
VEHICLF CONDITION<br />
MEASUFEO PARAMETER$<br />
PHECFASH MOVEMENTS<br />
CRASH MOVEMENTS<br />
VEHICLE MODIFICATIONS<br />
VEHICLE LOADING<br />
MILEAGE<br />
OTHEF<br />
The Tire file contains twenty-five variables which describe<br />
the tire tread depth, inflation pressure, and rolling<br />
radius of the crash vehicles' tire (table 5). Tread depth<br />
provides data for assessing a tire's influence on the dynamic<br />
performance on wet surfaces. Tire inflation pressure is necessary<br />
for the analysis of limit performance of tires in cornering<br />
and braking maneuvers. Such tire data is also essential<br />
to rollover simulation validation.<br />
Driver file<br />
The Driver file is composed of more than forty variables<br />
related to the driver demographics, driver condition at the<br />
time of the crash, driving history, and any possible accidenr<br />
avoidance errors or attempts made by the driver (table 6).<br />
For example, of primary importance to the understanding<br />
of a driver's behavior at the time of the crash. is the use of<br />
alcohol. As shown by Terhune (5), in a study of injured<br />
4't3
Table 5. Tlre flle contenta.<br />
DEscRrproR TYPE I Huueen oF VARIABLE$<br />
MANUFACTUHER I 4<br />
MoDEL NAME | 4<br />
OEM SIZE RATING I 4<br />
TFEAD DEPTH I 4<br />
GAUGE PRESSUHE I 4<br />
RoLLTNG FADrus | 4<br />
orHER | 1<br />
Table 6. Drlver flle contenla.<br />
DISCHIPTOF TYPE NUMBER OF VAHIABLE$<br />
DFIVER CONDITION<br />
DRIVEF HISTOBY<br />
DFIVEF AVOIDANCE ATTEMPT<br />
DRIVEF ERFOF<br />
IN.JUFY SEVERITY<br />
EJECTION<br />
BESTBAINT USE<br />
DRIVER DEMOGRAPHIC$<br />
OTHEF<br />
drivers, alcohol use is consistently under reported. To mitigate<br />
this bias, in our database, data from multiple sources of<br />
use indicators were included in CARS. Despite these efforts,<br />
the thirty percent alcohol impairment rate found in<br />
this file must still be considered more of a lower bound<br />
estimate for the actual rate of alcohol involvement in rollover<br />
accidents.<br />
Passenger files<br />
The Passenger file, with its ten variables, was established<br />
to aid in analyses directed at rollover outcome harm mitiSation.<br />
These variables rePort on injury serverity, age/sex<br />
demographics, and restraint use (table 7).<br />
474<br />
17<br />
q<br />
2<br />
11<br />
1<br />
2<br />
1<br />
3<br />
1<br />
Table 7. Passenger flle contsnts.<br />
DESCRIFTOFT TYPE I NUMBER OF VAHIABLES<br />
PASSENGEF INJUFY SEVEFITY I 1<br />
EJECTION<br />
FESTRAINT USE<br />
DEMOGRAPHICS<br />
OTHER<br />
Vehicle parameter file<br />
This file contains twenty-nine variables of measured,<br />
calculated, or identifying vehicle characteristics. The measurements<br />
were performed by the Vehicle Research and Test<br />
Center, NHTSA, using an apparatus called the Inertial Parameter<br />
Measurement Device (7). The file parameters include<br />
such items as center-of-gravity data and moment of<br />
inertia measurements. These parameters allow the testing of<br />
statistical hypotheses relating the risk ofrollover to vehicle<br />
geometric configuration (table 8). Currently, these measurements<br />
exist for approximately one hundred make and<br />
models by model year.<br />
Tsble 8. vshlcle parEm€t€r flle contents.<br />
DESCRIPTOB TYPE I NUMBEF OF VARIABLES<br />
MODEL TDENTIFICATION I 15<br />
MEASURED DIMENSION$ I 5<br />
GENTEF oF GRAVITY POSITION$ I 2<br />
INEFTIA MEASUHEMENTS I 3<br />
DERTVED RATIOS I 2<br />
oTHER I 2<br />
Library<br />
Attached to the CARS data files is a user format library<br />
file containing the definitions of the variable codes. This file<br />
provides the user with a formatted and therefore easily read<br />
output from CARS.<br />
Single vehicle accident database supplement<br />
The above CARS files are designed to be supplemented<br />
with a database of all single vehicle crashes. This database<br />
will be gathered from the Maryland Automated Accident<br />
files, for the same time period as CARS. It will have a<br />
structure similar to that of CARS. However, as this informa-<br />
2<br />
,l<br />
2<br />
3
tion will be taken from a single source, the variable roster<br />
will be more limited. This database may be used as a merric<br />
of single vehicle accident exposure.<br />
Analysis-Sample Results<br />
The CARS database files may be examined using<br />
traditional SAS techniques for descriptive and inferential<br />
analyses. Frequency distributions of variables have been<br />
explored in a continuing quality control effort. CARS has<br />
also been subjected to several preliminary exarninations to<br />
assess its capability to support re$earch. The following<br />
analysis samples demonstrate the versatility of this database<br />
to provide insight into the problems of rollover accidents.<br />
Accident file<br />
The relative frequency of tripping is of primary importance<br />
to the issue of rollover. Tripping, by way of a working<br />
definition, is a rollover initiating event where a force, other<br />
than roadway friction, is generated by a mechanical interaction<br />
of the vehicle with its environment. Untripped rollover<br />
is defined as a rollover which results solely from the interaction<br />
of the vehicle tires with a hard surface. Table 9 contains<br />
the distribution of these estimated sources of tripping. It is<br />
of interest to note that the untripped rollover is a relatively<br />
rare event (less than ten percent of the database).<br />
Tabfe L Trfpplng mechanlrma.<br />
UNTFIPPED<br />
MECHANISM<br />
PAVEMENT EDGE<br />
DITCH<br />
SOIL,/FLAT<br />
GUAFDFAIL,/BARRIER<br />
EMBANKMENT/SLOPE DOWN<br />
OTHER,/UNKNOWN<br />
PERCENT OF DATABASE<br />
9.8<br />
7.4<br />
3.7<br />
23.3<br />
24.O<br />
7.O<br />
14.4<br />
10.4<br />
Figure I shows the distribution of the above tripping<br />
mechanisms as a function of the variable .land use.' This<br />
variable is a description ofthe general character ofthe land<br />
in the vicinity of the crash site and takes on the values of<br />
'urban' or 'rural.' The two most notable differences<br />
Trlpplng mechanlsms In rollover Eccldents: by land ute.<br />
FJERCT N I<br />
30<br />
7i<br />
!llr9**<br />
t.o'"' sn'j' qo'L/t\'A],,qate[s.,,qopt,,,*auoilir<br />
uiiet'oAftiin"nut'o' ;\Hte<br />
i u'<br />
IRIPF'INTJ Mt.L I IANI.]M<br />
Flgure 1. Maryland GAFS Flle data.<br />
E<br />
UFBAN<br />
N nLrrr<br />
between these distributions are found for'roadside curb,'<br />
cited 3.5 times more often in urban settings, and 'ditch,'<br />
cited 2.2 times more often in rural areas.<br />
The CARS variables which describe features adjacent to<br />
the lanes of travel show a proportionately higher ratio of<br />
curbs in urban environments (3.6 times greater than that<br />
found for rural). These variables also show that a larger<br />
proportion of ditches are found along rural roadways (2.5<br />
times more often than in the urban environments), figure Z.<br />
PF RL]t. NT<br />
60<br />
50<br />
40<br />
/gFFertR<br />
oul+oer*<br />
Roadalde<br />
fsalures present ln rollover craehes.<br />
c'ss**o$.ute=r"oet.Ioptoo$$ t'F\ "$-**<br />
67.4<br />
20.3<br />
8.0<br />
J.E<br />
o.7<br />
URAAN u<br />
R(JRI N<br />
Flgure 2. Featurer adlacsnt lo lanee of trayel. Up to two cltscl<br />
P€r oD8ervatlon. taryland CAFS Flle data.<br />
Vehicle<br />
file<br />
Rollover analyses are frequently performed on data broken<br />
out by vehicle type, (forexample, passengercars, pickup<br />
trucks, etc.). The distribution of these designations is<br />
reported in table 10.<br />
Table 4. Vehlcle type dlstrlbutlon.<br />
VEHICLE TYPE PEBCENT OF DATABASE<br />
PASSENGEF CARS<br />
PICKUF TRUCKS<br />
UTILITY VEHICLES<br />
VANS<br />
OTHER<br />
The frequency distribution of the reconstructed variable,<br />
'Precrash<br />
Vehicle Dynamic Behavior,' which resulted from<br />
the stability analysis performed by NHTSA sraff, (rable I I )<br />
reveals that the greatest proponion (sixty-eight percent) of<br />
precrash stability conditions involves some type of skidding.<br />
Thus, Table I I shows that five percent of the single<br />
vehicle rollovercases were initiated by a vehicle displaying<br />
a precrash front wheel lateral skid (understeer) type ofvehi-<br />
cle skidding, fifty percent displayed a precrash rearwheel<br />
lateral skid (oversteer)<br />
type ofvehicle skidding, and thideen<br />
percent displayed a four wheel lateral skid (neutral steer)<br />
type of vehicle skidding.<br />
475
Table 11. Precrash vehlcle dynsmlc behavior (stabllity<br />
condltlon).<br />
STABILITY CONDITION<br />
NO $KID INDICATED (STABLE)<br />
FRONT WHEEL/LATERAL (UNDEBSTEEF)<br />
FIEAR WHEEL LATEBAL (OVEHSTEEH)<br />
FOUB WHEEL LATEHAL (NEUTRAL STEEF)<br />
UNKNOWN<br />
Table 12 shows a breakdown of the above sixty-eight<br />
percent of skidding accidents, evaluated as to instability<br />
cause or instability precipitator. A noteworthy finding in<br />
table l2 is the discovery that fifty percent of the skidding<br />
type of rollover accidents were caused by the lateral force<br />
generated by going around a curve in the road too fast.<br />
Twenty-four percent of the rollover accidents were caused<br />
by the driver putting in a severe steering input while on a<br />
straight road such as passing another vehicle, The eighteen<br />
percent precrash skidding attributed to snow and ice includes<br />
accidents occurring on both curves and straight<br />
roads.<br />
Table 12. Cauee ol dynamlc ln$tablllty (up to two clted per<br />
case).<br />
CAUSE OF INSTABILITY PEFCENT OF DATABASE<br />
LATERAL CUBVE FORCE<br />
ACCELEFATION INPUT<br />
STEERING INPUT<br />
BBAKING INPUT<br />
STEEFING AND ACCELERATION<br />
STEEBING AND BRAKING<br />
OTHER (SNOW, ICE, ETC)<br />
UNKNOWN<br />
The distribution of vehicle body deformation damage<br />
areas, table 13, shows that the most frequently damaged<br />
portions of a vehicle involved in a rollover are the vehicle<br />
top and sides. What is less expected is the large (forty-eight<br />
percent) proportion of vehicles which have measurable<br />
frontal damage.<br />
Table 13" Vehlcle arca of deformatlon.<br />
52<br />
1<br />
24<br />
1<br />
18<br />
10<br />
+ AFEA OF DAMAGE PERCENT OF DATABASE<br />
TOP DAMAGE<br />
FRONT DAMAGE<br />
-REAB DAMA-GE<br />
DAMAGE<br />
_LEFT<br />
RIGHT OAMAGE<br />
+ MTJLTIPLE AREAS OF DAMAGE MAY BE CODED FOR EACH ROLLOVEF<br />
476<br />
48<br />
26<br />
Vehicle parameter file<br />
By accessing variables from the Driver, Vehicle, and Vehicle<br />
Parameter files, the relationships between a selection<br />
of vehicle geometric parameters, quarter turns rolled, mean<br />
driver injury severity, and estimated speed were explored.<br />
This was performed using nineteen make/models which had<br />
measurements available and were represented by a minimum<br />
of ten observations in the database. All values represent<br />
make/model based means. The estimate for driver injury<br />
is derived from the police reported, ordinal values of'0,'<br />
representing no injury, to '4,' indicating a fatality. The<br />
estimate for speed, is based on data from the police report,<br />
the investigator's report, the driver's estimate, or the speed<br />
limit. The variable for the quarter turns rolled estimates the<br />
number of quarter turns the vehicle underwent. A matrix of<br />
Pearson correlation coefficients and their associated P values,<br />
probabilities that there is no association, are reported in<br />
table 14.<br />
Table 14. Pearson correlatlon coeff lclentg.<br />
INJUFY r,004<br />
0.000<br />
0.578<br />
._ 0,0,1_.._<br />
$PEED<br />
0.578<br />
0.387<br />
0.10 1<br />
1,000 "0.089<br />
0.0 10 0,000<br />
--O.r-S$<br />
0.74<br />
FOLL<br />
0.367<br />
1.000<br />
WEIGHT<br />
10 r.<br />
_il<br />
-0,2 l8<br />
0.370<br />
o.720 0.000<br />
0.t0t -0.3?g<br />
dg19_ 0.1 75<br />
6FF<br />
t__ _<br />
FOLL INEFTIA<br />
0.403<br />
0,087<br />
0,074<br />
0.785<br />
-0.32S<br />
d. r70<br />
0,397<br />
0.10 1<br />
0.367<br />
0,r22<br />
0.0c<br />
0.73<br />
INJUHYi MEAN DFIVEB INJUFY<br />
BOLL: MEAN OUAHTEF TOFNS FOLLED<br />
?14<br />
38d<br />
-.0t I I<br />
0.65?<br />
-0.416<br />
0.o77<br />
-0,219<br />
0.3€9<br />
0.t01<br />
0.E80<br />
0.403<br />
0.067<br />
- is;r<br />
0.101<br />
'0.3t5 0.2 14<br />
dtlL'__ 0.380<br />
r,000 -0.€08<br />
0.000 0.00E<br />
0.608<br />
0 006<br />
0.81 I<br />
1.0001<br />
0.81t<br />
0.0001<br />
t.000<br />
0.000<br />
-0.390<br />
oi_":<br />
-0.543<br />
0 0087<br />
0.074<br />
0,765<br />
0.387<br />
0,!??<br />
r:; i<br />
0.€51<br />
0.81 I<br />
o.0n0r<br />
-0 3s0<br />
0.09s<br />
1.000<br />
0,000<br />
0.63r<br />
0.004<br />
SFEED: MEAN EETIMATEO 6PEEO<br />
WEIGHT: MEAN CUFB WEIGHT<br />
FOLL INEFTIA<br />
-0.3?s<br />
0.170<br />
0.083<br />
.o:ltt<br />
-0.416<br />
o.o77<br />
0.8 t?<br />
0.0001<br />
-0.583<br />
0.00s<br />
0.9s1<br />
0.004<br />
1.000<br />
0.000<br />
llll illii^*ii.'iL:"'i:'"T"?i,1""1'*Il1fl i:''ffitl'UlT!?i,'" L,NEAF a'soctA'o'<br />
19 PASS€NGEF CAFS, FIOKUF THUCX$, UTIIITY VEHICLES AND VANS<br />
MINIMUM OF 1O OBSEFVATIONS PEF MAFE/MODEL<br />
Using a five percent criterion that the probability of no<br />
association is significant, the top line of the table indicates<br />
that as the mean injury increases so does the average estimate<br />
for speed. That is, if there is more initial energy imparted<br />
to the rollover speed, there is an increased risk of injury.<br />
Several of the measured vehicle Parameters, including<br />
weight, wheelbase, half track to center*of-gravity height,<br />
and roll moment of inenia are also correlated according to<br />
the five percent standard. For example, the mean roll moment<br />
of inertia has a negative and significant association<br />
with the mean half track width to center-of-gravity height<br />
ratio (7).<br />
Conclusions<br />
Based on the following attributes, CARS is a versatile<br />
and cost effective medium in which researchers may gain<br />
insight into single vehicle rollover accidents:<br />
r The CARS database structure, of five data files<br />
and two user files, allows for ease of access within<br />
one file or file aggregation.<br />
The detailed information within CARS allows for<br />
the testing ofa broad range ofhypotheses relating