400W / 500W Series Display Interfaces - Garmin
400W / 500W Series Display Interfaces - Garmin
400W / 500W Series Display Interfaces - Garmin

Create successful ePaper yourself
Turn your PDF publications into a flip-book with our unique Google optimized e-Paper software.
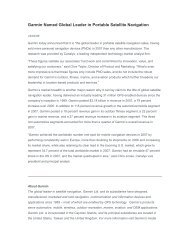
<strong>Display</strong>ing Storm Data on the Map Page<br />
The Map Page displays cell or strike information<br />
using yellow lightning strike symbology overlaid<br />
on a moving map. This added capability improves<br />
situational awareness, which in turn makes it much<br />
easier for the pilot to relate storm activity to airports,<br />
NAVAIDs, obstacles and other ground references.<br />
NOTE: Storm data is displayed on the Map Page only if<br />
aircraft heading is available.<br />
In normal operation, the current mode and rate<br />
are displayed in the top right corner of the Map Page<br />
and the bottom right corner of the Lightning Page.<br />
The mode is described by the word “STRIKE” when in<br />
strike mode, or “CELL” when in cell mode.<br />
NOTE: Cell mode uses a clustering program to identify<br />
clusters of electrical activity that indicate cells.<br />
Cell mode is most useful during periods of heavy<br />
storm activity. <strong>Display</strong>ing cell data during these periods<br />
frees the user from sifting through a screen full<br />
of discharge points and helps to better determine<br />
where the storm cells are located.<br />
Storm Activity<br />
Storm Data <strong>Display</strong>ed on the Map Page<br />
190-00356-31 Rev. D<br />
Cell Mode<br />
Strike Rate<br />
Section 2<br />
L-3 Stormscope Interface<br />
5