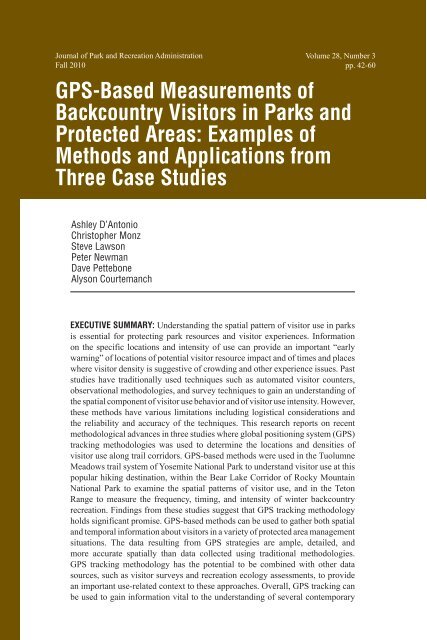
GPS-Based Measurements of Backcountry Visitors in Parks and ...
GPS-Based Measurements of Backcountry Visitors in Parks and ...
GPS-Based Measurements of Backcountry Visitors in Parks and ...

You also want an ePaper? Increase the reach of your titles
YUMPU automatically turns print PDFs into web optimized ePapers that Google loves.
42<br />
Journal <strong>of</strong> Park <strong>and</strong> Recreation Adm<strong>in</strong>istration<br />
Fall 2010<br />
Volume 28, Number 3<br />
pp. 42-60<br />
<strong>GPS</strong>-<strong>Based</strong> <strong>Measurements</strong> <strong>of</strong><br />
<strong>Backcountry</strong> <strong>Visitors</strong> <strong>in</strong> <strong>Parks</strong> <strong>and</strong><br />
Protected Areas: Examples <strong>of</strong><br />
Methods <strong>and</strong> Applications from<br />
Three Case Studies<br />
Ashley D’Antonio<br />
Christopher Monz<br />
Steve Lawson<br />
Peter Newman<br />
Dave Pettebone<br />
Alyson Courtemanch<br />
EXECUTIVE SUMMARY: Underst<strong>and</strong><strong>in</strong>g the spatial pattern <strong>of</strong> visitor use <strong>in</strong> parks<br />
is essential for protect<strong>in</strong>g park resources <strong>and</strong> visitor experiences. Information<br />
on the specific locations <strong>and</strong> <strong>in</strong>tensity <strong>of</strong> use can provide an important “early<br />
warn<strong>in</strong>g” <strong>of</strong> locations <strong>of</strong> potential visitor resource impact <strong>and</strong> <strong>of</strong> times <strong>and</strong> places<br />
where visitor density is suggestive <strong>of</strong> crowd<strong>in</strong>g <strong>and</strong> other experience issues. Past<br />
studies have traditionally used techniques such as automated visitor counters,<br />
observational methodologies, <strong>and</strong> survey techniques to ga<strong>in</strong> an underst<strong>and</strong><strong>in</strong>g <strong>of</strong><br />
the spatial component <strong>of</strong> visitor use behavior <strong>and</strong> <strong>of</strong> visitor use <strong>in</strong>tensity. However,<br />
these methods have various limitations <strong>in</strong>clud<strong>in</strong>g logistical considerations <strong>and</strong><br />
the reliability <strong>and</strong> accuracy <strong>of</strong> the techniques. This research reports on recent<br />
methodological advances <strong>in</strong> three studies where global position<strong>in</strong>g system (<strong>GPS</strong>)<br />
track<strong>in</strong>g methodologies was used to determ<strong>in</strong>e the locations <strong>and</strong> densities <strong>of</strong><br />
visitor use along trail corridors. <strong>GPS</strong>-based methods were used <strong>in</strong> the Tuolumne<br />
Meadows trail system <strong>of</strong> Yosemite National Park to underst<strong>and</strong> visitor use at this<br />
popular hik<strong>in</strong>g dest<strong>in</strong>ation, with<strong>in</strong> the Bear Lake Corridor <strong>of</strong> Rocky Mounta<strong>in</strong><br />
National Park to exam<strong>in</strong>e the spatial patterns <strong>of</strong> visitor use, <strong>and</strong> <strong>in</strong> the Teton<br />
Range to measure the frequency, tim<strong>in</strong>g, <strong>and</strong> <strong>in</strong>tensity <strong>of</strong> w<strong>in</strong>ter backcountry<br />
recreation. F<strong>in</strong>d<strong>in</strong>gs from these studies suggest that <strong>GPS</strong> track<strong>in</strong>g methodology<br />
holds significant promise. <strong>GPS</strong>-based methods can be used to gather both spatial<br />
<strong>and</strong> temporal <strong>in</strong>formation about visitors <strong>in</strong> a variety <strong>of</strong> protected area management<br />
situations. The data result<strong>in</strong>g from <strong>GPS</strong> strategies are ample, detailed, <strong>and</strong><br />
more accurate spatially than data collected us<strong>in</strong>g traditional methodologies.<br />
<strong>GPS</strong> track<strong>in</strong>g methodology has the potential to be comb<strong>in</strong>ed with other data<br />
sources, such as visitor surveys <strong>and</strong> recreation ecology assessments, to provide<br />
an important use-related context to these approaches. Overall, <strong>GPS</strong> track<strong>in</strong>g can<br />
be used to ga<strong>in</strong> <strong>in</strong>formation vital to the underst<strong>and</strong><strong>in</strong>g <strong>of</strong> several contemporary
issues <strong>in</strong> protected area management such as visitor experience <strong>and</strong> natural<br />
resource impacts, visitor-wildlife concerns, <strong>and</strong> visitor soundscape experiences.<br />
KEYWORDS: Global position<strong>in</strong>g system, visitor use patterns, visitor behavior,<br />
visitor use estimation, recreation management<br />
AUTHORS: Ashley D’Antonio is with the Department <strong>of</strong> Environment <strong>and</strong> Society,<br />
Utah State University, 5215 Old Ma<strong>in</strong> Hill, Logan, UT 84322, phone: (435)<br />
797-1009, email: ashleydantonio@gmail.com. Monz is with the Department<br />
<strong>of</strong> Environment <strong>and</strong> Society, Ecology Center, Utah State University. Lawson is<br />
with the Resource Systems Group, Inc, Burl<strong>in</strong>gton, Vermont. Newman is with<br />
the Department <strong>of</strong> Human Dimensions <strong>of</strong> Natural Resources, Colorado State<br />
University. Pettebone is with the National Park Service at Yosemite National<br />
Park. Courtemanch is with the Department <strong>of</strong> Zoology & Physiology, University<br />
<strong>of</strong> Wyom<strong>in</strong>g<br />
ACKNOWLEDGMENTS: The authors thank Karen Hockett, Logan Park, Derrick<br />
Taff, <strong>and</strong> Larry Gamble for considerable help with the design <strong>and</strong> development <strong>of</strong><br />
this study. This work was supported by grants from the Alternative Transportation<br />
<strong>in</strong> <strong>Parks</strong> <strong>and</strong> Public L<strong>and</strong>s Program adm<strong>in</strong>istered through the National Park<br />
Service <strong>and</strong> the S.J. <strong>and</strong> Jessie E. Qu<strong>in</strong>ney Foundation. The second author also<br />
thanks the Utah State Agricultural Experimentation for fund<strong>in</strong>g support dur<strong>in</strong>g<br />
several phases <strong>of</strong> this work.<br />
Participation <strong>in</strong> outdoor recreation <strong>and</strong> visitation to parks <strong>and</strong> protected areas<br />
has <strong>in</strong>creased over recent decades <strong>in</strong> the United States (Cordell, 2008) <strong>and</strong> worldwide<br />
(De Lacy & Whitmore, 2006). As the number <strong>of</strong> visitors to parks <strong>and</strong> protected areas<br />
<strong>in</strong>creases, there is potential for the expansion <strong>and</strong> proliferation <strong>of</strong> recreation resource<br />
impact <strong>and</strong> dim<strong>in</strong>ished visitor experience (Hammit & Cole, 1998; Mann<strong>in</strong>g, 1999). From<br />
a resource perspective, the extent <strong>of</strong> impact is <strong>in</strong>fluenced by the type, amount, location,<br />
<strong>and</strong> spatial <strong>and</strong> temporal distribution <strong>of</strong> visitor use (Hammit & Cole, 1998; Newsome,<br />
Moore, & Dowl<strong>in</strong>g, 2002; Monz, Cole, Marion, & Leung, 2010). As such, managers<br />
<strong>of</strong>ten f<strong>in</strong>d it useful to underst<strong>and</strong> several attributes <strong>of</strong> visitor use <strong>in</strong>clud<strong>in</strong>g the number<br />
<strong>of</strong> visitors <strong>in</strong> an area or system, spatial patterns <strong>of</strong> visitor use, <strong>and</strong> visitor behavior as<br />
possible “early warn<strong>in</strong>gs” <strong>of</strong> resource change. Similar strategies can be employed from a<br />
visitor experience perspective, as underst<strong>and</strong><strong>in</strong>g use is suggestive <strong>of</strong> issues <strong>of</strong> crowd<strong>in</strong>g<br />
<strong>and</strong> dim<strong>in</strong>ished visitor experiences. Managers can also utilize <strong>in</strong>formation related to visitor<br />
use to better underst<strong>and</strong> the relationship between impact <strong>and</strong> use, underst<strong>and</strong> trends, assign<br />
priorities for management action <strong>and</strong> facility development, <strong>and</strong> as <strong>in</strong>put for statistical <strong>and</strong><br />
simulation models <strong>of</strong> visitor use (Lawson, 2006; Leonard, Echelberger, Plumley, & Van<br />
Meter, 1980). A thorough underst<strong>and</strong><strong>in</strong>g <strong>of</strong> visitor use levels <strong>and</strong> patterns can contribute to<br />
a more complete underst<strong>and</strong><strong>in</strong>g <strong>of</strong> many important issues <strong>in</strong> protected area management<br />
<strong>in</strong>volv<strong>in</strong>g visitor experience <strong>and</strong> resource protection priorities.<br />
Past research exam<strong>in</strong><strong>in</strong>g visitor use has focused primarily on estimat<strong>in</strong>g use levels.<br />
Developed approaches can be categorized as self-count<strong>in</strong>g methods, direct-count methods,<br />
<strong>and</strong> <strong>in</strong>direct-count methods (Hollenhorst, Whisman, & Ewert, 1992; Watson, Cole, Turner,<br />
& Reynolds, 2000). The earliest count<strong>in</strong>g techniques used by managers <strong>of</strong> parks <strong>and</strong><br />
protected areas were self-count<strong>in</strong>g techniques such as voluntary registration, self-issued<br />
43
44<br />
permits, <strong>and</strong>, <strong>in</strong> some locations, m<strong>and</strong>atory permits (Wenger & Gregerson, 1964; Wagar,<br />
1969; James, 1971; Hendee & Lucas, 1973; Hollenhorst et al., 1992). However, selfcount<strong>in</strong>g<br />
techniques are subject to <strong>in</strong>accuracies due to noncompliance by visitors <strong>and</strong>, <strong>in</strong><br />
order to accurately estimate use, managers must make adjustments for noncompliance <strong>and</strong><br />
calibrate accord<strong>in</strong>gly (Thorsell, 1967; Echelberger, Leonard, & Plumley, 1981; Leatherberry<br />
& Lime, 1981). Self-registration <strong>and</strong> self-issued or m<strong>and</strong>atory permits are <strong>of</strong>ten best used<br />
<strong>in</strong> areas where access to l<strong>and</strong>s is restricted (Muhar, Arnberger, & Br<strong>and</strong>enburg, 2000). The<br />
<strong>in</strong>formation collected from self-count<strong>in</strong>g techniques is useful but <strong>of</strong>ten lacks descriptive<br />
<strong>in</strong>formation such as visitor use patterns, visitor characteristics, motivations, <strong>and</strong> behavior.<br />
Direct count<strong>in</strong>g methods such as observational techniques <strong>and</strong> surveys can provide<br />
managers with use estimations as well as more detailed <strong>in</strong>formation related to visitor use<br />
patterns <strong>and</strong> behavior. Observational techniques, whether roam<strong>in</strong>g or stationary, have<br />
the advantage <strong>of</strong> be<strong>in</strong>g unobtrusive <strong>and</strong> dem<strong>and</strong> no time on visitors (Schreuder, Tyre, &<br />
James, 1975; Hollenhorst et al., 1992; Schaick & van der Spek, 2008). However, these<br />
methodologies are time consum<strong>in</strong>g for staff <strong>and</strong> are subject to a variety <strong>of</strong> accuracy issues<br />
(Arnberger, Haider, & Br<strong>and</strong>enburg, 2005). Observational data are frequently dependent<br />
on the tra<strong>in</strong><strong>in</strong>g <strong>of</strong> a large team <strong>of</strong> technicians, <strong>and</strong> the accuracy <strong>of</strong> results relies on <strong>in</strong>terobserver<br />
reliability (Park, Mann<strong>in</strong>g, Marion, Lawson, & Jacobi, 2008). Observational<br />
studies provide visual <strong>in</strong>terpretations <strong>of</strong> visitor behavior <strong>and</strong> thus lack non-visual<br />
demographical data <strong>and</strong> detailed <strong>in</strong>formation related to visitor it<strong>in</strong>eraries or motivations<br />
(Shoval & Issacson, 2007).<br />
Survey techniques, however, can provide some <strong>of</strong> this lack<strong>in</strong>g <strong>in</strong>formation regard<strong>in</strong>g<br />
visitor use patterns, demographics, detailed it<strong>in</strong>eraries, <strong>and</strong> visitor motivations (James &<br />
Harper, 1965; Kovacs, 1970). Surveys are particularly useful <strong>in</strong> situations <strong>of</strong> dispersed<br />
visitor use where observational techniques may not be feasible (Cushwa & McG<strong>in</strong>nes,<br />
1963; James & Henley 1968; Hollenhorst et al., 1992). However, survey methodology<br />
dem<strong>and</strong>s a significant time <strong>in</strong>vestment from visitors <strong>and</strong> is susceptible to issues <strong>of</strong> accuracy<br />
(Hallo, Mann<strong>in</strong>g, Valliere, & Budruk, 2005). Often surveys exam<strong>in</strong><strong>in</strong>g visitor use patterns<br />
will require participants to recall characteristics <strong>of</strong> their visit, <strong>in</strong>troduc<strong>in</strong>g opportunities<br />
for <strong>in</strong>accuracies <strong>and</strong> biased results (Park et al., 2008). Visitor diaries may reduce issues <strong>of</strong><br />
recall bias but require an even higher dem<strong>and</strong> on visitor time than other survey techniques<br />
(Shoval & Isaacson, 2007). F<strong>in</strong>ally, the data entry <strong>and</strong> analysis result<strong>in</strong>g from survey-based<br />
studies can be extremely time consum<strong>in</strong>g <strong>and</strong> tedious (Hallo et al., 2005).<br />
As automated technology for count<strong>in</strong>g visitors became available <strong>in</strong> the late 1960s,<br />
<strong>in</strong>direct-count<strong>in</strong>g techniques became widely used <strong>in</strong> parks <strong>and</strong> protected areas to estimate<br />
visitor use levels. Indirect-count<strong>in</strong>g techniques <strong>in</strong>clude pressure plates, automatic trail<br />
counters us<strong>in</strong>g photoelectric technology, <strong>and</strong> electronic vehicle counters (James & Ripley,<br />
1963; Leonard et al., 1980; Hollenhorst et al., 1992). The use <strong>of</strong> automated counters is<br />
commonplace as they are relatively <strong>in</strong>expensive <strong>and</strong> easy to set up <strong>and</strong> ma<strong>in</strong>ta<strong>in</strong> (Watson<br />
et al., 2000). Recent technological advances <strong>in</strong> dual <strong>and</strong> array passive <strong>in</strong>frared technology<br />
have allowed automatic trail counters to collect <strong>in</strong>formation related to visitor use patterns,<br />
such as speed <strong>and</strong> direction, as well as use estimates. However, these counters are<br />
expensive <strong>and</strong> can be sensitive to temperature changes <strong>in</strong> the environment (Greene-Roesel,<br />
Diogenes, Ragl<strong>and</strong>, & L<strong>in</strong>dau, 2008). While the data from counters are clearly useful,<br />
even with technological advances, counters alone cannot provide specifics such as visitor<br />
demographics or specific visitor it<strong>in</strong>eraries (Arrowsmith & Chhetri, 2003; O’Connor,<br />
Zerger, & Itami, 2005). Visitor counter methodology is also subject to confound<strong>in</strong>g factors<br />
such as accuracy, calibration, <strong>and</strong> battery life (Pettebone, 2009).<br />
In order for managers to make the most <strong>in</strong>formed management actions, detailed,<br />
specific <strong>in</strong>formation about both visitor use <strong>in</strong>tensity <strong>and</strong> patterns is required. Moreover,
many contemporary issues <strong>in</strong> protected area management are more thoroughly understood<br />
with a detailed exam<strong>in</strong>ation <strong>of</strong> visitor use patterns. Although self-count<strong>in</strong>g, directcount<strong>in</strong>g,<br />
<strong>and</strong> <strong>in</strong>direct-count<strong>in</strong>g approaches can provide useful <strong>in</strong>formation to managers,<br />
research us<strong>in</strong>g global position<strong>in</strong>g system (<strong>GPS</strong>) technology has shown significant promise<br />
<strong>in</strong> provid<strong>in</strong>g more detailed data from which to exam<strong>in</strong>e visitor use patterns <strong>and</strong> <strong>in</strong>tensity,<br />
as well as visitor flows <strong>and</strong> densities (Hallo et al., 2005; O’Connor et al., 2000). Recent<br />
studies have used <strong>GPS</strong> track<strong>in</strong>g methodologies to collect <strong>in</strong>formation on the spatial extent,<br />
patterns, <strong>and</strong> <strong>in</strong>tensity <strong>of</strong> visitor use (Lai, Li, Chan, & Kwong, 2007; Ligtenburg, van<br />
Marwijk, Moelans, & Kuijpers, 2008). These studies <strong>in</strong>dicate that the <strong>in</strong>formation collected<br />
us<strong>in</strong>g <strong>GPS</strong>-based technology is more accurate, more detailed, <strong>and</strong> more robust than data<br />
collected from traditional methodologies (Hallo et al., 2005). Compared to observational<br />
<strong>and</strong> survey techniques, <strong>GPS</strong>-based methodologies require m<strong>in</strong>imal time dem<strong>and</strong>s on the<br />
visitor <strong>and</strong> less tra<strong>in</strong><strong>in</strong>g <strong>of</strong> staff for data collection (Hallo et al., 2005).<br />
<strong>GPS</strong>-based approaches can also provide data that has been heret<strong>of</strong>ore difficult to<br />
collect. First, <strong>in</strong> many protected area situations, visitors depart<strong>in</strong>g from designated trails<br />
<strong>and</strong> sites are <strong>of</strong> <strong>in</strong>creas<strong>in</strong>g management concern. Short <strong>of</strong> observational studies, no<br />
techniques are readily available to determ<strong>in</strong>e the spatial extent <strong>and</strong> duration <strong>of</strong> <strong>of</strong>f-trail<br />
use. <strong>GPS</strong>-based measurements provide results with enough detail to exam<strong>in</strong>e relatively<br />
small-scale visitor movements both on <strong>and</strong> <strong>of</strong>f-trail. Second, precise <strong>in</strong>formation about<br />
visitor use levels <strong>and</strong> patterns is helpful <strong>in</strong> develop<strong>in</strong>g <strong>and</strong> validat<strong>in</strong>g computer models that<br />
are becom<strong>in</strong>g a more common tool to identify visitor flows <strong>in</strong> parks <strong>and</strong> protected areas<br />
(e.g., Lawson, 2006). These data have traditionally been measured via survey methods,<br />
which have limited spatial <strong>and</strong> temporal precision due to recall bias <strong>and</strong> limits to visitors’<br />
knowledge <strong>of</strong> areas studied. <strong>GPS</strong> approaches can be used to collect model<strong>in</strong>g <strong>in</strong>puts <strong>and</strong><br />
have the potential to be more reliable <strong>and</strong> accurate data sources.<br />
This study reports on the development <strong>of</strong> <strong>GPS</strong>-based measurements <strong>of</strong> visitor<br />
use patterns through the exam<strong>in</strong>ation <strong>of</strong> three case studies that utilized <strong>GPS</strong> track<strong>in</strong>g<br />
methodologies; a visitor track<strong>in</strong>g study <strong>in</strong> Yosemite National Park, a day-use visitor<br />
track<strong>in</strong>g study <strong>in</strong> the Bear Lake Corridor <strong>of</strong> Rocky Mounta<strong>in</strong> National Park, <strong>and</strong> a w<strong>in</strong>ter<br />
recreation study <strong>in</strong> the Teton Range <strong>of</strong> Wyom<strong>in</strong>g. In the course <strong>of</strong> these <strong>in</strong>vestigations, we<br />
conducted extensive track<strong>in</strong>g <strong>of</strong> visitors via r<strong>and</strong>om sampl<strong>in</strong>g at trailheads <strong>in</strong> each study<br />
area <strong>and</strong> developed accuracy-check<strong>in</strong>g procedures to m<strong>in</strong>imize positional errors associated<br />
with the current, available <strong>GPS</strong> technology. Our goal <strong>in</strong> this paper is to illustrate the utility<br />
<strong>of</strong> <strong>GPS</strong> track<strong>in</strong>g as a means <strong>of</strong> ga<strong>in</strong><strong>in</strong>g further underst<strong>and</strong><strong>in</strong>g <strong>of</strong> several important protected<br />
area management issues.<br />
Method<br />
Study Areas<br />
Yosemite National Park. Yosemite National Park (YNP) is located <strong>in</strong> the Sierra<br />
Nevada range <strong>of</strong> California approximately 240 km east <strong>of</strong> the San Francisco Bay area. As<br />
one <strong>of</strong> the most visited parks <strong>in</strong> the United States, YNP receives over 3.5 million visitors<br />
annually (National Park Service, 2009). While the majority <strong>of</strong> park use is concentrated <strong>in</strong><br />
Yosemite Valley, the Tuolumne Meadows area <strong>of</strong> the park <strong>of</strong>fers visitors opportunities for<br />
day hik<strong>in</strong>g, backpack<strong>in</strong>g, rock climb<strong>in</strong>g, <strong>and</strong> fish<strong>in</strong>g <strong>in</strong> an alp<strong>in</strong>e environment. Trailheads<br />
<strong>in</strong> the Tuolumne Meadows area <strong>of</strong> the park provide access to vast areas <strong>of</strong> congressionally<br />
designated Wilderness <strong>and</strong> are accessed via Tioga Road, which is a National Scenic Byway.<br />
The National Park Service is conduct<strong>in</strong>g transportation <strong>and</strong> visitor use plann<strong>in</strong>g<br />
activities throughout the park, <strong>in</strong>clud<strong>in</strong>g collect<strong>in</strong>g <strong>in</strong>formation to underst<strong>and</strong> relationships<br />
among vehicle traffic volumes, visitor use levels <strong>in</strong> locations throughout the park, the<br />
45
46<br />
quality <strong>of</strong> visitors’ experiences, <strong>and</strong> park resource conditions. To support park plann<strong>in</strong>g,<br />
<strong>GPS</strong>-based track<strong>in</strong>g data were collected dur<strong>in</strong>g summer 2009 to measure visitor use<br />
patterns <strong>in</strong> Tuolumne. Specifically, research technicians were stationed at five trailheads<br />
along Tioga Road <strong>and</strong> recruited visitor groups to participate <strong>in</strong> the study (see Figure 1).<br />
In addition, <strong>in</strong>frared trail counters were <strong>in</strong>stalled at each <strong>of</strong> the five trailhead locations to<br />
measure daily trailhead visitation.<br />
Rocky Mounta<strong>in</strong> National Park. Rocky Mounta<strong>in</strong> National Park (RMNP) is located<br />
<strong>in</strong> north central Colorado, approximately 160 km from the Denver metropolitan area.<br />
RMNP receives over 3 million visitors per year (National Park Service, 2009). One <strong>of</strong> the<br />
most popular dest<strong>in</strong>ations with<strong>in</strong> RMNP is the Bear Lake Road Corridor, which provides<br />
access to many alp<strong>in</strong>e lakes <strong>and</strong> is a popular dest<strong>in</strong>ation for day users, backpackers, <strong>and</strong><br />
boulderers. In 1998, due to the high level <strong>of</strong> use <strong>in</strong> the Bear Lake Road Corridor, RMNP<br />
created a shuttle bus system to service the area (Gamble, Lawson, Monz, & Newman, 2007).<br />
Ridership on the shuttle bus to the Bear Lake Road Corridor has <strong>in</strong>creased substantially<br />
s<strong>in</strong>ce its <strong>in</strong>stallment, result<strong>in</strong>g <strong>in</strong> apparent <strong>in</strong>creased visitation to hik<strong>in</strong>g dest<strong>in</strong>ations <strong>in</strong> this<br />
corridor.<br />
<strong>GPS</strong>-based track<strong>in</strong>g methodologies were performed at three trailheads served by the<br />
shuttle bus <strong>in</strong> the Bear Lake Road Corridor; Bear Lake, Glacier Gorge, <strong>and</strong> Bierstadt Lake.<br />
Participants <strong>in</strong> the study were asked to complete an optional survey at the end <strong>of</strong> their hike<br />
that gathered <strong>in</strong>formation on crowd<strong>in</strong>g <strong>and</strong> visitor behavior <strong>in</strong> response to crowd<strong>in</strong>g.<br />
The Teton Range. Gr<strong>and</strong> Teton National Park (GTNP) receives 2.5 million visitors<br />
annually <strong>and</strong> is located <strong>in</strong> Northwestern Wyom<strong>in</strong>g bordered by Yellowstone National Park<br />
<strong>and</strong> two National Forest Service units. To the east <strong>and</strong> south <strong>of</strong> GTNP is the Bridger-Teton<br />
National Forest (BTNF) <strong>and</strong> to the west <strong>of</strong> GTNP is the Caribou-Targhee National Forest<br />
(CTNF).<br />
The Teton Range supports the smallest native bighorn sheep population <strong>in</strong> Wyom<strong>in</strong>g.<br />
Due to anthropogenic disturbance at lower elevations, the Teton Range bighorn sheep<br />
(Ovis canadensis) herd resides year-round at high elevation <strong>in</strong> the Teton Range (Kauffman<br />
& Courtemanch, 2009). Although nearly all <strong>of</strong> the bighorn sheep w<strong>in</strong>ter range falls<br />
with<strong>in</strong> designated Wilderness, where motorized recreation is prohibited, non-motorized<br />
recreation such as backcountry ski<strong>in</strong>g is popular. Participation <strong>in</strong> backcountry ski<strong>in</strong>g is<br />
rapidly <strong>in</strong>creas<strong>in</strong>g <strong>in</strong> the Teton Range <strong>and</strong> has the potential to <strong>in</strong>fluence bighorn sheep<br />
w<strong>in</strong>ter habitat use patterns (Kauffman & Courtemanch, 2009).<br />
Trail counter <strong>and</strong> <strong>GPS</strong>-based track<strong>in</strong>g data were collected at seven popular<br />
backcountry access po<strong>in</strong>ts <strong>in</strong> the Teton Range from January to April <strong>of</strong> the 2009 w<strong>in</strong>ter<br />
recreation season. These access po<strong>in</strong>ts <strong>in</strong>cluded three backcountry gates at Jackson Hole<br />
Mounta<strong>in</strong> Resort (where skiers enter BTNF <strong>and</strong> GNTP), Death Canyon trailhead <strong>in</strong> GTNP,<br />
Bradley-Taggart Lake trailhead <strong>in</strong> GTNP, <strong>and</strong> Teton Canyon <strong>and</strong> Gr<strong>and</strong> Targhee access<br />
po<strong>in</strong>ts to backcountry ski<strong>in</strong>g <strong>in</strong> CTNF. For the purpose <strong>of</strong> this paper, we will focus on the<br />
visitor track<strong>in</strong>g data collected at the Death Canyon <strong>and</strong> Bradley-Taggart Lake trailheads<br />
<strong>in</strong> GTNP (see Figure 2).<br />
<strong>GPS</strong>-<strong>Based</strong> Data Collection <strong>and</strong> Data Analysis<br />
In all three case studies, <strong>GPS</strong> data on visitor routes were recorded us<strong>in</strong>g recreation-<br />
grade Garm<strong>in</strong> <strong>GPS</strong> 60 units (Table 1). <strong>GPS</strong> 60 models have 28 hours <strong>of</strong> battery life,<br />
storage <strong>of</strong> 1MB, <strong>and</strong> are Wide Area Augmentation System (WAAS) enabled allow<strong>in</strong>g<br />
for signal corrections <strong>and</strong> improved real-time accuracy. Each Garm<strong>in</strong> <strong>GPS</strong> 60 model<br />
costs approximately $190, can store track logs up to 10,000 po<strong>in</strong>ts, <strong>and</strong> is cited by the<br />
manufacture as hav<strong>in</strong>g a positional accuracy <strong>of</strong> with<strong>in</strong> 15 meters 95% <strong>of</strong> the time (Garm<strong>in</strong><br />
Ltd., 2010). <strong>Visitors</strong> were r<strong>and</strong>omly <strong>in</strong>tercepted at each trailhead accord<strong>in</strong>g to a sampl<strong>in</strong>g
Table 1. <strong>GPS</strong> sampl<strong>in</strong>g characteristics by study site.<br />
Study Data Number Response Number <strong>GPS</strong><br />
Site Collection <strong>of</strong> <strong>GPS</strong> Rate <strong>of</strong> Visitor Positional<br />
Dates Units Tracks Error<br />
Used Collected Estimate (m)<br />
Yosemite July 2009 30 82% 199 N/A<br />
(10 days)<br />
Rocky Mounta<strong>in</strong> July - August 2008 20 80% 301 6.40<br />
(13 days)<br />
Gr<strong>and</strong> Teton January - April 2009 10 90% 108 3.67<br />
(27 days)<br />
protocol <strong>of</strong> r<strong>and</strong>om days stratified by time <strong>of</strong> day <strong>and</strong> weekend <strong>and</strong> weekdays. All visitors<br />
were asked to voluntarily participate <strong>and</strong> only day use visitors were sampled. One <strong>GPS</strong> unit<br />
was given to a volunteer <strong>in</strong> each group <strong>and</strong> the visitor was asked to carry the unit clipped<br />
on to the outside <strong>of</strong> their pack for the duration <strong>of</strong> their hike or ski. The <strong>GPS</strong> unit recorded<br />
location po<strong>in</strong>ts at 15-second <strong>in</strong>tervals <strong>in</strong> YNP <strong>and</strong> RMNP or 5-second <strong>in</strong>tervals <strong>in</strong> GTNP.<br />
A shorter time <strong>in</strong>terval was used <strong>in</strong> GTNP to account for skiers’ greater speed <strong>of</strong> travel<br />
as compared to the hikers tracked <strong>in</strong> YNP <strong>and</strong> RMNP. The units were returned at the end<br />
<strong>of</strong> the visitor’s trip to technicians positioned at all possible exit trailheads. In the case <strong>of</strong><br />
trailheads <strong>in</strong> the GTNP, the <strong>GPS</strong> units could also be returned to a labeled drop box found<br />
at all possible exit trailheads.<br />
No units were broken, lost, or stolen <strong>in</strong> YNP or RMNP for a return rate <strong>of</strong> 100%. In<br />
GTNP two <strong>of</strong> the 10 units were lost out <strong>of</strong> a total <strong>of</strong> 108 samples. Each study site varied<br />
<strong>in</strong> topography <strong>and</strong> vegetation cover, which can affect signal reception. However, overall<br />
the unique environmental conditions at each study site did not <strong>in</strong>terfere significantly with<br />
data collection. In YNP, <strong>GPS</strong> track<strong>in</strong>g occurred mostly <strong>in</strong> high-elevation meadows with<br />
little canopy cover. The conditions <strong>in</strong> YNP resulted <strong>in</strong> very few miss<strong>in</strong>g or corrupt tracks;<br />
199 usable tracks out <strong>of</strong> 212 total tracks collected. In RMNP, the Bear Lake Road Corridor<br />
is located <strong>in</strong> a subalp<strong>in</strong>e ecosystem with dense to sparse tree cover <strong>and</strong> large cirque walls<br />
at some <strong>of</strong> the subalp<strong>in</strong>e lakes. Due to the areas <strong>of</strong> dense tree cover <strong>and</strong> mounta<strong>in</strong>ous<br />
environment, 301 usable tracks were collected out <strong>of</strong> 350 total tracks <strong>in</strong> RMNP. In GTNP,<br />
the backcountry ski routes range <strong>in</strong> elevation from approximately 2,000 meters to 3,500<br />
meters. The majority <strong>of</strong> backcountry ski<strong>in</strong>g occurs on the east slope <strong>of</strong> the Teton Range,<br />
which is characterized by steep, open slopes <strong>and</strong> deep canyons. At low elevations, there<br />
is significant conifer cover <strong>in</strong> many areas, but the cover did not affect <strong>GPS</strong> unit satellite<br />
reception. Occasionally, <strong>GPS</strong> units missed locations while visitors were travell<strong>in</strong>g <strong>in</strong> very<br />
deep, narrow canyons. In GTNP, most problems that occurred with <strong>GPS</strong> reception was<br />
usually due to visitors mov<strong>in</strong>g <strong>GPS</strong> units to <strong>in</strong>side their backpacks dur<strong>in</strong>g their trip or<br />
problems with low batteries due to colder conditions.<br />
To account for any possible site-specific, positional error associated with recreation<br />
grade <strong>GPS</strong> measures, calibration techniques were employed <strong>in</strong> RMNP <strong>and</strong> the Teton Range.<br />
Calibration also allowed for a verification <strong>of</strong> the accuracies calculated <strong>and</strong> displayed by the<br />
Garm<strong>in</strong> <strong>GPS</strong> 60, as no <strong>in</strong>formation on this process is available from the manufacturer due<br />
to the proprietary nature <strong>of</strong> the s<strong>of</strong>tware. In RMNP, a sub-meter Trimble GeoXT <strong>GPS</strong> unit<br />
47
48<br />
was used to map a calibration track along the center <strong>of</strong> the designated trail at each sampled<br />
trailhead. Before each sampl<strong>in</strong>g day began, a r<strong>and</strong>omly selected Garm<strong>in</strong> <strong>GPS</strong> 60 unit was<br />
used to record the same calibration track. Upon completion <strong>of</strong> data collection, all <strong>of</strong> the<br />
calibration tracks from Garm<strong>in</strong> <strong>GPS</strong> 60 units were compared to the high accuracy tracks<br />
assessed by the Trimble <strong>in</strong> ArcGIS s<strong>of</strong>tware. A Euclidian distance measure (a straight l<strong>in</strong>e<br />
distance measure between two po<strong>in</strong>ts) was used to determ<strong>in</strong>e the average positional error<br />
for each Garm<strong>in</strong> 60 <strong>GPS</strong> track. These error measures were then averaged to determ<strong>in</strong>e the<br />
overall positional error estimate for the Garm<strong>in</strong> <strong>GPS</strong> 60 dur<strong>in</strong>g the sampl<strong>in</strong>g period (Table<br />
1).<br />
In the Teton Range, due to logistical differences from RMNP, a slightly different<br />
calibration technique was used. At each trailhead sampled, a high accuracy po<strong>in</strong>t was<br />
recorded us<strong>in</strong>g a Trimble GeoXT <strong>GPS</strong> unit. At the start <strong>of</strong> each sampl<strong>in</strong>g day, a Garm<strong>in</strong><br />
60 <strong>GPS</strong> unit was r<strong>and</strong>omly selected <strong>and</strong> 75 po<strong>in</strong>ts were recorded at the same location at<br />
which the calibration po<strong>in</strong>t was recorded. A Euclidean distance was then calculated from<br />
each po<strong>in</strong>t recorded by the Garm<strong>in</strong> 60 <strong>GPS</strong> units to the calibration po<strong>in</strong>t; these values were<br />
averaged to determ<strong>in</strong>e the overall positional error (Table 1). No calibration methodologies<br />
were performed <strong>in</strong> YNP due to our previous experience with the method <strong>and</strong> because the<br />
project goal was to exam<strong>in</strong>e visitor travel routes rather than small spatial scale visitor use<br />
issues.<br />
The dataset result<strong>in</strong>g from <strong>GPS</strong>-based track<strong>in</strong>g methodologies is a series <strong>of</strong> po<strong>in</strong>t<br />
data that can then be exam<strong>in</strong>ed <strong>in</strong> a geographic <strong>in</strong>formation system (GIS). When exam<strong>in</strong>ed<br />
spatially, these data <strong>in</strong>herently comb<strong>in</strong>e visitor use levels <strong>and</strong> certa<strong>in</strong> behavioral aspects,<br />
such as visitors paus<strong>in</strong>g or congregat<strong>in</strong>g <strong>in</strong> one location. The data also <strong>in</strong>cludes additional<br />
attributes such as time, speed, <strong>and</strong> elevation. Analysis <strong>of</strong> the po<strong>in</strong>t data yields <strong>in</strong>formation<br />
on visitor densities <strong>and</strong> temporal <strong>and</strong> spatial patterns. When comb<strong>in</strong>ed with visitor surveys<br />
<strong>and</strong> total use estimation techniques, these data provide an important <strong>and</strong> highly accurate<br />
picture <strong>of</strong> visitor use <strong>and</strong> behavior.<br />
Visitor Use Estimation Data Collection <strong>and</strong> Data Analysis<br />
<strong>GPS</strong>-based measures can be used to supplement traditional visitor use estimation<br />
techniques. As such, total visitor use was estimated at selected attraction sites <strong>and</strong> trailheads<br />
<strong>in</strong> YNP <strong>and</strong> RMNP us<strong>in</strong>g active <strong>in</strong>frared automated monitors. These devices are commonly<br />
used by researchers <strong>and</strong> park managers to monitor recreation use levels <strong>in</strong> protected natural<br />
areas because they are relatively easy to <strong>in</strong>stall <strong>and</strong> operate. (Bates, Wallace, & Vaske,<br />
2007; Gracia-Longares, 2005; Pettebone, Newman, Beaton, Stack, & Gibson, 2008; Vaske<br />
& Donnelly, 2007).<br />
Similar approaches were used <strong>in</strong> both parks. For example, <strong>in</strong> RMNP, TrailMaster1550<br />
active <strong>in</strong>frared monitors were deployed at seven locations <strong>in</strong> the Bear Lake area to estimate<br />
visitor use at attraction sites <strong>and</strong> trailheads. At each study site, 10 hours <strong>of</strong> direct observation<br />
data were collected to calibrate results specific to each device. <strong>Based</strong> on the calibrations<br />
for each device, seasonal, daily, <strong>and</strong> hourly visitor use was estimated for each study site.<br />
Estimates <strong>of</strong> visitor use were comb<strong>in</strong>ed with data collected via <strong>GPS</strong> to determ<strong>in</strong>e spatially<br />
detailed total seasonal use along the Bear Lake trail system (Pettebone, 2009).<br />
Results <strong>and</strong> Discussion<br />
Spatial Aspects <strong>of</strong> Visitor Use<br />
The <strong>GPS</strong> techniques employed <strong>in</strong> the three studies allow for the exam<strong>in</strong>ation <strong>of</strong> spatial<br />
patterns <strong>of</strong> visitor use at a much more detailed level than is possible through observational<br />
or survey techniques. At the relatively large spatial scale <strong>of</strong> a park or management unit,
<strong>GPS</strong>-based track<strong>in</strong>g data can be mapped to show the extent <strong>of</strong> use with<strong>in</strong> the system<br />
(Figures 1 <strong>and</strong> 2). For example, <strong>in</strong> YNP, visitors were tracked with<strong>in</strong> the Tuolumne<br />
Meadows trail system <strong>and</strong> mapp<strong>in</strong>g <strong>of</strong> these data <strong>in</strong>dicate the spatial extent <strong>of</strong> day use<br />
hikers orig<strong>in</strong>at<strong>in</strong>g from the Tuolumne visitor center trailheads (Figure 1). This <strong>in</strong>formation<br />
is relevant to managers <strong>in</strong> provid<strong>in</strong>g a thorough underst<strong>and</strong><strong>in</strong>g <strong>of</strong> the nature <strong>of</strong> hik<strong>in</strong>g<br />
use <strong>in</strong> this trail system. The detail provided by <strong>GPS</strong>-based techniques, even at a large<br />
spatial scale, is greater than that which could be provided by traditional techniques, which<br />
typically provide only total use on trail segments where they are located.<br />
Information on the overall spatial extent <strong>of</strong> visitation is also particularly valuable<br />
<strong>in</strong> situations where the visitor use patterns are not as predictable—where most <strong>of</strong> the<br />
visitation is occurr<strong>in</strong>g <strong>of</strong>f <strong>of</strong> a designated trail system. This is illustrated <strong>in</strong> the analysis <strong>of</strong><br />
data collected <strong>in</strong> the GTNP study <strong>of</strong> backcountry skiers (Figure 2). Data <strong>of</strong> this k<strong>in</strong>d are<br />
useful <strong>in</strong> identify<strong>in</strong>g locations, densities, <strong>and</strong> temporal patterns <strong>of</strong> <strong>of</strong>f-trail use <strong>and</strong>, <strong>in</strong> this<br />
case, are able to be directly compared with <strong>GPS</strong>-collared wildlife locations <strong>and</strong> habitat use<br />
patterns. <strong>GPS</strong> track<strong>in</strong>g data can be easily <strong>in</strong>corporated <strong>in</strong>to statistical models as a predictor<br />
variable <strong>of</strong> wildlife distribution.<br />
The spatial components <strong>of</strong> the backcountry skier tracks (distance <strong>of</strong> backcountry travel<br />
routes, <strong>of</strong> vary<strong>in</strong>g densities, to <strong>GPS</strong>-collared bighorn sheep locations) can be <strong>in</strong>cluded,<br />
along with several additional predictor variables, <strong>in</strong>to a resource selection function (RSF)<br />
model<strong>in</strong>g procedure for w<strong>in</strong>ter habitat use (Sawyer et al., 2006). In GTNP, visitor use<br />
data was collected concurrently with <strong>GPS</strong>-collared bighorn sheep data. In future work,<br />
the detailed location data from both bighorn sheep <strong>and</strong> backcountry visitors will allow<br />
for the determ<strong>in</strong>ation <strong>of</strong> how various spatial <strong>and</strong> temporal patterns <strong>of</strong> backcountry ski<strong>in</strong>g<br />
affect bighorn sheep w<strong>in</strong>ter habitat use. W<strong>in</strong>ter backcountry recreation will be <strong>in</strong>cluded as<br />
a predictor variable <strong>in</strong> the RSF (as distance to backcountry use areas <strong>of</strong> vary<strong>in</strong>g densities<br />
<strong>of</strong> use) to determ<strong>in</strong>e if bighorn sheep avoid backcountry recreation routes, even if these<br />
areas have been identified by the RSF as suitable w<strong>in</strong>ter habitat. Specifically, the RSF<br />
can determ<strong>in</strong>e if a threshold <strong>of</strong> visitor use at which bighorn sheep ab<strong>and</strong>on suitable w<strong>in</strong>ter<br />
habitat areas exists. These model<strong>in</strong>g procedures are especially useful to wildlife managers<br />
to identify areas <strong>of</strong> potential <strong>in</strong>teraction between recreationists <strong>and</strong> wildlife.<br />
The detail associated with <strong>GPS</strong> track<strong>in</strong>g data, where positional errors can be estimated,<br />
also allows for analysis at smaller spatial scales such as dest<strong>in</strong>ation po<strong>in</strong>ts. In these cases,<br />
exam<strong>in</strong>ation <strong>of</strong> particular aspects <strong>of</strong> visitor behavior, <strong>in</strong>clud<strong>in</strong>g wait<strong>in</strong>g times at the<br />
dest<strong>in</strong>ation po<strong>in</strong>t <strong>and</strong> exam<strong>in</strong>ation <strong>of</strong> <strong>of</strong>f-trail use may be particularly relevant to manag<strong>in</strong>g<br />
for visitor experience <strong>and</strong> resource protection. In the case <strong>of</strong> RMNP, the error calculated<br />
from the calibration procedures was used to create a 12.8m buffer around designated trails.<br />
All visitor po<strong>in</strong>ts with<strong>in</strong> the buffer were considered to be “on trail.” Specific po<strong>in</strong>ts <strong>of</strong><br />
<strong>in</strong>terest can then be exam<strong>in</strong>ed more closely to explore the details <strong>of</strong> visitor use <strong>in</strong> these<br />
dispersed-use sett<strong>in</strong>gs. For example, <strong>in</strong> RMNP, <strong>of</strong>f-trail use was exam<strong>in</strong>ed at Alberta Falls<br />
(Figure 3). Off-trail use can be given further context when comb<strong>in</strong>ed with <strong>GPS</strong>-recorded<br />
visitor impacts such as visitor created trails <strong>and</strong> sites. The comb<strong>in</strong>ation <strong>of</strong> visitor-impact<br />
data <strong>and</strong> <strong>GPS</strong> track<strong>in</strong>g data can highlight how visitors are access<strong>in</strong>g <strong>of</strong>f trail areas <strong>and</strong> how<br />
visitors are us<strong>in</strong>g areas that have already experienced resource change.<br />
Underst<strong>and</strong><strong>in</strong>g the typical spatial patterns <strong>of</strong> visitor use can <strong>in</strong>form decisions related<br />
to designated trail management. Also, by underst<strong>and</strong><strong>in</strong>g spatial patterns <strong>of</strong> <strong>of</strong>f-trail use,<br />
managers can evaluate the effectiveness <strong>of</strong> current management techniques to discourage<br />
<strong>of</strong>f-trail use. The level <strong>of</strong> accuracy <strong>and</strong> detail provided by <strong>GPS</strong>-based measures, at both<br />
the large <strong>and</strong> small spatial scale, allows managers to identify <strong>and</strong> focus on areas <strong>of</strong> most<br />
concern for resource change <strong>and</strong> dim<strong>in</strong>ished visitor experience. Traditional techniques,<br />
such as observational studies <strong>and</strong> survey methodologies may not provide the same level <strong>of</strong><br />
detail or accuracy, especially <strong>in</strong> situations <strong>of</strong> dispersed visitor use.<br />
49
50<br />
Figure 1. Extent <strong>of</strong> hik<strong>in</strong>g use orig<strong>in</strong>at<strong>in</strong>g from trailheads <strong>in</strong> Tuolumne Meadows trail<br />
system <strong>in</strong> YNP. Stars mark trailheads where sampl<strong>in</strong>g occurred.
Figure 2. Extent <strong>of</strong> backcountry ski use from trailheads <strong>in</strong> GTNP. Stars make trailheads<br />
where sampl<strong>in</strong>g occurred.<br />
51
52<br />
Figure 3. <strong>GPS</strong> track<strong>in</strong>g <strong>of</strong> <strong>of</strong>f-trail travel by visitors at Alberta Falls <strong>in</strong> RMNP.<br />
Density Analysis<br />
Visitor po<strong>in</strong>t data can be used to calculate a density <strong>of</strong> visitor track<strong>in</strong>g po<strong>in</strong>ts. High<br />
visitor densities can be caused by overall high levels <strong>of</strong> use or by a few visitors stay<strong>in</strong>g <strong>in</strong><br />
an area for an extended period <strong>of</strong> time. Visitor use density can be exam<strong>in</strong>ed at a systemwide<br />
level to highlight areas <strong>of</strong> high use that can then be analyzed at a more detailed<br />
level (Figure 4). Once sites for further <strong>in</strong>vestigation are identified, a density analysis can<br />
be completed for popular hik<strong>in</strong>g dest<strong>in</strong>ations such as Dog Lake <strong>in</strong> YNP (Figure 5). A<br />
density analysis <strong>of</strong> the visitors tracked to Dog Lake show that the highest densities <strong>of</strong><br />
po<strong>in</strong>ts are found where the designated trail first connects to the lake <strong>and</strong> at various spots<br />
along the edge <strong>of</strong> Dog Lake. The density analysis also shows that there is concentrated<br />
use at an area <strong>of</strong>f <strong>of</strong> the designated trail on the northwest shore <strong>of</strong> Dog Lake. Managers<br />
can use density analyses to highlight areas that may be at risk for changes to resource<br />
conditions or dim<strong>in</strong>ished visitor experience from crowd<strong>in</strong>g or conflict. Further analysis<br />
can be performed us<strong>in</strong>g the same <strong>GPS</strong>-based track<strong>in</strong>g data to exam<strong>in</strong>e temporal <strong>and</strong> spatial<br />
patterns at these areas to better underst<strong>and</strong> visitor behavior at these popular dest<strong>in</strong>ations.<br />
Temporal Aspects <strong>of</strong> Visitor Use<br />
<strong>GPS</strong> units record visitor location at a selected time <strong>in</strong>terval. As such, the track<strong>in</strong>g<br />
data can be analyzed to better underst<strong>and</strong> the temporal patterns <strong>of</strong> visitor use <strong>in</strong> an area. At<br />
the large scale, characteristics for an entire visit can be determ<strong>in</strong>ed. For example, visitortrack<strong>in</strong>g<br />
data were used to determ<strong>in</strong>e the average time visitors spent <strong>in</strong> each study area<br />
(Table 2). <strong>Visitors</strong> spent the most time <strong>in</strong> the GTNP system, averag<strong>in</strong>g 6 hours <strong>and</strong> 28<br />
m<strong>in</strong>utes. In YNP, the visitors tracked spent an average <strong>of</strong> 5 hours <strong>and</strong> 20 m<strong>in</strong>utes <strong>in</strong> the<br />
Tuolumne Meadows trail system. While <strong>in</strong> RMNP, visitors spent an average <strong>of</strong> 2 hours <strong>and</strong><br />
30 m<strong>in</strong>utes <strong>in</strong> the Bear Lake Road Corridor trail system. An exam<strong>in</strong>ation <strong>of</strong> the temporal
Figure 4. Density analysis <strong>of</strong> visitor use po<strong>in</strong>ts <strong>in</strong> the Tuolumne Meadows trail system<br />
<strong>in</strong> YNP.<br />
Table 2. Analysis <strong>of</strong> temporal patterns <strong>of</strong> visitor use.<br />
Location Average Total Time Max Time M<strong>in</strong> Time St<strong>and</strong>ard<br />
<strong>in</strong> Area <strong>in</strong> Area <strong>in</strong> Area Deviation<br />
(h:mm) (h:mm) (h:mm)<br />
Tuolumne Meadows<br />
(Yosemite) 5:20 11:08 0:29 2.33<br />
Bear Lake<br />
(Rocky Mounta<strong>in</strong>) 2:30 8:00 0:04 0.07<br />
Gr<strong>and</strong> Teton 6:28 13:52 0:32 2.51<br />
53
54<br />
Figure 5. Density analysis <strong>of</strong> visitor use po<strong>in</strong>ts at Dog Lake <strong>in</strong> Tuolumne Meadows, YNP.<br />
component <strong>of</strong> visitor use at a large scale can <strong>in</strong>form managers about length <strong>of</strong> stay <strong>in</strong> an<br />
area or on a trail system.<br />
Large-scale temporal data can also be <strong>in</strong>tegrated with other studies. For example,<br />
the temporal aspects <strong>of</strong> visitor hikes collected <strong>in</strong> RMNP were used <strong>in</strong> comb<strong>in</strong>ation<br />
with a transportation noise model <strong>of</strong> the park to underst<strong>and</strong> visitors’ experiences <strong>of</strong> the<br />
park’s soundscape. Specifically, the <strong>GPS</strong> visitor data <strong>and</strong> maps <strong>of</strong> transportation-related<br />
noise levels were analyzed spatially. GIS spatial statistics were applied to these data to<br />
estimate the amount <strong>of</strong> time <strong>and</strong> distance visitors must hike from trailheads away from the<br />
transportation corridor to experience natural sounds. Estimates were also generated for the<br />
proportion <strong>of</strong> visitors who experience at least 15 m<strong>in</strong>utes <strong>of</strong> natural sounds <strong>and</strong> quiet. At<br />
the time <strong>of</strong> the study, the National Park Service had not def<strong>in</strong>ed a threshold for road noise,<br />
beyond which natural sounds <strong>and</strong> quiet are compromised. Thus, a range <strong>of</strong> example road<br />
noise thresholds were evaluated to estimate the proportion <strong>of</strong> visitors who experience at<br />
least 15 m<strong>in</strong>utes <strong>of</strong> natural sounds <strong>and</strong> quiet. The example road noise thresholds used <strong>in</strong> the<br />
analysis <strong>in</strong>clude ≤25 dBA (nighttime ambient natural sound level measured <strong>in</strong> the study),<br />
≤30 dBA <strong>and</strong> ≤35 dBA (daytime ambient natural sound levels), <strong>and</strong> ≤65 dBA (the level at<br />
which noise <strong>in</strong>terferes with conversational tones).<br />
Temporal patterns <strong>of</strong> use can also be exam<strong>in</strong>ed at a small scale such as at specific<br />
sites <strong>of</strong> <strong>in</strong>terest. In RMNP, visitors frequently travel <strong>of</strong>f-trail <strong>in</strong> an area <strong>of</strong> dispersed<br />
use adjacent to Alberta Falls (Figure 2). By us<strong>in</strong>g the positional error calculated from<br />
calibration techniques to elim<strong>in</strong>ate all on trail use from the analysis <strong>and</strong> us<strong>in</strong>g the temporal
data collected from the <strong>GPS</strong> units, it was determ<strong>in</strong>ed that 46% <strong>of</strong> visitors that were tracked<br />
travel<strong>in</strong>g along the Glacier Gorge trail left the designated trail adjacent to Alberta Falls <strong>and</strong><br />
spent, on average, 17 m<strong>in</strong>utes <strong>of</strong>f trail. Visitor use can also be analyzed by the distance<br />
traveled from the designated trail, for example at Alberta Falls, the area <strong>of</strong> dispersed<br />
use was split <strong>in</strong>to two <strong>of</strong>f-trail zones; one near the designated trail <strong>and</strong> one far from the<br />
designated trail. The data result<strong>in</strong>g from this analysis can then be <strong>in</strong>corporated <strong>in</strong> model<strong>in</strong>g<br />
efforts to exam<strong>in</strong>e dispersed use with<strong>in</strong> <strong>of</strong>f trail areas.<br />
Integration with Visitor Use Estimation <strong>and</strong> Survey Techniques<br />
Estimates <strong>of</strong> use level are important for managers <strong>in</strong> terms <strong>of</strong> <strong>in</strong>form<strong>in</strong>g issues such<br />
as the potential for resource change <strong>and</strong> experiential impacts such as crowd<strong>in</strong>g. Automatic<br />
counter data can be comb<strong>in</strong>ed with <strong>GPS</strong>-based measurements to ga<strong>in</strong> a better underst<strong>and</strong><strong>in</strong>g<br />
<strong>of</strong> visitor use for popular dest<strong>in</strong>ations. For example, <strong>in</strong> RMNP, automatic visitor counters<br />
were placed on the trailheads that were sampled us<strong>in</strong>g <strong>GPS</strong>-based methodologies. An<br />
automatic visitor counter was placed at the Bear Lake trailhead, which provides access<br />
to the Emerald Lake trail <strong>and</strong> three alp<strong>in</strong>e lakes. From the <strong>GPS</strong>-based measures recorded<br />
<strong>and</strong> the visitor counters, it can be determ<strong>in</strong>ed that 28% <strong>of</strong> visitors traveled to a dest<strong>in</strong>ation<br />
along the Emerald Lake trail. The average seasonal use for the Bear Lake trailhead, as<br />
determ<strong>in</strong>ed by the automated visitor counters can then be comb<strong>in</strong>ed with the <strong>GPS</strong>-based<br />
results <strong>of</strong> travel to dest<strong>in</strong>ations along the Emerald Lake trail to estimate overall seasonal<br />
use patterns along the designated trail.<br />
Strategic placement <strong>of</strong> automatic visitor counters can also be comb<strong>in</strong>ed with <strong>GPS</strong>based<br />
measures to determ<strong>in</strong>e use levels at specific areas <strong>of</strong> visitor <strong>in</strong>terest or <strong>of</strong>f-trail<br />
dest<strong>in</strong>ations. <strong>GPS</strong>-based measurements provide an additional layer <strong>of</strong> detail to traditional<br />
visitor use-estimation techniques, which can only provide an estimate <strong>of</strong> use level at the<br />
specific location <strong>of</strong> the counter mechanism. <strong>GPS</strong>-track<strong>in</strong>g methodologies can provide<br />
<strong>in</strong>formation regard<strong>in</strong>g exactly where visitors are go<strong>in</strong>g <strong>and</strong> the routes that visitors are us<strong>in</strong>g<br />
to get to their dest<strong>in</strong>ations.<br />
<strong>GPS</strong>-based track<strong>in</strong>g data can effectively provide spatial <strong>and</strong> temporal data <strong>and</strong> be used<br />
to complement automated visitor counters <strong>in</strong> use estimation, but the result<strong>in</strong>g dataset does<br />
not conta<strong>in</strong> any <strong>in</strong>formation about visitor characteristics. However, the visitor-track<strong>in</strong>g<br />
methodologies discussed here can be comb<strong>in</strong>ed with traditional survey techniques. In<br />
RMNP, visitors who participated <strong>in</strong> the <strong>GPS</strong>-based visitor track<strong>in</strong>g study were asked to<br />
complete a short survey follow<strong>in</strong>g their hike. The surveys were coded so that <strong>in</strong>dividual<br />
<strong>GPS</strong> tracks could be l<strong>in</strong>ked to the visitor’s survey (Table 3). For example, Euclidean<br />
distance calculations were computed for <strong>in</strong>dividual visitors <strong>and</strong> the average distance that<br />
each <strong>in</strong>dividual traveled <strong>of</strong>f <strong>of</strong> the designated trail can be calculated (Table 3). <strong>Visitors</strong> were<br />
asked whether or not they hiked <strong>of</strong>f-trail to avoid feel<strong>in</strong>g crowded with results show<strong>in</strong>g<br />
that some visitors who answered ‘no’ to this question were recorded as travel<strong>in</strong>g <strong>of</strong>f-trail.<br />
The comb<strong>in</strong>ation <strong>of</strong> survey <strong>and</strong> <strong>GPS</strong>-based techniques allows for a comparison between<br />
reported behavior by visitors <strong>and</strong> actual, measured behaviors.<br />
It is possible that some visitors hiked <strong>of</strong>f-trail for reasons other than feel<strong>in</strong>g crowded<br />
<strong>and</strong> thus answered ‘no’ to this question on the survey; however, the comb<strong>in</strong>ation <strong>of</strong> <strong>GPS</strong>based<br />
methodology with survey techniques provides a means <strong>of</strong> comb<strong>in</strong><strong>in</strong>g <strong>in</strong>dividual<br />
visitor behavior with visitor characteristics. Survey techniques allow for the stratification<br />
<strong>of</strong> <strong>GPS</strong>-based track<strong>in</strong>g data by visitor characteristics, such as knowledge <strong>of</strong> Leave No<br />
Trace practices or activity type, <strong>and</strong> for comparisons <strong>of</strong> visitor behavior across groups. The<br />
comb<strong>in</strong>ation <strong>of</strong> survey results with <strong>GPS</strong>-based methodology allows managers to exam<strong>in</strong>e<br />
visitor use patterns stratified by user group. This <strong>in</strong>formation could further underst<strong>and</strong><strong>in</strong>g<br />
<strong>of</strong> the needs <strong>and</strong> behaviors <strong>of</strong> different groups <strong>and</strong> how to target certa<strong>in</strong> user groups based<br />
on behavior.<br />
55
56<br />
Table 3. Survey results from r<strong>and</strong>omly selected visitors at the Glacier Gorge<br />
Trailhead at RMNP.<br />
Visitor ID Distance Visitor Traveled Off-Trail 1 Hike Off-Trail To<br />
Avoid Feel<strong>in</strong>g Crowded?<br />
M<strong>in</strong> (m) Max (m) Mean (m)<br />
126 0 2.73 0.14 No<br />
148 0 28.07 4.09 No<br />
275 0 8.18 0.69 No<br />
309 0 2.73 0.14 No<br />
55 0 50.12 4.96 Yes<br />
128 0 8.18 1.12 Yes<br />
146 0 17.46 2.08 Yes<br />
295 0 53.70 3.39 Yes<br />
1 Euclidian distance calculated to trail buffer<br />
Conclusion<br />
<strong>GPS</strong>-based track<strong>in</strong>g methodologies provide accurate <strong>and</strong> detailed datasets that <strong>of</strong>fer<br />
<strong>in</strong>formation that cannot be practically collected us<strong>in</strong>g traditional methods for estimat<strong>in</strong>g<br />
visitor use. <strong>GPS</strong> methodologies are an established means <strong>of</strong> gather<strong>in</strong>g spatial <strong>and</strong> behavioral<br />
<strong>in</strong>formation <strong>in</strong> the wildlife sciences (Bowmen, Kochanny, Demarais, & Leopold, 2000;<br />
Burger & Shaffer, 2008; Rutter, 2007) <strong>and</strong> provide very valuable <strong>in</strong>formation to wildlife<br />
managers. This research shows that <strong>GPS</strong> methods can be employed successfully to further<br />
underst<strong>and</strong> visitor use <strong>in</strong> park <strong>and</strong> protected area management.<br />
<strong>GPS</strong> approaches do present some challenges <strong>and</strong> limitations. Logistically, an effective<br />
methodology needs to be devised to adm<strong>in</strong>ister <strong>and</strong> retrieve the <strong>GPS</strong> units used (Schaick<br />
& van der Spek, 2008). In complicated trail systems, to ensure a high return rate <strong>of</strong> units,<br />
it is important to have technicians or drop boxes located at all possible exit locations. Also,<br />
each unit should be labeled with <strong>in</strong>structions regard<strong>in</strong>g how to return the unit <strong>in</strong> the event<br />
that the visitor cannot f<strong>in</strong>d a technician or drop box. The battery life <strong>and</strong> data storage <strong>of</strong> the<br />
units employed <strong>in</strong> this study is a limitation if <strong>GPS</strong>-based methodology is to be utilized <strong>in</strong><br />
a backcountry, multi-day trip sett<strong>in</strong>g, but technology is be<strong>in</strong>g developed that will work <strong>in</strong><br />
this situation as well (Rupf, Koechli, Haider, Skov-Petersen, & Probstl, 2010).<br />
The issue <strong>of</strong> positional error <strong>and</strong> satellite reception can become a problem <strong>in</strong> certa<strong>in</strong><br />
environmental sett<strong>in</strong>gs, <strong>and</strong> therefore calibration techniques can be helpful to quantify the<br />
site-specific error associated with the track<strong>in</strong>g data. Recent <strong>GPS</strong> technological advances<br />
have resulted <strong>in</strong> more sensitive, accurate h<strong>and</strong>held units such as the Garm<strong>in</strong> <strong>GPS</strong> 60Cx <strong>and</strong><br />
<strong>GPS</strong> 60 CSx. However, the use <strong>of</strong> these updated units <strong>in</strong> <strong>GPS</strong>-based studies may be less<br />
feasible as they are more expensive than less sophisticated units <strong>and</strong> have a shorter battery<br />
life (Garm<strong>in</strong> Ltd., 2010). Regardless, as <strong>GPS</strong> technology cont<strong>in</strong>ues to improve, calibration<br />
<strong>and</strong> accuracy issues may become less <strong>of</strong> a concern.<br />
Data process<strong>in</strong>g <strong>and</strong> analysis are also significant considerations, as the approaches<br />
illustrated require some knowledge <strong>of</strong> GIS to edit <strong>and</strong> analyze the data collected. Recently<br />
developed extensions for ArcMap (a GIS s<strong>of</strong>tware program) allow for quick <strong>and</strong> easy<br />
importation <strong>of</strong> large numbers <strong>of</strong> <strong>GPS</strong> tracks <strong>in</strong>to a GIS environment. Once <strong>in</strong> a GIS<br />
environment, a basic knowledge <strong>of</strong> ArcGIS is required for the data-clean<strong>in</strong>g process as<br />
corrupt files are easily identified <strong>and</strong> many <strong>of</strong> the analysis presented here (po<strong>in</strong>t density,
straight l<strong>in</strong>e distance calculations, time analyses) can be completed us<strong>in</strong>g available tools<br />
<strong>in</strong> ArcMap (Schaick & van der Spek, 2008). An overrid<strong>in</strong>g concern is that the approach<br />
illustrated here, particularly the density analysis, is a result <strong>of</strong> both visitor use levels<br />
<strong>and</strong> visitor behavior—high-po<strong>in</strong>t densities can be the result <strong>of</strong> either high total use or<br />
visitors paus<strong>in</strong>g <strong>and</strong> congregat<strong>in</strong>g while the <strong>GPS</strong> is collect<strong>in</strong>g data. These po<strong>in</strong>t densities<br />
were applicable for the larger social <strong>and</strong> ecological projects for which these methods<br />
were developed, but other <strong>in</strong>vestigators may be <strong>in</strong>terested <strong>in</strong> assess<strong>in</strong>g use <strong>and</strong> behavior<br />
<strong>in</strong>dependently. In this case, some additional methodological development is needed.<br />
Despite these limitations, <strong>GPS</strong>-based methodologies have clear advantages <strong>and</strong><br />
applications. The time dem<strong>and</strong> on visitors is m<strong>in</strong>imal <strong>and</strong> less tra<strong>in</strong><strong>in</strong>g is required for<br />
staff to conduct a <strong>GPS</strong>-based track<strong>in</strong>g study compared to other techniques. In the case<br />
studies presented, there were low refusal rates for participation that resulted <strong>in</strong> very ample<br />
datasets be<strong>in</strong>g collected <strong>in</strong> a relatively short period <strong>of</strong> time. <strong>GPS</strong> technology allows for<br />
the exam<strong>in</strong>ation <strong>of</strong> subtle visitor movements such as <strong>of</strong>f-trail use that would be difficult<br />
or even impossible to measure accurately with traditional techniques. <strong>GPS</strong>-based track<strong>in</strong>g<br />
datasets conta<strong>in</strong> valuable descriptive data such as time, speed, direction, <strong>and</strong> elevation <strong>and</strong><br />
the method produces potentially less biased datasets compared to observational studies,<br />
diaries, <strong>and</strong> survey techniques. The case studies presented demonstrate just a few examples<br />
<strong>of</strong> analysis that can be conducted us<strong>in</strong>g <strong>GPS</strong>-based tracks. Other possible data analyses<br />
techniques <strong>in</strong>clude time series analysis, three-dimensional displays <strong>of</strong> density, analysis <strong>of</strong><br />
visitor speed, <strong>and</strong> stratification <strong>of</strong> results by activity type characteristics (Schaick & van<br />
der Spek, 2008).<br />
As demonstrated through the case studies exam<strong>in</strong>ed <strong>in</strong> this paper, the methods<br />
presented can be implemented <strong>in</strong> a range <strong>of</strong> sett<strong>in</strong>gs to address a variety <strong>of</strong> managerial issues<br />
or problems. There is potential for the <strong>in</strong>formation provided by <strong>GPS</strong>-based techniques to<br />
lead to more <strong>in</strong>formed management decisions due to the high levels <strong>of</strong> accuracy <strong>and</strong> detail<br />
that cannot be practically collected us<strong>in</strong>g traditional methodologies. Future implementation<br />
<strong>and</strong> development <strong>of</strong> the techniques presented here can serve to exp<strong>and</strong> the utility <strong>and</strong><br />
worth<strong>in</strong>ess <strong>of</strong> the <strong>GPS</strong>-based measures as an emerg<strong>in</strong>g technique to underst<strong>and</strong> visitor use<br />
<strong>in</strong> parks <strong>and</strong> protected areas.<br />
References<br />
Arnberger, A., Haider, W., & Br<strong>and</strong>enburg, C. (2005). Evaluation visitor-monitor<strong>in</strong>g<br />
techniques: A comparison <strong>of</strong> count<strong>in</strong>g <strong>and</strong> video observation data. Environmental<br />
Management, 36(2), 317-327.<br />
Arrowsmith, C., & Chhetri, P. (2003). Port Campbell National Park: Patterns <strong>of</strong> Use. A<br />
report for the development <strong>of</strong> a visitor typology as <strong>in</strong>put to a generic model <strong>of</strong> visitor<br />
movements <strong>and</strong> patterns <strong>of</strong> use. Melbourne.<br />
Bates, M., Wallace, G., & Vaske, J. J. (2007). Estimat<strong>in</strong>g visitor use <strong>in</strong> Rocky Mounta<strong>in</strong><br />
National Park. (HDNRU Report No. 74). Report for Rocky Mounta<strong>in</strong> National Park.<br />
Fort Coll<strong>in</strong>s: Colorado State University, Human Dimensions <strong>in</strong> Natural Resources<br />
Unit.<br />
Bowman, J. L., Kochanny, C.O., Demarais, S., & Leopold, B. D. (2000). Evaluation <strong>of</strong> a<br />
<strong>GPS</strong> collar for white-tailed deer. Wildlife Society Bullet<strong>in</strong> 28, 141–145.<br />
Burger, A. E., & Shaffer, S. A. (2008). Application <strong>of</strong> track<strong>in</strong>g <strong>and</strong> data-logg<strong>in</strong>g technology<br />
<strong>in</strong> research <strong>and</strong> conservation <strong>of</strong> seabirds. The Auk, 125(2), 253-264.<br />
Cordell, H. K., Betz, C. J., & Green, G. T. (2008). Nature-based outdoor recreation trends<br />
<strong>and</strong> wilderness. International Journal <strong>of</strong> Wilderness, 14(2), 7–13.<br />
57
58<br />
Cushwa, C.T., & McG<strong>in</strong>nes, B.S. (1963). Sampl<strong>in</strong>g procedures <strong>and</strong> estimates <strong>of</strong> recreation<br />
use on 100 square miles <strong>of</strong> the George Wash<strong>in</strong>gton National Forest. National<br />
American Wildlife & Natural Resources Conference 28, 457-465.<br />
De Lacy, T., & Whitmore, M. (2006). Tourism <strong>and</strong> recreation. In: Lockwood, M., Worboys,<br />
G. L., & Kothari, A. (Eds.), Manag<strong>in</strong>g protected areas: A global guide. Earthscan,<br />
London, pp. 497-527.<br />
Echelberger, H. E., Leonard, R. E., & Plumley, H. J. (1981). Validation <strong>of</strong> trailside<br />
registration boxes. Journal <strong>of</strong> Soil <strong>and</strong> Water Conservation, 36(1), 53-54.<br />
Gamble, L., Lawson, S., Monz, C. A., & Newman, P. L. (2007). Model<strong>in</strong>g the effects<br />
<strong>of</strong> alternative transportation on resource protection <strong>and</strong> visitor experience <strong>in</strong> Rocky<br />
Mounta<strong>in</strong> National Park. Alternative Transportation <strong>in</strong> the <strong>Parks</strong> <strong>and</strong> Public L<strong>and</strong>s<br />
Program. Project Proposal. 17pp.<br />
Garm<strong>in</strong> Ltd (2010). <strong>GPS</strong> 60 Product Specifications. Available from: http://www.garm<strong>in</strong>.<br />
com/garm<strong>in</strong>/cms/site/us/onthetrail.<br />
Greene-Roesel, R., Diogenes, M. C., Ragl<strong>and</strong>, D. R., & L<strong>in</strong>dau, L. A. (2008). Effectiveness<br />
<strong>of</strong> a Commercially Available Automated Pedestrian Count<strong>in</strong>g Device <strong>in</strong> Urban<br />
Environments: Comparison with Manual Counts. In proceed<strong>in</strong>gs <strong>of</strong> the 2008<br />
Transportation Research Board 87th Annual Meet<strong>in</strong>g, Wash<strong>in</strong>gton D.C., USA.<br />
Hallo, J. C., Mann<strong>in</strong>g, R. E., Valliere, W., & Budruk, M. (2005). A case study comparison<br />
<strong>of</strong> visitor self-reported <strong>and</strong> <strong>GPS</strong> recorded travel routes. In proceed<strong>in</strong>gs <strong>of</strong> the 2004<br />
Northeastern Recreation Research Symposium, (Gen. Tech. Rep. NE-326), U.S.<br />
Department <strong>of</strong> Agriculture, Forest Service, Northeastern Research Station, Newtown<br />
Square, PA.<br />
Hammitt, W. E., & D. N. Cole. (1998). Wildl<strong>and</strong> recreation: Ecology <strong>and</strong> management.<br />
New York: John Wiley & Sons.<br />
Hendee, J. C., & Lucas, R. C. (1973). M<strong>and</strong>atory wilderness permits: a necessary<br />
management tool. Journal <strong>of</strong> Forestry, 71, 206-209.<br />
Hollenhorst, S. J., Whisman, S. A., & Ewert, A. W. (1992). Monitor<strong>in</strong>g Visitor Use <strong>in</strong><br />
<strong>Backcountry</strong>. In: Pacific Southwest Forest Research Station, General Technical<br />
Report.<br />
James, G. A., & Ripley, T. H. (1963). Instructions for us<strong>in</strong>g traffic counters to estimate<br />
recreation visits <strong>and</strong> use. Research Paper SE-3. Asheville, NC: U.S. Department <strong>of</strong><br />
Agriculture, Forest Service, Southeastern Forest Experiment Station. 12 p.<br />
James, G. A., & Harper, R. A. (1965). Recreation use <strong>of</strong> the Ocala National Forest <strong>in</strong><br />
Florida. USDA Forest Service Research Paper SE-31, 28pp.<br />
James, G. A., & Henley, R. K. (1968). Sampl<strong>in</strong>g procedures for estimat<strong>in</strong>g mass <strong>and</strong><br />
dispersed types <strong>of</strong> recreation use on large areas. Research Paper. SE-31. Asheville,<br />
NC: U.S. Department <strong>of</strong> Agriculture, Forest Service, Southeastern Forest Experiment<br />
Station. 15 p.<br />
James, G. A. (1971). Inventory<strong>in</strong>g recreation use. In proceed<strong>in</strong>gs from the forest recreation<br />
symposium, Syracuse, NY (78-95). Northeast Forest Experiment Station, Upper<br />
Darby, PA.<br />
Kauffman, M. J., & Courtemanch, A. (2009). Unpublished report. Wyom<strong>in</strong>g Cooperative<br />
Fish <strong>and</strong> Wildlife Research Unit. Laramie, WY: University <strong>of</strong> Wyom<strong>in</strong>g.<br />
Kovas, T. J. (1970). Self-adm<strong>in</strong>istered park visitor survey technique. Canadian Outdoor<br />
Recreation Study. Canada National <strong>Parks</strong> Service-Plann<strong>in</strong>g Department <strong>of</strong> Indian<br />
Affairs <strong>and</strong> Northern Development. 23 pp.<br />
Lai, P. C., Li, C. L., Chan, K. W., & Kwong, K. H. (2007). An Assessment <strong>of</strong> <strong>GPS</strong> <strong>and</strong><br />
GIS <strong>in</strong> Recreational Track<strong>in</strong>g. Journal <strong>of</strong> Park <strong>and</strong> Recreation Adm<strong>in</strong>istration, 25(1),<br />
128–139.
Lawson, S. (2006). Computer simulation as a tool for plann<strong>in</strong>g <strong>and</strong> management <strong>of</strong> visitor<br />
use <strong>in</strong> protected natural areas. Journal <strong>of</strong> Susta<strong>in</strong>able Tourism, 14(6), 600-617.<br />
Leatherberry, E. C., & Lime, D. W. (1981). Unstaffed trail registration compliance <strong>in</strong> a<br />
backcountry recreation area. Res. Paper NC-214. St. Paul, MN: North Central Forest<br />
Experiment Station, Forest Service, U.S. Department <strong>of</strong> Agriculture; 11 p.<br />
Leonard, R. E., Echelberger, H. E., Plumley, H. J., & Van Meter, L. W. (1980).<br />
Management guidel<strong>in</strong>es for monitor<strong>in</strong>g use on backcountry trails. Research Paper<br />
NE-286. Broomall, PA: Northeastern Forest Experiment Station, Forest Service, U.S.<br />
Department <strong>of</strong> Agriculture; 20 p.<br />
Ligtenberg, A., van Marwijk, R., Moelans, B., & Kuijpers, B. (2008). Recogniz<strong>in</strong>g<br />
patterns <strong>of</strong> movements <strong>in</strong> visitor flows <strong>in</strong> nature areas. In proceed<strong>in</strong>gs from the<br />
Fourth International Conference on Monitor<strong>in</strong>g <strong>and</strong> management <strong>of</strong> visitor flows <strong>in</strong><br />
recreational <strong>and</strong> protected areas, Montecat<strong>in</strong>i Terme, Italy.<br />
Mann<strong>in</strong>g, R. E. (1999). Studies <strong>in</strong> outdoor recreation: Search <strong>and</strong> research for satisfaction.<br />
Corvallis OR: Oregon State University Press.<br />
Monz, C. A., Cole, D. N., Marion, J. L., Leung, Y. F. (2010). Susta<strong>in</strong><strong>in</strong>g Visitor Use <strong>in</strong><br />
Protected Areas: Future Opportunities <strong>in</strong> Recreation Ecology Research <strong>Based</strong> on the<br />
USA Experience. Environmental Management, 45(3), 551-562.<br />
Muhar, A., Arnberger, A., & Br<strong>and</strong>enburg, C. (2002). Methods for visitor monitor<strong>in</strong>g <strong>in</strong><br />
recreational <strong>and</strong> protected areas: An overview. In proceed<strong>in</strong>gs from the Conference<br />
on Monitor<strong>in</strong>g <strong>and</strong> Management <strong>of</strong> <strong>Visitors</strong> Flows <strong>in</strong> Recreational <strong>and</strong> Protected<br />
Areas. Bodenkultur University, Vienna, Austria.<br />
National Park Service. (2009). Visitor Statistics [data file]. Available from: http://www.<br />
nature.nps.gov/stats/.<br />
Newsome, D., Moore, S. A., & Dowl<strong>in</strong>g, R. K. (2002). Natural area tourism: Ecology,<br />
impacts, <strong>and</strong> management. Clevedon: Channel View Publications.<br />
O’Connor, A., Zerger, A., & Itami, B. (2005). Geo-temporal track<strong>in</strong>g <strong>and</strong> analysis <strong>of</strong> tourist<br />
movement. Mathematics <strong>and</strong> Computers <strong>in</strong> Simulation, 69(1-2), 135–150.<br />
Park, L. O., Mann<strong>in</strong>g, R. E., Marion, J. L., Lawson, S. R., & Jacobi, C. (2008). Manag<strong>in</strong>g<br />
Visitor Impacts <strong>in</strong> <strong>Parks</strong>: A Multi-Method Study <strong>of</strong> the Effectiveness <strong>of</strong> Alternative<br />
Management Practices. Journal <strong>of</strong> Park <strong>and</strong> Recreation Adm<strong>in</strong>istration, 26(1), 97–<br />
121.<br />
Pettebone, D., Newman, P., Beaton, C., Stack, D., & Gibson, A. (2008). Estimat<strong>in</strong>g visitor<br />
use <strong>in</strong> Yosemite National Park. Report for Yosemite National Park. Fort Coll<strong>in</strong>s:<br />
Colorado State University, Center for Protected Areas Management <strong>and</strong> Tra<strong>in</strong><strong>in</strong>g.<br />
Pettebone, D. (2009). Quantify<strong>in</strong>g <strong>and</strong> model<strong>in</strong>g visitor use <strong>in</strong> Yosemite National Park<br />
<strong>and</strong> Rocky Mounta<strong>in</strong> National Park. Doctoral dissertation, Colorado State University,<br />
2009.<br />
Rupf, R., Koechli, D., Haider, W., Skov-Petersen, H., Probstl, U. (2010). Framework<br />
Mafre<strong>in</strong>a: Management toolkit for recreation <strong>and</strong> wildlife <strong>in</strong> the Swiss Alps. In<br />
proceed<strong>in</strong>gs from the Fifth International Conference on Monitor<strong>in</strong>g <strong>and</strong> Management<br />
<strong>of</strong> Visitor flows <strong>in</strong> Recreational <strong>and</strong> Protected Areas. Wagen<strong>in</strong>gen, The Netherl<strong>and</strong>s.<br />
Rutter, S. M. (2007). The <strong>in</strong>tegration <strong>of</strong> <strong>GPS</strong>, vegetation mapp<strong>in</strong>g <strong>and</strong> GIS <strong>in</strong> ecological<br />
<strong>and</strong> behavioral studies. Revista Brasileira de Zootecnia, 36, 63–70.<br />
Sawyer, H., Nielson, R. M., L<strong>in</strong>dzey, F., & McDonald, L. L. (2006). W<strong>in</strong>ter Habitat<br />
Selection <strong>of</strong> Mule Deer Before <strong>and</strong> Dur<strong>in</strong>g Development <strong>of</strong> a Natural Gas Field.<br />
Journal <strong>of</strong> Wildlife Management, 70(2), 396-403.<br />
Schaick, J., & van der Spek, S. (2008). Urbanism on track. Amsterdam, Netherl<strong>and</strong>s: Deft<br />
University Press.<br />
59
60<br />
Schreuder, H. T., Tyre, G. L. & James, G. A. (1975). Instant- <strong>and</strong> <strong>in</strong>terval-count sampl<strong>in</strong>g.<br />
Forest Science, 21(1), 40-45.<br />
Shoval, N., & Isaacson, M. (2007). Track<strong>in</strong>g tourists <strong>in</strong> the digital age. Annals <strong>of</strong> Tourism<br />
Research, 34(1), 141–159.<br />
Thorsell, J.W. (1967). Recreation use <strong>in</strong> Waterton Lake National Park. (Master’s Thesis,<br />
University <strong>of</strong> Western Ontario, 1967).<br />
Vaske, J. J., & Donnelly, M. P. (2007). Estimat<strong>in</strong>g visitor use at Boulder Open Space<br />
<strong>and</strong> Mounta<strong>in</strong> <strong>Parks</strong>: Summer 2004-2006 Comparisons. (HDNRU Report No. 79).<br />
Report for Boulder Open Space <strong>and</strong> Mounta<strong>in</strong> <strong>Parks</strong>. Fort Coll<strong>in</strong>s: Colorado State<br />
University, Human Dimensions <strong>in</strong> Natural Resources Unit.<br />
Wagar, J. A. (1969). Estimation <strong>of</strong> visitor use from self-registration at developed recreation<br />
sites. Research Paper INT-70. Ogden, UT: Intermounta<strong>in</strong> Forest <strong>and</strong> Range Experiment<br />
Station, Forest Service, U.S. Depart¬ment <strong>of</strong> Agriculture; 27 p.<br />
Watson, A. E., Cole, D. N., Turner, D. L., & Reynolds, P. S. (2000). Wilderness recreation<br />
use estimation: a h<strong>and</strong>book <strong>of</strong> methods <strong>and</strong> systems. USDA Forest Service General<br />
Technical Report RMRS-GTR-56. Rocky Mounta<strong>in</strong> Research Station.<br />
Wenger, Wiley D. Jr., & Gregerson, H. M. (1964). The effect <strong>of</strong> nonresponse on<br />
representativeness <strong>of</strong> wilderness-trail register <strong>in</strong>formation. Res. Pap. PNW-17.<br />
Portl<strong>and</strong>, OR: U.S. Department <strong>of</strong> Agriculture, Forest Service, Pacific Northwest<br />
Forest <strong>and</strong> Range Experiment Station. 20 p.