

Rowville-Rail-Study-Final-Stage-1-Report-FINAL
Rowville-Rail-Study-Final-Stage-1-Report-FINAL
Rowville-Rail-Study-Final-Stage-1-Report-FINAL

You also want an ePaper? Increase the reach of your titles
YUMPU automatically turns print PDFs into web optimized ePapers that Google loves.
<strong>Final</strong> <strong>Stage</strong> 1 Feasibility <strong>Report</strong><br />
Travel demand effects<br />
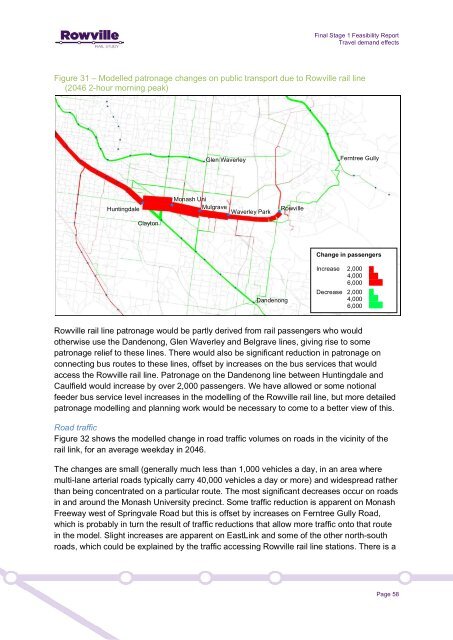
Figure 31 – Modelled patronage changes on public transport due to <strong>Rowville</strong> rail line<br />
(2046 2-hour morning peak)<br />
Huntingdale<br />
Clayton<br />
Glen Waverley<br />
Monash Uni<br />
Mulgrave<br />
Waverley Park<br />
Dandenong<br />
<strong>Rowville</strong><br />
Ferntree Gully<br />
Change in passengers<br />
Increase 2,000<br />
4,000<br />
6,000<br />
Decrease 2,000<br />
4,000<br />
6,000<br />
<strong>Rowville</strong> rail line patronage would be partly derived from rail passengers who would<br />
otherwise use the Dandenong, Glen Waverley and Belgrave lines, giving rise to some<br />
patronage relief to these lines. There would also be significant reduction in patronage on<br />
connecting bus routes to these lines, offset by increases on the bus services that would<br />
access the <strong>Rowville</strong> rail line. Patronage on the Dandenong line between Huntingdale and<br />
Caulfield would increase by over 2,000 passengers. We have allowed or some notional<br />
feeder bus service level increases in the modelling of the <strong>Rowville</strong> rail line, but more detailed<br />
patronage modelling and planning work would be necessary to come to a better view of this.<br />
Road traffic<br />
Figure 32 shows the modelled change in road traffic volumes on roads in the vicinity of the<br />
rail link, for an average weekday in 2046.<br />
The changes are small (generally much less than 1,000 vehicles a day, in an area where<br />
multi-lane arterial roads typically carry 40,000 vehicles a day or more) and widespread rather<br />
than being concentrated on a particular route. The most significant decreases occur on roads<br />
in and around the Monash University precinct. Some traffic reduction is apparent on Monash<br />
Freeway west of Springvale Road but this is offset by increases on Ferntree Gully Road,<br />
which is probably in turn the result of traffic reductions that allow more traffic onto that route<br />
in the model. Slight increases are apparent on EastLink and some of the other north-south<br />
roads, which could be explained by the traffic accessing <strong>Rowville</strong> rail line stations. There is a<br />
Page 58